Article

The Impact of Fractures on Shale Oil and Gas Enrichment and Mobility: A Case Study of the Qingshankou Formation in the Gulong Depression of the Songliao Basin, NE China

1
School of Geosciences, China University of Petroleum (East China), Qingdao 266580, China
2
Exploration and Development Research Institute, Daqing Oilfield Company Ltd., Daqing 163712, China
3
National Key Laboratory for Multi-Resource Collaborated Green Development of Continental Shale Oil, Daqing 163712, China
4
Research Institute of Petroleum Exploration & Development, Beijing 100083, China
*
Author to whom correspondence should be addressed.
Energies 2024, 17(17), 4517; https://doi.org/10.3390/en17174517
Submission received: 28 June 2024 / Revised: 2 September 2024 / Accepted: 4 September 2024 / Published: 9 September 2024

Abstract

To study the impact of faults on the enrichment and mobility of shale oil in the Gulong area, representative rock samples were selected in this paper. Based on geochemical data and chemical kinetics methods, coupled with shale oil enrichment and mobility analysis techniques, the shale oil generation quantity and in situ oil content were evaluated from the perspectives of shale oil generation and micro migration, and the mobility of shale oil was revealed. At the same time, the hydrocarbon expulsion efficiency (HEE) of shale was qualitatively and quantitatively characterized, combined with the development of faults. The research results indicate that the study area mainly develops organic-rich felsic (ORF)/organic-containing felsic (OCF) shale, their proportion in both wells exceeds 65%, and the resource amount is the largest in this type of lithofacies. The development of a fault controls the enrichment of shale oil, and the in situ oil content and oil saturation index (OSI) of the shale in well Y58, which is close to the fault, are significantly worse than those in well S2. Well Y58 has 9.52 mg/g and 424.83 mg/g TOC respectively, while well S2 has 11.34 mg/g and 488.73 mg/g TOC respectively. The fault enhanced the migration of shale oil, increasing the efficiency of oil expulsion. As a result, the components with weak polarity or small molecules, such as saturated hydrocarbons and low carbon number n-alkanes, are prone to migration, reducing the mobility of shale oil.

1. Introduction

China has achieved certain results in shale oil exploration and development and has established shale oil production areas such as Xinjiang Jimusar, Daqing Gulong, and Shengli Jiyang [1,2]. According to data from the National Energy Administration, China’s shale oil production exceeded 300 × 104 t in 2022. The enrichment and mobility of shale oil restrict its production [3,4,5], and there is a coupling relationship between the enrichment and mobility of shale oil [1,6]. However, previous research on shale oil enrichment and mobility often separated the two research subjects and directly evaluated either the oil content or the mobility of shale oil [7,8,9]. We can evaluate shale oil content through methods such as ∆logR and neural-network-based algorithms on well logging data, as well as conventional geochemical parameter combinations [9,10,11]. The mobility of shale oil is evaluated through shale oil/shale properties, as well as seepage, centrifugal/displacement nuclear magnetic resonance experiments, and so on [12,13]. The paper links the two and conducts Liuresearch from the perspective of shale oil generation and micro migration, which can further reveal the enrichment and mobility of shale oil.
Shale oil is crude oil that remains in the source rock after initial migration [14,15,16], so preservation conditions have a significant impact on the oil content of shale [17,18,19]. At the same time, due to the presence of chromatographic (fractionation) effects during the primary migration of crude oil [3,15,20,21,22,23], when the hydrocarbon generation condition is similar, the low molecular weight hydrocarbons and saturated hydrocarbon content are higher when the hydrocarbon expulsion efficiency (HEE) is low. Therefore, the preservation conditions will also affect the composition of shale oil, thereby affecting its mobility [14,21,22,24,25]. This paper qualitatively (by geochemical indicators) and quantitatively (by chemical kinetics) characterizes the efficiency of shale oil expulsion and establishes a relationship with fault development. Based on this, the impact of preservation conditions on shale oil content and shale oil properties can be determined, and the impact of faults on shale oil enrichment and mobility can be clarified. This is of great significance for revealing the mechanism of shale oil enrichment and mobility and selecting favorable target areas for shale oil exploration and development.

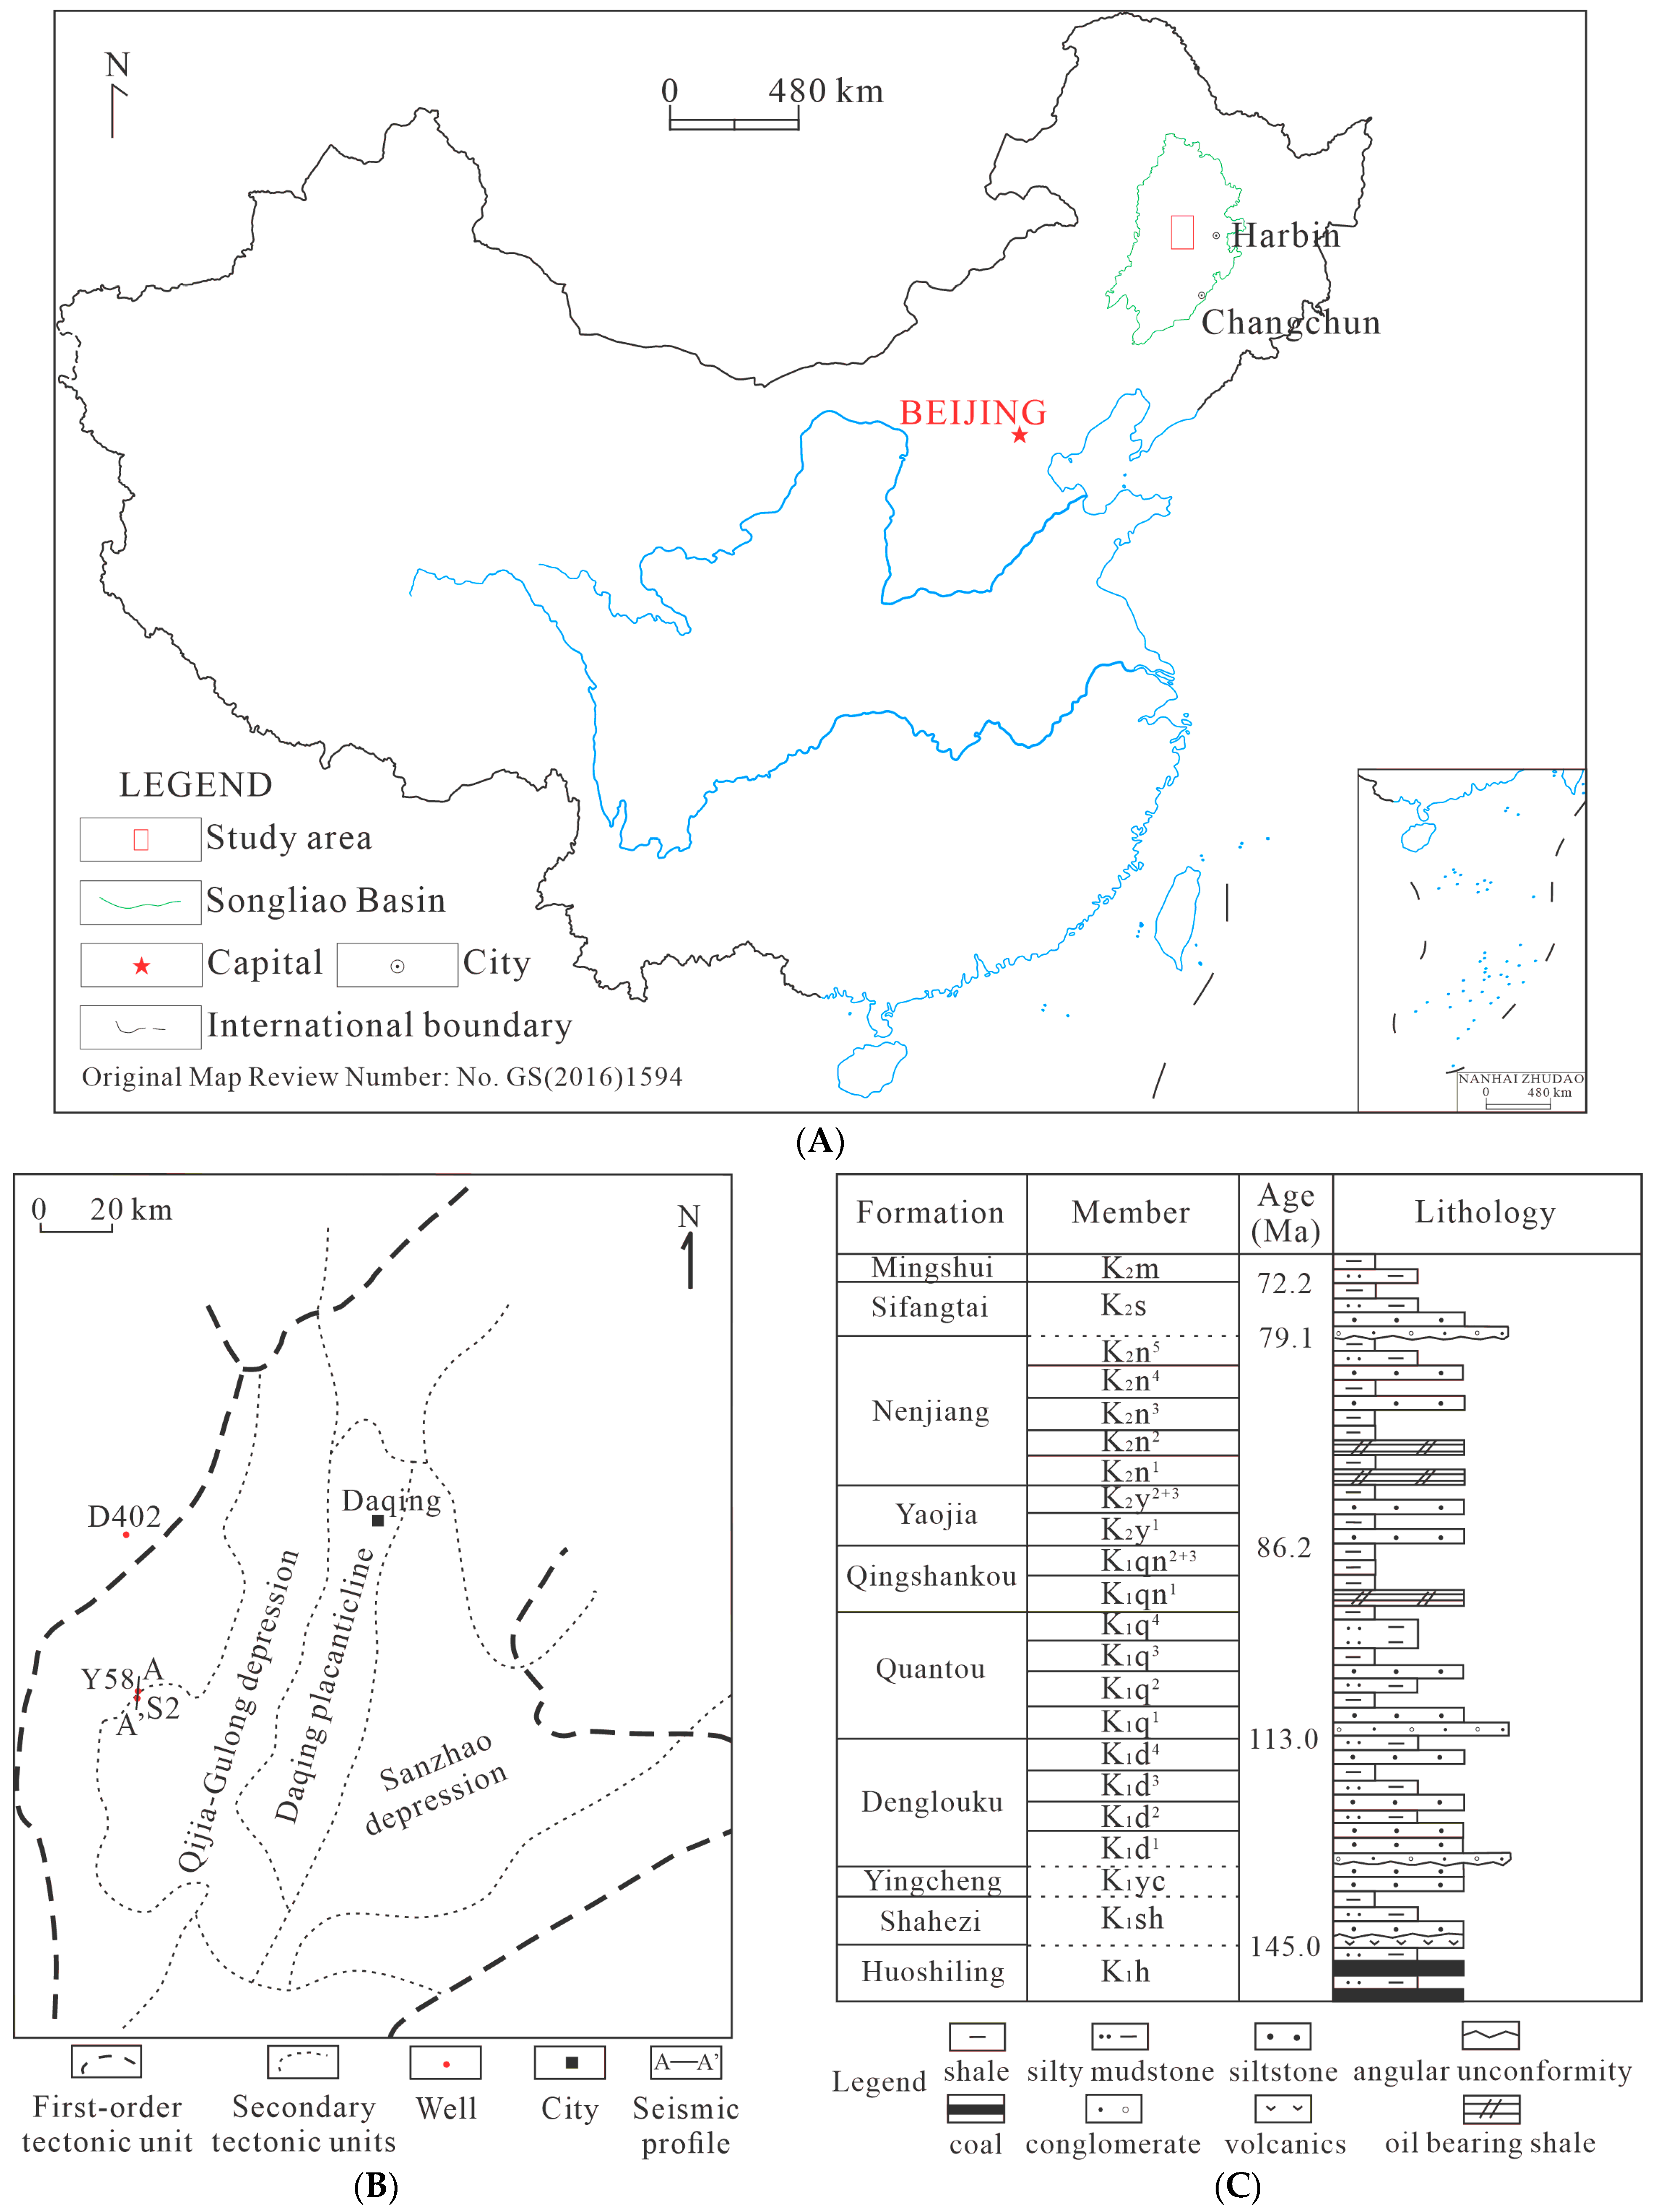
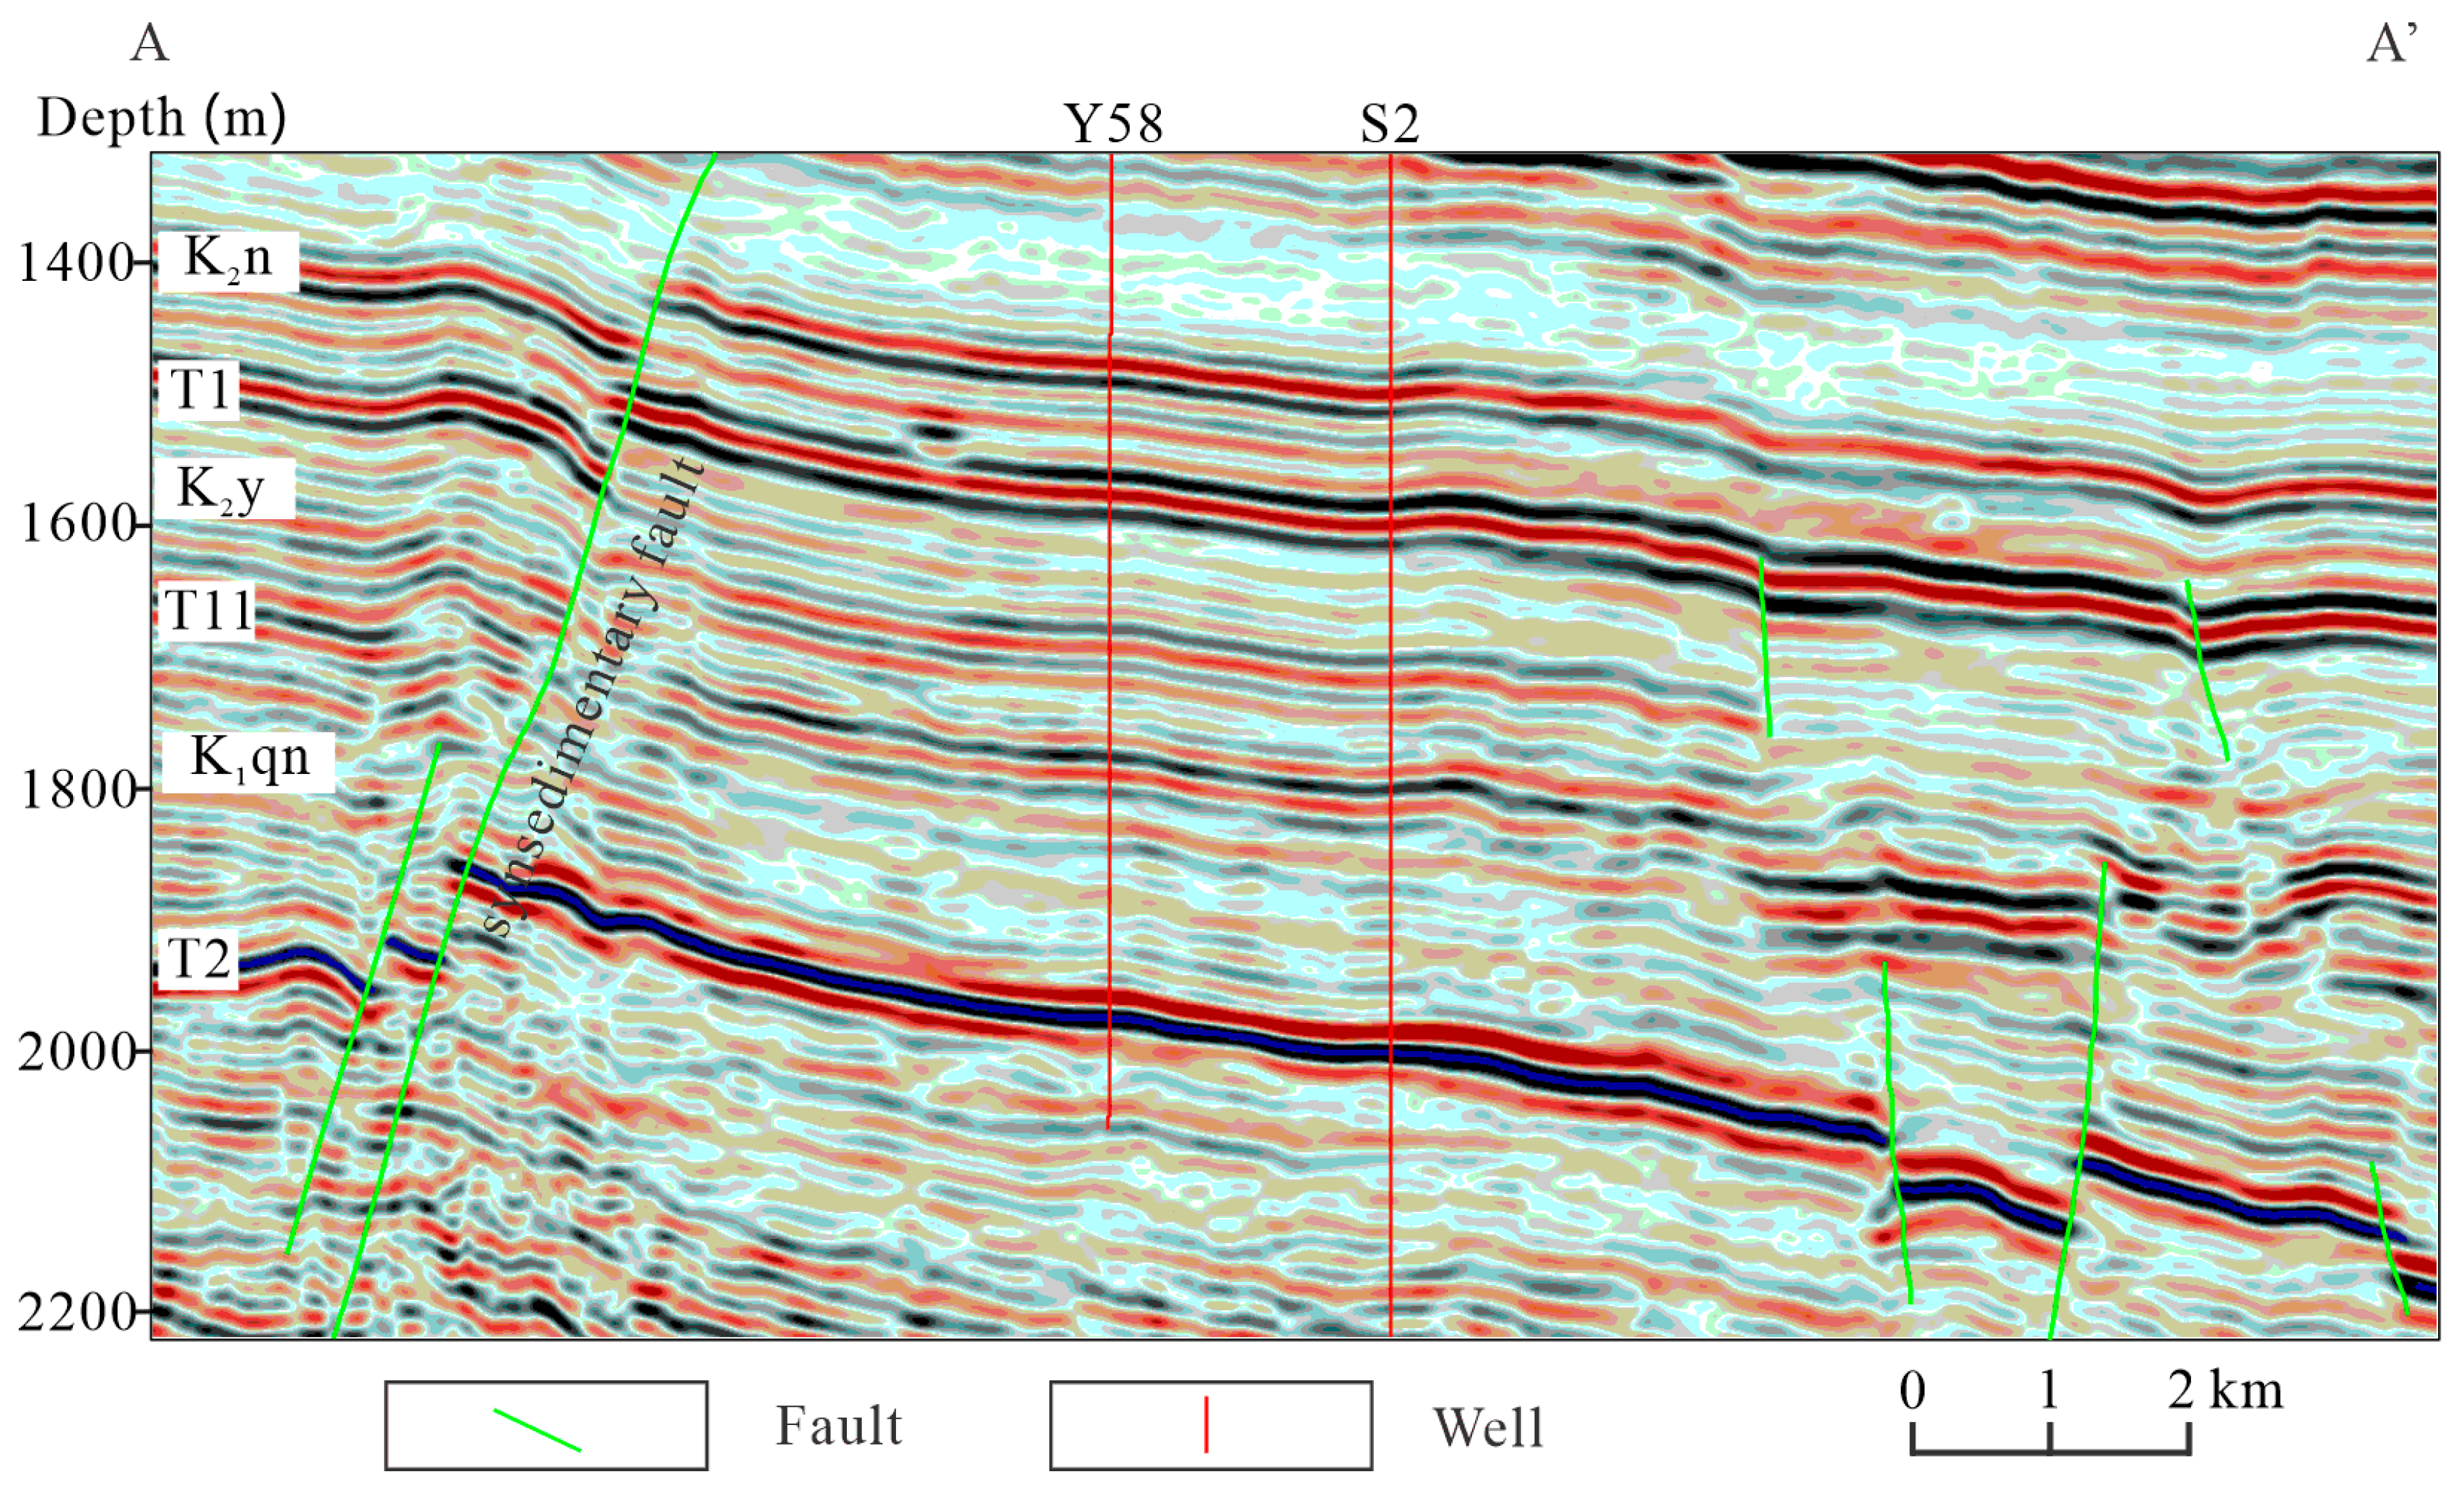
2. Geological Setting

The Songliao Basin (Figure 1A) can be divided into six first-order tectonic units: the southwest uplift area, the western slope area, the central depression area, the northern dip area, the southeast uplift area, and the northeast uplift area, from west to east. It is a large continental sedimentary basin mainly developed with Mesozoic strata [5,26]. The Qijia–Gulong Depression in the study area is located in the western part of the central depression of the basin (Figure 1B), bordering the Longhupao Da’an Terrace to the west and the Daqing Placanticline to the east. The Huoshiling Formation (K1h), Shahezi Formation (K1sh), Yingcheng Formation (K1yc), Denglouku Formation (K1d), Quantou Formation (K1q), Qingshankou Formation (K1qn), Yaojia Formation (K2y), Nenjiang Formation (K2n), Sifangtai Formation (K2s), and Mingshui Formation (K2m) are developed (Figure 1C) from bottom to top in the Qijia–Gulong Depression [27,28]. Among them, the Qingshankou Formation is a large-scale lacustrine sedimentary formation that has developed high-quality source rocks and is the main shale oil development layer [6,29,30]. The target layer of this study is the Qingshankou Formation. The thickness of the Qingshankou Formation is 300–500 m, mainly developing black to grayish black organic shale. From bottom to top, it can be further divided into the first member of the Qingshankou Formation (K1qn1), the second member of the Qingshankou Formation (K1qn2), and the third member of the Qingshankou Formation (K1qn3). K1qn1 and the lower part of K1qn2 can be further divided into nine oil layers from bottom to top, including the Q1–Q9 oil layers. K1qn1 is divided into the Q1–Q6 oil layers, and the lower part of K1qn2 comprises the Q7–Q9 oil layers [31,32,33].

3. Samples and Experiments

3.1. Samples Information

The experimental samples for this paper were taken from two key shale oil exploration wells, Y58 and S2, in the Gulong Depression. The samples mainly consist of shale from K1qn1, while also containing shale from K1qn2 and K1qn3. There are a total of 595 samples. The organic matter types of the shale in both wells are type I and type II1, and the maturity of the organic matter is similar (Ro is about 1.15%). The floor sealing is good, but well Y58 is closer to the left fault than well S2 (Figure 2). Therefore, it is suitable to conduct research on the impact of faults on shale oil enrichment and mobility. In this paper, we chose the fault on the left side of well Y58 because oil migrates towards higher structures in the formation. The left fault is a larger scale main fault developed in the upward dip direction of the formation, while the right fault of well S2 is smaller in the downward dip direction of the formation. Therefore, the main fault has a greater impact on shale oil enrichment and mobility.

3.2. Experiments

In response to the research issues, this paper conducted experiments related to pyrolysis, TOC, chloroform asphalt “A” and group component extraction, saturated hydrocarbon gas chromatography, and X-ray diffraction (XRD) bulk mineral analysis. The experiments were conducted in accordance with industry standards and are only briefly explained here.

3.2.1. Organic Carbon and Pyrolysis of Rocks

The samples need to be uniformly crushed into 100–120 mesh sizes (0.12–0.15 mm). The organic carbon analysis of rocks is carried out using a CS-230 analyzer (LECO, San Jose, CA, USA). Firstly, an appropriate amount of the sample is added to an excess of hydrochloric acid and dissolved at room temperature for 3 h to remove calcite. Then, the sample is heated to 70 °C and dissolved for 3 h to remove dolomite, washed with distilled water to neutralize it, and dried at 70 °C for 12 h. Take the dried sample for testing, and test each sample 3–5 times, taking the average value. In this paper, rock pyrolysis analysis was conducted using a Rock-Eval 6 source rock analyzer (Vinci Technologies, Nanterre, France). The sample was placed in a pyrolysis furnace and heated to 650 °C at a heating rate of 20 °C/min to obtain free hydrocarbon S1, cracked hydrocarbon S2, and maximum pyrolysis peak temperature Tmax. S1 was obtained by holding the temperature constant for 3 min at 300 °C [35]. This paper conducted organic carbon and rock pyrolysis experiments on 595 samples (well Y58 and well S2 are 386 and 209, respectively).

3.2.2. XRD Bulk Mineral Analysis

The 277 shale samples (216 from well Y58 and 61 from well S2) were crushed to 200 mesh (0.074 mm) and sliced. The Bruker JV-DX XRD analyzer (Bruker, Billerica, MA, USA) was used to scan the shale samples. The scanning range was 3–45 °. The types of shale mineral composition and the relative content of each mineral were analyzed. The experimental process refers to industry standard SY/T 5163-2018 [36].

3.2.3. Chloroform Asphalt “A” and Its Group Components

A total of 57 shale samples (37 from well Y58 and 20 from well S2) were crushed into 100–120 mesh (0.12–0.15 mm) and a YS fully automatic multifunctional extractor used for asphalt extraction. The solvent was chloroform, and the extraction lasted for 8 h; the experimental process refers to industry standard SY/T 5118-2021 [37]. Asphaltene was separated from chloroform asphalt “A” obtained by extraction, and the solution was separated after removing the asphaltene using column chromatography to obtain saturated hydrocarbons, aromatic hydrocarbons, and non-hydrocarbons, and to determine the content of each component.

3.2.4. Saturated Hydrocarbon Gas Chromatography

Before experimental analysis, 37 samples (30 from well Y58 and 7 from well S2) were crushed into 100 mesh (0.15 mm), and soluble organic matter was extracted using the Soxhlet extraction method. Gas chromatography analysis of the saturated hydrocarbons was carried out using the HP6890 chromatograph (Agilent, Santa Clara, CA, USA). The carrier gas was 99.999% helium gas, with a carrier gas velocity of 1 mL/min, and the temperature was maintained at 50 °C for 1 min. Then, the temperature was raised at a rate of 20 °C/min to 120 °C, and then at a rate of 3 °C/min to 310 °C and stabilized for 23 min to obtain the carbon number distribution and component content of the saturated hydrocarbons.

4. Results

The experimental data are listed in Supplementary Materials section. The organic carbon, rock pyrolysis, and chloroform asphalt “A” data are listed in Table S1. The mineral composition characteristics of shale are listed in Table S2. The characteristics of shale oil biomarkers are listed in Table S3. Compared with marine shale in North America, the discontinuous sedimentation, rapid changes in lithofacies, and strong heterogeneity of continental shale in China greatly restrict the exploration and development of shale oil [16,25,27,38,39]. Therefore, it is necessary to characterize shale with different lithofacies characteristics in order to provide reference for later shale oil exploration and development work.

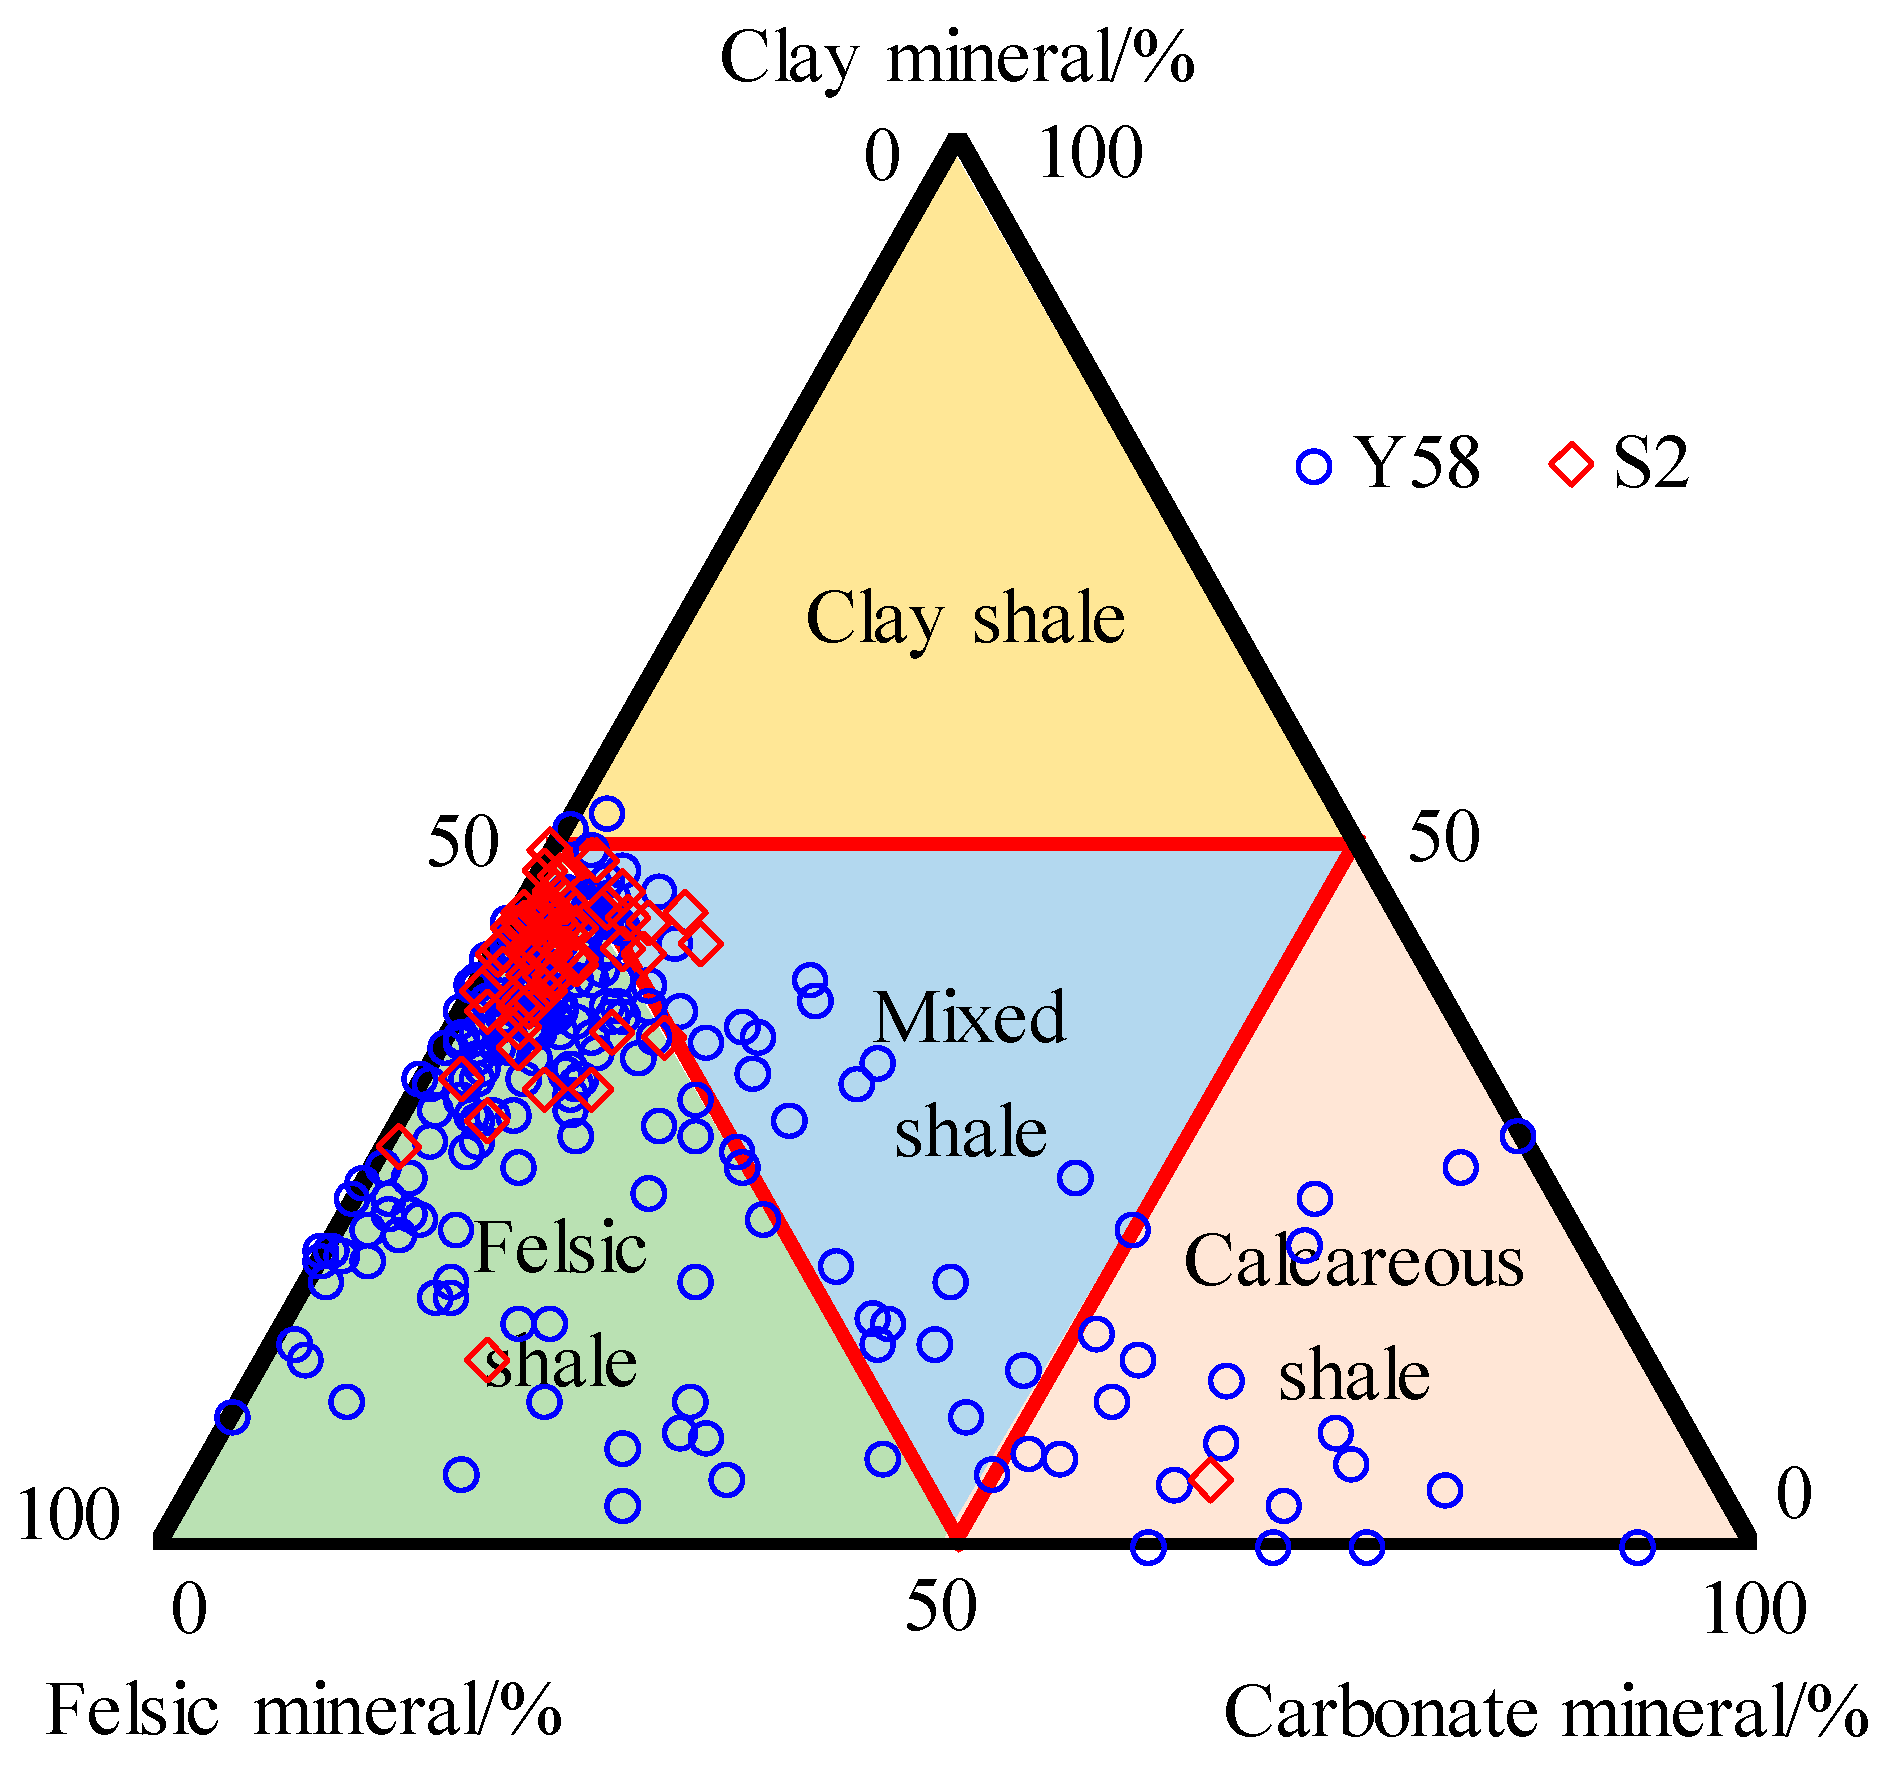
4.1. Mineral Composition Characteristics

Based on the XRD bulk mineral analysis experiment, the mineral composition types and respective contents in shale can be determined. Inorganic minerals are organized into three major categories, namely felsic minerals (quartz and feldspar), clay minerals, and carbonate minerals (calcite and dolomite). After normalization, the relative content of the three types of minerals can be obtained. Based on this, shale lithofacies can be divided into four types: felsic shale (felsic mineral content >50%), clay shale (clay mineral content >50%), calcareous shale (carbonate mineral content >50%), and mixed shale (contents of all three types of minerals are less than 50%).
Based on the above lithofacies classification scheme, the lithofacies of 277 shale samples (216 from well Y58 and 61 from well S2) were divided into four types (Figure 3). In the shale of the study area, felsic minerals are the most developed, followed by clay minerals that are well developed, and carbonate minerals that are less developed. As a result, the research area mainly develops felsic shale, with the proportion of felsic shale developed in well Y58 and well S2 reaching 72.7% and 82.0%, respectively. Calcareous shale and mixed shale are relatively less developed, with mixed shale having a similar development scale in the two wells, with well Y58 and well S2 accounting for about 17.1% and 16.4%, respectively. Although clay minerals are relatively developed, their content in shale is usually not the highest, so clay shale is the least developed.

4.2. Characteristics of Organic Matter Content

The organic matter in shale is the material basis for oil and gas generation, and the abundance of organic matter reflects its ability to generate hydrocarbons. Therefore, to a certain extent, its abundance determines the oil content in shale and can also affect the development of organic matter pores. Therefore, when studying shale oil, it is necessary to consider its organic matter abundance when dividing shale lithofacies. The commonly used indicators for evaluating organic matter abundance include TOC, chloroform asphalt “A”, total hydrocarbons, and hydrocarbon generation potential (S1 and S2). The parameters that can directly reflect the oil content of shale mainly include pyrolysis S1 and chloroform asphalt “A”. When dividing the standards for organic matter content in this article, the relationship between S1 and TOC was comprehensively considered, and the inflection point on the graph of their relationship (Figure 4) was taken as the critical point (TOC = 1 wt. %, S1 = 1.4 mg/g; TOC = 2 wt. %, S1 = 4.4 mg/g). The abundance of organic matter was divided into rich organic matter (TOC > 2 wt. %), containing organic matter (TOC = 1–2 wt. %), and poor organic matter (TOC < 1 wt. %).
Based on this, shale lithofacies can be divided into organic-rich shale, organic-containing shale, and organic-poor shale. It can be seen that the organic matter abundance of shale in the study area is relatively high, with the main development being organic-rich shale. Well Y58 and well S2 have developed about 54.04% and 43.13%, respectively. Organic-containing shale is also well developed, with both wells developing around 40%. The organic-poor shale is relatively underdeveloped, with only 6.06% in well Y58 and slightly higher in well S2, at approximately 14.69%. Both wells mainly develop organic-rich shale and organic-containing shale. The development scale of organic-rich shale in well Y58 is slightly larger than that of organic-containing shale, while the development scale of organic-rich shale and organic-containing shale in well S2 is relatively small.

4.3. Shale Lithofacies Classification

The mineral composition largely determines the physical properties of the reservoir, thereby affecting the enrichment and mobility of shale oil. Shale is both a source rock and a reservoir rock, and organic matter is the basis for hydrocarbon generation. At the same time, it can also form organic matter pores in shale, forming a storage space. Therefore, this article comprehensively considers the mineral composition and organic matter content characteristics of shale, and it adopts the naming method of shale organic matter content characteristics (rich, containing, and poor organic matter) and mineral composition characteristics (felsic, clay, calcareous, and mixed matter) for lithofacies classification. Shale lithofacies can be divided into 12 types.
The results of lithofacies classification show that there are 10 types of shale developed in the study area (Figure 5A,B), with organic-rich felsic (ORF) and organic-containing felsic (OCF) shale having the largest development scale, while organic-rich/containing/poor clay shale are basically not developed. Well Y58 has developed large-scale ORF shale, accounting for about 40.8% (Figure 6), followed by OCF shale, accounting for about 28.5%. On the contrary, the largest development scale of well S2 is OCF shale, accounting for 52.5%, while ORF shale only accounts for 26.2%. In addition, the development scale of shale in other lithofacies types in the two wells is relatively small. The scale of organic-rich mixed (ORM) shale and organic-poor felsic (OPF) shale developed in well Y58 is equivalent, both of which are 8.5%, and the proportion of the other six types of shale is below 5%. Except for ORF and OCF shale, well S2 only develops ORM shale, OPF shale, organic containing mixed (OCM) shale, and organic containing calcareous (OCC) shale, and the development scale is relatively small.

5. Discussions

Based on the above experimental data, this paper evaluated the shale oil generation quantity, oil content, and hydrocarbon expulsion efficiency. At the same time, the influence of fractures on shale oil enrichment and mobility was revealed by combining shale oil group components and molecular composition.

5.1. Evaluation of Shale Oil Generation and Expulsion Quantity

This paper used chemical kinetics methods to evaluate the oil generation quantity of shale. At the same time, the in situ oil content of shale was evaluated by correcting and restoring the light and heavy hydrocarbons of pyrolysis S1, thereby quantitatively characterizing the oil content of shale. Based on this quantitative characterization of shale oil expulsion efficiency, combined with fault development, its impact on shale oil enrichment was explored [40].

5.1.1. Oil Generation Quantity Evaluation

The evaluation of oil generation adopts a parallel first-order reaction model [41]. Based on the PY-GC and Rock-Eval experimental data, it is possible to optimize and obtain the organic matter hydrocarbon generation reaction fraction, pre-exponential factor, and activation energy parameters to ensure that the calculated hydrocarbon generation conversion rate matches the experimental values as much as possible (Figure 7A,B).
By combining the optimized chemical kinetic parameters of organic matter hydrocarbon generation with the burial and thermal history of the study area, the hydrocarbon generation conversion rates at different burial depths were obtained and the organic matter hydrocarbon generation profile of the target layer in the study area was further obtained (Figure 8). According to the thermal simulation of type I organic matter in the Qingshankou Formation, the gas-to-liquid hydrocarbon generation quantity ratio was 1:4, and the conversion rates of organic matter gas generation and oil generation were determined to be 20% and 80% of the hydrocarbon generation conversion rates, respectively [42].
The process of hydrocarbon generation and expulsion can lead to a decrease in hydrocarbon generation potential and organic matter abundance. Therefore, when evaluating shale hydrocarbon generation, it is necessary to restore the organic matter abundance and hydrocarbon generation potential. By utilizing the TOC, the hydrogen index (IH), the hydrocarbon index (IHC), and the residual oil quantity B obtained from light and heavy hydrocarbon recovery of S1 (see Section 5.1.2 below for specific methods), as well as the amount of primary asphalt B0 in the source rock calculated from statistical immature samples, combined with the oil generation conversion rate (Xo) and the gas generation conversion rate (Xg) obtained through chemical kinetics methods above, the original hydrocarbon generation potential ( I H 0 ) of the sample can be calculated using Formula (1) [41].
I H 0 = I H + I H · X o + B 0 B + I H · X g
Meanwhile, the original organic carbon (TOC0) can be obtained through Formula (2) [41].
T O C 0 = m c + m c · Δ I H · K / 1000 / m r = T O C 1 + Δ I H · K / 1000
K is the coefficient of converting organic matter in the product into organic carbon (usually taken as 0.84), dimensionless.
  • Mr represents the current mass of a certain volume of source rock, kg.
  • mc is the mass of the corresponding organic carbon, kg.
  • ΔIH represents the recovery amount of hydrocarbon generation potential, mg/g TOC.
    Q o = T O C 0 × I H 0 × K 1 × K 2
  • Qo is the oil generation quantity, mg/g.
  • K1 is the proportion of organic matter oil generation, %.
  • K2 is the organic matter oil generation conversion rate, %.
Based on Formula (3), by combining the recovered I H 0 and TOC0, as well as the organic matter oil generation conversion rate, the shale oil generation quantity can be calculated. In Figure 9A,B, the evaluation results of shale oil generation quantity in wells Y58 and S2 are presented. As the burial depth increases, the oil generation quantity from shale increases. The oil generation quantity of well Y58 is higher than that of well S2, with an average generation quantity of 1367.18 mg/g·TOC. The average oil generation quantity of well S2 is 1250.16 mg/g·TOC.

5.1.2. Oil Content Evaluation

Pyrolysis S1 is a commonly used indicator for evaluating oil content. Due to the influence of sample placement time and environment, the light hydrocarbon components and some heavy hydrocarbons is missing as well as the evaporation of some heavy hydrocarbons in S1 after 300 °C during the pyrolysis process, and the proportion of light hydrocarbon components in crude oil is relatively high (Figure 10A,B). Therefore, in order to accurately evaluate the oil content of shale, it is necessary to perform light and heavy hydrocarbon recovery correction on S1.
By establishing the relationship between the total hydrocarbons in chloroform asphalt “A” and S1 (Figure 11A,B), combined with S1, the C13+ hydrocarbon content can be obtained, which means heavy hydrocarbon recovery has been performed on S1.
The C6–13/C13+ ratio obtained by analyzing the total hydrocarbon gas chromatography of crude oil (Figure 10) can be used to obtain the amount of volatile C6–13 on the basis of heavy hydrocarbon compensation correction, thus completing the light hydrocarbon compensation correction of S1.
The data obtained after compensating for light and heavy hydrocarbons in S1 represent the in-situ oil content of shale (Qin-situ), indicating a significant difference in shale oil content before and after the recovery of light and heavy hydrocarbons in S1 (Figure 9); the difference between the two increases as the depth of the formation increases. Before and after recovery, the average oil content of shale in well Y58 was 103.89 mg/g·TOC and 424.83 mg/g·TOC, respectively. The average oil content of shale in well S2 was 82.87 mg/g·TOC and 488.73 mg/g·TOC, respectively.
Based on the petrographic classification results, it was found that both well Y58 and well S2 have the best in situ oil content of ORM shale (Figure 12A,B), with an average in situ oil content of 13.28 mg/g and 17.35 mg/g, respectively. Secondly, the developed ORF shale shows a larger scale, with an average in situ oil content of 10.26 mg/g and 13.88 mg/g, respectively. Moreover, due to the close distance between well Y58 and the fault, compared to the same shale lithofacies, its in situ oil content is worse than that of well S2. Although the in situ oil content of shale in various lithofacies is generally good, there is a significant difference in the proportion of total oil content and resource contribution due to significant differences in the development scales of different types of shale. The resources of ORF shale and OCF shale with large development scales contribute significantly, with well Y58 accounting for 47.72% and 28.75% respectively, and well S2 accounting for 32.37% and 43.29% respectively. Except for the ORM shale, which contributed 12.82% and 20.23%, respectively, in the two wells, other types of shale have contributed less than 5% of the resource due to their small development scale.

5.1.3. Hydrocarbon Expulsion Efficiency (HEE)

According to the material balance principle of “residual oil quantity = oil generation quantity − oil expulsion quantity”, the shale oil expulsion quantity can be calculated, and the HEE = oil expulsion quantity/oil generation quantity. Therefore, the HEE of the shale in well Y58 and well S2 can be calculated (Figure 9). Well Y58 is close to the fault and has a greater impact than well S2. It has a stronger migration effect and a larger oil expulsion quantity, resulting in an overall HEE of 65%, which is 7% higher than well S2.
Comparing the HEE of different types of shale, it was found that the ORF shale with the largest development scale in well Y58 has the highest HEE, approximately 75% (Figure 13). The larger developed OCF shale has a lower HEE of about 40%. The OCM shale has the lowest HEE, only 29%. Similarly, well S2 is also the largest developed OCF shale with the highest HEE (67%), and the larger developed ORF shale also has a higher HEE, approximately 61%.

5.2. The Impact of Fractures on Shale Oil Mobility

In addition to affecting the enrichment of shale oil, fractures also affect the mobility of shale oil. Therefore, this article uses shale oil group composition, carbon number distribution, and molecular composition to finely characterize shale oil composition and characterize the strength of migration, and combined with the development of faults, reveals the impact of faults on shale oil mobility.

5.2.1. Shale Oil Group Components

The differences in physical properties of each component in crude oil result in a chromatographic effect during migration, causing changes in the relative content of each component [43]. The ratio of saturated hydrocarbons to aromatic hydrocarbons reflects the relative content of saturated hydrocarbons and aromatic hydrocarbons. During the migration process, saturated hydrocarbons with low polarity are easier to migrate than aromatic hydrocarbons, and the saturation to aromatics ratio decreases. Well Y58, which is close to the fault, has a lower saturation to aromaticity ratio compared to well S2, with an average saturation to aromaticity ratio of 4.87 and 5.44, respectively (Figure 14A,B), and has poorer oil content compared to well S2. This indicates that well Y58 is more affected by fractures than well S2, and the migration of shale oil is more significant, resulting in higher HEE, resulting in more loss of non-polar saturated hydrocarbon components and weakened shale oil mobility. Comparing the saturated hydrocarbon/aromatic hydrocarbon content of the most developed ORF shale and OCF shale in the two wells, it can also be seen that the saturated hydrocarbon/aromatic hydrocarbon content of the two shale types in well Y58 is lower than that in well S2.

5.2.2. Molecular Composition

In the process of shale oil migration, as the migration effect increases, low carbon components will preferentially migrate and be discharged, thereby reducing the mobility of in situ shale oil. Saturated hydrocarbon gas chromatography analysis can obtain the carbon number composition and content of saturated hydrocarbons in shale oil. The results show that the average carbon number of saturated hydrocarbons in well Y58 is higher than that in well S2, with values of 22.97 and 19.84, respectively (Figure 14), and the ΣC21−/ΣC22+ and (C21 + C22)/(C28 + C29) ratios are both smaller than those of well S2, with values of 0.81 and 1.97, 2.29 and 6.96, respectively. This indicates that well Y58, which is close to the fault, has a stronger migration effect and a greater loss of low carbon and light components in shale oil. Therefore, the average carbon number of saturated hydrocarbons in shale oil in the ORF/OCF shale, which has the largest development scale, is higher than that in well S2. Analyzing the C6–13 and C13+ contents in the total hydrocarbon gas chromatography data of crude oil (Figure 10), it can also be found that the light hydrocarbon content of shale oil in well S2 is higher than that in well Y58.
Normal alkane molecules have a smaller volume compared to isomeric alkane molecules and are easier to migrate [44]. When the migration effect becomes stronger, that is, the HEE increases, the Ph/nC18 ratio increases. The average ratio of Ph/nC18 in well Y58 and well S2 was 0.15 and 0.11, respectively (Figure 14). The Ph/nC18 ratio in the large-scale development of ORF/OCF shale is also higher in well Y58 compared to well S2, reflecting the strong migration of shale oil in well Y58 near the fault, resulting in more loss of normal alkanes and poorer mobility of shale oil.

5.3. Inspiration

(1)
In the process of shale oil exploration and development, the impact of faults on HEE should be considered, which can lead to a decrease in shale oil content and shale oil mobility. Therefore, the target well location should not be too close to the fault.
(2)
There is a coupling relationship between shale oil content and shale oil mobility. Reservoirs with good preservation conditions have high oil content and good shale oil mobility.

6. Conclusions

(1)
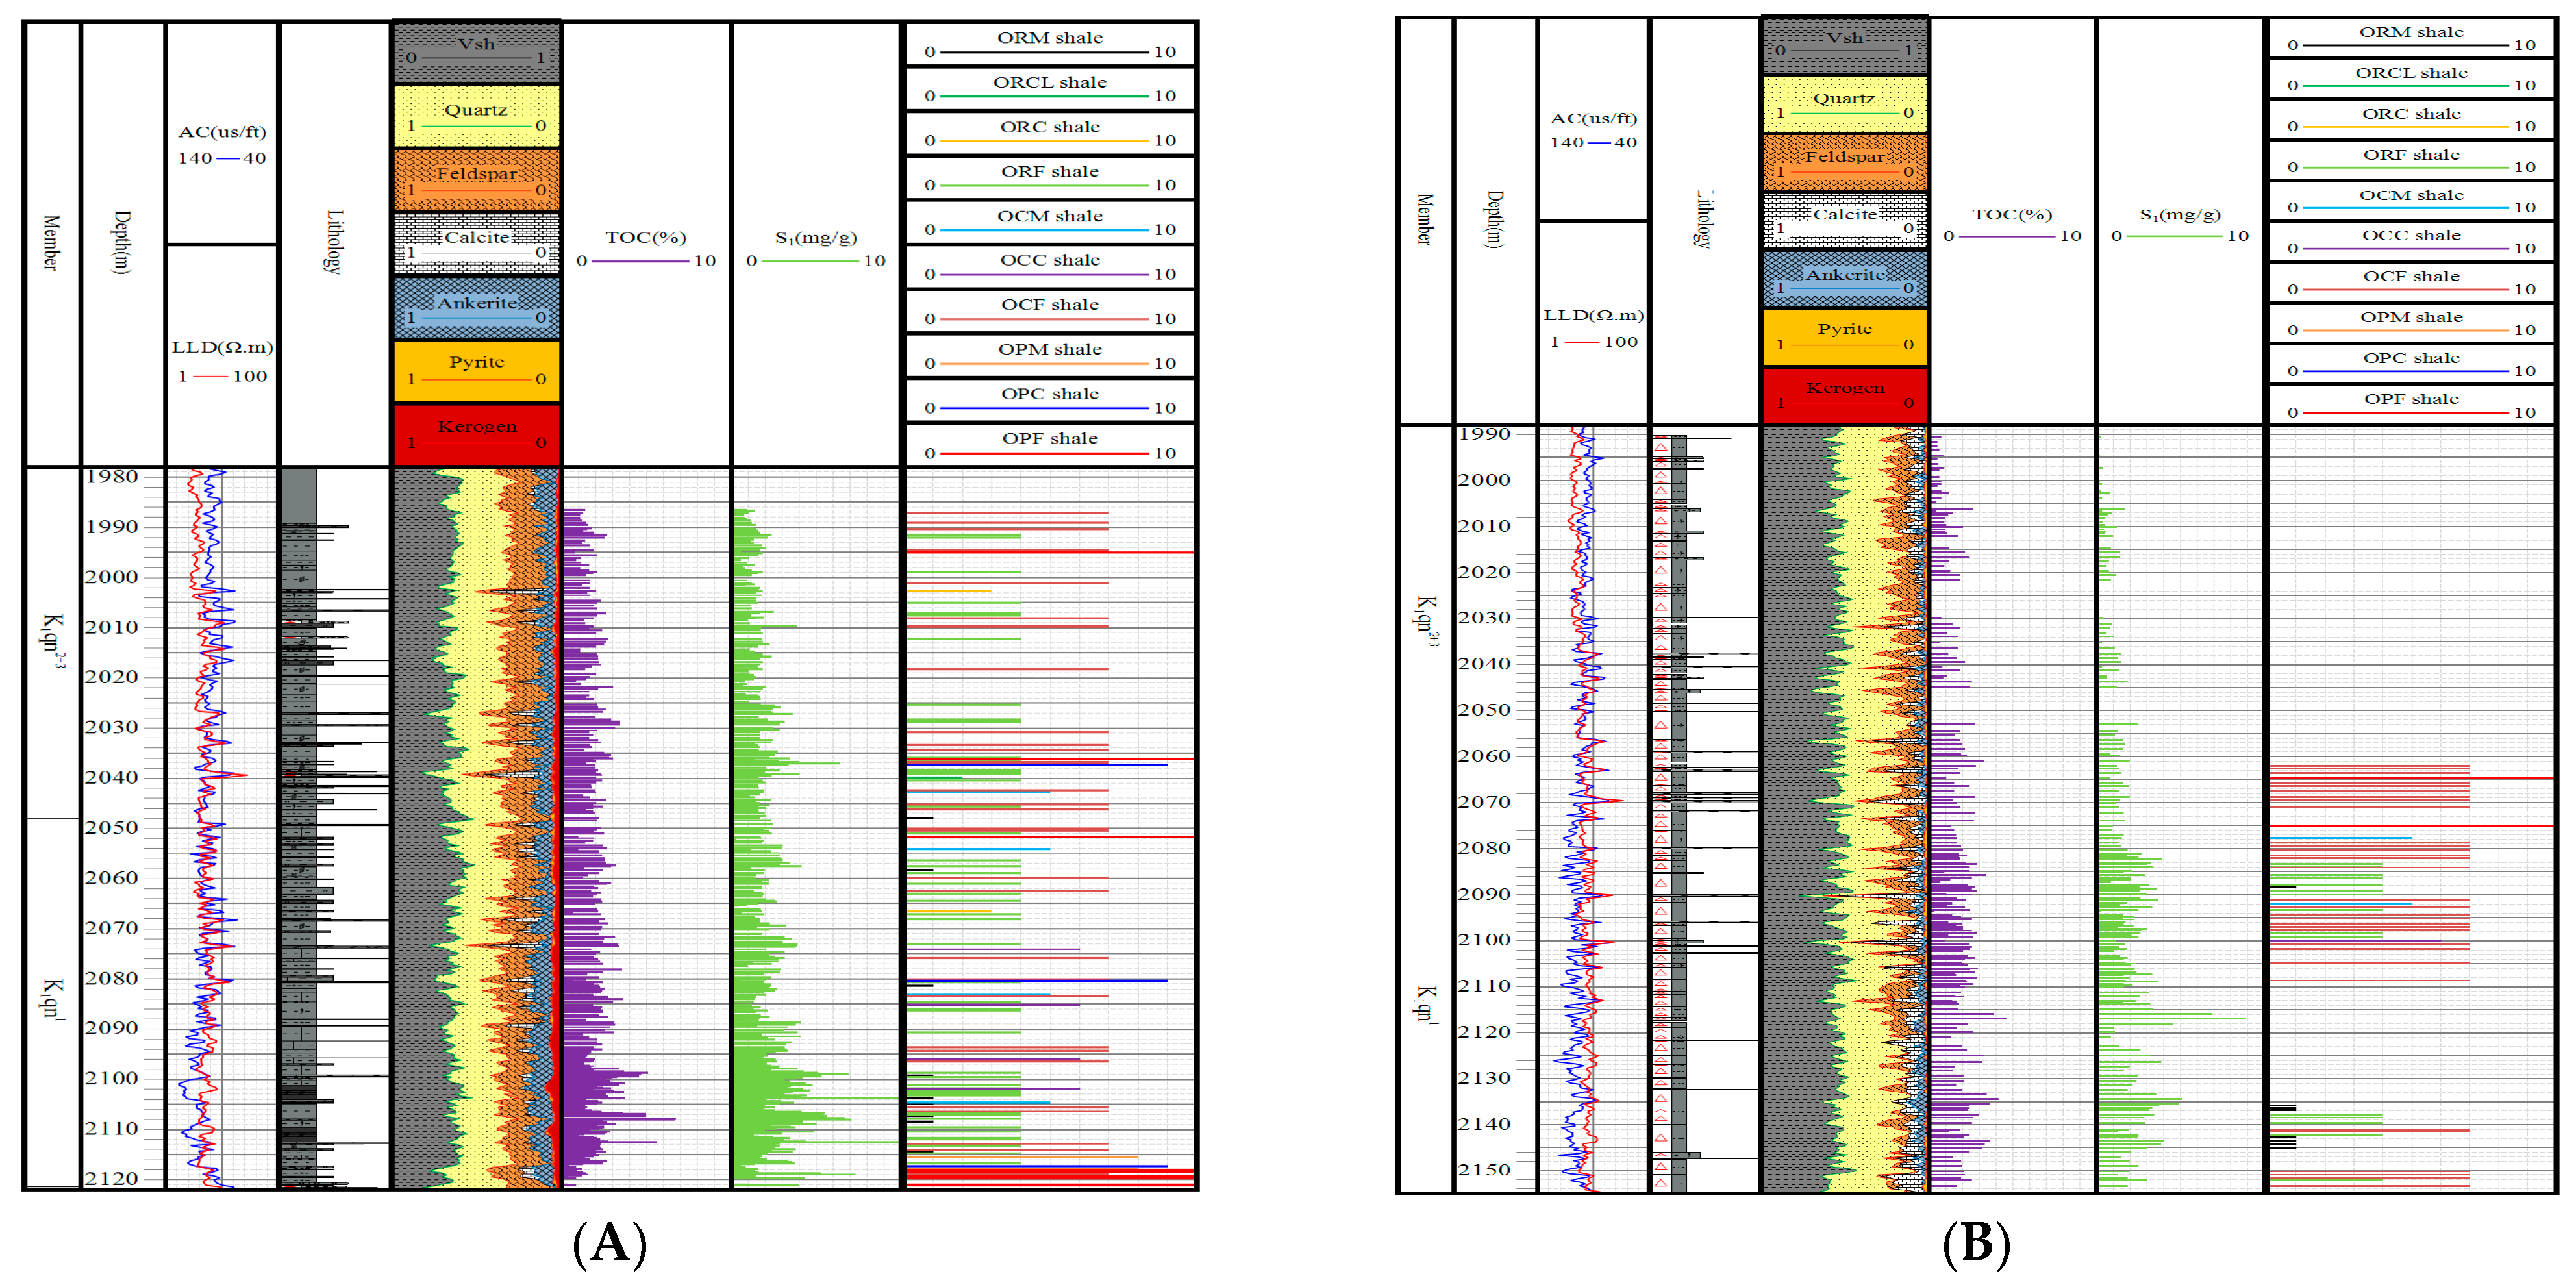
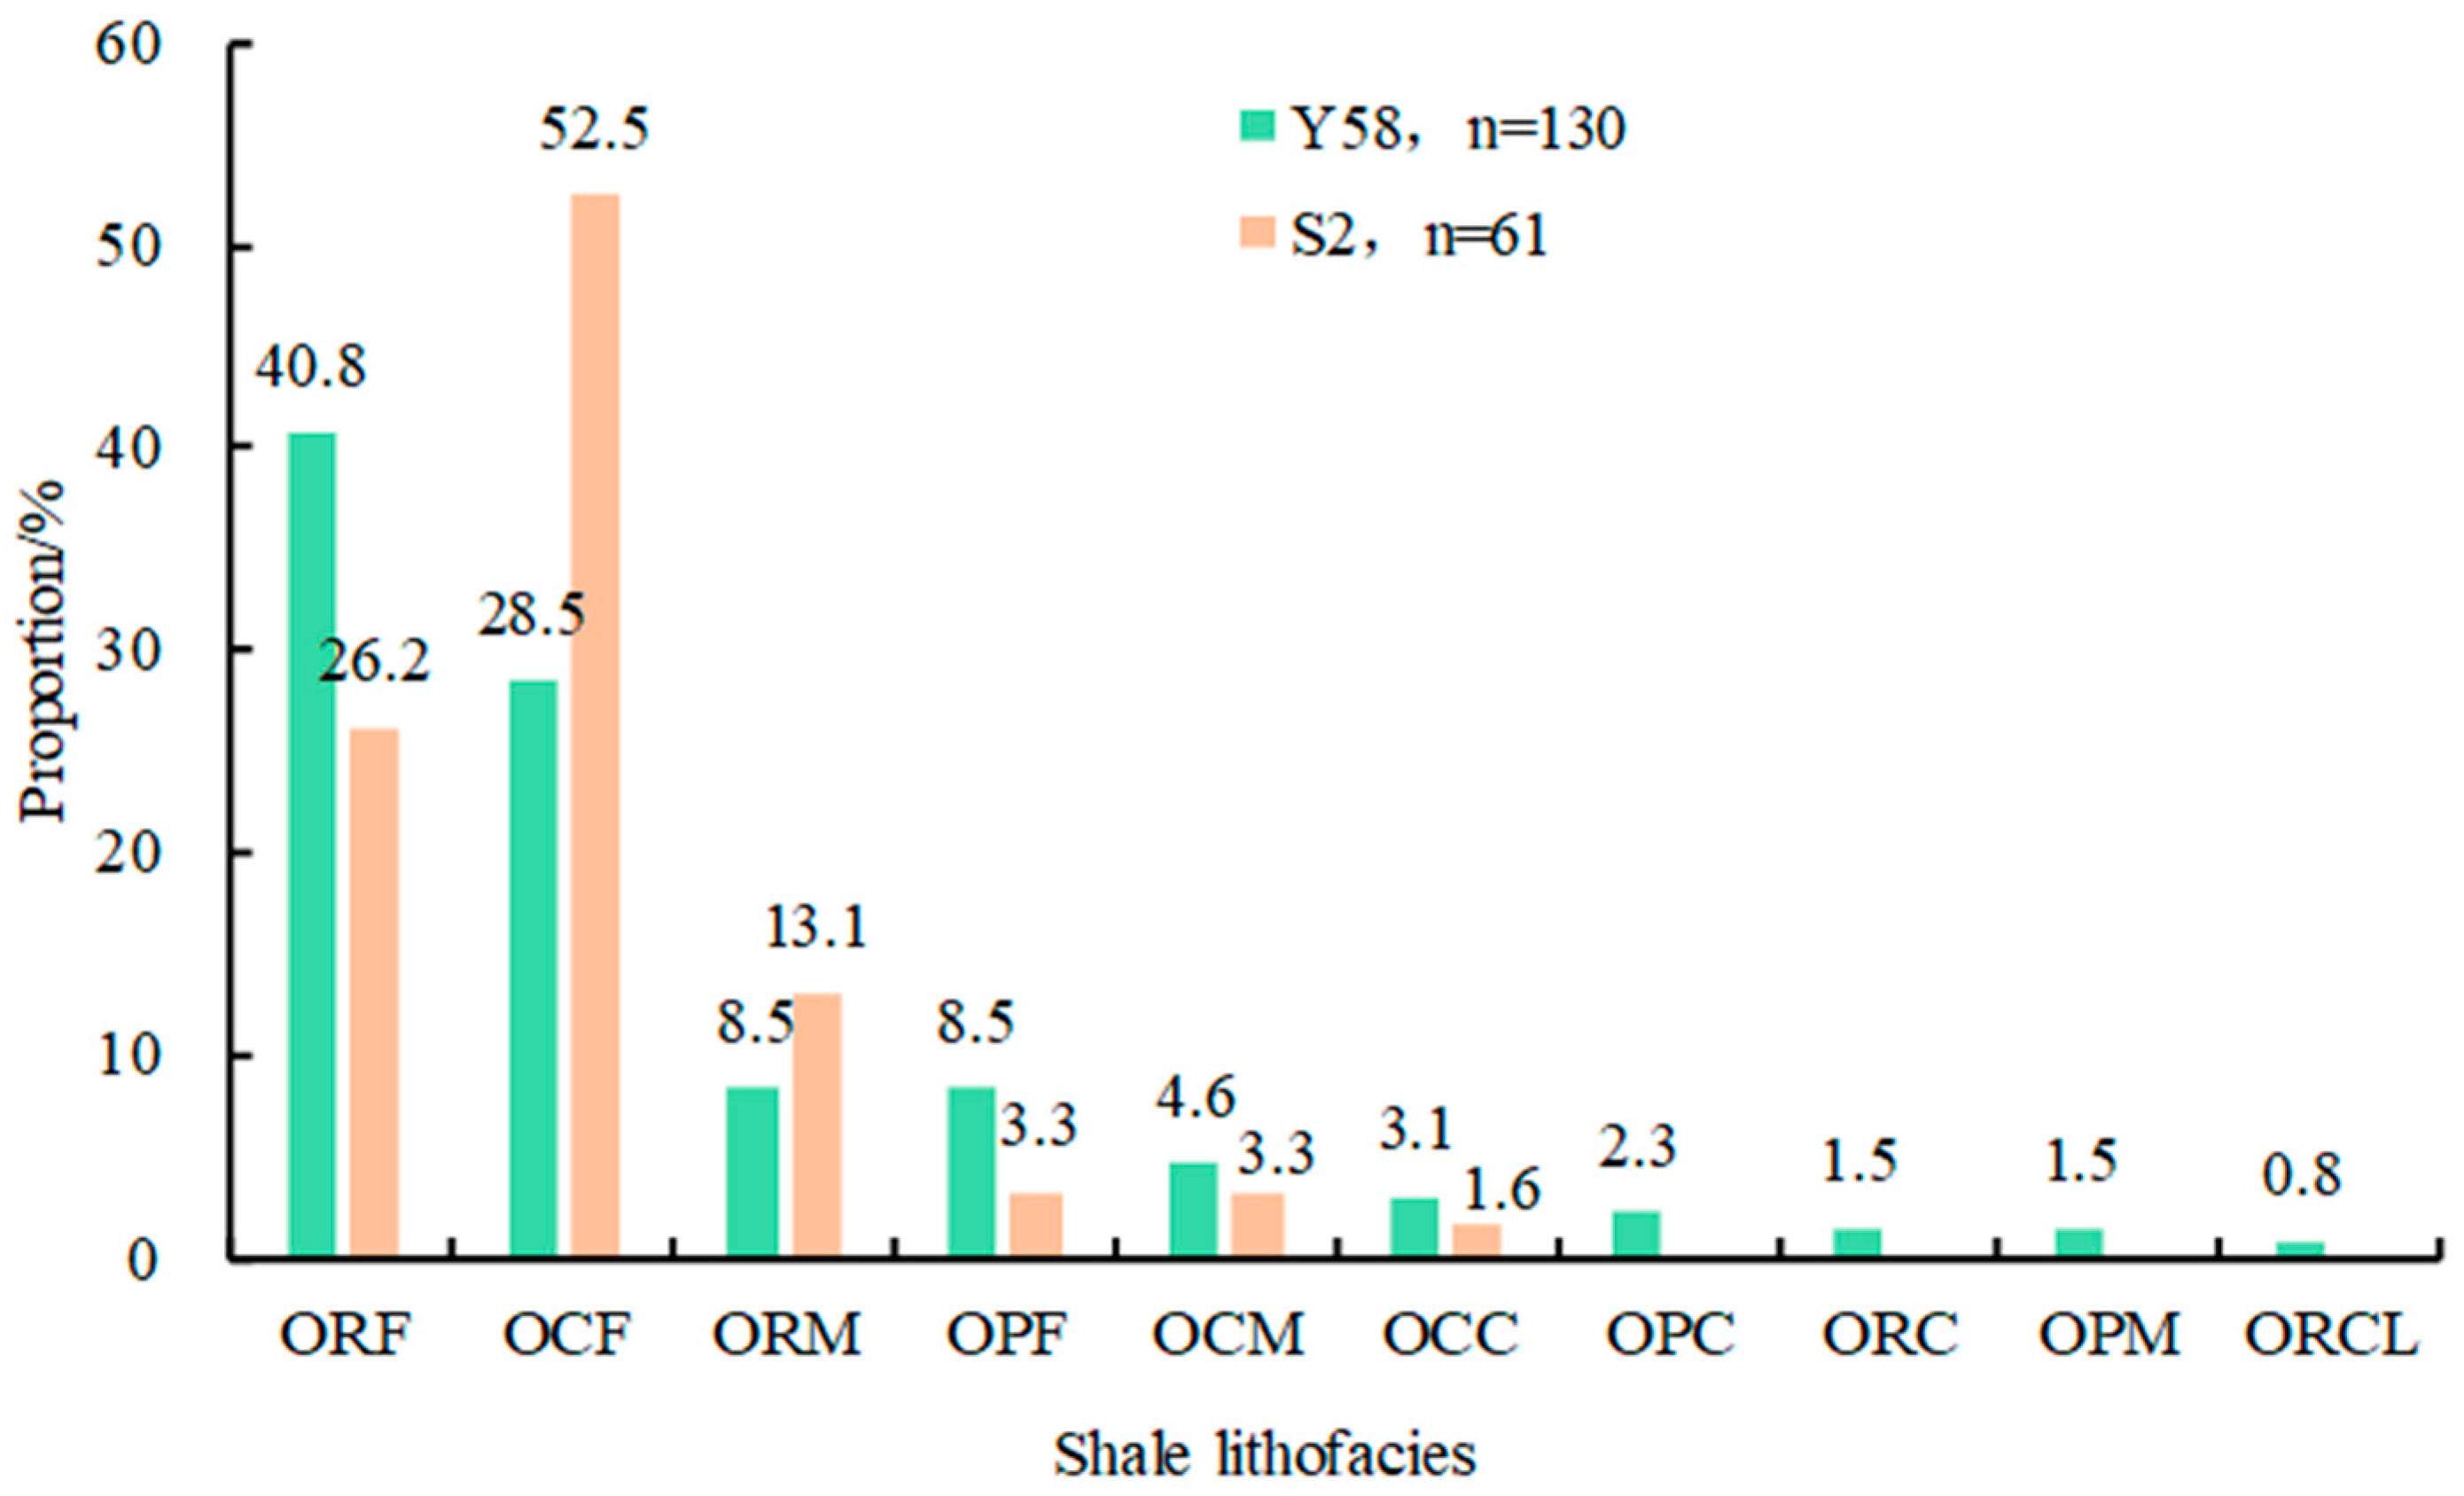
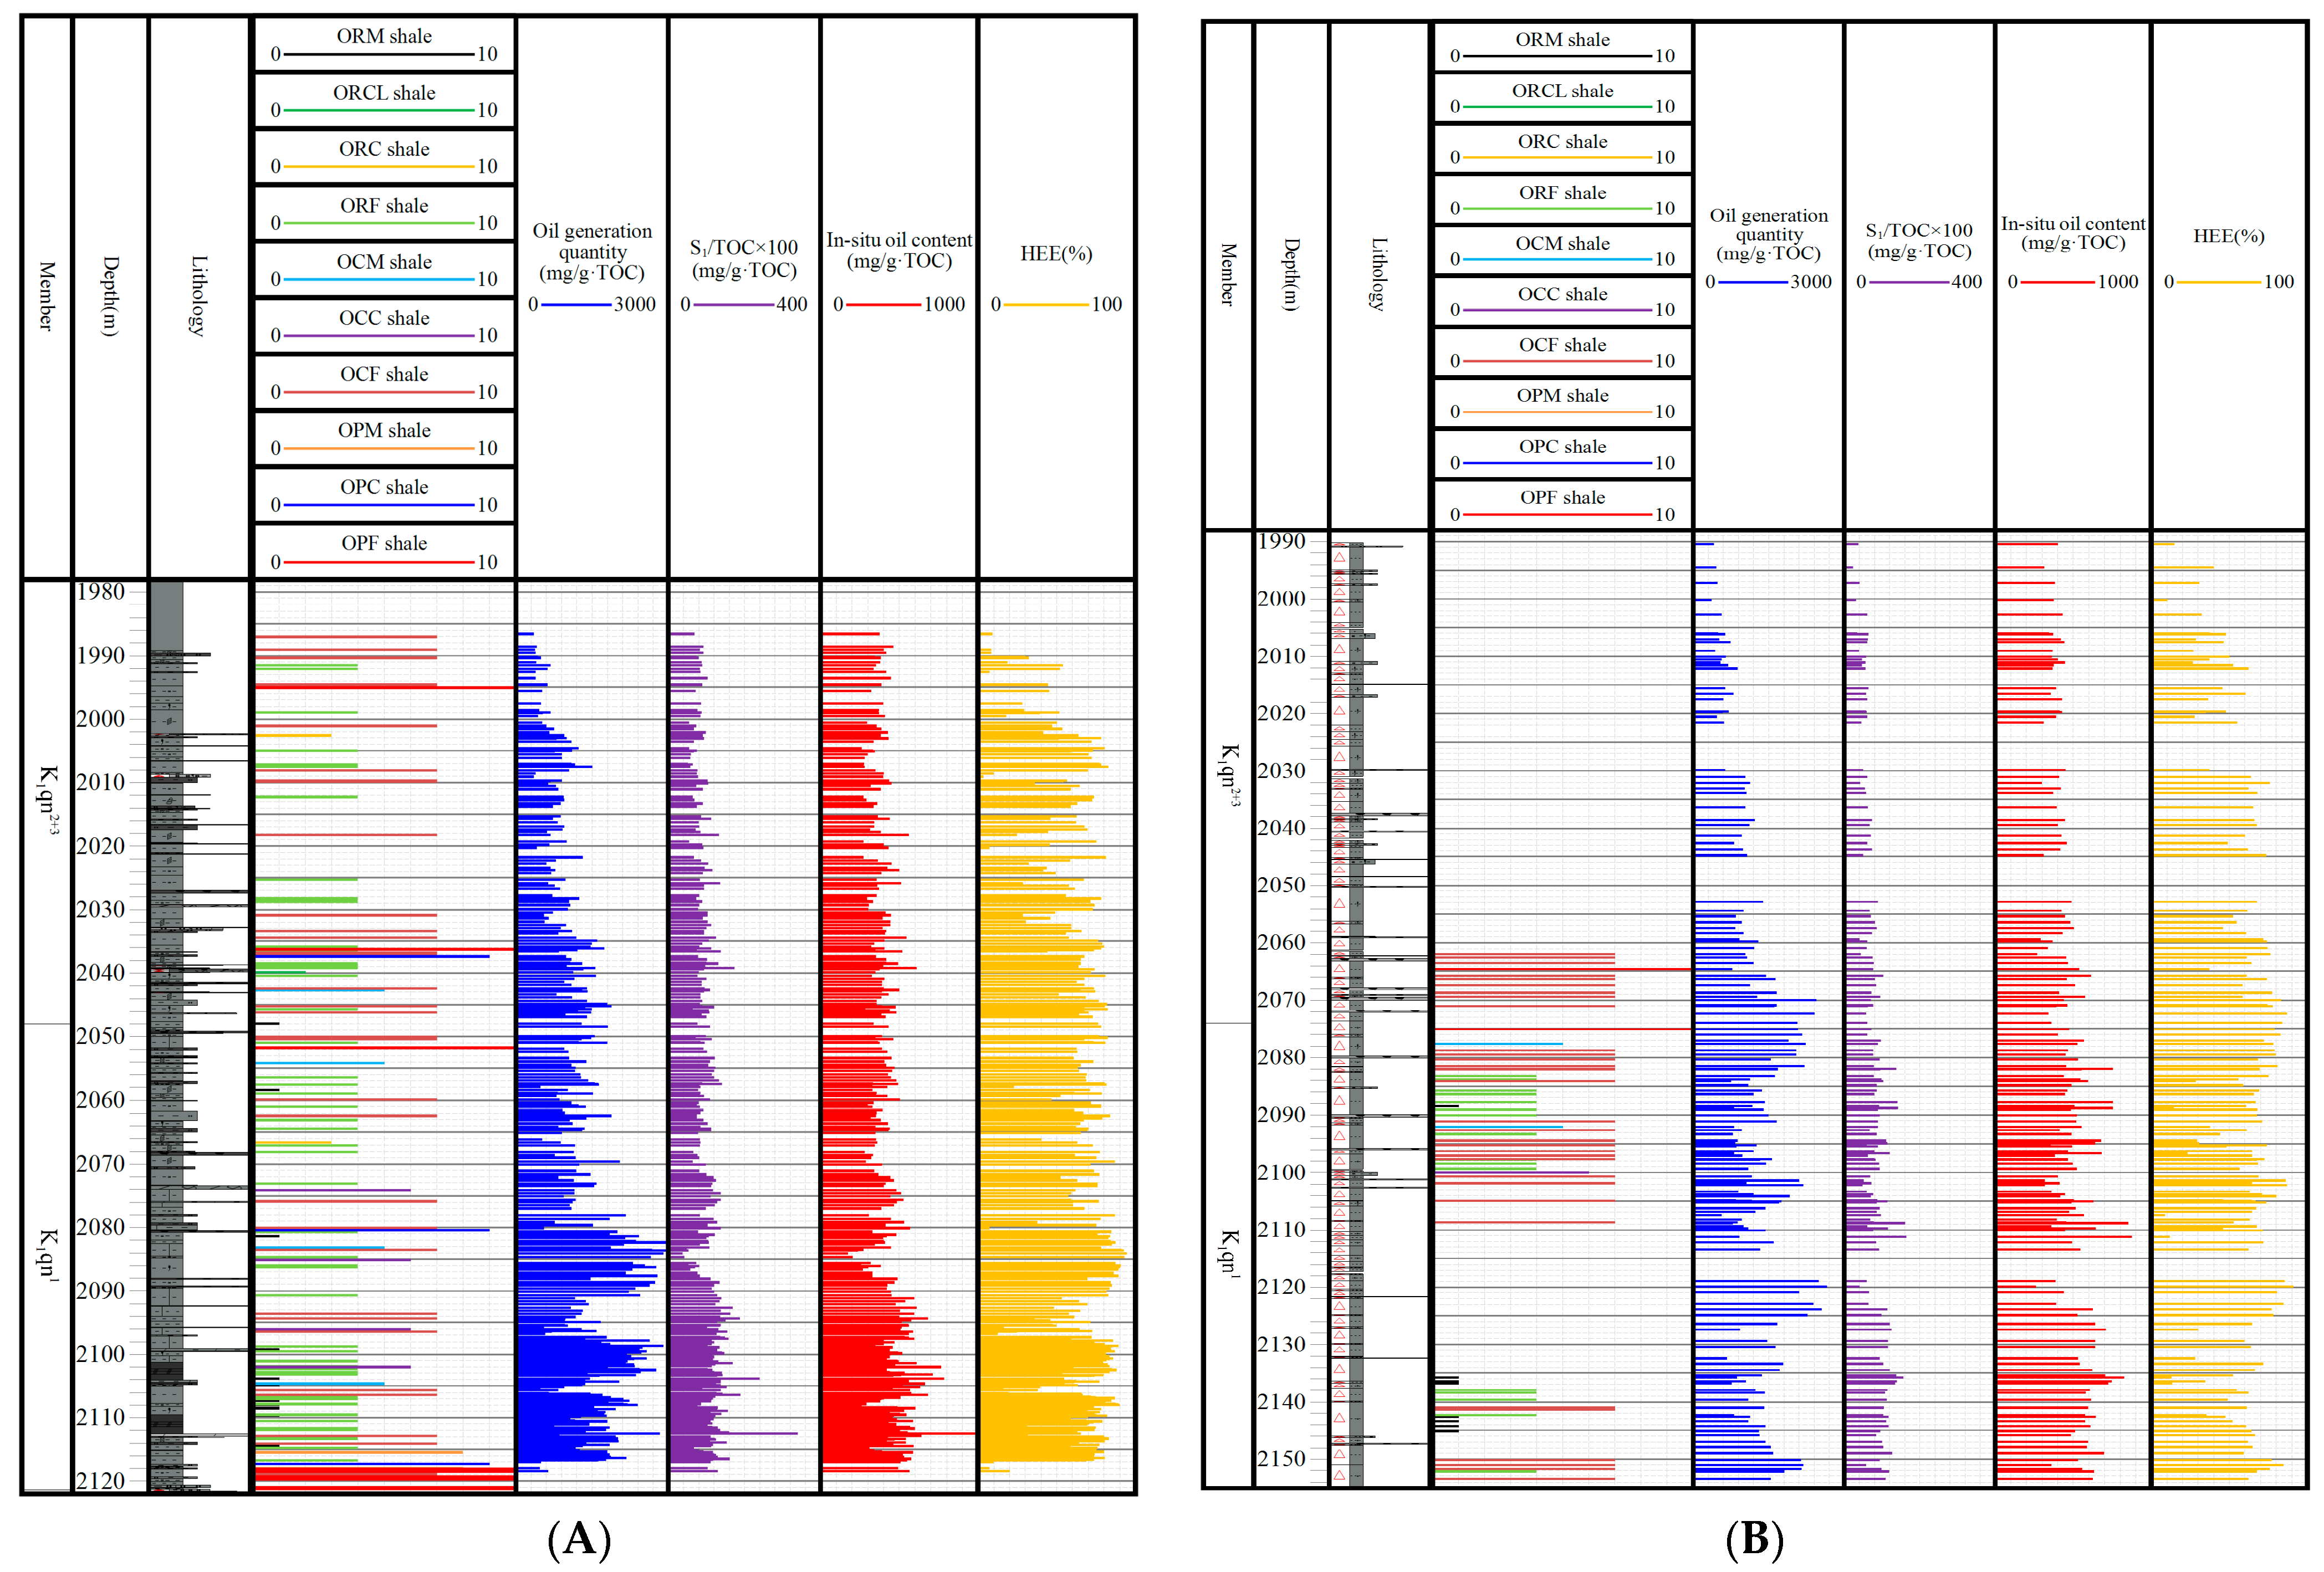
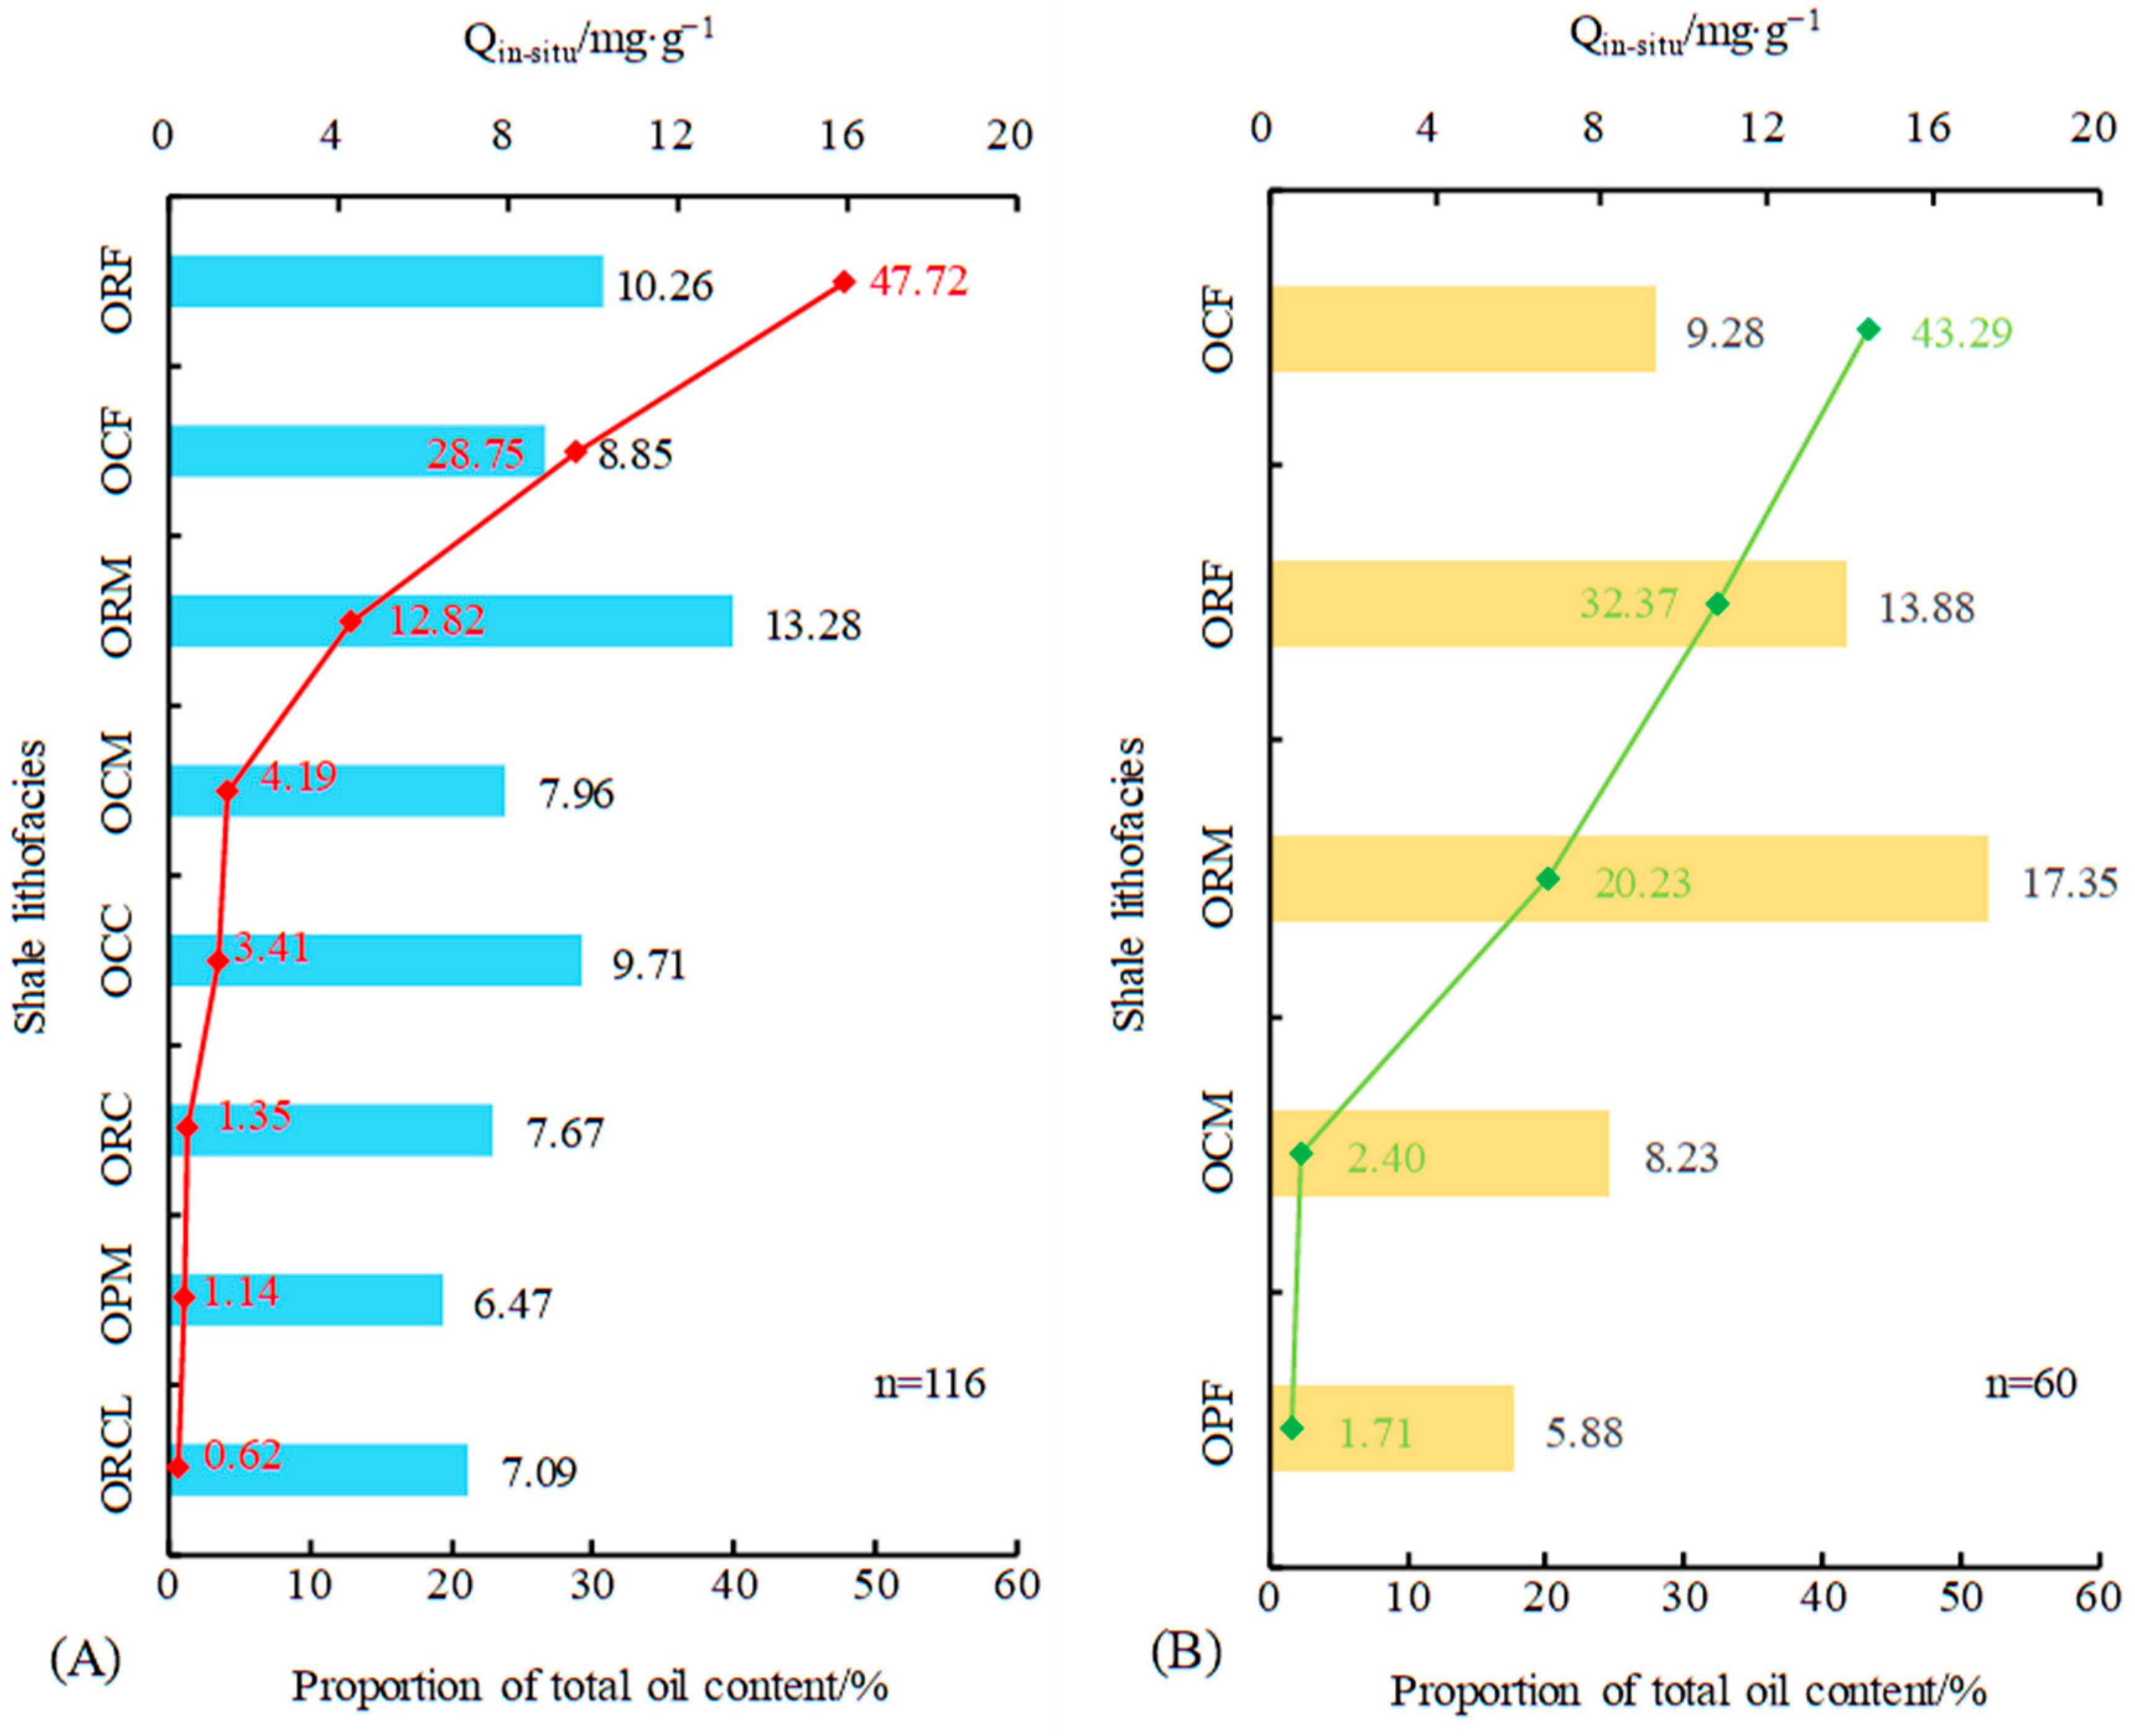
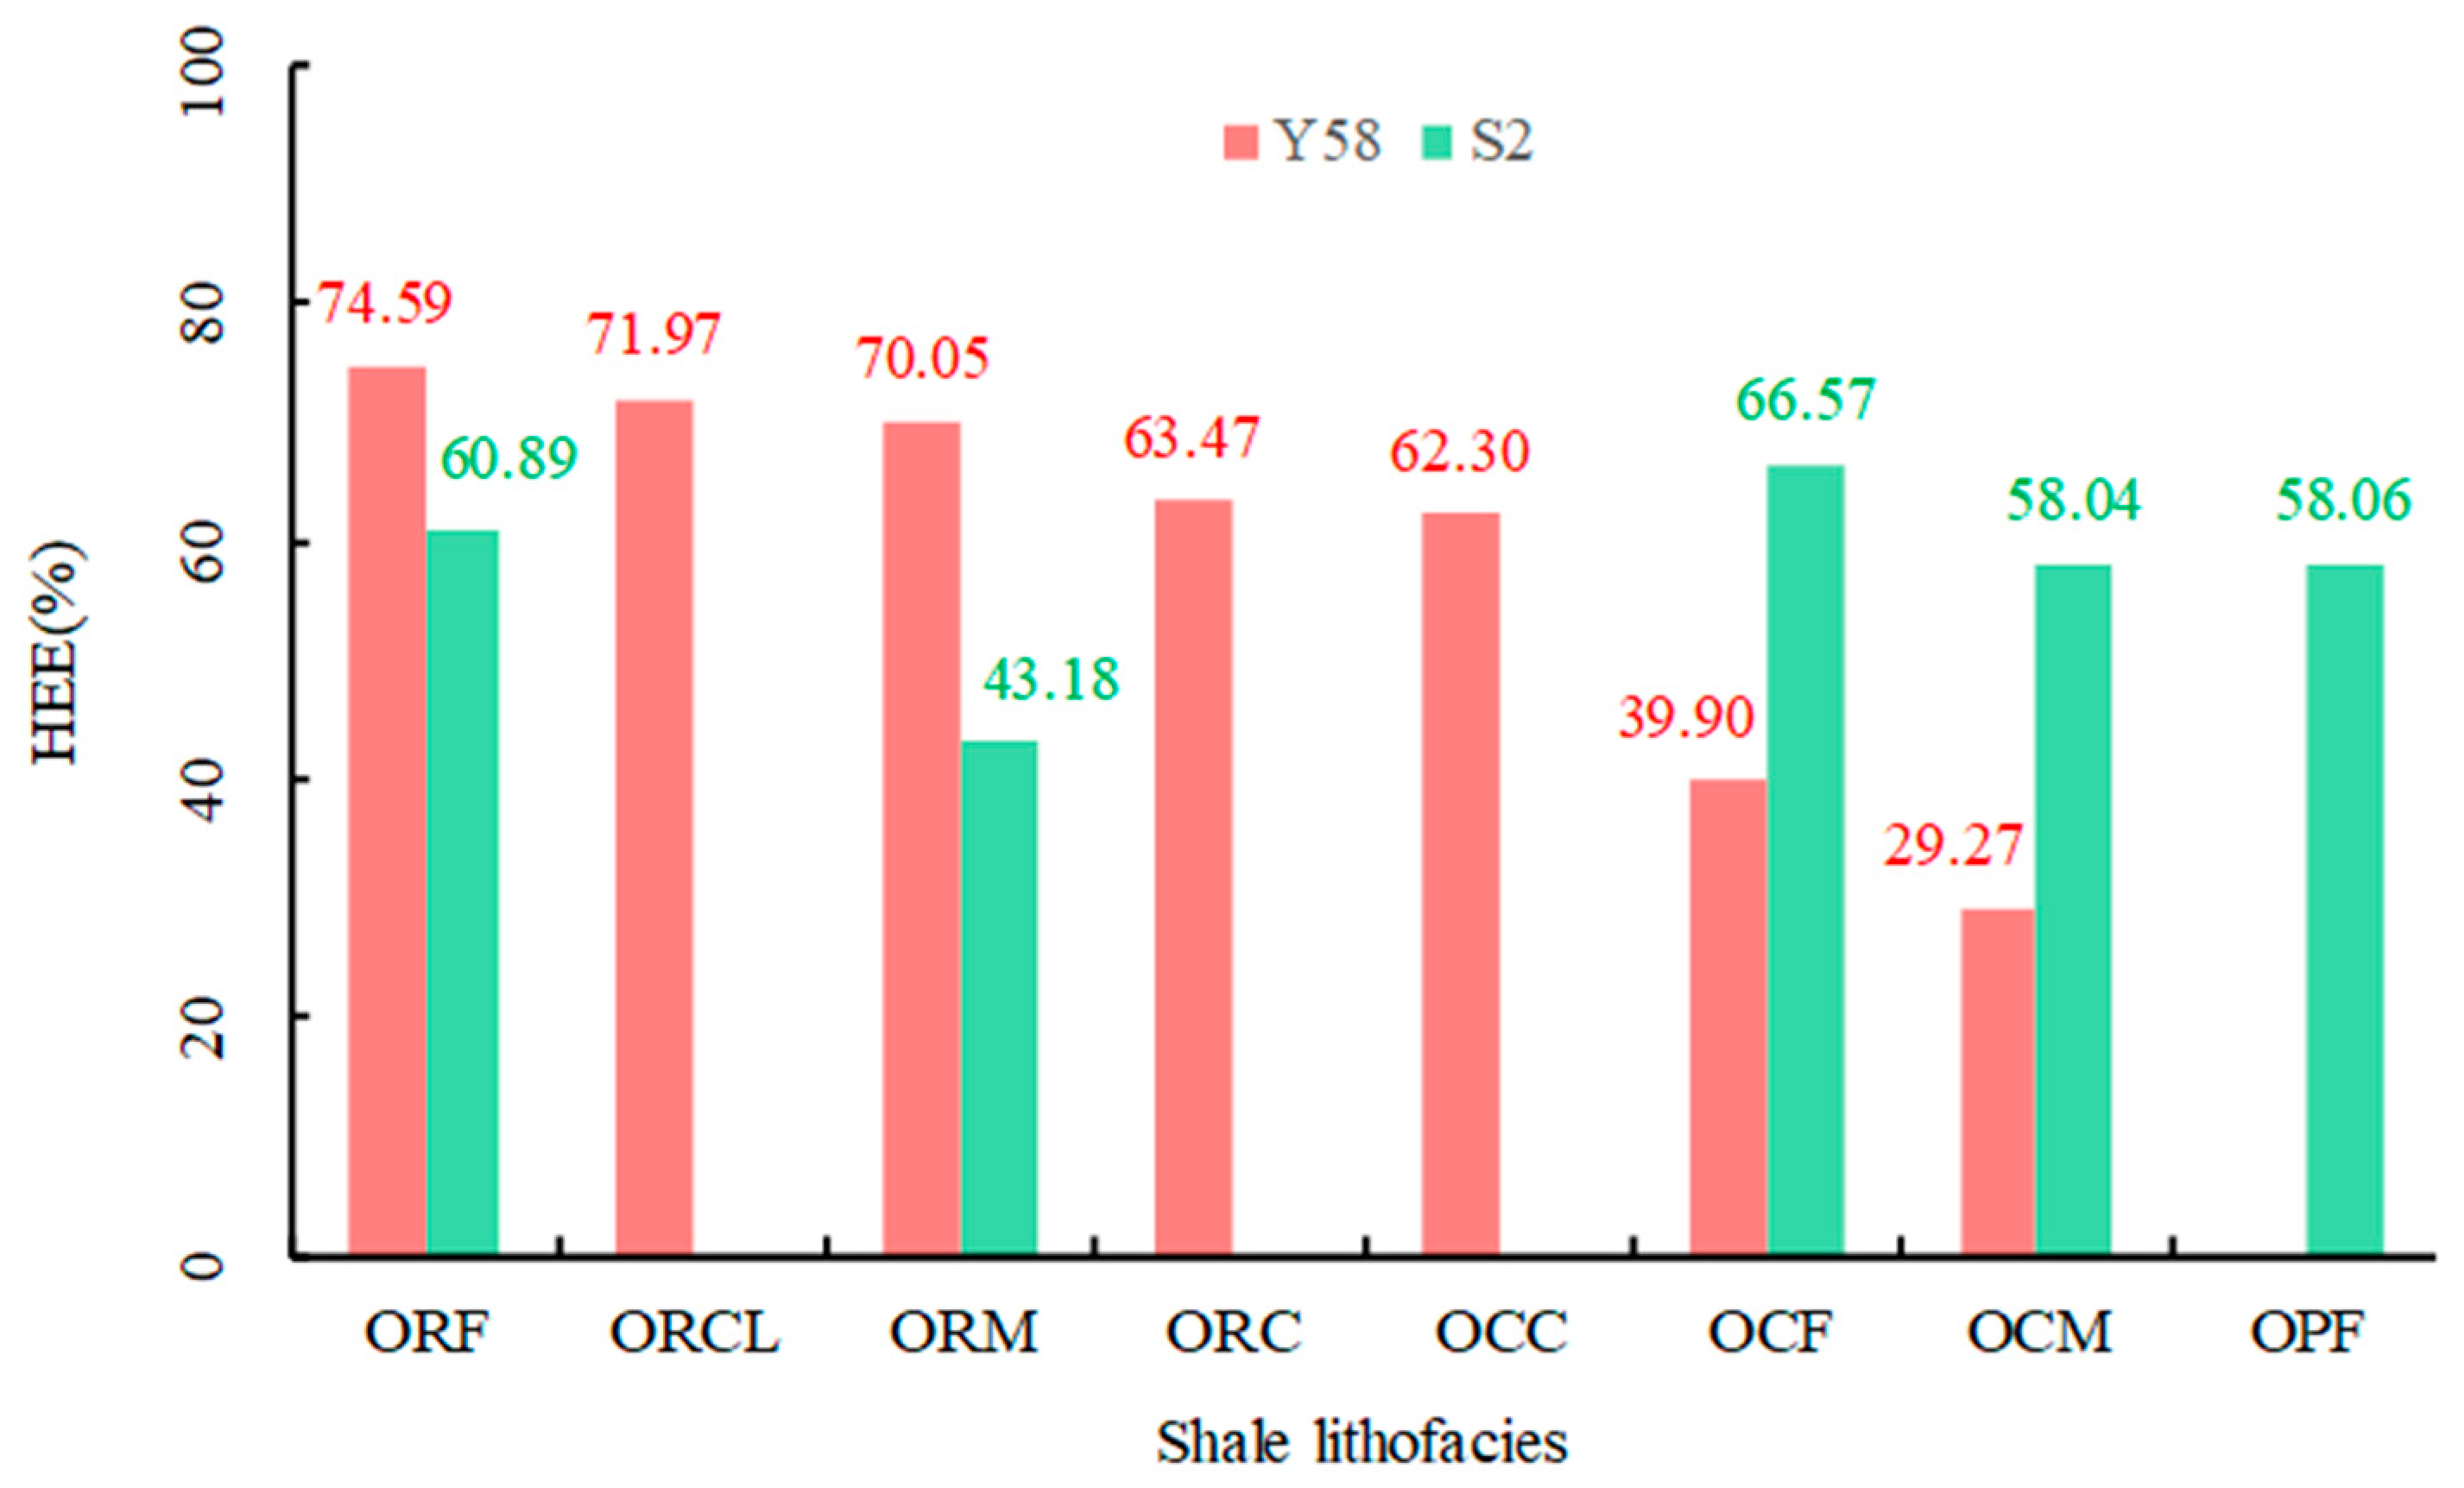
The research area has developed 10 types of shale, with a large scale of ORF shale and OCF shale, accounting for over 65%. The average in situ oil content of both wells is relatively high, reaching over 8.8 mg/g in both wells. At the same time, the development scale of these two types of shale is large, making it the highest resource contribution. However, in areas close to the fault, ORF shale has a higher HEE, which will reduce the mobility of shale oil. At this time, OCF shale has a lower HEE, which combines high resource reserves and good shale oil mobility. On the contrary, in places far from the fault, OCF shale has a higher HEE and slightly lower shale oil mobility.
(2)
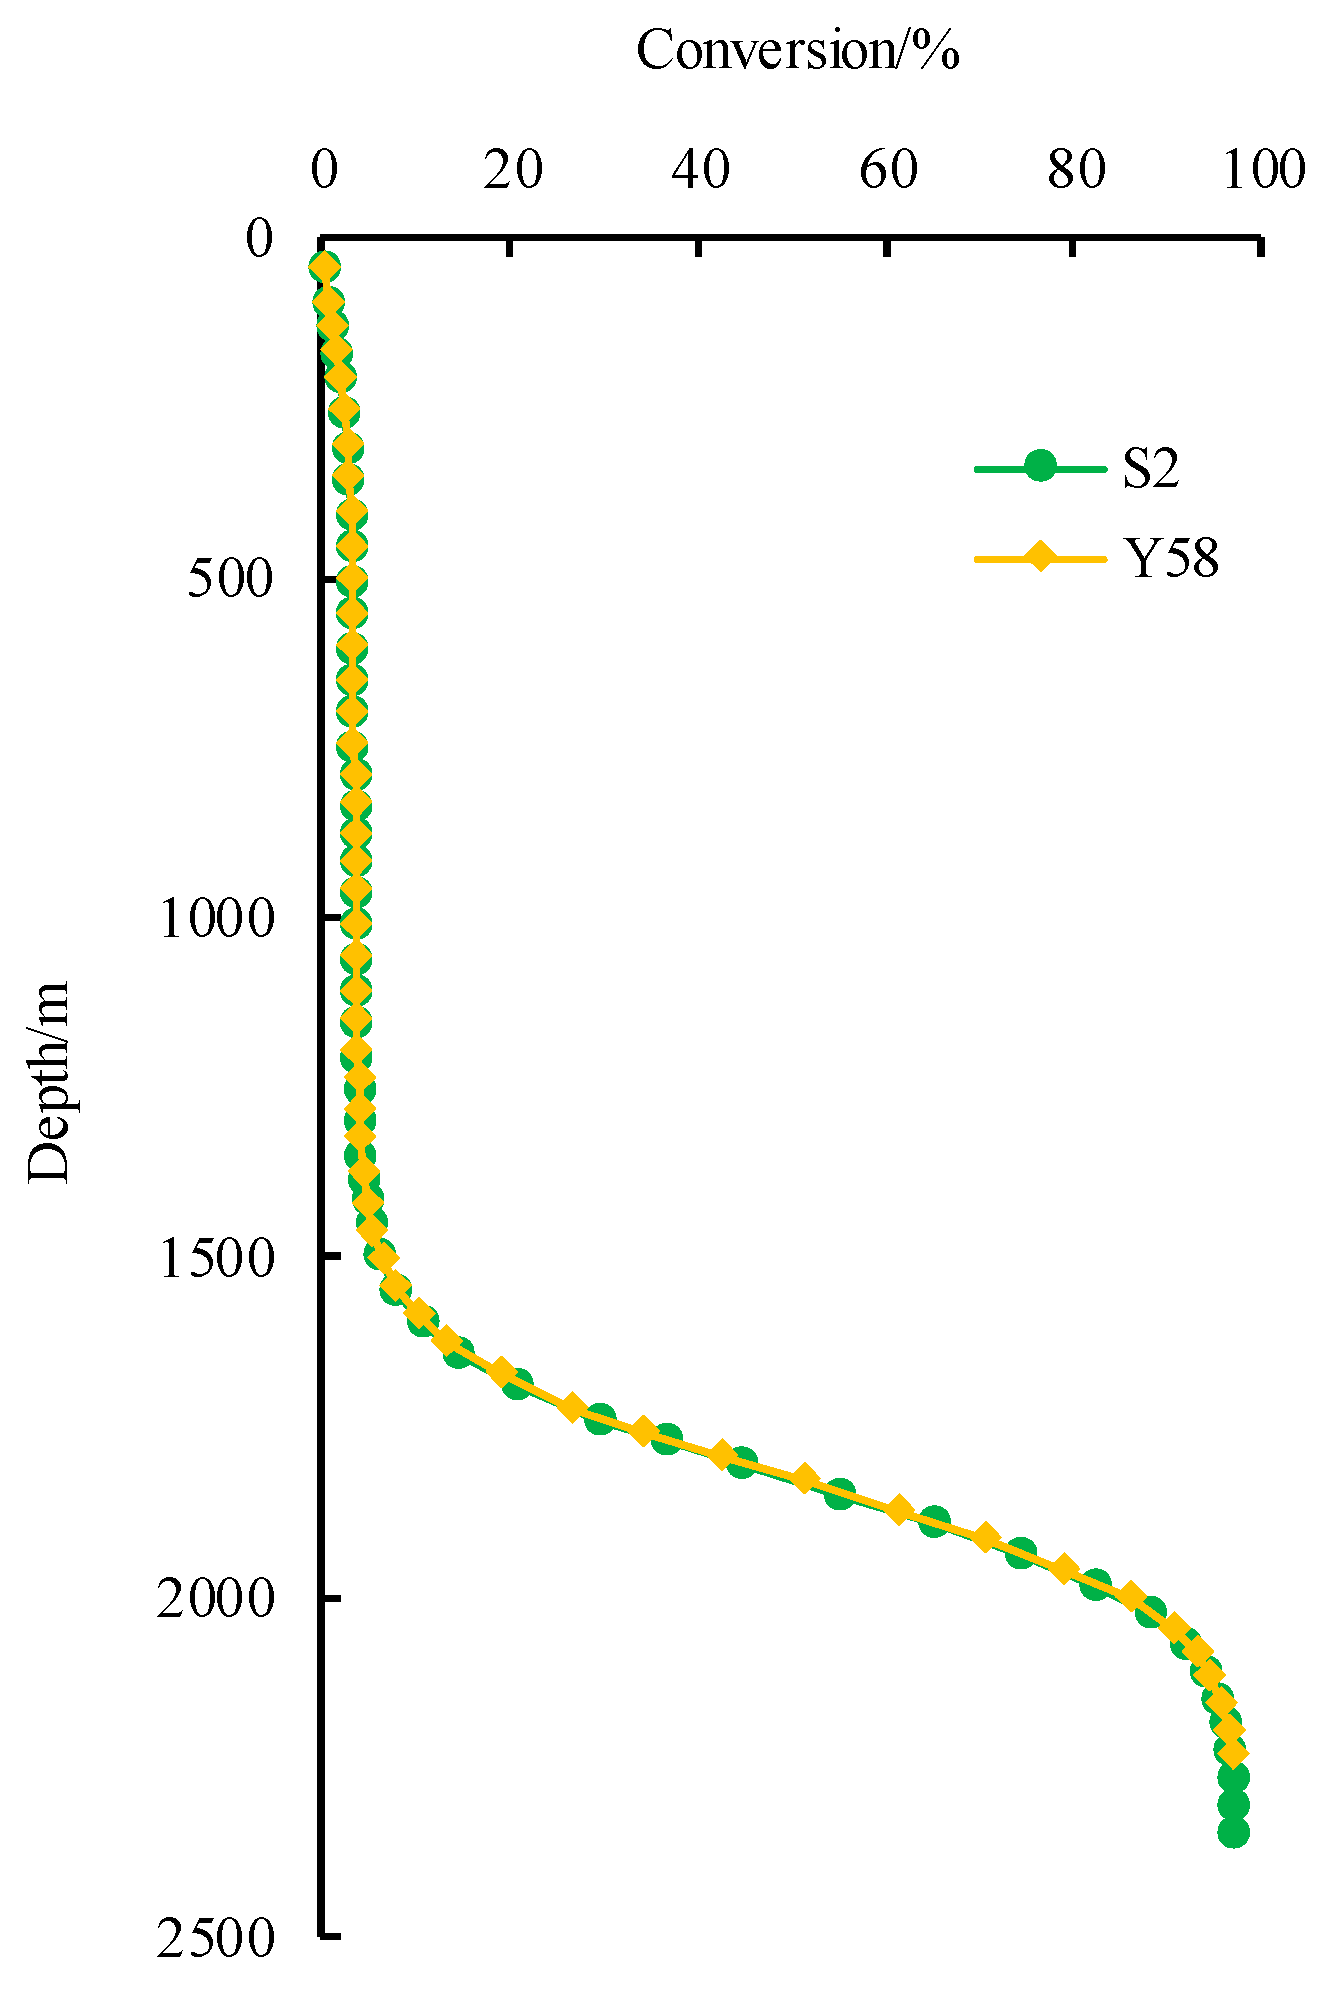
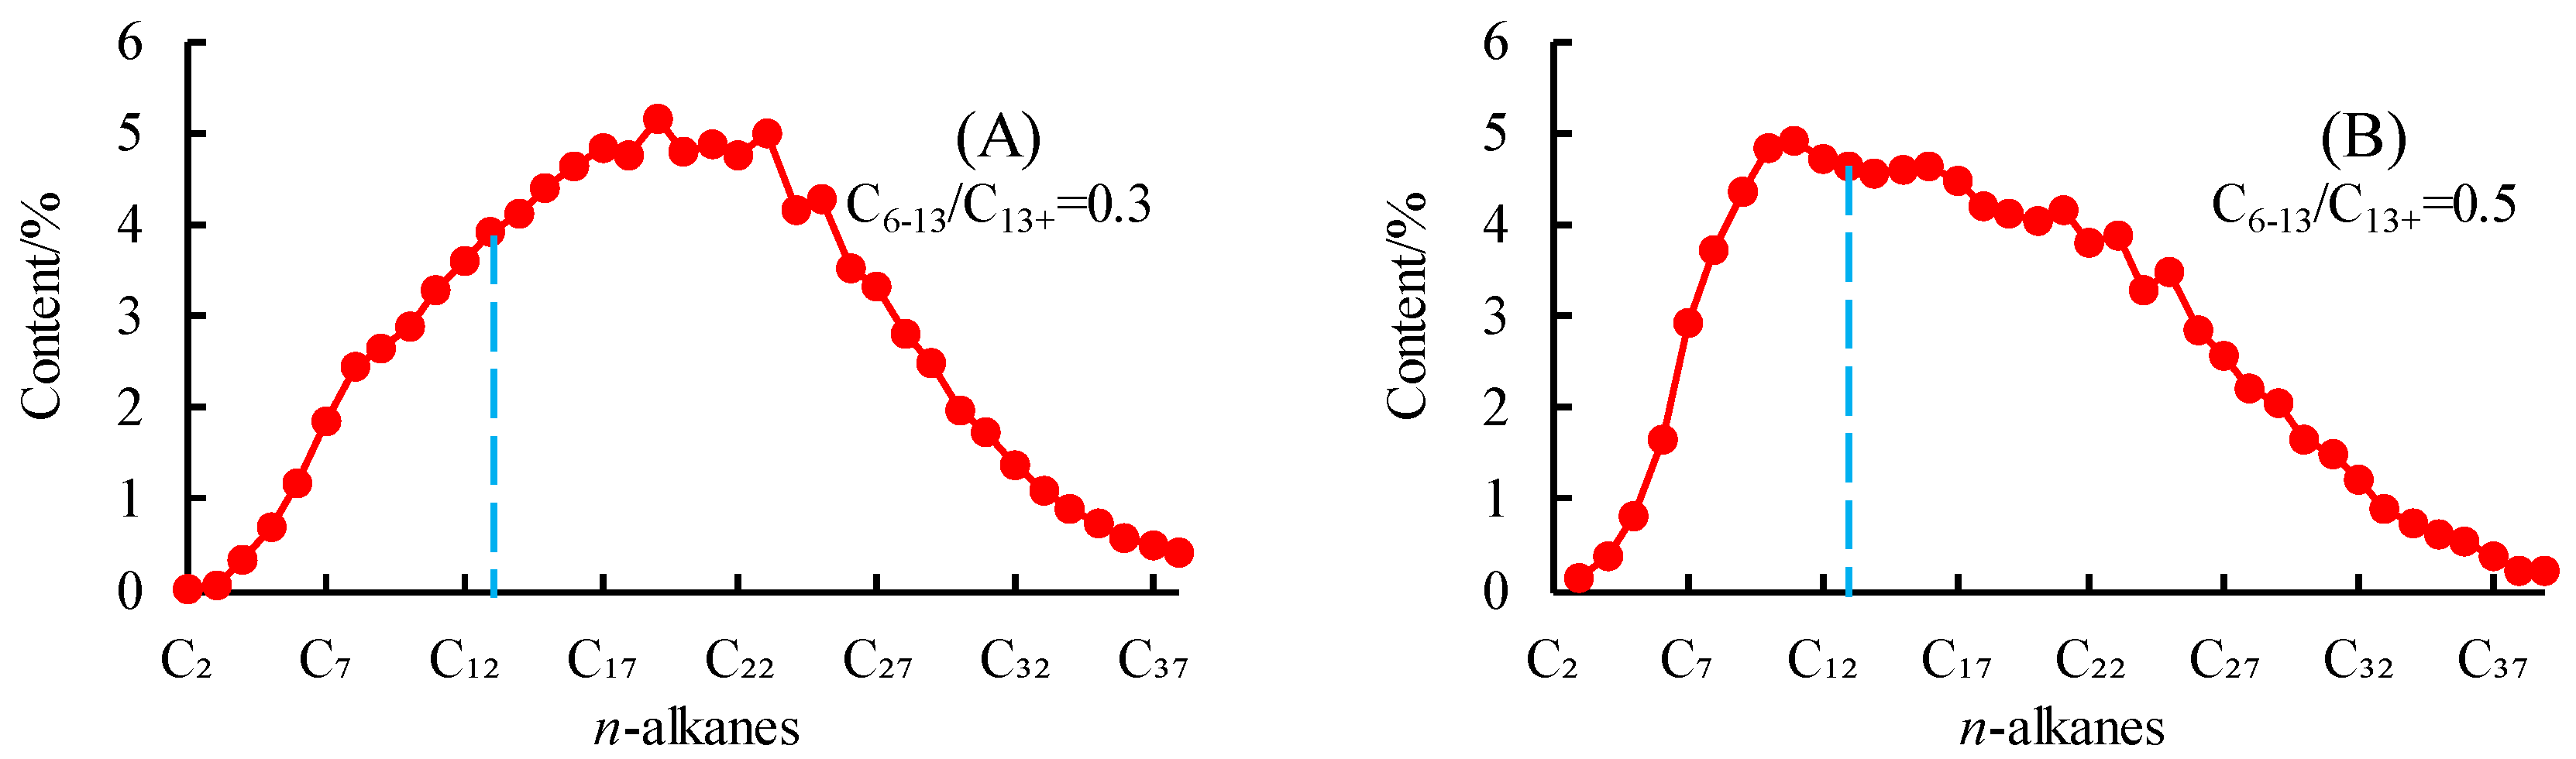
Light hydrocarbons account for over 30% of heavy hydrocarbons (C6–13/C13+) in crude oil, and light hydrocarbons are prone to loss. By recovering light and heavy hydrocarbons from pyrolysis S1, the in situ oil content of shale can be accurately and quantitatively characterized, clarifying that the fracture system has a significant control effect on shale oil enrichment. Research has found that although the oil generation quantity of well Y58, which is close to the fault, is higher than that of well S2, its migration effect is stronger than that of well S2, which means that the HEE is higher, resulting in a significantly lower in situ oil content and OSI of the shale in well Y58 compared to well S2.
(3)
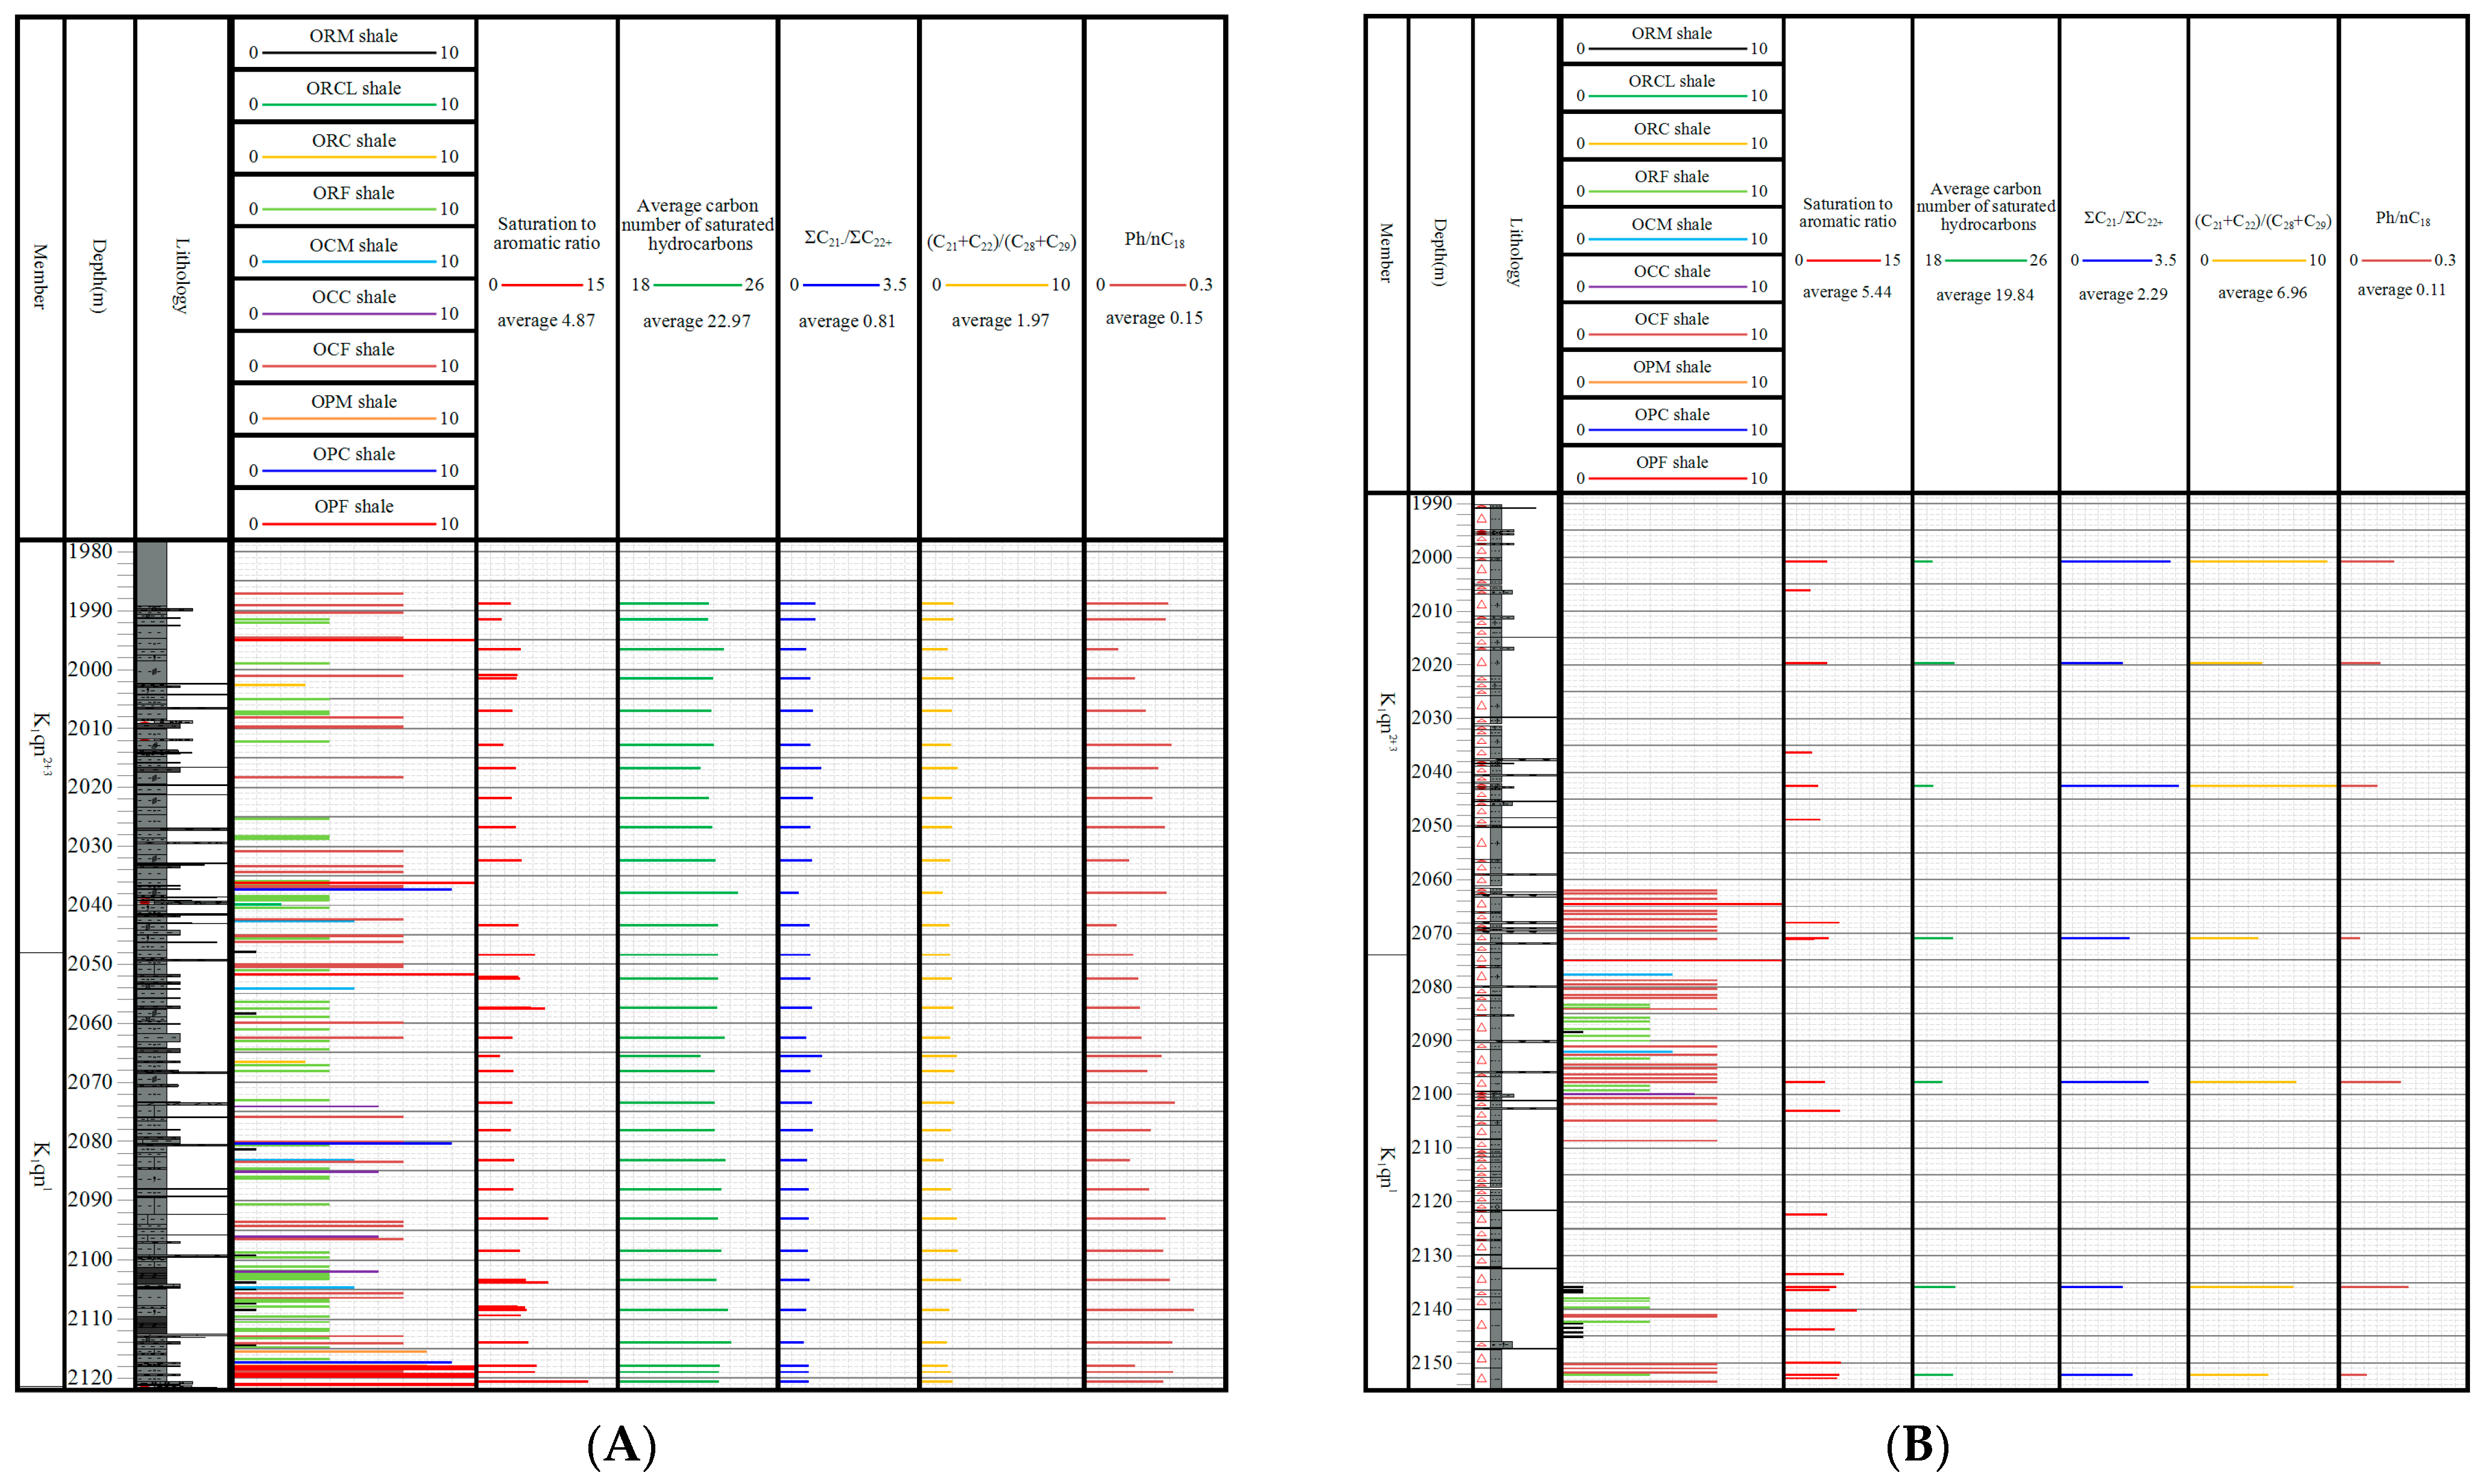
The development of faults leads to enhanced migration, manifested as increased HEE, which leads to differentiation of shale oil components and affects their mobility. Specifically, with the enhancement of migration, the ratio of saturated aromatics is reduced, the average carbon number of saturated hydrocarbons is increased, the ratios of ΣC21−/ΣC22+ and (C21 + C22)/(C28 + C29) are reduced, and the ratio of Ph/nC18 is increased; that is, a large number of easily migrated components with small polarity and light weight in shale oil are discharged, which reduces the mobility of in situ shale oil.
(4)
When exploring and developing shale oil, it is necessary to consider the impact of faults on shale oil content and shale oil mobility and to try to avoid faults as much as possible.

Supplementary Materials

The following supporting information can be downloaded at: https://www.mdpi.com/article/10.3390/en17174517/s1, Supplementary geochemical results: Table S1. Statistical table of samples geochemical results. Table S2. Statistical table of shale mineral composition. Table S3. Statistical table of shale oil biomarkers.

Author Contributions

Methodology, S.L.; Investigation, H.Y. and Y.X.; Resources, X.F. and X.Z.; Data curation, Y.S. and Q.Z.; Writing—original draft, J.L. (Junhui Li); Writing—review & editing, X.B., W.L. and J.L. (Jijun Li). All authors have read and agreed to the published version of the manuscript.

Funding

We thank the National Natural Science Foundation of China (42172145) for financial support of this paper.

Data Availability Statement

Data will be made available on request.

Conflicts of Interest

Authors Xuefeng Bai, Junhui Li, Xiuli Fu, Yangxin Su and Qiang Zheng are employed by the company Daqing Oilfield Company Ltd. The remaining authors declare that the research was conducted in the absence of any commercial or financial relationships that could be construed as a potential conflict of interest.

References

  1. Li, M.; Wang, M.; Zhang, J.Y.; Zhang, Y.C.; Liu, Z.; Luo, B.; Bian, C.S.; Li, J.B.; Wang, X.; Zhao, X.B.; et al. Evaluation of the compositions of lacustrine shale oil in China’s typical basins and its implications. Oil Gas Geol. 2023, 44, 1479–1498. [Google Scholar]
  2. Zhi, D.M.; Tang, Y.; Yang, Z.F.; Guo, X.G.; Zheng, M.L.; Wan, M.; Huang, L.L. Geological characteristics and accumulation mechanism of continental shale oil in Jimusaer sag, Junggar Basin. Oil Gas Geol. 2019, 40, 524–534. [Google Scholar]
  3. Jin, Z.J.; Zhu, R.K.; Liang, X.P.; Shen, Y.Q. Several issues worthy of attention in current lacustrine shale oil exploration and development. Pet. Explor. Dev. 2021, 48, 1276–1287. [Google Scholar] [CrossRef]
  4. Liu, B.; Sun, J.H.; Zang, Y.Q.; He, J.L.; Fu, X.F.; Yang, L.; Xing, J.L.; Zhao, X.Q. Reservoir space and enrichment model of shale oil in the first member of Cretaceous Qingshankou Formation in the Changling Sag, southern Songliao Basin, NE China. Pet. Explor. Dev. 2021, 48, 521–535. [Google Scholar] [CrossRef]
  5. He, W.Y.; Liu, B.; Zhang, J.Y.; Bai, L.H.; Tian, S.S.; Chi, Y.A. Geological Characteristics and Key Scientific and Technological Problems of Gulong Shale Oil in Songliao Basin. Earth Sci. 2023, 48, 49–62. [Google Scholar]
  6. Tian, H.; He, K.; Huangfu, Y.H.; Liao, F.R.; Wang, X.M.; Zhang, S.C. Oil content and mobility in a shale reservoir in Songliao Basin, Northeast China: Insights from combined solvent extraction and NMR methods. Fuel 2024, 357, 129678. [Google Scholar] [CrossRef]
  7. Liu, H.M.; Bao, Y.S.; Li, M.W.; Li, Z.; Wu, L.B.; Zhu, R.F.; Wang, D.Y.; Wang, X. Geochemical parameters for evaluating shale oil enrichment and mobility: A case study of shales inthe Bakken Formation, Williston Basin and the Shahejie Formation, Jiyang Depression. Oil Gas Geol. 2024, 45, 622–636. [Google Scholar]
  8. Liu, B.; Bai, L.H.; Chi, Y.A.; Jia, R.; Fu, X.F.; Yang, L. Geochemical characterization and quantitative evaluation of shale oil reservoir by two-dimensional nuclear magnetic resonance and quantitative grain fluorescence on extract: A case study from the Qingshankou Formation in Southern Songliao Basin, northeast China. Mar. Pet. Geol. 2019, 109, 561–573. [Google Scholar]
  9. Sun, L.D.; Wang, X.J.; Feng, Z.H.; Shao, H.M.; Zeng, H.S.; Gao, B.; Jiang, H. Formation mechanisms of nano-scale pores/fissures and shale oil enrichment characteristics for Gulong shale, Songliao Basin. Oil Gas Geol. 2023, 44, 1350–1365. [Google Scholar]
  10. Zhao, X.Z.; Zhou, L.H.; Pu, X.G.; Jin, F.M.; Shi, Z.N.; Han, W.Z.; Jiang, W.Y.; Han, G.M.; Zhang, W.; Wang, H.; et al. Formation conditions and enrichment model of retained petroleum in lacustrine shale: A case study of the Paleogene in Huanghua depression, Bohai Bay Basin, China. Pet. Explor. Dev. 2020, 47, 856–869. [Google Scholar] [CrossRef]
  11. Li, Y.; Zhao, Q.M.; Lyu, Q.; Xue, Z.J.; Cao, X.P.; Liu, Z.P. Evaluation technology and practice of continental shale oil development in China. Pet. Explor. Dev. 2022, 49, 955–964. [Google Scholar] [CrossRef]
  12. Yang, Y. Shale oil development techniques and application based on ternary-element storage and flow concept in Jiyang Depression, Bohai Bay Basin, East China. Pet. Explor. Dev. 2024, 51, 337–347. [Google Scholar] [CrossRef]
  13. Jin, X.; Li, G.X.; Meng, S.W.; Wang, X.Q.; Liu, C.; Tao, J.P.; Liu, H. Microscale comprehensive evaluation of continental shale oil recoverability. Pet. Explor. Dev. 2021, 48, 222–232. [Google Scholar] [CrossRef]
  14. Han, Y.J.; Horsfield, B.; Lareau, H.; Mahlstedt, N. Intraformational migration of petroleum: Insights into the development of sweet spot in the Cretaceous Niobrara shale-oil system, Denver Basin. Mar. Pet. Geol. 2019, 107, 301–309. [Google Scholar] [CrossRef]
  15. Hu, S.Z.; Li, S.F.; Xia, L.W.; Lyu, Q.; Cao, J. On the internal oil migration in shale systems and implications for shale oil accumulation: A combined petrological and geochemical investigation in the Eocene Nanxiang Basin, China. J. Pet. Sci. Eng. 2020, 184 Pt 2, 106493. [Google Scholar] [CrossRef]
  16. Jin, Z.J.; Wang, G.P.; Liu, G.X.; Gao, B.; Liu, Q.Y.; Wang, H.L.; Liang, X.P.; Wang, R.Y. Research progress and key scientific issues of continental shale oil in China. Acta Pet. Sin. 2021, 42, 821–835. [Google Scholar]
  17. Jiang, F.J.; Jia, C.Z.; Pang, X.Q.; Jiang, L.; Zhang, C.L.; Ma, X.Z.; Qi, Z.G.; Chen, J.Q.; Pang, H.; Hu, T.; et al. Upper Paleozoic total petroleum system and geological model of natural gas enrichment in Ordos Basin, NW China. Pet. Explor. Dev. 2023, 50, 281–292. [Google Scholar] [CrossRef]
  18. Li, M.; Wang, M.; Zhang, L.B.; Wang, Q.B.; Wang, X.; Li, X.Q.; Deng, Z.X.; Dong, S.D. Understanding pore space and oil content of liquid-rich shale in the southern Bohai Sea, China. Geoenergy Sci. Eng. 2024, 223, 212552. [Google Scholar] [CrossRef]
  19. Ma, W.J.; Li, J.B.; Wang, M. Determination of in situ hydrocarbon contents in shale oil plays: Part 3: Quantification of light hydrocarbon evaporative loss in old cores based on preserved shales. Mar. Pet. Geol. 2024, 160, 106574. [Google Scholar] [CrossRef]
  20. Liang, C.; Cao, Y.C.; Liu, K.Y.; Jiang, Z.X.; Wu, J.; Hao, F. Diagenetic variation at the lamina scale in lacustrine organic-rich shales: Implications for hydrocarbon migration and accumulation. Geochim. Cosmochim. Acta 2018, 229, 112–128. [Google Scholar] [CrossRef]
  21. Han, Y.J.; Horsfield, B.; Mahlstedt, N.; Lareau, H.; Curry, D.J. Compositional fractionation of petroleum from reservoir to wellhead in the Niobrara shale oil play. Int. J. Coal Geol. 2018, 198, 156–166. [Google Scholar] [CrossRef]
  22. Han, Y.J.; Poetz, S.; Mahlstedt, N.; Karger, C.; Horsfield, B. Fractionation of Pyrrolic Nitrogen Compounds Compounds during Primary Migration of Petroleum within the Barnett Shale Sequence of Marathon 1 Mesquite Well, Texas. Energy Fuels 2018, 32, 4638–4650. [Google Scholar] [CrossRef]
  23. Han, Y.J.; Horsfield, B.; Mahlstedt, N.; Noah, M. Chemostatistic allocation of shale oil production using acidic heterocompounds. AAPG Bull. 2021, 105, 2207–2219. [Google Scholar] [CrossRef]
  24. Han, Y.J.; Mahlstedt, N.; Horsfield, B. The Barnett Shale: Compositional fractionation associated with intraformational petroleum migration, retention, and expulsion. AAPG Bull. 2015, 99, 2173–2202. [Google Scholar] [CrossRef]
  25. Pan, S.Q.; Zou, C.N.; Li, J.; Yang, Z.; Liu, E.T.; Han, Y.J. Unconventional shale systems: A comparative study of the “in-source sweet spot” developed in the lacustrine Chang 7 Shale and the marine Barnett Shale. Mar. Pet. Geol. 2019, 100, 540–550. [Google Scholar] [CrossRef]
  26. Feng, L.Y.; Zhang, J.G.; Jiang, Z.X.; Li, C.S.; Bai, Y.F. High-precision sedimentary cycle framework and organic matter enrichment response of Qingshankou Formation in Songliao Basin. Acta Pet. Sin. 2023, 44, 299–311. [Google Scholar]
  27. Wang, Y.C.; Li, P.P.; Feng, Z.H.; Shao, H.M.; Jia, Z.W.; Xia, Y.Q.; Li, J.; Wang, Z. Geochemical characteristics of shales from the first mem ber of Qingshankou Formation in Gulong Sag, Songliao Basin, China: Implication for mechanism of organic matter enrichment. Mar. Pet. Geol. 2023, 150, 106142. [Google Scholar] [CrossRef]
  28. Hang, Q.H.; Wu, H.C.; Wan, X.Q.; He, H.Y.; Deng, C.L. New progress of integrated chronostratigraphy of the cretaceous in Songliao Basin. J. Stratigr. 2011, 35, 250–257. [Google Scholar]
  29. Liu, B.; Wang, H.L.; Fu, X.F.; Bai, Y.F.; Bai, L.H.; Jia, M.C.; He, B. Lithofacies and depositional setting of a highly prospective lacustrine shale oil succession from the Upper Cretaceous Qingshankou Formation in the Gulong sag, northern Songliao Basin, northeast China. AAPG Bull. 2019, 103, 405–432. [Google Scholar] [CrossRef]
  30. Sun, L.D.; Liu, H.; He, W.Y.; Li, G.X.; Zhang, S.C.; Zhu, R.K.; Jin, X.; Meng, S.W.; Jiang, H. An analysis of major scientific problems and research paths of Gulong shale oil in Daqing Oilfield, NE China. Pet. Explor. Dev. 2021, 48, 453–463. [Google Scholar] [CrossRef]
  31. Liu, H.; Huang, Y.Q.; Cai, M.; Meng, S.W.; Tao, J.P. Practice and development suggestions of hydraulic fracturing technology in the Gulong shale oil reservoirs of Songliao Basin, NE China. Pet. Explor. Dev. 2023, 50, 603–612. [Google Scholar] [CrossRef]
  32. Liu, B.; Shi, J.X.; Fu, X.F.; Lyu, Y.F.; Sun, X.D.; Gong, L.; Bai, Y.F. Petrological characteristics and shale oil enrichment of lacustrine fine-grained sedimentary system: A case study of organic-rich shale in first member of Cretaceous Qingshankou Formation in Gulong Sag, Songliao Basin, NE China. Pet. Explor. Dev. 2018, 45, 828–838. [Google Scholar] [CrossRef]
  33. Sun, L.D.; Cui, B.W.; Zhu, R.K.; Wang, R.; Feng, Z.H.; Li, B.H.; Zhang, J.Y.; Gao, B.; Wang, Q.Z.; Zeng, H.S.; et al. Shale oil enrichment evaluation and production law in Gulong Sag, Songliao Basin, NE China. Pet. Explor. Dev. 2023, 50, 441–454. [Google Scholar] [CrossRef]
  34. Liu, Z.J.; Liu, R.; Sun, P.C.; Meng, Q.T.; Hu, F. Oil Shale Characteristics and Distribution in Typical Basins of China. J. Jilin Univ. Earth Sci. Ed. 2020, 50, 313–325. [Google Scholar]
  35. Behar, F.; Beaumont, V.; Penteado, H.L.D.B. Rock-Eval 6 Technology: Performances and Developments. Oil Gas Sci. Technol. 2001, 56, 111–134. [Google Scholar] [CrossRef]
  36. SY/T 5163-2018; Analysis Method for Clay Minerals and Ordinary Non-Clay Minerals in Sedimentary Rocks by the X-ray Diffraction. Petroleum Industry Press: Beijing, China, 2019.
  37. SY/T 5118-2021; Determination of the Extract Content of Rock. Petroleum Industry Press: Beijing, China, 2022.
  38. Zheng, D.Z.; Miska, S.; Ozbayoglu, E.; Zhang, J.G. Combined experimental and well log study of anisotropic strength of shale. In Proceedings of the SPE Annual Technical Conference and Exhibition, San Antonio, TX, USA, 16–18 October 2023. [Google Scholar]
  39. Zheng, D.Z.; Miska, S.; Ziaja, M.; Zhang, J.G. Study of anisotropic strength properties of shale. AGH Drill. Oil Gas 2019, 36, 93–112. [Google Scholar] [CrossRef]
  40. Li, J.J.; Wang, W.M.; Cao, Q.; Shi, Y.L.; Yan, X.T.; Tian, S.S. Impact of hydrocarbon expulsion efficiency of continental shale upon shale oil accumulations in eastern China. Mar. Pet. Geol. 2015, 59, 467–479. [Google Scholar]
  41. Lu, S.F. Theory and Application of Organic Matter Hydrocarbon Generation Dynamics; Petroleum Industry Press: Beijing, China, 1996; pp. 1–94. [Google Scholar]
  42. Liu, Y.; He, K.; Li, X.Q.; Xu, H.W.; Zhang, J.Z.; Hu, S.L.; Wang, G.; Fan, Z.W. Hydrocarbon generation kinetics and the efficiency of petroleum expulsion of lacustrine source rocks: Taking the Qingshankou Formation in the Songliao Basin as an example. Geoscience 2016, 30, 627–634. [Google Scholar]
  43. Chen, Z.H.; Zha, M. Simulation experiment of geochromatographic effect during hydrocarbon expulsion. Geochimica 2006, 35, 157–166. [Google Scholar]
  44. Lyu, X.X.; Yang, H.J.; Wang, X.; Han, J.F.; Bai, Z.K. Application of geochemical parameters in hydrocarbon migration studies: Taking Tazhong area of the Tarim Basin as an example. Oil Gas Geol. 2010, 31, 838–846. [Google Scholar]
Figure 1. Location map of the research area and stratigraphic column ((A), location map of the research area; (B), well location distribution map; (C), the development of strata in the research area) [26,33,34].
Energies 17 04517 g001
Figure 2. Seismic profile of fault development near wells Y58 and S2 (The profile is shown in Figure 1 as A-A′).
Energies 17 04517 g002
Figure 3. Classification of shale lithofacies based on mineral composition.
Energies 17 04517 g003
Figure 4. Relationship between study samples S1 and TOC.
Energies 17 04517 g004
Figure 5. Shale lithofacies classification results ((A): Y58, (B): S2). Annotation: organic-rich felsic (ORF); organic-containing felsic (OCF); organic-rich mixed (ORM); organic-poor felsic (OPF); organic-containing mixed (OCM); organic-containing calcareous (OCC); organic-poor calcareous (OPC); organic-rich calcareous (ORC); organic-poor mixed (OPM); organic-rich clay (ORCL).
Energies 17 04517 g005
Figure 6. Comprehensive lithofacies classification results and proportion of each lithofacies of shale samples.
Energies 17 04517 g006
Figure 7. Fitting effect (A) and activation energy distribution (B) of hydrocarbon generation conversion rate of shale in the K1qn1 of well D402 (Ro = 0.7%, type I organic matter).
Energies 17 04517 g007
Figure 8. Conversion rate of organic matter hydrocarbon generation.
Energies 17 04517 g008
Figure 9. Comprehensive bar chart of shale hydrocarbon generation and expulsion ((A): Y58, (B): S2).
Energies 17 04517 g009
Figure 10. Gas chromatographic data of total hydrocarbons in crude oil from wells Y58 (A) and S2 (B).
Energies 17 04517 g010
Figure 11. Relationship between total hydrocarbons in chloroform asphalt “A” and S1 ((A): Y58, (B): S2).
Energies 17 04517 g011
Figure 12. Average in situ oil content and proportion of total oil content of shale in different lithofacies ((A): Y58, (B): S2).
Energies 17 04517 g012
Figure 13. HEE of different types of shale.
Energies 17 04517 g013
Figure 14. Comprehensive bar chart of shale oil biomarkers ((A): Y58, (B): S2).
Energies 17 04517 g014
Disclaimer/Publisher’s Note: The statements, opinions and data contained in all publications are solely those of the individual author(s) and contributor(s) and not of MDPI and/or the editor(s). MDPI and/or the editor(s) disclaim responsibility for any injury to people or property resulting from any ideas, methods, instructions or products referred to in the content.

