Abstract
Studies demonstrate that the reduced frequency k is influenced by the incoming wind speed U0 and the rotor speed n. As a dimensionless parameter, k characterizes the stability of the flow field, which is a critical factor affecting the performance of vertical-axis wind turbines (VAWTs). This paper investigates the impact of k on the performance of straight-blade vertical-axis wind turbines (H-VAWT). The findings indicate that 0.05 is the critical value of k. The same k results in a similar flow field structure, yet the performance changes vary with different U0. A decrease in n or an increase in U0 leads to an increase in the average value and fluctuation of k, which subsequently reduces the rotor rotation torque Cm and decreases the maximum wind energy utilization rate Cpmax. This reduction in Cpmax weakens the stability of the flow field. Additionally, the high-speed area of the blade’s trailing edge velocity trajectory at , , and expands with increasing range. Velocity dissipation in the high-speed area of the trailing edge affects the stability of the flow field within the rotor.
1. Introduction
Since the introduction of the “dual carbon” objective, enhancing wind energy efficiency has become a hot research topic [1]. Horizontal-axis wind turbines (HAWT) and vertical-axis wind turbines (VAWT) are the main devices utilizing wind energy. Compared to HAWTs, VAWTs have been developed as an important component for utilizing wind energy in urban and marine wind applications due to their simple design, adaptability to various environments, and high efficiency of wind energy conversion [2,3,4,5,6,7]. However, during the operation of VAWTs, the substantially varying angle of attack leads to unstable aerodynamic performance. The dimensionless parameter—reduced frequency () has an effect on the unstable aerodynamic performance of VAWTs based on research, which is the main factor affecting its performance [8,9].
Numerous experimental and theoretical investigations have examined the influence of reduced frequency on wind turbine performance with the rapid advancement of wind energy technology [10,11]. Nidiana et al. [12] conducted a study on the dynamic stall of VAWTs with NACA0015, and results indicate that with the increase in the reduced frequency, the calculated stall-onset angle increases. Galera et al. [13] have aimed to explore the relationship between reduced frequency, aerodynamic forces, and the torque generated by the blades. Ullah et al. [14] have also investigated the impacts of reduced frequency on the dynamic stall of VAWTs. They found that at the low angle of attacks, increasing the reduced frequency had little influence on the lift coefficient, while at a higher angle of attacks, the slope of the lift coefficient decreased with decreasing reduced frequency. Zhu et al. [9] conducted a study on the effects of the reduced frequency on the aerodynamic performance and dynamic stall behaviors of a VAWT. This investigation indicates that increasing reduced frequency can significantly affect the dynamic stall behavior and effectively improve the VAWT performance. As reduced frequency increases, the onset of dynamic stall is gradually delayed to a higher angle of attack, which effectively suppresses the separated flow.
In addition, changes in reduced frequency directly impact flow fields, such as the evolution of the tip vortex and the formation of wake structures. Li et al. [15] examined the vortex behaviors and aerodynamic forces in dynamic stall. The research has shown that leading edge vortices are sufficient to stabilize the airflow at higher reduced frequencies even when the airfoil is in the downstroke phase. Ambrogi et al. [16] investigated the unsteady separation characteristics in the turbulent boundary layer. They found that the reduced frequency has a significant effect on the transient flow-separation process. These factors significantly influence the overall energy capture efficiency of H-type vertical-axis wind turbines (H-VAWTs) [17]. Specifically, higher reduced frequencies typically result in larger unsteady aerodynamic forces, which can lead to more severe fatigue cycles in wind turbine blades. Conversely, lower reduced frequencies may result in insufficient energy capture in the wake, thereby affecting the output performance of downstream wind turbines [18].
Although considerable investigations have been carried out, it remains to be investigated how the reduced frequency affects the performance and flow field of an H-VAWT rather than an airfoil during its operation. Further research is also necessary on the effect of the critical value of the reduced frequency on H-VAWTs. The main purpose of the present work is to deepen the understanding of performance variations in H-VAWTs and the evolution of the flow field within the wind turbine influenced by reduced frequency through 3D numerical simulations.
This article is organized as follows: Section 2 covers the validation of the geometric model, the numerical simulation approach, and the comparison with field experimental data. Section 3 explores the impact of reduced frequency on H-VAWT performance and examines how this performance interacts with the internal flow field of the wind rotor. Finally, Section 4 summarizes the main achievements and conclusions.
2. Models and Methods
2.1. Physical Model
The H-VAWT model is based on a design from Uppsala University, as comprehensive field experiment data are available [19,20]. The detailed parameters of the H-VAWT are outlined in Table 1, and the numerical model is shown in Figure 1. The rotor shaft and blade bracket are excluded from the numerical model to create high-quality structured grids [21]. Figure 2 shows the top view of the model along with an analysis of blade speed.

Table 1.
Main parameters of 12 kW H-VAWT.
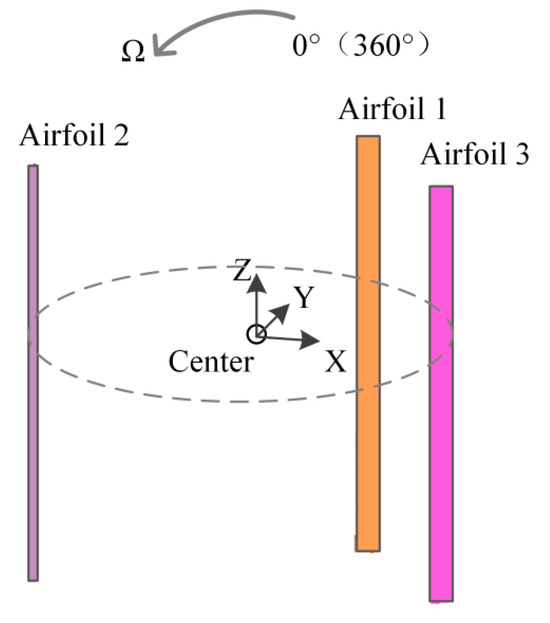
Figure 1.
Numerical model of the H-VAWT.
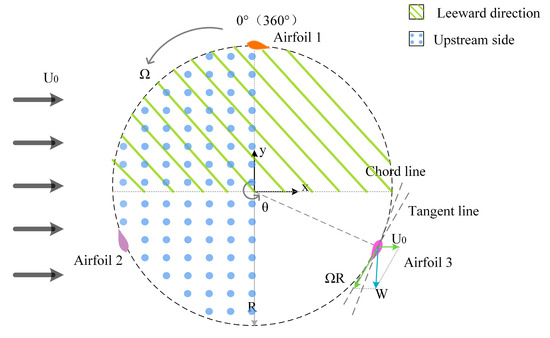
Figure 2.
Top view of H-VAWT wind rotor.
2.2. Turbulence Model
This research employed a 3D Unsteady Reynolds-averaged Navier–Stokes (URANS) method due to the 3D loss of power coefficient () in VAWTs, which cannot be ignored as shown in the investigation of Madrigal et al. [22]. Balduzzi et al. [9] demonstrated that the 3D URANS method can effectively analyze complex aerodynamic phenomena, including dynamic stalls. Therefore, the 3D URANS method has been widely employed for studying the aerodynamic characteristics of H-VAWTs [23,24,25,26,27,28,29].
To ensure consistency with field experiment data, the turbulence model is applied. Li et al. [24] published a review on numerical simulation of VAWTs, summarizing the application of turbulence models. turbulence model retains the advantages of model and model [30]. Daroczy et al. [14] demonstrated the suitability of the model for numerically simulating H-VAWTs. When the 3D method is used for numerical simulation, the calculated results of are well consistent with the experimental values at low tip speed ratios [31]. Compared with Direct Numerical Simulation and Large Eddy Simulation, the turbulence model has been proven to reduce computational resources as well as ensure accuracy [9,32].
Therefore, the turbulence model is applied in this research.
2.3. Grid Division
The size of the computational domain and grid configuration were determined based on prior research [31,33]. The key grid features are summarized in Table 2, and the grid division is illustrated in Figure 3. The computational domain is divided into a stationary domain and a rotating domain. Figure 3a shows an overall schematic of the grid division, while Figure 3b shows the grid at the interface. Figure 3c shows that O-type segmentation is employed near the wall to maintain grid orthogonality. To ensure y+ < 1, the boundary grid includes 30 layers near the wall, with the first layer grid height controlled at 2 × 10⁻⁵ m and a growth rate of 1.05. The boundary layer grid is shown in Figure 3d. The boundary conditions are set to facilitate data transfer between the two computational domains, as shown in Figure 4.

Table 2.
Grid features.
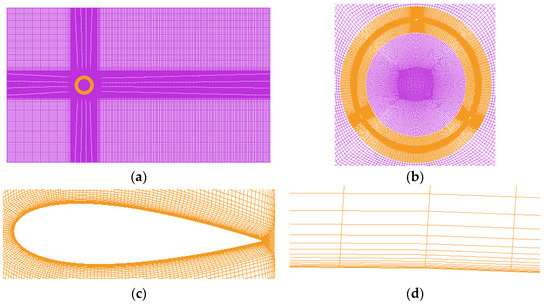
Figure 3.
Grid division within the computational domain. (a) Overall view of the domain. (b) Interface grids. (c) Grids around the airfoil. (d) Boundary grids (The purple color means Stationary domain and the orange color means Rotating domain).
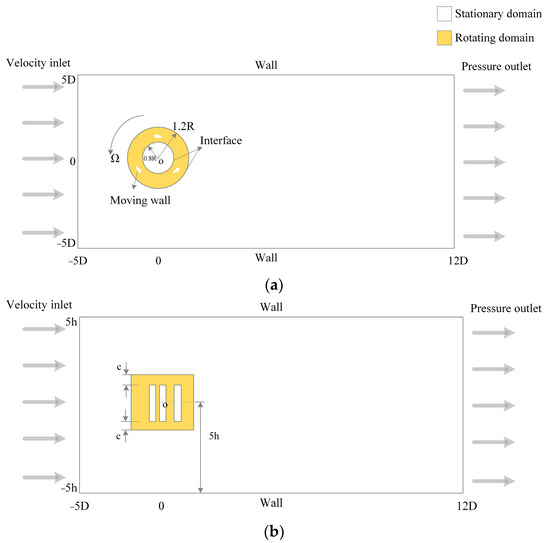
Figure 4.
Schematic diagram of boundary conditions. (a) Top view. (b) Side view.
2.4. Result Verification
In this research, the ANSYS FLUENT software 15.0 is used to solve the governing equations. The second-order upwind scheme is employed for the spatial discretization of both the URANS and turbulence equations. Temporal discretization is achieved through a bounded second-order implicit scheme, which guarantees high simulation accuracy and theoretical unconditional stability for the time step. The pressure-based coupled approach is utilized, directly solving the Navier–Stokes equations using pressure within the implicit discrete momentum equation. This coupled algorithm is preferred over pre-corrector–corrector systems like the SIMPLE algorithms due to its superior robustness and convergence, particularly for large time steps or grids of poor quality. This method is chosen for its effectiveness in pressure–velocity coupling and its reduced sensitivity to time discretization [9]. Based on previous studies, the time step is set to 720 steps per revolution with 20 internal iterations per step [24]. This setup corresponds to a 0.5° azimuthal increment of blade rotation for each time step.
To verify the reliability of the numerical calculations, the power coefficient was computed under different tip speed ratios () and rated rotational speeds by varying the incoming wind speed (). The working condition settings are detailed in Table 3. The errors between these calculated values and experimental results were compared as shown in Figure 5. The error between the calculated results and the experimental data [19] is less than 10%, indicating that the calculation method is accurate.

Table 3.
Turbulence model and algorithm accuracy verification condition setting.
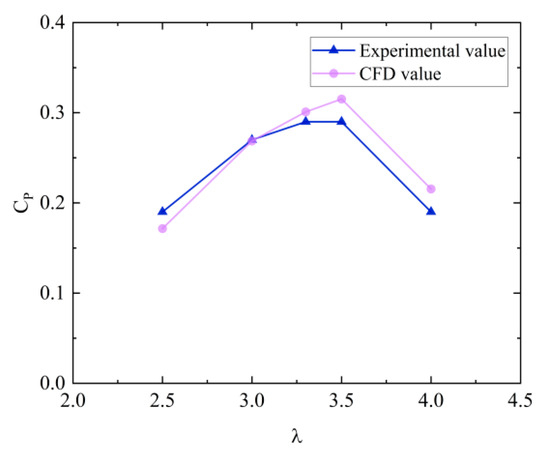
Figure 5.
Verification of the results.
To verify the accuracy of the turbulence model and computational grid, experimental results were used as a reference [19]. The grid independence of the numerical calculations was assessed under the conditions of , a rotational speed () of 127 rpm, and an incoming wind speed of 12 m/s. Since the grid size near the blade significantly impacts the accuracy of the results, particular attention was given to the number of grid nodes near the airfoil during the grid independence verification [34]. The results of the grid independent validation are shown in Figure 6. To balance accuracy and computational efficiency, this study employs 200 nodes on the airfoil surface and 30 boundary layers; the total number of grids is .
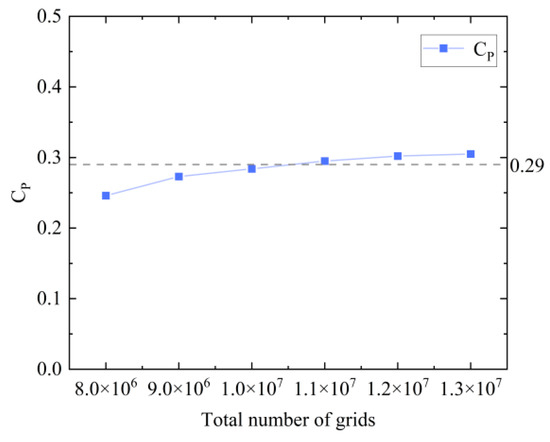
Figure 6.
Grid independence test.
3. Results and Discussion
3.1. Variations of Reduced Frequency k during H-VAWT Operation
The tip speed ratio is defined as:
The velocity decomposition is conducted as the triangle shown in Figure 2, in which the and the resultant velocity at different azimuths can be calculated using the following expressions:
The reduced frequency () significantly affects the aerodynamic performance of the airfoil during pitch motion. This parameter is typically used to characterize the degree of unsteadiness and describe unsteady aerodynamic problems [35]:
where the relationship between angular velocity and rotating speed is:
To investigate the influence of , the angle of attack () and the azimuth angle of the resultant velocity () can be maintained constant by keeping the incoming wind speed and tip speed ratio fixed. Different values of can be achieved by varying the rotational speed n. The settings for the case study, including the average value of ( and its fluctuation range within an operational cycle (, are detailed in Table 4. The wind speeds were set from the verified operating conditions in Table 3, and the rotational speeds were set based on the range of speeds common to H-VAWTs.

Table 4.
Settings of different case studies.
The variation of with is illustrated in Figure 7, and the correlation between each parameter is shown in Figure 8. Under constant rotational speed and varying incoming wind speed , when , the blade tip speed is opposite to the direction of , resulting in the minimum relative wind speed and the minimum value of :. Conversely, when , the blade tip speed aligns with the direction of , resulting in the maximum and the maximum value of k: . Under the same and different values of , , and , the fluctuations in increase with , while shows the opposite trend. According to Figure 8, the correlation between and is 0.72, whereas its correlation with is −0.58. This indicates that as increases or decreases, the incoming flow struggles to enter the wind rotor, leading to a more stable flow field inside the wind rotor and a corresponding decrease in .
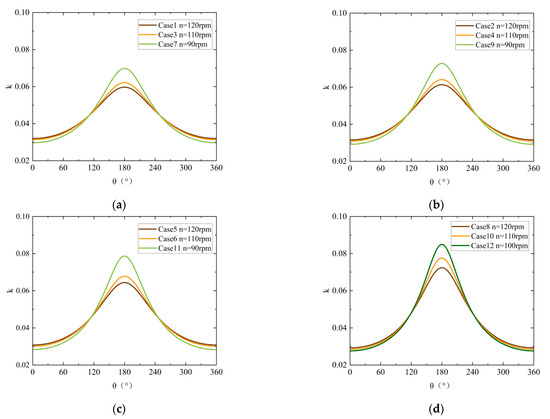
Figure 7.
Variation of with azimuth angle . (a) = 11.4 m/s. (b) = 12.1 m/s. (c) = 13.3 m/s. (d) = 16.0 m/s.
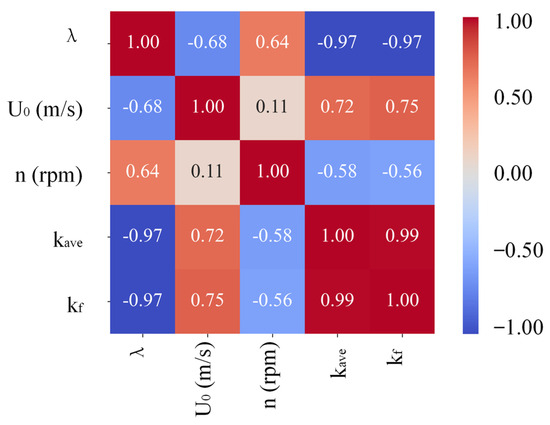
Figure 8.
Correlations between different parameters.
3.2. Effect of Reduced Frequency k on H-VAWT Performance
H-VAWT performance is evaluated by the rotation moment coefficient () and wind energy utilization factor (), which are defined as follows:
where represents the instantaneous torque at a given azimuth angle . The wind wheel torque denotes the average value of over a single rotation. The numerator represents the power of H-VAWT, while the denominator refers to the kinetic energy of the wind passing through the wind wheel.
Combining with Equation (4), the relationship between , , and can be expressed in the form below:
Figure 9 shows the variation of the with . Under a constant rotational speed , the overall value of increases as the reduced frequency rises. Specifically, for every 1% increase of , the maximum value of increases by up to 22.39%. However, the rate of increase slows as continues to rise. This deacceleration may be attributed to increased airflow disturbance losses caused by greater interaction between the blade and the airflow at higher values, which diminishes the growth rate of the maximum . Conversely, the minimum value of increases by approximately 25.22% for every 1% increase in . When , a decrease in results in a reduction in the minimum . This correlation suggests that higher may enhance momentum transfer and aerodynamic effects, leading to improved performance in terms of torque generation.
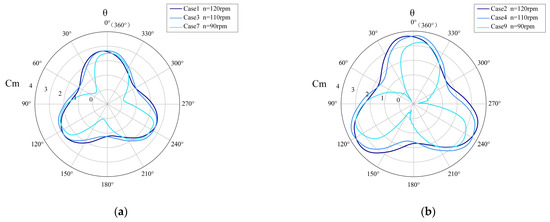
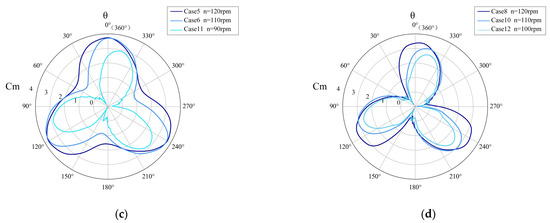
Figure 9.
Variation of moment coefficient with azimuth angle . (a) = 11.4 m/s. (b) = 1 2.1 m/s. (c) = 13.3 m/s. (d) = 16.0 m/s.
The variation of precedes the changes in the reduced frequency . Figure 9 indicates that the maximum value of is obtained when the H-VAWT operates near 0°, 120°, and 240°. The is reached when the H-VAWT operates at 0° (or 360°). During the operational cycle, the angle at which the maximum occurs precedes by about 16%. The minimum value of is obtained when the H-VAWT runs near 60°,180°, and 300°. The is obtained when the H-VAWT runs at 180°. During the operational cycle, the angle at which the minimum occurs precedes by about 15%. Under the same rotational speed , higher values of cause the extreme values of to occur earlier in the cycle. The complex changes in the flow field during the rotation of the blades introduce a lag effect on the lift and torque generated by the blades. That means that the variation in first influences the flow field, which then manifests in the performance changes in the H-VAWT. The detailed changes in the flow field near the blades will be discussed in Section 3.3.
Figure 10 shows the variation of the with . The trend of is the same as that of . When , the angle at which obtains the extreme value lags behind . However, when , the angle at which obtains the extreme value precedes . For and at the same rotational speed , shows an increasing trend as and increase. For every 1% increase in , the maximum increase in is 20%, and the maximum increases in are 18%. When and remains constant, begins to decline as and increase, and the growth rate of slows down. exhibits significant changes during the startup phase when , which in turn affects . In the startup phase, the rapidly changing blade angle may cause flow separation, forming vortices and turbulence. These unstable flow field structures significantly impact lift and torque.
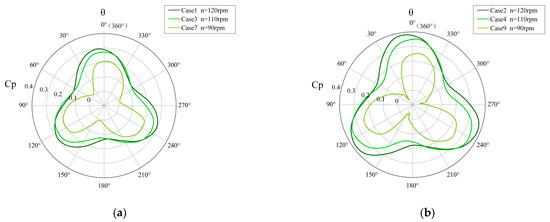
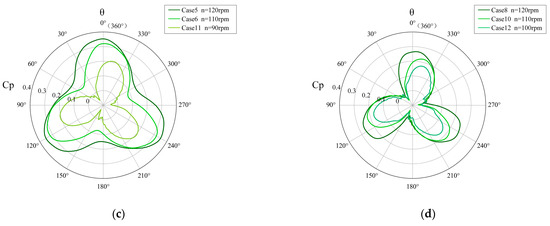
Figure 10.
Variations of wind energy utilization rate with azimuth angle . (a) = 11.4 m/s. (b) = 12.1 m/s. (c) = 13.3 m/s. (d) = 16.0 m/s.
Figure 11 shows the correlation between , and . As shown in Table 4, for each operating condition, , so shows a strong positive correlation with the , and . As and increase, the instability of the flow field becomes larger, resulting in a negative growth phenomenon of the performance indexes and .
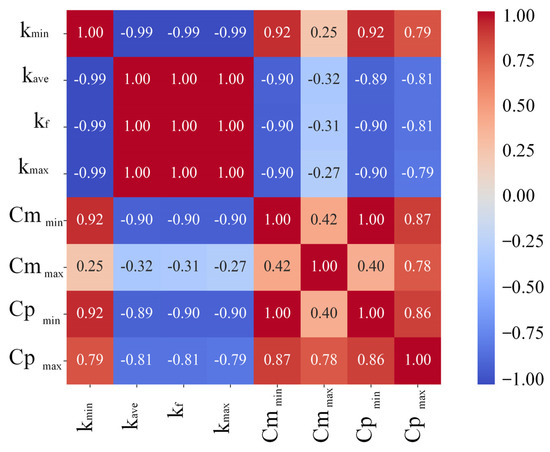
Figure 11.
Correlation between. , , and .
3.3. Effect of Reduced Frequency k on the Flow Field near the Blade
To investigate the H-VAWT aerodynamic performance, this section examines the changes in the flow field within the wind wheel influenced by the average reduced frequency , revealing the interaction between the flow field near the blades and the overall performance of the H-VAWT. To avoid the influence of tip vortices, the analysis in this study was conducted on the Z = 0 plane.
Figure 12 shows the variations in the flow field pattern around the blade with at the position of . It is observed that there is a high-speed area located at 1/10 of the chord length behind the trailing edge, but the velocity trajectory behind the trailing edge generally exhibits a velocity loss. When , the velocity loss trajectory of the blade’s trailing edge at is longer, and this trajectory intersects with the velocity loss trajectory of the wind rotor. Consequently, the flow field around the blade is significantly affected by the trailing edge velocity loss, and the velocity loss area on the lower surface of the blade extends beyond the airfoil range. As and increase, the velocity loss trajectory of the blade’s trailing edge at becomes shorter. The intersection point of the trailing edge velocity loss trajectory and the wind rotor’s trajectory moves back, eventually separating from the blade. When , the trailing edge velocity loss trajectory within the wind rotor intersects with the velocity loss trajectory at , thereby reducing its impact on the flow field around the blade. Therefore, the velocity loss area on the lower surface of the blade gradually shrinks to within the airfoil range.
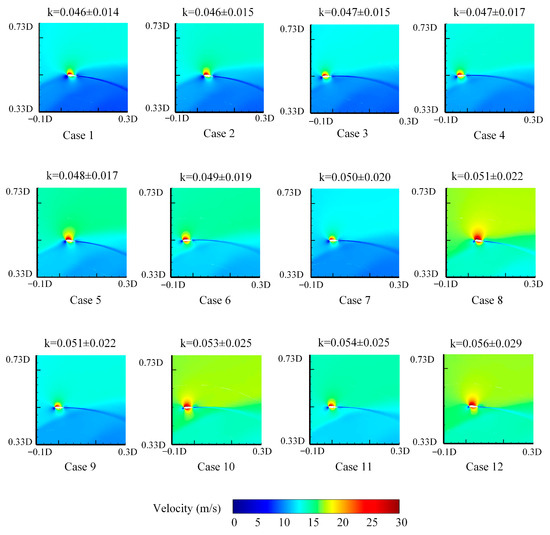
Figure 12.
Variations in the flow field around blades with k at .
Figure 13 shows the variation in the flow field around the blade with at . Due to inertia, the high-speed area of the velocity trajectory behind the blade’s trailing edge becomes longer compared to the position at and the high-speed area on the upper surface of the blade gradually moves forward toward the leading edge. When , the high-speed trajectory of the blade’s trailing edge at is distinctly elongated, and the high-speed area behind the trailing edge is smaller than the airfoil. A low-speed area appears near the inner region of the wind rotor in the wake, intersecting with the lower surface of the wing, and a low-speed area is also present on the upper surface of the wing. As and increase, the low-speed area on both the upper and lower surfaces of the wing decreases in size. Simultaneously, the high-speed areas at the leading and trailing edges of the airfoil expand and gradually tilt towards the inner side of the wind rotor. When , velocity dissipation begins to appear on the windward side of the high-speed trajectory of the trailing edge at , but this does not affect the stability of the flow field within the wind rotor. The low-speed area in the wake near the inner region of the wind rotor becomes separated from the lower surface of the wing. When at , the high-speed trajectory of the blade’s trailing edge becomes deformed due to velocity dissipation on the windward side, affecting the stability of the flow field within the wind rotor. The high-speed area behind the trailing edge gradually becomes larger than the area of the airfoil. The low-speed area on the lower surface of the wing gradually detaches along the high-speed area in the wake, forming a vortex. The high-speed area at the leading edge of the airfoil moves further towards the inside of the wind rotor.
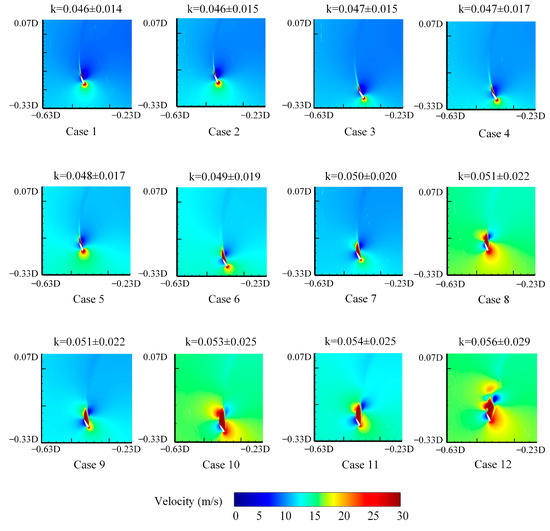
Figure 13.
Changes in the flow field around blades with k at .
Figure 14 shows the variation in the flow field around the blade with at . When , the high-speed trajectory of the blade’s trailing edge is noticeably elongated, and the high-speed area behind the trailing edge is smaller than the airfoil. There are also low-speed areas on both the upper and lower surfaces of the airfoil. As and increase, the low-speed areas on the upper and lower surfaces of the airfoil decrease in size. Concurrently, the high-speed areas at the leading and trailing edges of the airfoil expand and gradually tilt towards the outer side of the wind rotor. When , velocity dissipation starts to appear on the windward side of the high-speed trajectory of the blade’s trailing edge at . The high-speed areas expand, but the stability of the flow field outside the wind rotor remains unaffected. The low-speed area on the upper surface of the airfoil begins to separate from the airfoil. For , the high-speed trajectory of the blade’s trailing edge at becomes deformed due to velocity dissipation on the windward side, which affects the stability of the flow field both inside and outside the wind rotor. The high-speed area behind the trailing edge gradually becomes larger than the airfoil area. The low-speed area on the upper surface of the airfoil detaches along the high-speed area in the wake, forming a vortex. Additionally, the high-speed area at the leading edge of the airfoil moves towards the outside of the wind rotor.
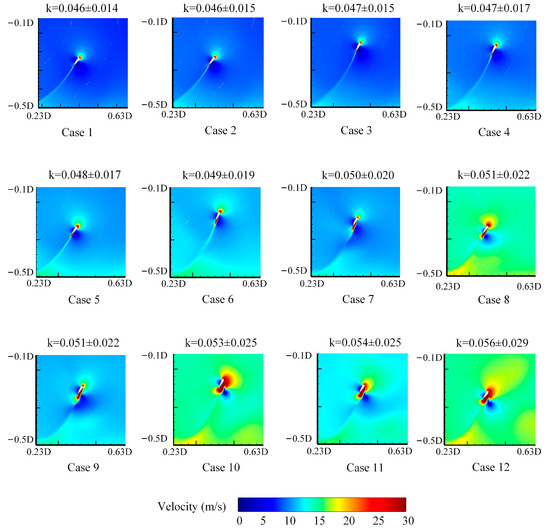
Figure 14.
Changes in the flow field around blades with k at .
3.4. Effect of Reduced Frequency k on the Pressure around the Blade
To investigate the H-VAWT performance, this section examines the changes in the pressure around the blade influenced by . To avoid the influence of tip vortices, the analysis in this study was conducted on the Z = 0 plane.
Figure 15 shows that at , the pressure around the blade changes with . There is no significant difference in pressure around the blades for all operating conditions. The pressure is higher at the leading and trailing edges of the airfoil, and the area of the low-pressure region is larger on the upper airfoil than on the lower airfoil. The airflow hits the leading edge of the blade directly, resulting in higher pressure in the leading edge area. At the same time, the airflow converges at the trailing edge after passing through the blade surface, forming a larger dynamic pressure region, so the pressure at the trailing edge is also higher. The response of the upper and lower airfoils to the airflow disturbance is more consistent, and the influence on the pressure distribution under different working conditions is small, resulting in insignificant differences in the pressure distribution.
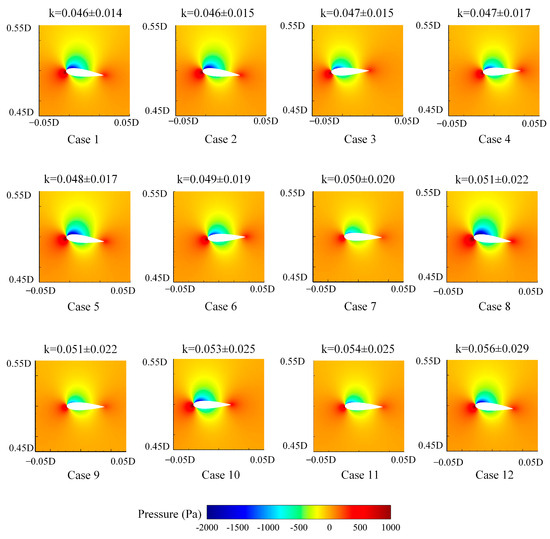
Figure 15.
Changes in the pressure around blades with k at .
Figure 16 shows that at , the pressure around the blade changes with . As the H-VAWT rotates, the upper airfoil rotates to the windward side, where it is directly hit by the incoming flow, and the upper airfoil pressure is higher. The lower airfoil pressure becomes significantly smaller. As increases, the low-pressure region expands at the trailing edge. When , the low-pressure area at the trailing edge becomes larger, and low-pressure vortices are gradually developed. Under the influence of higher reduced frequency, the airflow cannot attach to the airfoil surface effectively, and the resulting separation vortex or vortex area becomes significant. These low-pressure vortices not only affect the pressure distribution of the blade, but also lead to additional aerodynamic drag and vibration.
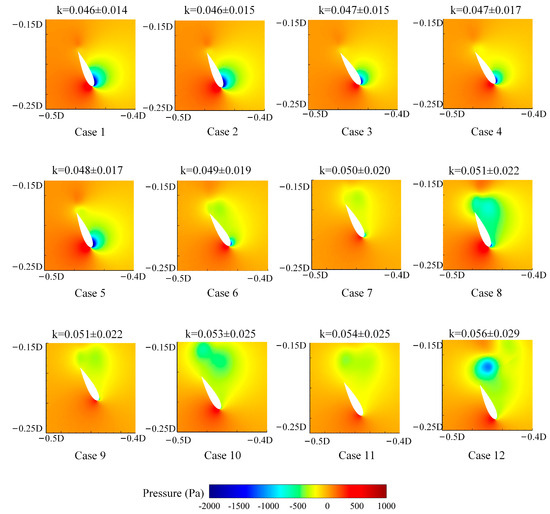
Figure 16.
Changes in the pressure around blades with k at .
Figure 17 shows that at , the pressure around the blade changes with . As the H-VAWT rotates, the lower airfoil rotates to the windward side. As a result, the lower airfoil has a distinct high-pressure region, while the upper airfoil develops a low-pressure region. With the increase of , the low-pressure region shifts and expands towards the trailing edge. When , the low-pressure area becomes larger at the trailing edge, and the low-pressure vortex develops gradually.
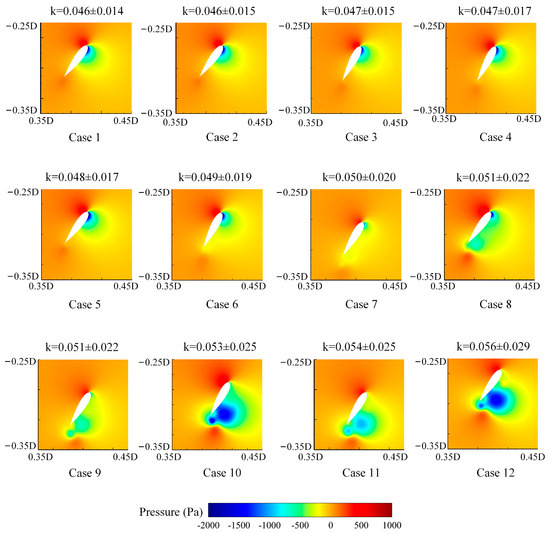
Figure 17.
Changes in the pressure around blades with k at .
Based on the H-VAWT, some researchers have investigated the boundary layer separation characteristics and performance of the optimized blades in different reduced frequencies [36,37,38,39]. Kiefer et al. [40] found that beyond the critical reduced frequency, neither the load magnitude nor the vortex evolution is related to the reduced frequency but depends on the geometry of the motion and the convective time scale. This indicates that at the same reduced frequency, different blade designs exhibit different performance and flow field evolution than H-VAWTs. However, both the aerodynamic performance and the flow field structure change at critical values. Therefore, some of the conclusions drawn from this investigation may be applicable with other blade shapes.
4. Conclusions
By adjusting and , the turbulence model was employed to investigate the influence of on the performance of H-VAWT and explore the interaction between performance and flow field dynamics. The findings indicate that 0.05 is the critical value of .The main achievements can be summarized as follows:
- The variations in : This parameter is affected by both and , with exhibiting a greater impact. As increases or decreases, the incoming flow struggles to enter the wind rotor, stabilizing the flow field within the rotor and causing to decline.
- Impact of on H-VAWT performance: When , a 1% increase in can lead to a maximum increase of 22.39%. Conversely, the minimum value of increases by 25.22% for every 1% increase in . As 1% increase in can maximally increase by 20%, and by 18%. For , higher enhances momentum transfer and aerodynamic effects, leading to a decrease in performance.
- Impact of on the flow field near the blades: The change in the flow field can be visualized as is the critical value. The stability of the flow field in the vicinity of the blades is weakened with the increase of . The structure of the flow field is the same when is the same. When , there is an obvious trajectory of blade trailing edge velocity loss inside the wind turbine, and does not affect the flow field inside the wind turbine; when , there is still a trajectory of blade trailing edge velocity loss inside the wind turbine, and the velocity of blade trailing edge at the position of airfoil 2 is significantly increased by the influence of . When , there is no blade trailing edge velocity loss trajectory inside the wind turbine, and flow separation occurs at airfoil 2 and airfoil 3, and vortices are formed.
- Impact of on pressure near the blades: The change in pressure around the blade is not significant at . As the H-VAWT rotates, the pressure difference between the upper and lower airfoil surfaces of the blade becomes larger, the airflow disturbance is enhanced, and the pressure begins to change with . The pressure is higher at the trailing edge of the blade than at the trailing edge of the blade. As increases, the low-pressure region expands at the trailing edge. When , the low-pressure region becomes significantly larger at the trailing edge, and a low-pressure vortex develops gradually.
- Directions for future work: The current investigation focuses on the effect of on the performance of H-VAWTs and the flow field near the blades. In the future, the effects of on the wake field of H-VAWTs and the relationships between the incoming flow and wake will be further investigated. In addition, different blade designs might have altered the conclusions of this investigation. This issue will also be discussed to broaden the application of the investigation.
Author Contributions
Writing—writing, review and editing, N.Y.; methodology, C.Y.; conceptualization, S.L. All authors have read and agreed to the published version of the manuscript.
Funding
This research was funded by National Natural Science Foundation of China 12062012.
Data Availability Statement
The data presented in this study are available on request from the corresponding author.
Acknowledgments
The authors would like to express their sincere gratitude to the National Natural Science Foundation of China 12062012.
Conflicts of Interest
The authors declare no conflicts of interest.
Nomenclature
| Variables | Abbreviations | ||
| Chord length [m] | CFD | Computational Fluid Mechanics | |
| Moment coefficient [-] | HAWT | Horizontal-axis Wind Turbines | |
| Maximum value of moment coefficient [-] | H-VAWT | H-type Vertical-axis Wind Turbines | |
| Minimum value of moment coefficient [-] | URANS | Unsteady Reynolds-Averaged Navier–Stokes | |
| Power coefficient | VAWT | Vertical-axis Wind Turbines | |
| Maximum value of power coefficient [-] | |||
| Minimum value of power coefficient [-] | |||
| D | Diameter of the wind turbine [m] | ||
| Torque [N·m] | |||
| h | Height of blade [m] | ||
| k | Reduced frequency [-] | ||
| Average of reduced frequency [-] | |||
| Fluctuation of reduced frequency [-] | |||
| Maximum value of reduced frequency [-] | |||
| Minimum value of reduced frequency [-] | |||
| Moment [N·m] | |||
| Rotation speed of the wind turbine [rpm] | |||
| Radius of the wind turbine [m] | |||
| Velocity of wind [m/s] | |||
| Resultant velocity [m/s] | |||
| Rotation speed of the wind turbine [rad/s] | |||
| Angle of attack | |||
| Pitch [°] | |||
| Azimuth angle [°] | |||
| Tip speed ratio [-] | |||
| Air density [kg/m3] | |||
References
- Xinhua News Agency Beijing. Peak Carbon Action Program by 2030. People’s Daily, 27 October 2021.
- Vadhyar, A.; Sridhar, S.; Reshma, T.; Radhakrishnan, J. A Critical Assessment of the Factors Associated with the Implementation of Rooftop VAWTs: A Review. Energy Convers. Manag. X 2024, 22, 100563. [Google Scholar] [CrossRef]
- Apelfröjd, S.; Eriksson, S.; Bernhoff, H. A Review of Research on Large Scale Modern Vertical Axis Wind Turbines at Uppsala University. Energies 2016, 9, 570. [Google Scholar] [CrossRef]
- Hand, B.; Cashman, A. A Review on the Historical Development of the Lift-Type Vertical Axis Wind Turbine: From Onshore to Offshore Floating Application. Sustain. Energy Technol. Assess. 2020, 38, 100646. [Google Scholar] [CrossRef]
- Škvorc, P.; Kozmar, H. Wind Energy Harnessing on Tall Buildings in Urban Environments. Renew. Sustain. Energy Rev. 2021, 152, 111662. [Google Scholar] [CrossRef]
- Borg, M.; Shires, A.; Collu, M. Offshore Floating Vertical Axis Wind Turbines, Dynamics Modelling State of the Art. Part I: Aerodynamics. Renew. Sustain. Energy Rev. 2014, 39, 1214–1225. [Google Scholar] [CrossRef]
- Borg, M.; Collu, M. Offshore Floating Vertical Axis Wind Turbines, Dynamics Modelling State of the Art. Part III: Hydrodynamics and Coupled Modelling Approaches. Renew. Sustain. Energy Rev. 2015, 46, 296–310. [Google Scholar] [CrossRef]
- Boye, T.E.; Xie, Z.T. Aerodynamics of a Pitching Wind Turbine Blade at High Reduced Frequencies. J. Wind Eng. Ind. Aerodyn. 2022, 223, 104935. [Google Scholar] [CrossRef]
- Zhu, C.; Yang, H.; Qiu, Y.; Zhou, G.; Wang, L.; Feng, Y.; Shen, Z.; Shen, X.; Feng, X.; Wang, T. Effects of the Reynolds Number and Reduced Frequency on the Aerodynamic Performance and Dynamic Stall Behaviors of a Vertical Axis Wind Turbine. Energy Convers. Manag. 2023, 293, 117513. [Google Scholar] [CrossRef]
- Huang, M.; Vijaykumar Patil, Y.; Sciacchitano, A.; Ferreira, C. Experimental Study of the Wake Interaction between Two Vertical Axis Wind Turbines. Wind Energy 2023, 26, 1188–1211. [Google Scholar] [CrossRef]
- Hara, Y.; Jodai, Y.; Okinaga, T.; Furukawa, M. Numerical Analysis of the Dynamic Interaction between Two Closely Spaced Vertical-Axis Wind Turbines. Energies 2021, 14, 2286. [Google Scholar] [CrossRef]
- Rosado Hau, N.; Ma, L.; Ingham, D.; Pourkashanian, M. A Critical Analysis of the Stall Onset in Vertical Axis Wind Turbines. J. Wind Eng. Ind. Aerodyn. 2020, 204, 104264. [Google Scholar] [CrossRef]
- Galera-Calero, L.; Blanco, J.M.; Iglesias, G. Numerical Modelling of a Floating Wind Turbine Semi-Submersible Platform. Appl. Sci. 2021, 11, 11270. [Google Scholar] [CrossRef]
- Ullah, T.; Sobczak, K.; Liśkiewicz, G.; Khan, A. Two-Dimensional URANS Numerical Investigation of Critical Parameters on a Pitch Oscillating VAWT Airfoil under Dynamic Stall. Energies 2022, 15, 5625. [Google Scholar] [CrossRef]
- Li, Z.; Feng, L.; Karbasian, H.R.; Wang, J.; Kim, K.C. Experimental and Numerical Investigation of Three-Dimensional Vortex Structures of a Pitching Airfoil at a Transitional Reynolds Number. Chin. J. Aeronaut. 2019, 32, 2254–2266. [Google Scholar] [CrossRef]
- Ambrogi, F.; Piomelli, U.; Rival, D.E. Characterization of Unsteady Separation in a Turbulent Boundary Layer: Mean and Phase-Averaged Flow. J. Fluid Mech. 2022, 945, A10. [Google Scholar] [CrossRef]
- Maali Amiri, M.; Shadman, M.; Estefen, S.F. A Review of Numerical and Physical Methods for Analyzing the Coupled Hydro–Aero–Structural Dynamics of Floating Wind Turbine Systems. J. Mar. Sci. Eng. 2024, 12, 392. [Google Scholar] [CrossRef]
- Santiago, R.A.d.F.; Barbosa, N.B.; Mergulhão, H.G.; de Carvalho, T.F.; Santos, A.A.B.; Medrado, R.C.; de Melo Filho, J.B.; Pinheiro, O.R.; Nascimento, E.G.S. Data-Driven Models Applied to Predictive and Prescriptive Maintenance of Wind Turbine: A Systematic Review of Approaches Based on Failure Detection, Diagnosis, and Prognosis. Energies 2024, 17, 1010. [Google Scholar] [CrossRef]
- Kjellin, J.; Bülow, F.; Eriksson, S.; Deglaire, P.; Leijon, M.; Bernhoff, H. Power Coefficient Measurement on a 12 KW Straight Bladed Vertical Axis Wind Turbine. Renew Energy 2011, 36, 3050–3053. [Google Scholar] [CrossRef]
- Rossander, M.; Dyachuk, E.; Apelfröjd, S.; Trolin, K.; Goude, A.; Bernhoff, H.; Eriksson, S. Evaluation of a Blade Force Measurement System for a Vertical Axis Wind Turbine Using Load Cells. Energies 2015, 8, 5973. [Google Scholar] [CrossRef]
- Sheidani, A.; Salavatidezfouli, S.; Stabile, G.; Rozza, G. Assessment of URANS and LES Methods in Predicting Wake Shed behind a Vertical Axis Wind Turbine. J. Wind Eng. Ind. Aerodyn. 2023, 232, 105285. [Google Scholar] [CrossRef]
- Madrigal Avalos, G.; Rosado Hau, N.; Quintal-Palomo, R.; Ordóñez López, E.E.; Gamboa-Marrufo, M.; Escalante Soberanis, M.A. Aerodynamic Techniques to Mitigate the 3D Loss in the Power Coefficient of Vertical Axis Wind Turbines. Energy Convers. Manag. 2024, 311, 118507. [Google Scholar] [CrossRef]
- Zheng, X.; Wang, H.; Xu, W.; Gao, Z.; Leng, J.; Li, Y. Aerodynamic Responses of Vertical-Axis Wind Turbine Foil to Different Vortex Shedding Patterns. Kongqi Donglixue Xuebao/Acta Aerodyn. Sin. 2023, 41, 26–34. [Google Scholar] [CrossRef]
- Li, Y.; Yang, S.; Feng, F.; Tagawa, K. A Review on Numerical Simulation Based on CFD Technology of Aerodynamic Characteristics of Straight-Bladed Vertical Axis Wind Turbines. Energy Rep. 2023, 9, 4360–4379. [Google Scholar] [CrossRef]
- Amiri, M.M.; Shadman, M.; Estefen, S.F. A Review of Physical and Numerical Modeling Techniques for Horizontal-Axis Wind Turbine Wakes. Renew. Sustain. Energy Rev. 2024, 193, 114279. [Google Scholar] [CrossRef]
- Zhao, F.; Ji, X.; Shyy, W.; Xu, K. Direct Modeling for Computational Fluid Dynamics and the Construction of High-Order Compact Scheme for Compressible Flow Simulations. J. Comput. Phys. 2023, 477, 111921. [Google Scholar] [CrossRef]
- Müller, S.; Muhawenimana, V.; Wilson, C.A.M.E.; Ouro, P. Experimental Investigation of the Wake Characteristics behind Twin Vertical Axis Turbines. Energy Convers. Manag. 2021, 247, 114768. [Google Scholar] [CrossRef]
- Mirsane, R.S.; Rahimi, M.; Torabi, F. Development of a Novel Analytical Wake Model behind HAWT by Considering the Nacelle Effect. Energy Convers. Manag. 2024, 301, 118031. [Google Scholar] [CrossRef]
- Yang, F.; Chang, P.; Jian, H.; Lv, Y.; Tang, F.; Jin, Y. Numerical Analysis of Unsteady Internal Flow Characteristics of Impeller-Guide Vane in a Vertical Axial Flow Pump Device. Front. Energy Res. 2022, 10, 935888. [Google Scholar] [CrossRef]
- Menter, F.R. Two-Equation Eddy-Viscosity Turbulence Models for Engineering Applications. AIAA J. 1994, 32, 1598–1605. [Google Scholar] [CrossRef]
- Rezaeiha, A.; Montazeri, H.; Blocken, B. CFD Analysis of Dynamic Stall on Vertical Axis Wind Turbines Using Scale-Adaptive Simulation (SAS): Comparison against URANS and Hybrid RANS/LES. Energy Convers. Manag. 2019, 196, 1282–1298. [Google Scholar] [CrossRef]
- Gharali, K.; Johnson, D.A. Numerical Modeling of an S809 Airfoil under Dynamic Stall, Erosion and High Reduced Frequencies. Appl. Energy 2012, 93, 45–52. [Google Scholar] [CrossRef]
- Wang, W.H.; Zhang, K.D.; Zheng, R.S.; Wang, L.L.; Du, Y.Z.; Huang, Y. Experimental and Numerical Analysis on the Characteristics of Flow Field and Precession Moment in Fluid Momentum Wheel with Driven Pump. Ocean Eng. 2024, 293, 116731. [Google Scholar] [CrossRef]
- Leishman, J.G. Principles of Helicopter Aerodynamics, 2nd ed.; Cambridge University Press: New York, NY, USA, 2006. [Google Scholar]
- Jemal, T.; Shimels, S.; Ali, Y.; Fatoba, S.O. Impact of Turbulent Flow on H-Type Vertical Axis Wind Turbine Efficiency: An Experimental and Numerical Study. Int. J. Heat Technol. 2023, 41, 1513–1520. [Google Scholar] [CrossRef]
- Masdari, M.; Mousavi, M.; Tahani, M. Dynamic Stall of an Airfoil with Different Mounting Angle of Gurney Flap. Aircr. Eng. Aerosp. Technol. 2020, 92, 1037–1048. [Google Scholar] [CrossRef]
- Raul, V.; Leifsson, L. Surrogate-Based Aerodynamic Shape Optimization for Delaying Airfoil Dynamic Stall Using Kriging Regression and Infill Criteria. Aerosp. Sci. Technol. 2021, 111, 106555. [Google Scholar] [CrossRef]
- Siva Viknesh, S.; Poddar, K. Active Control of Separated Flow on a Symmetric Airfoil by Pitching Oscillation. Phys. Fluids 2021, 33, 087115. [Google Scholar] [CrossRef]
- Ahmad, M.; Shahzad, A.; Akram, F.; Ahmad, F.; Shah, S.I.A. Design Optimization of Double-Darrieus Hybrid Vertical Axis Wind Turbine. Ocean Eng. 2022, 254, 111171. [Google Scholar] [CrossRef]
- Kiefer, J.; Brunner, C.E.; Hansen, M.O.L.; Hultmark, M. Dynamic Stall at High Reynolds Numbers Induced by Ramp-Type Pitching Motions. J. Fluid Mech. 2022, 938, A10. [Google Scholar] [CrossRef]
Disclaimer/Publisher’s Note: The statements, opinions and data contained in all publications are solely those of the individual author(s) and contributor(s) and not of MDPI and/or the editor(s). MDPI and/or the editor(s) disclaim responsibility for any injury to people or property resulting from any ideas, methods, instructions or products referred to in the content. |
© 2024 by the authors. Licensee MDPI, Basel, Switzerland. This article is an open access article distributed under the terms and conditions of the Creative Commons Attribution (CC BY) license (https://creativecommons.org/licenses/by/4.0/).