Article

Assessment of the Profitability of a Photovoltaic Installation Cooperating with Energy Storage Using an Example of a Medium-Sized Production Company

Faculty of Management, AGH University of Krakow, 30-067 Krakow, Poland
*
Authors to whom correspondence should be addressed.
Energies 2024, 17(18), 4740; https://doi.org/10.3390/en17184740
Submission received: 6 August 2024 / Revised: 11 September 2024 / Accepted: 19 September 2024 / Published: 23 September 2024

Abstract

:
This work aims to comprehensively analyze the cooperation of an electricity storage facility with an operating photovoltaic installation in a manufacturing company regarding the efficiency and effectiveness of the device and the economic profitability of the investment. This work aims to check the benefits that can be brought by expanding the PV system with an electricity storage facility. Based on the real energy balance and the characteristics of electricity distribution in the company, profitability calculations were carried out reflecting the expected savings generated by using individual solutions. These methods allowed the authors to calculate the market value of the investment with the assumed boundary criteria and to determine the economic effectiveness of the investment. Additionally, the practical process of selecting an electricity storage facility was presented and key moments in the company’s energy report were analyzed, in which the use of a battery could bring results. Calculations showed that supplementing the described PV installation with an energy storage facility will increase the current level of self-consumption of PV energy by over 14%. The benefits translate into the final effect of energy storage operation, which brings additional annual savings for the company of approximately EUR 23,000 in the case of a weaker device and roughly EUR 40,000 in the case of a more powerful energy storage device. The proposed research could improve the planning of new industrial plants for photovoltaic installations, as well as the redesign of existing ones.

1. Introduction

In the face of gradually increasing and dynamically changing electricity prices, renewable energy sources are becoming increasingly important on the market. One of the most popular and cheapest solutions in this area is the use of a photovoltaic (PV) installation, which enables the production of electricity from solar radiation. Recent years have brought a rapid increase in the share of photovoltaic energy in the energy market, mainly due to small home photovoltaic installations, and it is noted that more and more companies are also deciding to invest in mini-photovoltaic power plants to reduce the costs associated with purchasing electricity from the power grid [1,2,3].
The most important need of the Polish power system is its flexibility. An element that can significantly increase it is energy storage facilities, which are still waiting for intensive development in Poland. In Poland, there are more and more installations producing cheap, renewable energy, but in periods of high generation, there is no possibility of fully absorbing it. The reason for this state of affairs is the lack of flexibility on the part of conventional energy and electricity consumers. Only since the beginning of this year has the record for uncollected energy from renewable energy sources been broken—it was as much as 333 GWh, which is four times more than in the whole of 2023. In the dynamic world of business, where unpredictability is becoming the norm, ensuring operational continuity is crucial. Energy banks are not only a safety buffer, but also a strategic step toward independence and cost optimization. In a world where market fluctuations are commonplace, energy storage gives companies a competitive advantage. It not only protects against potential interruptions in energy supply but also enables better resource management. This is a strategic step that can contribute to increasing the efficiency and competitiveness of the company in the market [4,5,6]. Having an energy storage facility in a company brings many benefits that can significantly affect its functioning and financial results. First of all, a photovoltaic energy bank allows for the storage of excess solar energy produced, which translates into the possibility of using it later, when the demand is greater. Thanks to this, companies can significantly reduce their costs related to energy consumption. Moreover, energy storage systems increase the independence of companies from energy suppliers and price fluctuations in the market. Thanks to this, companies have full control over their energy demand, which is especially important in situations where energy supplies are unstable or interrupted. An energy bank is a reliable source of energy that can ensure continuity of operations even in the most unpredictable circumstances. Choosing the right energy storage system is a key element of every company’s energy strategy. This is a decision that requires a thorough understanding of the specifics of the company’s operations and an analysis of its current and future energy needs. The energy storage should be adapted to the characteristics of the business processes, as well as the type and amount of energy that the company consumes. When choosing an energy storage system, it is worth paying attention to its technical parameters. First of all, it should guarantee a high level of energy efficiency and long service life. Ease of use and installation are also important, as well as the flexibility of the solution, which will allow for its possible expansion in the future. When deciding to implement an energy storage system, one cannot forget about the cost analysis. It is worth emphasizing that it is not only about the purchase price of the device but also about the costs associated with its operation, service, and possible repairs. A well-chosen energy storage system should bring financial benefits in the long term, enabling the optimization of costs related to energy consumption. To sum up, choosing the right energy storage system is a complicated process that requires a well-thought-out decision. It is important to take into account all the important factors—from the characteristics of the company, through the technical parameters of the device, to the cost analysis. It should be remembered that energy storage is an investment for years, which can significantly affect the company’s competitiveness in the market.
The issues of the work are focused on presenting the general principle of the operation of a PV system and electricity storage, the practical application of a PV installation in an enterprise, and the potential cooperation of electricity storage with a PV system based on the actual results generated by an operating photovoltaic installation. Currently, there is no clear answer as to whether the use of photovoltaic energy storage in cooperation with a PV system for the needs of an enterprise is economically justified. While the issues related to the photovoltaic installation itself are well recognized, the topic of storing photovoltaic energy using batteries and the potential advantages of such a solution for the production company is still poorly described based on the literature from the last 5 years [7,8,9,10].
With this in mind, the authors decided to analyze and evaluate this issue, and the work aimed to comprehensively analyze the cooperation of electricity storage with an operating photovoltaic installation in a production company in terms of the efficiency and effectiveness of the device and the economic profitability of the investment. This work aims to determine the benefits that can be brought by expanding the PV system with electricity storage. Based on the actual energy balance and characteristics of the distribution of electricity in the company, calculations were made that reflected the expected savings generated by using individual solutions. In addition, a practical process for selecting an electricity storage device was presented and key moments in the company’s energy report were analyzed, in which the use of a battery could bring results. The work is a form of a guide for a potential investor on how to build a photovoltaic farm for its own production needs, select an energy storage facility, and conduct an economic analysis of the investment, based on the example of a specific company. The content contained in the work should help potential investors make a rational investment decision and contribute to the development of the energy transformation in Poland.
The article is organized as follows. Section 2 contains a detailed description of the research approach based on the latest literature on the subject. Various literature and research sources were used to develop the work, including books, scientific articles, industry reports, and data sheets of device manufacturers. For the needs of the work, appropriate items were selected in such a way as to provide reliable and up-to-date information and properly present the discussed issues. Section 3 describes the research methodology used. Section 4 presents the experimental results and their interpretations. Section 5 contains the conclusions of the research, indicating its limitations, practical application, and future directions of research in this area.

2. Background

2.1. PV Photovoltaic Installations

A photovoltaic panel (PV panel) is one of the main components of an entire photovoltaic installation; it is a device that directly changes the energy of solar radiation into electricity in the form of DC direct current [8]. Each photovoltaic panel is made of individual photovoltaic cells connected in parallel or series. Depending on the type of cell, the technology with which it was made, and its dimensions, the power of one photovoltaic cell is usually from one to several Watts, with dimensions of 156 × 156 mm; therefore, to produce one PV panel, several dozen to several hundred PV cells are needed. Currently available PV panels, depending on the power they generate, have an area from 0.3 m2 to over 2 m2 [9,10,11,12]. To present the parameters of photovoltaic panels, the peak power in watts is given (Wp—maximum power in watts), which means the power supplied by the panels in standard conditions (Standard Test Conditions—cell temperature 25 °C, sunlight 1000 W/m2, radiation spectrum for atmospheric density AM = 1.5), and depending on the dimensions, it oscillates between 30 and 600 Wp. More and more often, panel manufacturers appear on the market and offer devices with higher power, even up to 1000 Wp [13,14,15]. It is worth noting, however, that in practice, PV panels very rarely operate in standard conditions; hence, their actual power during operation is lower. A photovoltaic panel, also known as a photovoltaic module, produces direct current. The level of sunlight directly affects the current at the panel output, and its value can be increased by the parallel connection of PV panels in a photovoltaic system [16]. The situation is different in the case of the voltage generated by the PV panel, because sunlight has little impact on its value, and the series and parallel connection of photovoltaic cells in the PV module is used to regulate the voltage. In off-grid installations, i.e., those that are not connected to the network power engineering, PV panels operate at a voltage of 12 V or 24 V, while for on-grid installations (connected to the power grid) the voltage is 240 V or more [17,18,19].
Photovoltaic panels consist of successively applied layers of materials and elements such as foils, PV cells, glass, frames, and underlays, which is why their structure is layered. Due to the structure of PV panels, a basic division can be made into those made of silicon cells, classified as the first generation, often with an aluminum frame, and PV panels made of thin-film cells, classified as the second generation, usually without a frame [20]. As the photovoltaic industry developed, new technologies and materials, as well as new types of photovoltaic cells, appeared on the market, which resulted in the chronological division of PV panels into generations [21,22,23]. The first generation includes the oldest technologies for building PV cells from mono- or polycrystalline silicon. Panels made using this technology currently dominate the market and their efficiency ranges from 14 to 19% in the case of cheaper cells made of polycrystalline silicon and 16 to 25% for more expensive cells made of monocrystalline silicon [24]. The second generation includes thin-film cells. The efficiency of panels made of such cells ranges from 14% to 23% [25,26,27]. The main advantages of such cells include cheaper production costs compared to the previous ones, due to less labor-intensive technological processes, automation, and reduction in material consumption, which results in a lower price of PV panels, they are also lighter. An innovative advantage is the ability to apply cells on flexible surfaces, e.g., foils, which, despite lower efficiency, gives an advantage over first-generation cells. In addition to organic cells, the third generation also includes dye cells. Currently, their efficiency is at the level of 12.6%, which is a worse result compared to other technologies, but thanks to other advantages they have become competitive with other cells. The advantages include a simple production process and the relatively low price of dyes [28,29,30]. The possibility of using dyes of different colors increases the possibilities of functionality and aesthetics, which expands their scope of use. Additionally, they are resistant to mechanical damage and less susceptible to the negative effects of extreme temperatures. In the fourth, latest generation, we distinguish hybrid and perovskite cells. Hybrid cells are characterized by a multi-layer structure, composed of two or more cells of different types or generations; thanks to which they combine the best features of various types of cells developed so far. Hybrid cell technology seems to be a promising answer to market expectations to create PV panels that are highly efficient, cheap, durable, and at the same time not very complicated to produce. So far, the work of engineers and researchers has led to the creation of hybrid organic–inorganic, perovskite–silicon, or polymer cells doped with quantum dots [31]. In the case of perovskite cells, their potential is based on their high efficiency and good physical properties, although they are not very good for a complicated production process based on well-known thin-film technologies. The theoretical efficiency of these cells is as high as 31.4%, but after laboratory tests, the result was 21.5%. The optical and electrical properties of perovskite materials result in high efficiency of conversion of solar energy into electricity. The main advantage is a high absorption coefficient at a level much higher than in silicon cells [32]. Perovskite cells have a much smaller thickness, which reduces material consumption, but also allows the production of transparent PV cells, which creates many advantages and new assembly possibilities.
A photovoltaic installation consists of several necessary elements that can be used to convert solar energy into electricity: photovoltaic module, inverter, DC disconnector, protection, and cabling [33,34,35]. Off-grid and hybrid installations additionally have a charging controller and an energy storage facility. As part of the conducted research, the appropriate selection of the inverter power is of great importance to achieve effective operation of the installation. Installing an inverter with a higher power than the capacity of the PV installation will not increase electricity production. In turn, too low inverter power does not allow the full use of the panels’ capabilities. The installation power should be 80–120% of the inverter power. The better the alignment of the peak power of the inverter and the panels, the greater the efficiency of the entire installation.

2.2. Energy Storage

One of the basic and inseparable elements ensuring proper operation and optimal management of photovoltaic power plants, but also all other systems obtaining electricity from renewable sources, is energy storage. It is particularly important in the case of power plants based on photovoltaic systems, where there is no regularity or significant possibility of planning electricity production. In these systems, the amount of energy produced depends on the availability of solar energy, which varies from day to day, determined by current weather conditions, the season, and even the time of the day (day or night) [36]. The electricity demand varies throughout the day, for households and businesses. Typically, energy production from a PV system does not coincide with the current consumption, which creates an undesirable effect and reduces the level of self-consumption, thus reducing the efficiency of the system [37]. To balance the time differences in production and consumption and to stabilize these dependencies during the day, an energy storage facility is used that is synchronized with the automation of the PV system. Market expectations toward these devices are constantly growing, which is why their manufacturers place particular emphasis on the use of appropriate and modern technologies to respond to them [38]. Their efforts are to create a product that combines features such as long service life, charging efficiency at low currents, reliability, and operational safety. Energy storage refers to all methods that make it possible to store the acquired electricity when there is an excess and use it when there is a shortage. According to the Renewable Energy Act, an energy storage facility is defined as a device or set of devices whose task is to store energy in any form, without causing emissions that burden the environment, in a way that allows for its at least partial recovery [39,40,41]. In the context of electricity obtained from solar energy, there are currently several different ways of storing it, more or less expensive and efficient.
Excess energy produced can be stored using batteries. Photovoltaic modules produce direct current and we can charge the batteries through the charge controller. Energy storage units used in hybrid and island installations should have a long service life, a small size, be harmless to the environment, be resistant to high temperatures, and have a large capacity. An important factor influencing the operating time and thus the battery life is the environment in which the battery must operate. To avoid shortening this time, you should avoid, among others: deep discharges, extended periods when the battery is not fully charged, and high battery temperatures. Manufacturers provide a 10-year warranty for energy storage efficiency of 80% [42]. However, the total service life is specified at a minimum of 6000 charging cycles, which means approximately 15 years of operation. Battery specifications can describe the most important parameters in three terms [43,44,45]:
  • Depth of Discharge (DoD)—describes how deeply the battery is discharged. A DoD value of 0% means fully charged and a DoD of 100% means fully discharged battery.
  • State of Charge (SOC)—is a parameter determining how charged the battery is; it is a parameter opposite to DoD, so SOC 100% means a fully charged battery.
  • Number of charging cycles—determines the battery life. As cycles increase, battery capacity decreases. Each charge and discharge results in the degradation of the cell. The deeper it discharges, the faster its service life decreases.
Literature works over this year cover the topic of managing renewable energy flows for DC microgrids and their storage [46]. The authors of this work present effective algorithms using machine learning techniques to control and manage energy flow in the example of a specific case. The result of their work is promising results toward auto-consumption and energy self-sufficiency in the analyzed case. Similar research was carried out by the authors of [47]. The result of their research is the developed energy management system for residential prosumers with renewable integration. The authors of the work considered the storage and use of energy from storage facilities and their response to demand. They provided recommendations on how energy should be used among consumers to promote their active involvement in the energy market. The next work [48] presents the results of research on the review and evaluation of the application of photovoltaic storage systems batteries. The paper presents results related to the design of parameters to increase the efficiency and reliability of storage systems for various residential and manufacturing purposes. The authors of work [49] present a model for planning the optimization of a renewable energy system with hybrid energy storage to increase the rates of auto-consumption and self-sufficiency of consumers. The optimization model proposed by the authors presents a viable approach to improving economic efficiency and reducing renewable energy in grid-connected systems. The authors of [50] show the results of their work on improving the reliability of the shipping capabilities of a hybrid system consisting of PV connected to energy storage facilities using hydro energy storage facilities. The authors point out the possibilities of integrating various renewable energy sources to increase the energy demand of households and production companies during peak hours. The author’s article appreciates energy storage and points out the advantages of its use.
To sum up, photovoltaics is one of the most popular technologies for obtaining renewable energy, and storing it has become more and more common. Energy storage is a battery or set of lithium-ion batteries that allow you to store electricity and feed it into the grid when you need it most. Thanks to this solution, photovoltaics becomes even more independent of external factors, such as weather variability. Energy storage allows it to be used when the photovoltaic installation does not produce enough energy or when the price of electricity is highest. Thanks to this solution, we can increase the efficiency of energy use from solar panels and reduce the costs of electricity consumption from the power grid. Energy storage allows you to store the energy produced during the day and use it when the PV installation is not working or its operation is very limited, i.e., after sunset. The energy produced from photovoltaic cells is first used for current needs, and its surplus goes to the storage facility until it is fully charged. When this happens, the excess energy is sent to the power grid, and when the storage is discharged to a certain value, energy begins to be taken from the grid.
Having an energy storage unit undoubtedly brings many benefits, not only in the context of using energy from photovoltaics. First of all, it gives the user much greater energy independence because it allows the stored energy to be used when needed. In addition, energy storage allows you to reduce energy losses in the power grid, which result from differences between electricity production and consumption. This improves network stability and reduces the need to build additional energy sources. Energy storage facilities also enable the use of cheaper energy at specific hours, which translates into financial savings for the user. In the long term, by having energy storage, we significantly contribute to reducing greenhouse gas emissions and improving air quality, thereby increasing the use of energy from renewable sources and reducing the scale of fossil fuel extraction.
As part of the broadly understood operation of energy storage, the disposal of used or broken batteries should also be taken into account. At the end of the cells’ life cycle, they must be properly recycled. Many materials used in batteries, such as lithium, cobalt, and nickel, can be recovered and reused [51,52,53]. Complying with local and international regulations regarding battery disposal helps minimize environmental impact and increases user safety.

3. Materials and Methods

This work aims to comprehensively analyze the cooperation of an electricity storage facility with an operating photovoltaic installation in a manufacturing company regarding the efficiency and effectiveness of the device and the economic profitability of the investment. This work aims to check the benefits that can be brought by expanding the PV system with an electricity storage facility. Based on the real energy balance and the characteristics of electricity distribution in the company, profitability calculations were carried out reflecting the expected savings generated by using individual solutions. Figure 1 shows a flowchart of the research methodology.

3.1. Characteristics of the Examined Enterprise

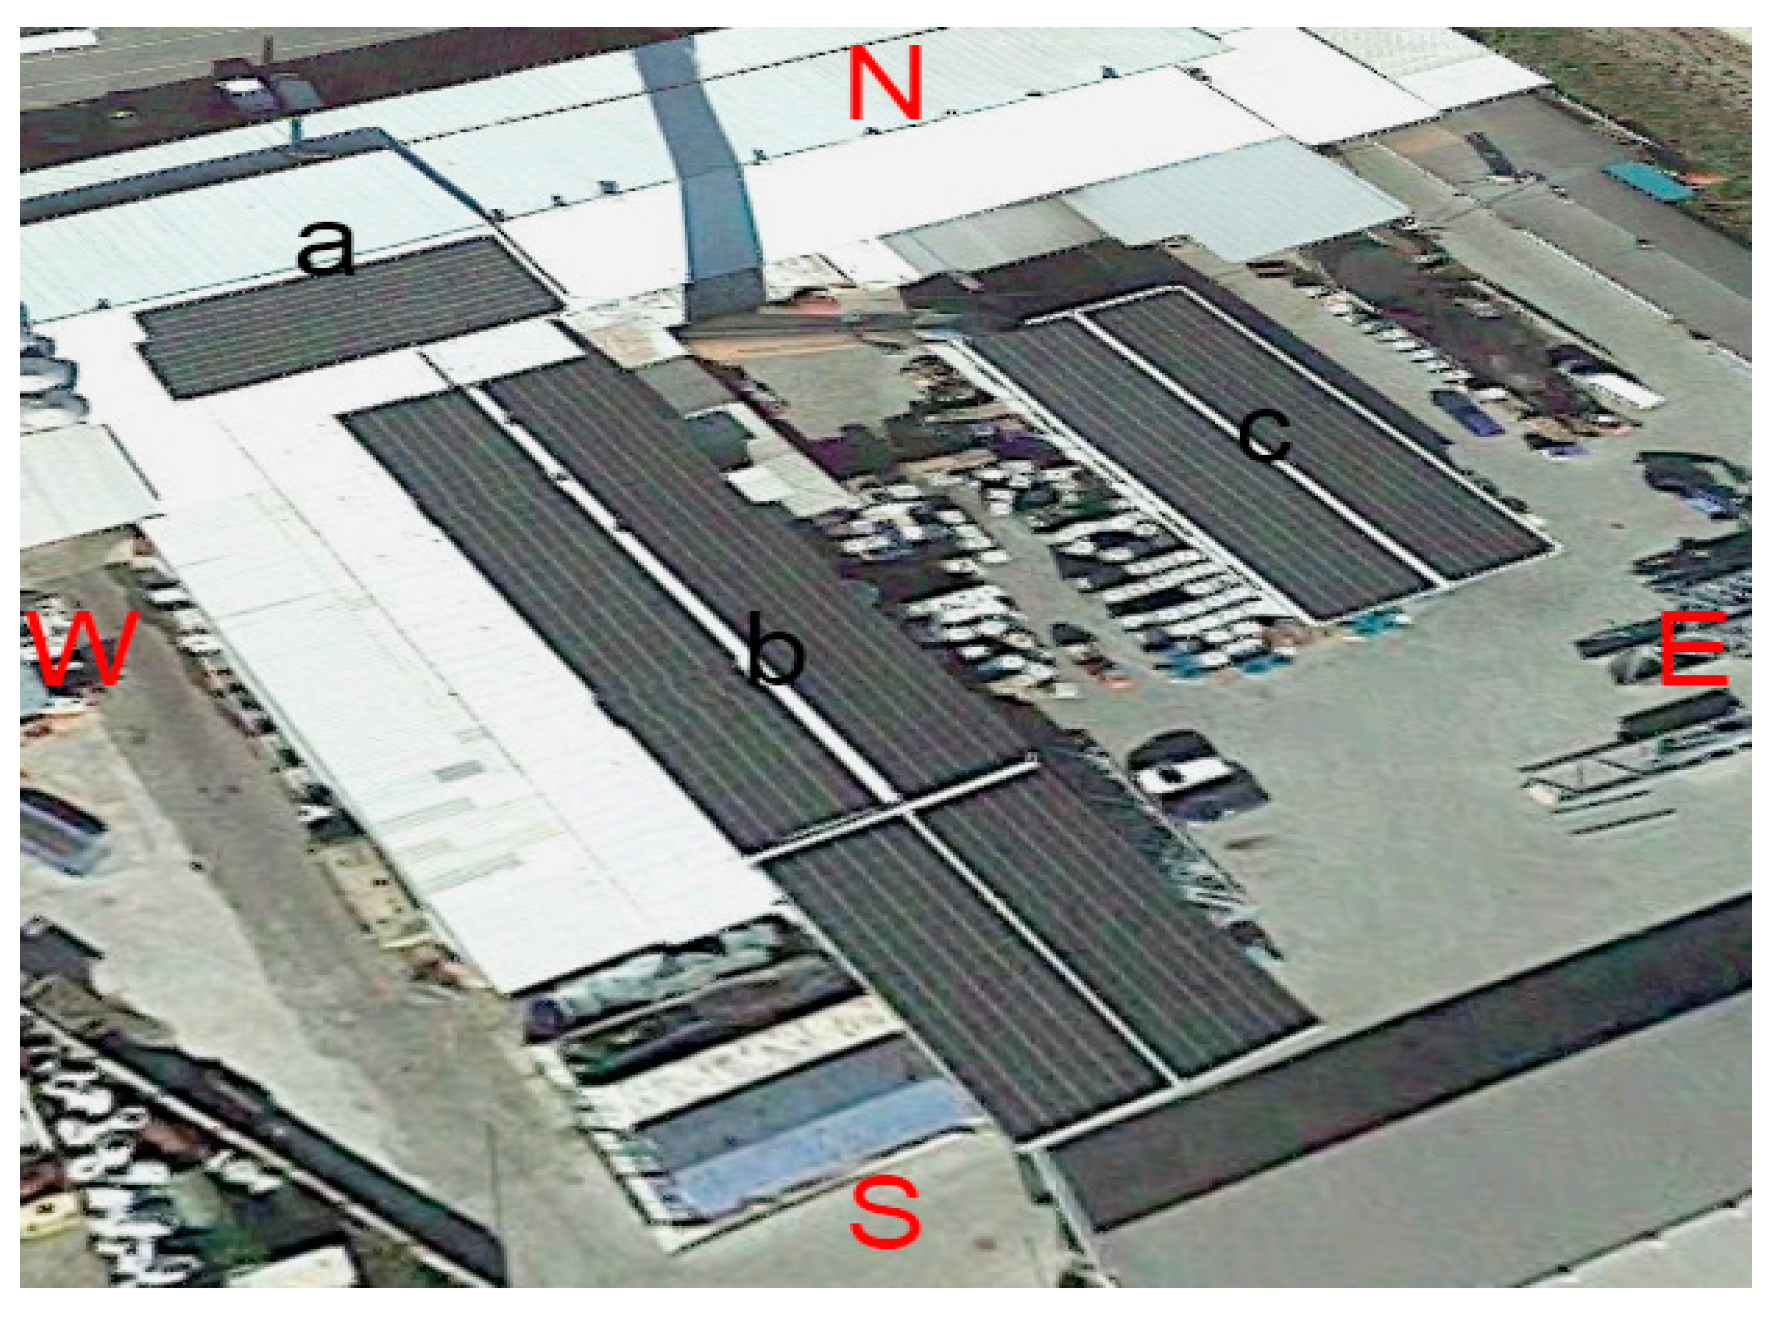
The object of the research was a production and service plant located in southern Poland. The photovoltaic installation was installed between 2020 and 2024 and took place in three stages. In the first stage, photovoltaic panels with a capacity of 50 kWp were installed, in the second stage, with a capacity of 310 kWp, and in the third stage, with a capacity of 295 kWp. Installing the modules made it possible to generate, among others, a total power of 655 kW. Figure 2 shows the exposure of PV installation modules located on the roof surfaces of the company. To more precisely present the exposure of the generators, we can divide them into three sectors a, b, and c. Sector “a” is directed toward the southeast, with an inclination of approximately 17 degrees. Sectors “b” and “c”, by the roof structure, are directed in half, in two directions. Half toward the southwest, the other half toward the northeast. The slope is approximately 15 degrees.
The described modules are supported by five inverters manufactured by SMA Solar, with a power of 50 kW each and a declared efficiency of 98%. These are three-phase, transformerless inverters intended for use in distributed installations. The device has several protections in the form of disconnectors, breakdown detection, network monitoring, protection against incorrect polarity, short-circuit protection, residual current circuit breaker, arc protection (AFCI), and diagnostics of generator current and voltage. In addition, it is equipped with the integrated SMA ShadeFix shading management function, which optimizes performance during shading. Access to the device, reading, and setting of current parameters is possible thanks to the installed Wi-Fi module, which also supports the SMA Energy application. From the application level, we can read the current, historical, and total production, predicted production for two days ahead, and also create an energy balance showing the actual energy production about the expected one. A useful feature is the ability to check device messages in the event of disruptions during operation because the device itself shows us the cause of incorrect operation or failure. You can also read a report of failures or unplanned disconnections.
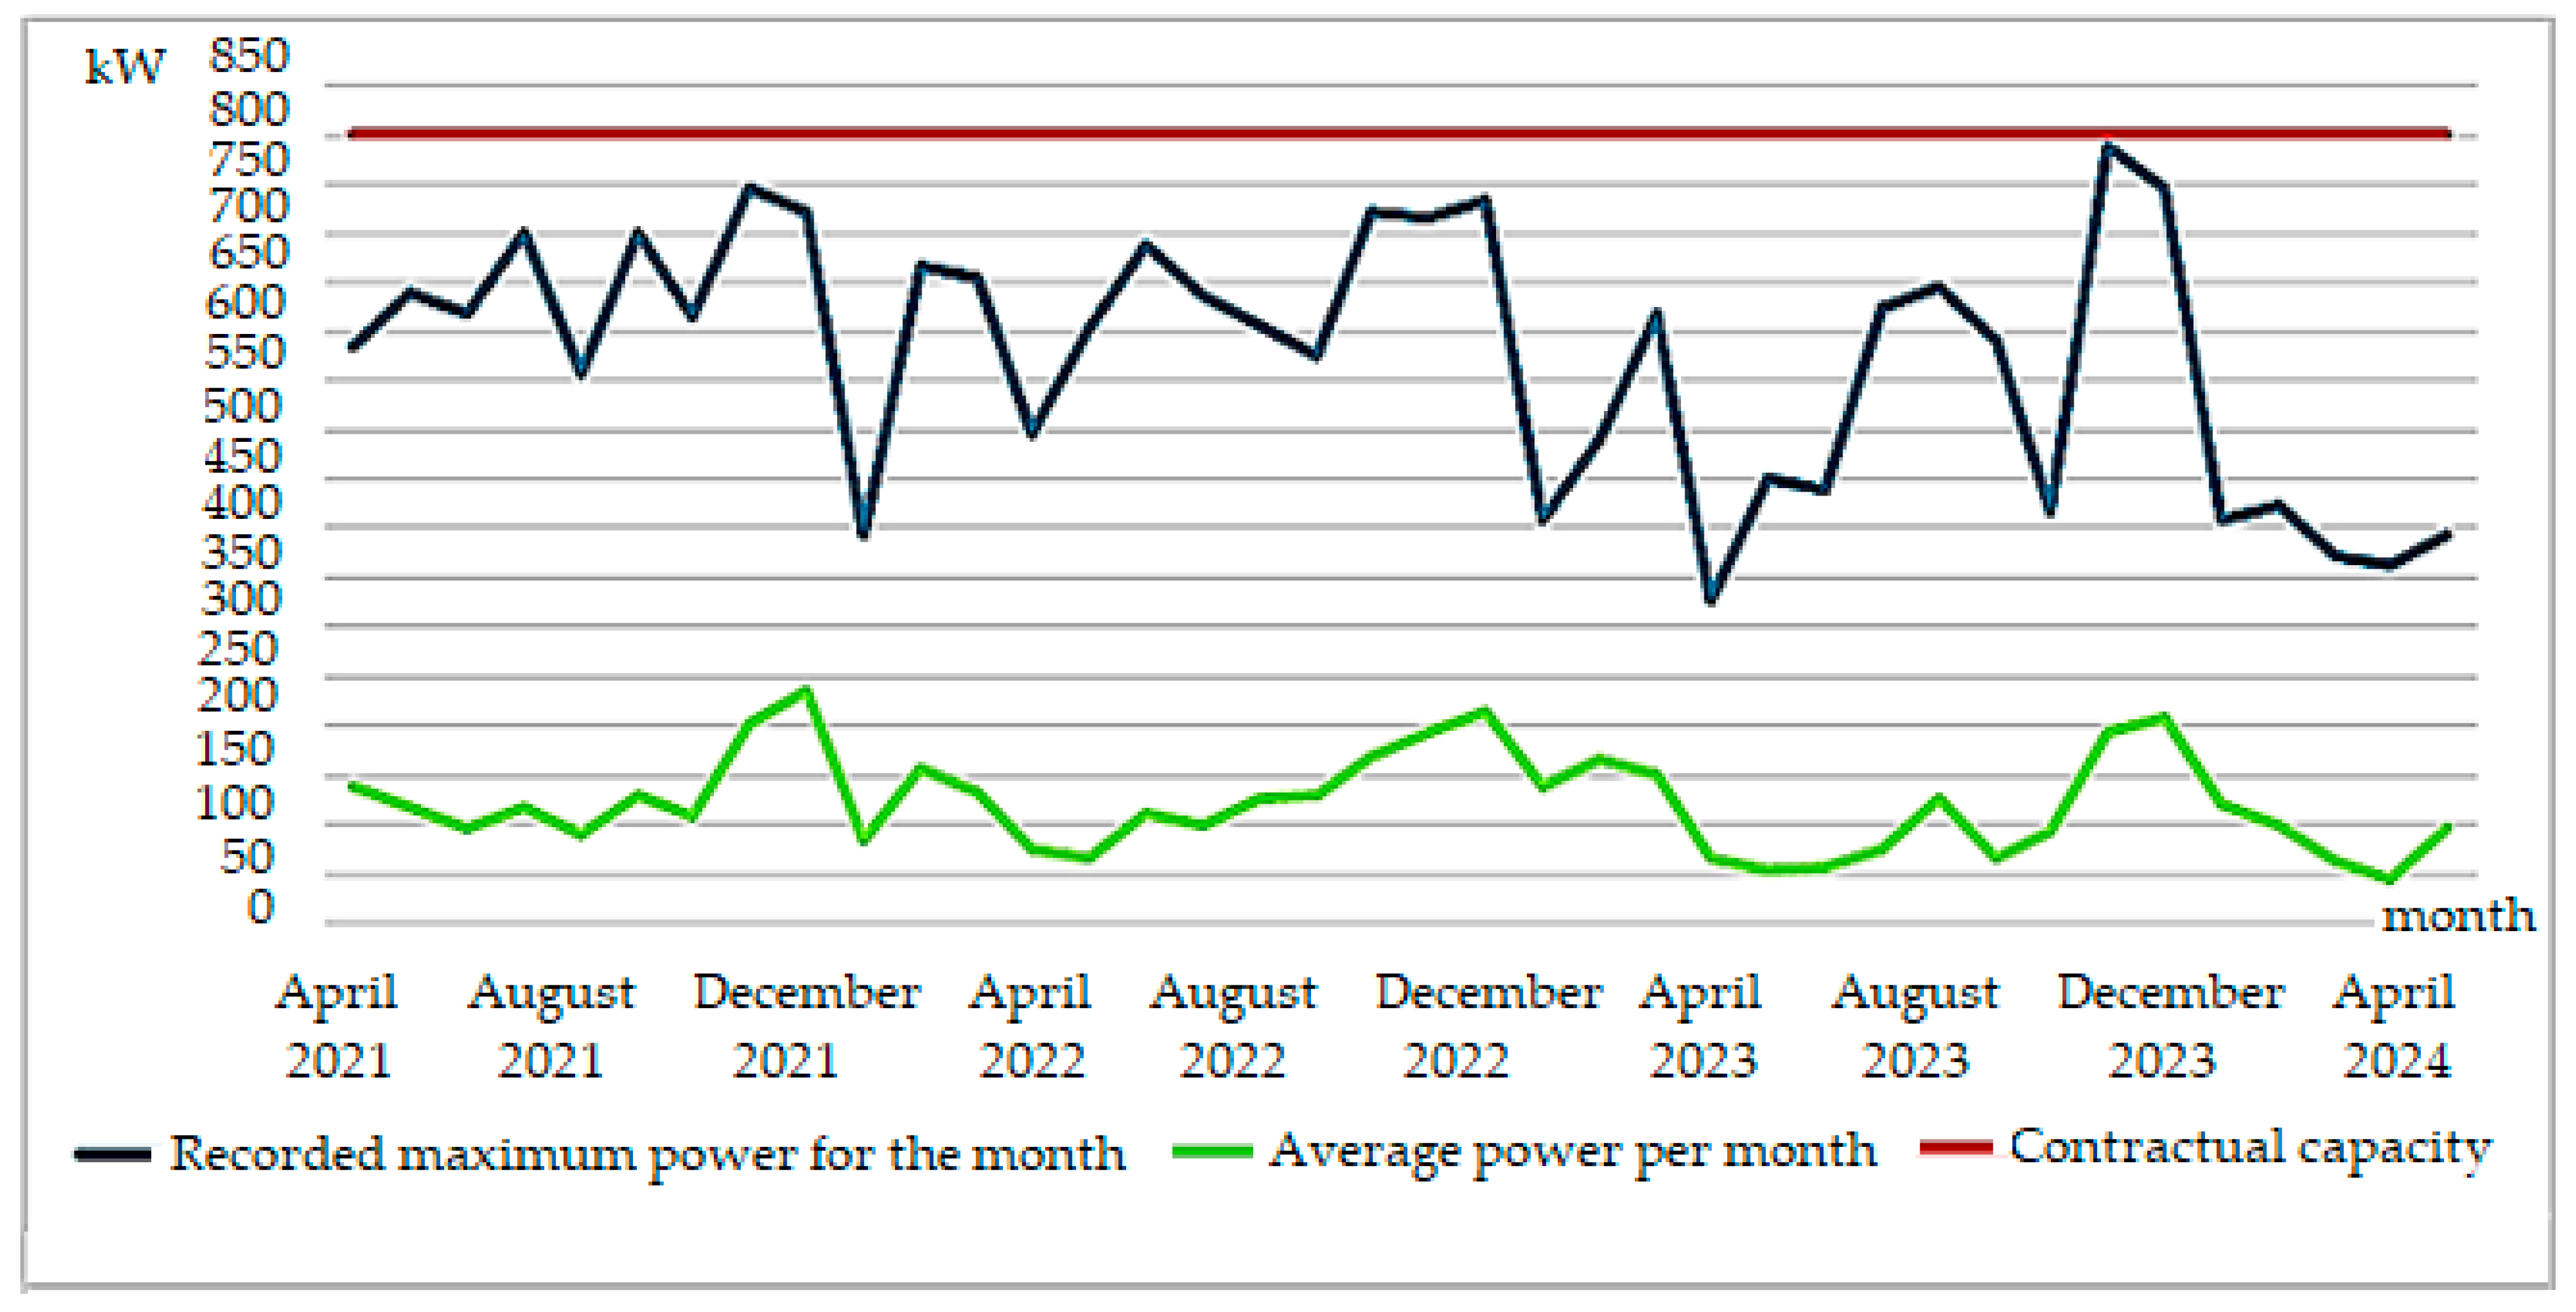
Figure 3 shows the company’s data in the period from April 2022 to May 2024, showing the characteristics of active power consumption (consumption from the distribution network in kW), recorded in a given month and the average for that month. Test data were obtained reliably from computer-integrated measuring devices in the production plant. From Figure 3, it can be seen that in individual months, there were days when the consumption in a given hour reached up to 790 kW (blue line), but, importantly, the contracted capacity was not exceeded during the entire period (red line). The green line shows the average power for a given month, calculated based on daily data, also taking into account the night, where the consumption is negligible, which makes the data of low value, but it presents a comprehensive view of the distribution of active power consumed in the company.
As a result, a total of 1747 PV panels were installed in all three installations, which were integrated and connected in such a way that all the energy from all generators goes to production, and their total power is 655 kW. The whole thing has been integrated and connected in such a way that the energy produced goes first to the needs of production and, in the event of overproduction, to the network or energy storage. Taking into account the current demand for electricity of the enterprise, assuming that the installation generates nominal power for 8 h, it can be concluded that this installation is sufficient to cover almost 100% of the energy demand in this enterprise. However, knowing the operating characteristics of photovoltaic power plants and taking into account the region where the described installation is installed, the current capacity to cover the needed energy is approximately 50%, in the period favorable for energy production, i.e., mainly in spring and summer. The reason for this value is the uneven operation of the installation during the day, with low production in the morning and evening, and high production at noon, often exceeding demand on sunny days. At this point, the company consumes energy from the grid mainly in the morning and evening, and sometimes energy is fed back into the grid at noon. This situation justifies considering the use of energy storage for the described installation and creates the conditions for it. It should also be mentioned that the company’s location is not conducive to energy production in winter, so at this time of year, it operates with minimal power or is turned off.

3.2. Technical Parameters of the Energy Storage

After preliminary qualification of the proposed offers obtained based on previously presented data and reports, the energy storage facility was selected for further analysis [54]:
Technical parameters of this device:
  • Rated power: 500 kW with the possibility of expansion every 100 kW;
  • Battery capacity: 1000 kWh, expandable every 150 kWh or 200 kWh;
  • Efficiency: >94%;
  • Input voltage: 3 × 400 VAC ± 10%;
  • Input voltage frequency: 50 Hz ± 5%;
  • Response time to load change: 200 μs;
  • Battery technology: LFP;
  • Battery management system: three-level BMS with active correction;
  • Phase load symmetrization: yes.
Energy management module:
  • Bidirectional converter power scalability every 100 kW, 250 kW, 500 kW;
  • LCL anti-interference filter;
  • Bidirectional converter;
  • Short-circuit, overload, temperature, and overvoltage protection;
  • Modbus RTU, TCP/IP communication enabling integration with superior SCADA systems.
Battery module parameters:
  • Number of charging cycles: >4000 cycles;
  • Single module capacity: 150 kWh;
  • The operator panel on each cabinet allows viewing and configuration of basic parameters;
  • Three-level BMS protection.
The energy storage is equipped with software that monitors energy flows, working with an application that provides the user with quick, clear, and direct access to all necessary measurement data. An important element of the entire energy storage system is the air conditioning system, which ensures the optimal operating temperature for the inverters and battery modules. Additionally, an integral element of the facility is the fire protection system. Depending on the warehouse configuration, it is required to separate the inverter and battery compartments with a fire-resistant wall.

3.3. Economic Analysis of Return on Investment

The NPV and IRR indicators are crucial for the investor to decide on the possibility of investing in a given project and its profitability. NPV (net present value) is also known as the net present value, or the current value of future cash flows. NPV determines the value of future income from an investment, minus current outlays. In simple terms, this indicator indicates what income can be expected from a given investment in terms of the current value of money. The expected (future) cash flows from a given period are divided by an appropriately compounded discount rate. The discount rate usually reflects the cost of borrowing (interest on debt). The discount rate is also known as the interest rate, which determines what future cash flows must be given up to have the funds at disposal. The higher the NPV value, the better. For an investment to be profitable, the NPV must be above zero. In the opposite case, it would indicate that the investment in the project will not return to the investor in real terms—i.e., in terms of values that take into account the inflation rate (the general increase in the price level of goods and services in the economy). Assuming that every entrepreneur plans to gain, not lose—this is a very undesirable effect. The following formula was used for calculations [55]:
N P V = i = 1 N C F i 1 + k i C F 0
where N —number of project durations,   C F i —cash flow generated by the project in the ith year, a n d   C F 0 —the sum of investment outlays necessary to launch the project.
Another indicator illustrating the profitability of an investment is the IRR (Internal Rate of Return). This indicator can also be called a measure of the risk of an investment project. By definition, the internal rate of return is the discount rate at which the NPV is zero. The IRR is also calculated based on the value of current outlays and future revenues. The value of this indicator is the so-called profitability of the investment. In this case, just like with NPV, the project is profitable when IRR > 0. However, the internal rate of return should also cover the premium for the risk of undertaking the investment. The following formula was used for calculations [55]:
I R R = i 1 + N P V 1 · i 2 i 1 N P V 1 + N P V 2  
where i 1 —the required rate of return for which the NPV is positive (but close to zero), i 2 —the required rate of return for which the NPV is negative (but close to zero), N P V 1 —NPV value calculated for i 1 , and N P V 2 —NPV value calculated for i 2 .
The internal rate of return IRR is probably the most popular criterion for assessing the relative profitability of projects lasting more than one year. It is widely used not only in assessing investment projects but also in calculating the cost of capital from various sources of financing, as well as in making other financial decisions.

4. Results and Discussion

4.1. Total Electricity Production in the PV Installation

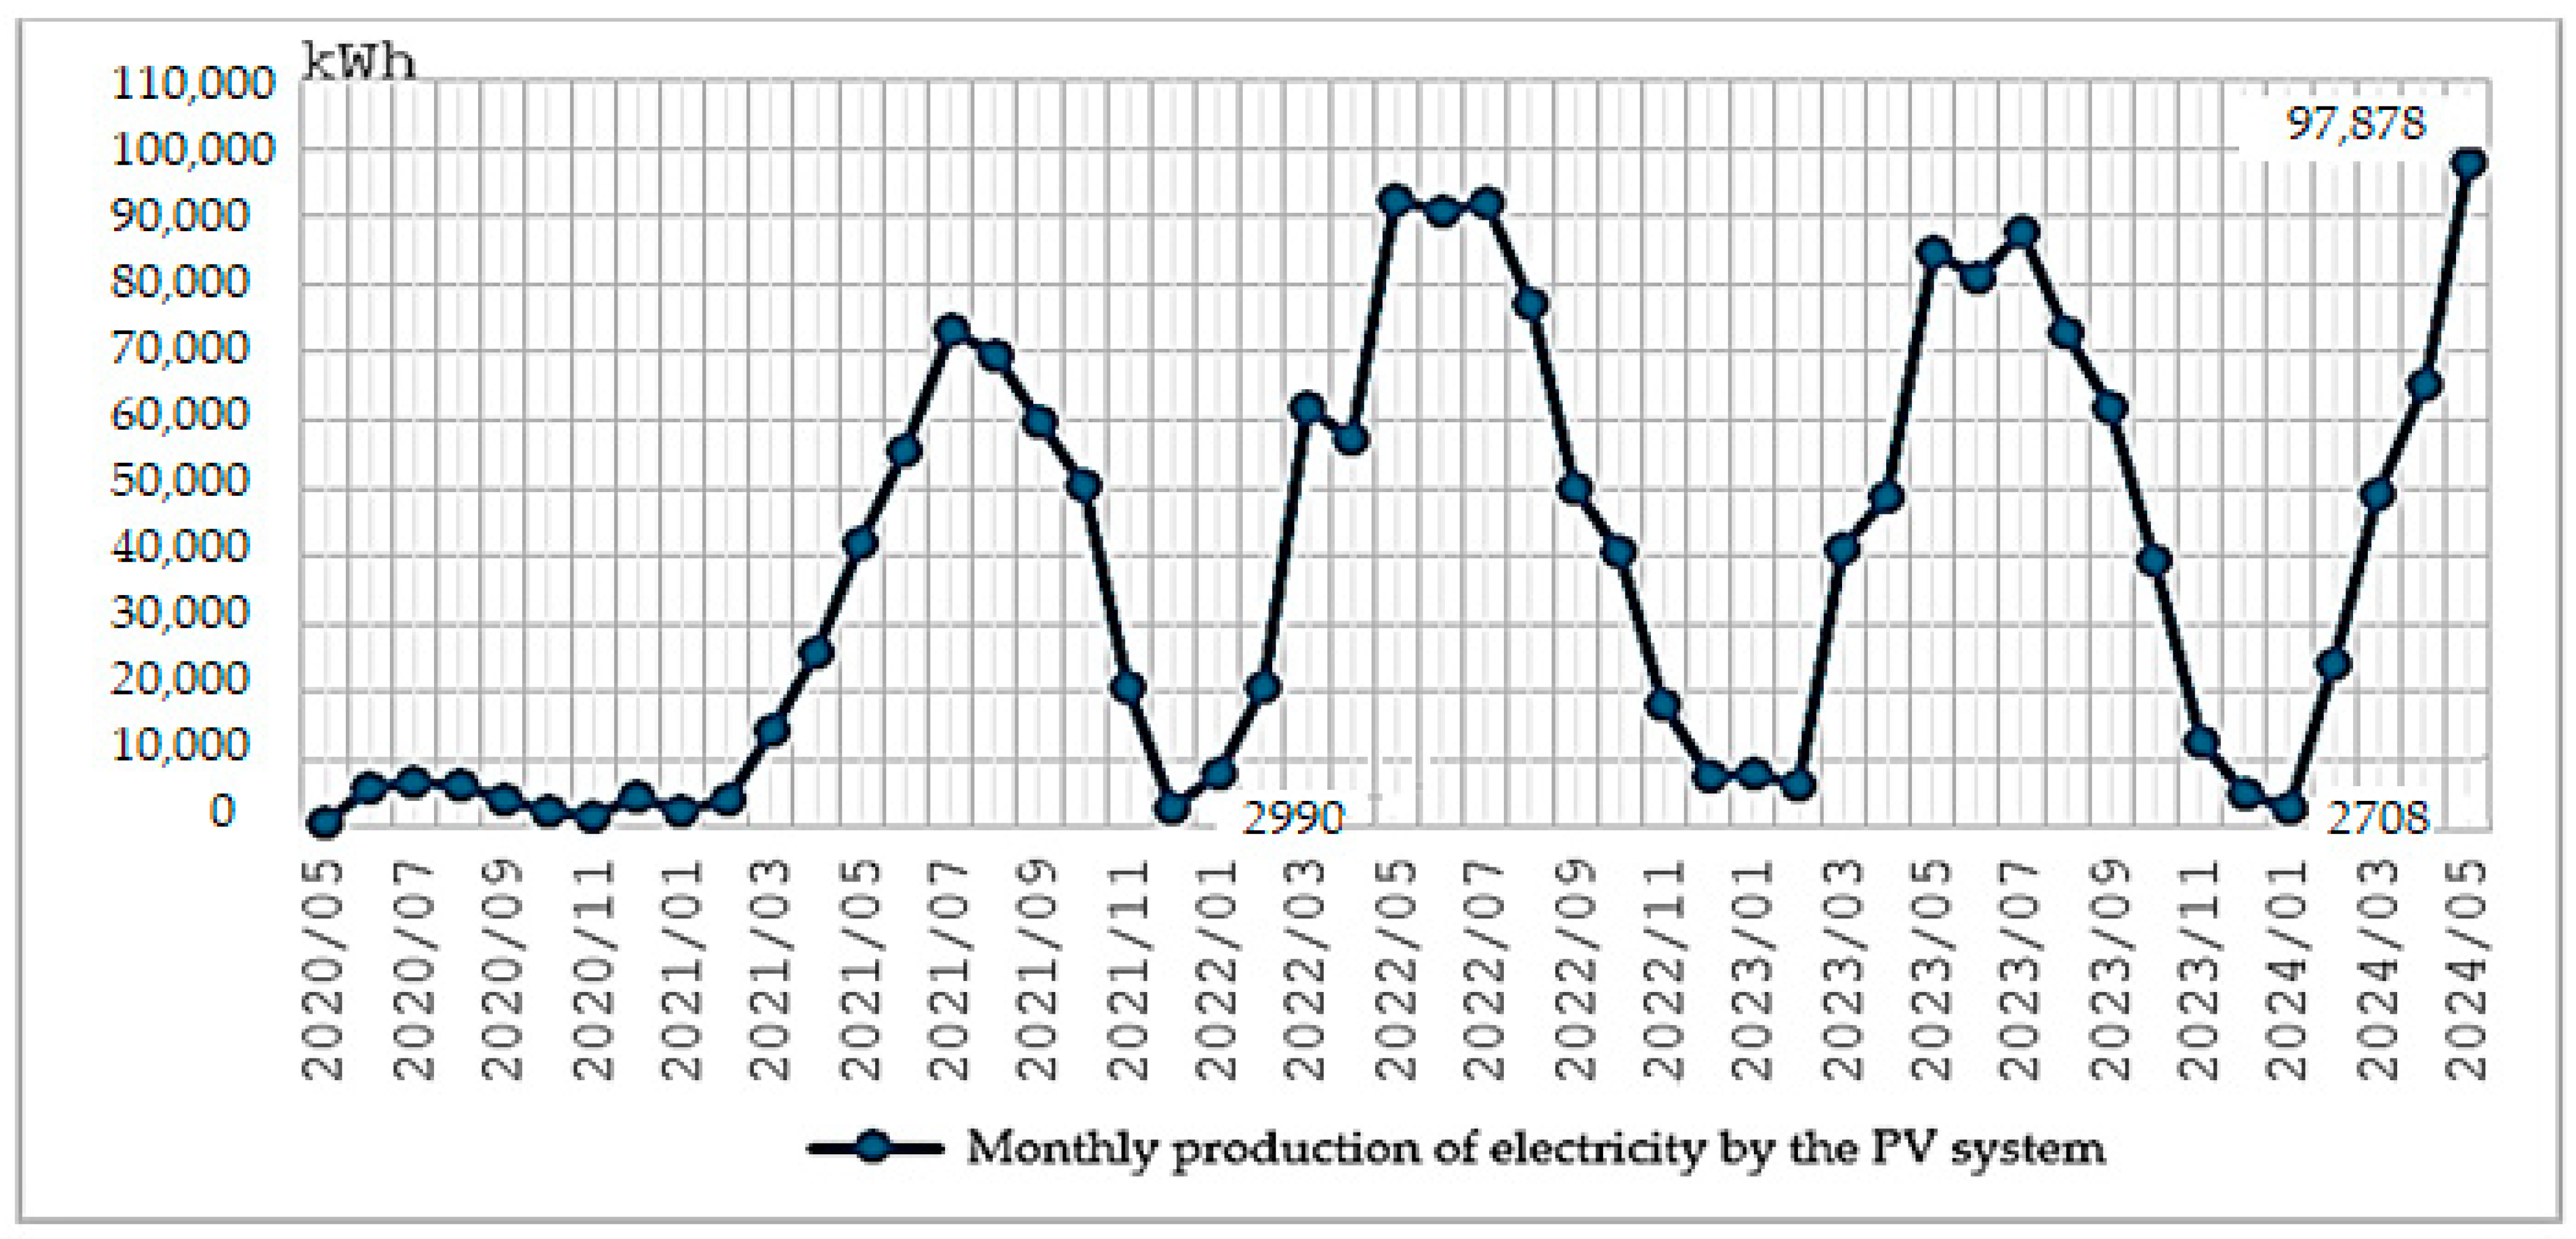
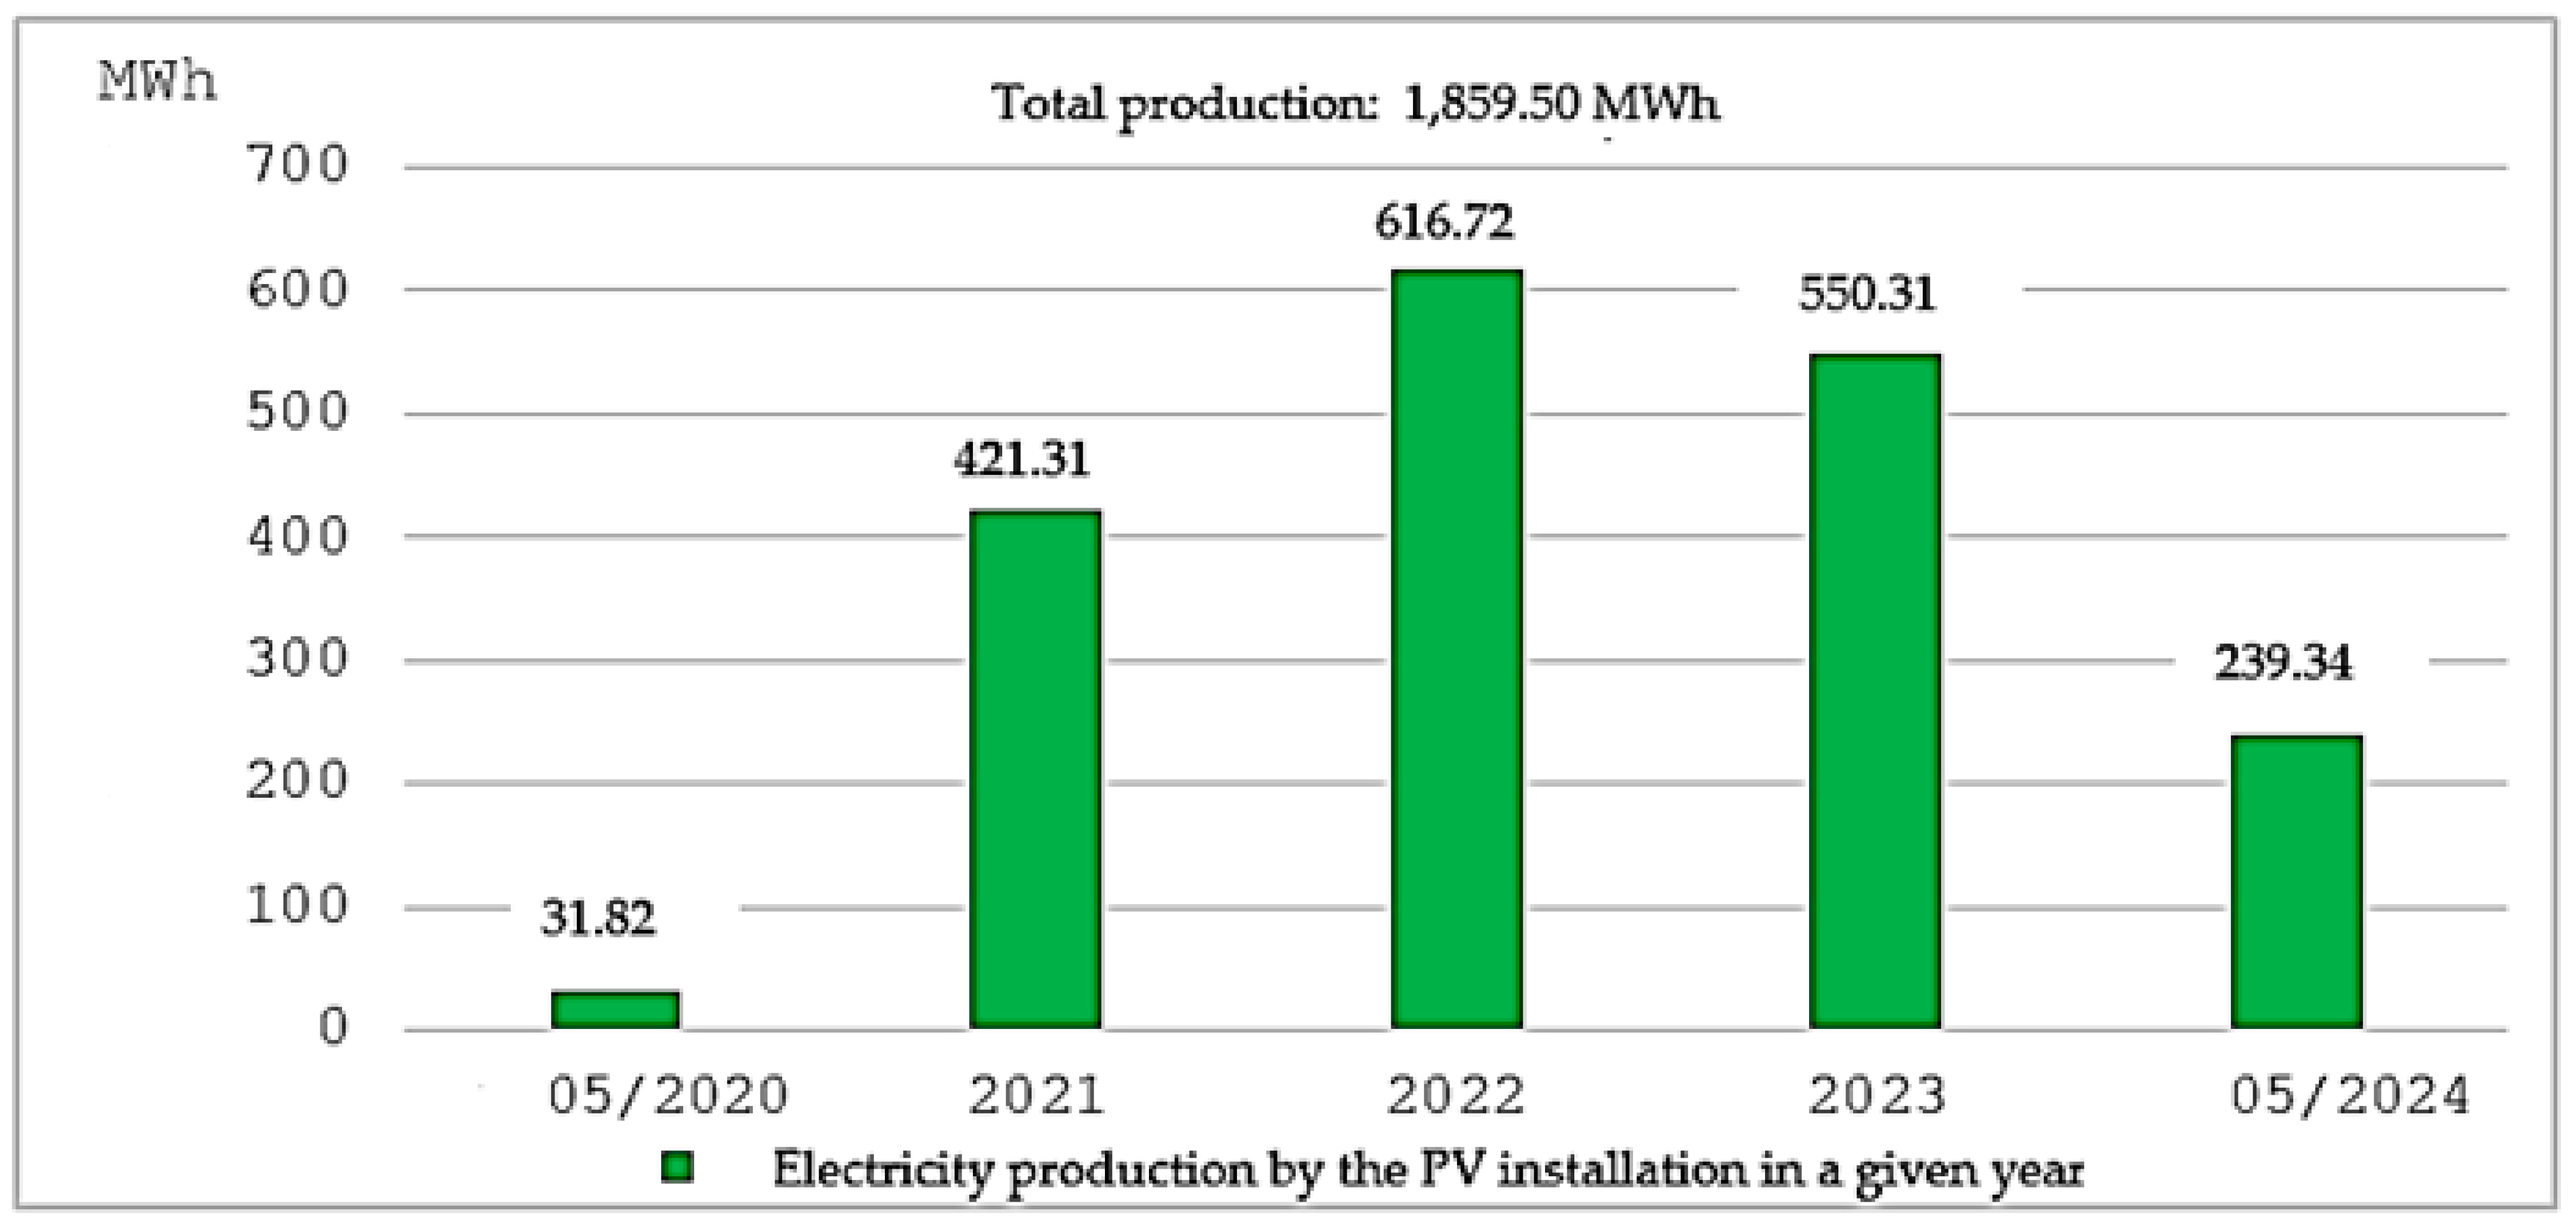
The photovoltaic installations in the analyzed company were installed at different times, and therefore, each of them started operation at a different time. Therefore, to correctly present and analyze the production results generated by the PV system, it is worth indicating at what point the individual installation started production and when the system was operating as a uniform photovoltaic installation. The photovoltaic plant with a capacity of 50 kWp started production on 26 May 2020. Then, on 2 December 2020, production of a system with a capacity of 310 kW was launched, after which the installation with a capacity of 350 kWp operated until 6 July 2021; a third system with a capacity of 295 kWp was added to production. Since then, all systems have formed one installation, the power of which is 655 kWp. To obtain reliable results, the analysis included energy production data from the moment the entire PV installation was launched, i.e., from 6 July 2021. Figure 4 shows the collective results as it shaped total energy production in subsequent years, every month. As previously mentioned, to properly interpret the data, they should be analyzed from July 2021, when the entire installation with the target capacity started production. Therefore, the results presented in Figure 4 before this date slightly distort the overall view, but if we take into account the data from the indicated date, we can note several characteristic dependencies and compare individual years. For each year, it can be seen that the highest production results occur in the months from May to August and the lowest from November to February. From the labels listed in Figure 4, it can be read that the largest amount of energy produced in one month by a PV installation over the entire period of operation was in May 2024 and amounted to 99 MWh, and the smallest (analyzed from July 2021) was recorded in January 2024 in the amount of 27 MWh. Moreover, a cyclically repeating trend can be noticed, with the highest values recorded in the summer months and the lowest values occurring in winter. It can also be read that the most favorable year for energy production was 2022, and 2024 looks promising due to good results in the initial phase of the year. What is interesting and worth noting is the fact that during the entire period of operation of the photovoltaic installation, there was no month in which the installation was turned off and there was no production.
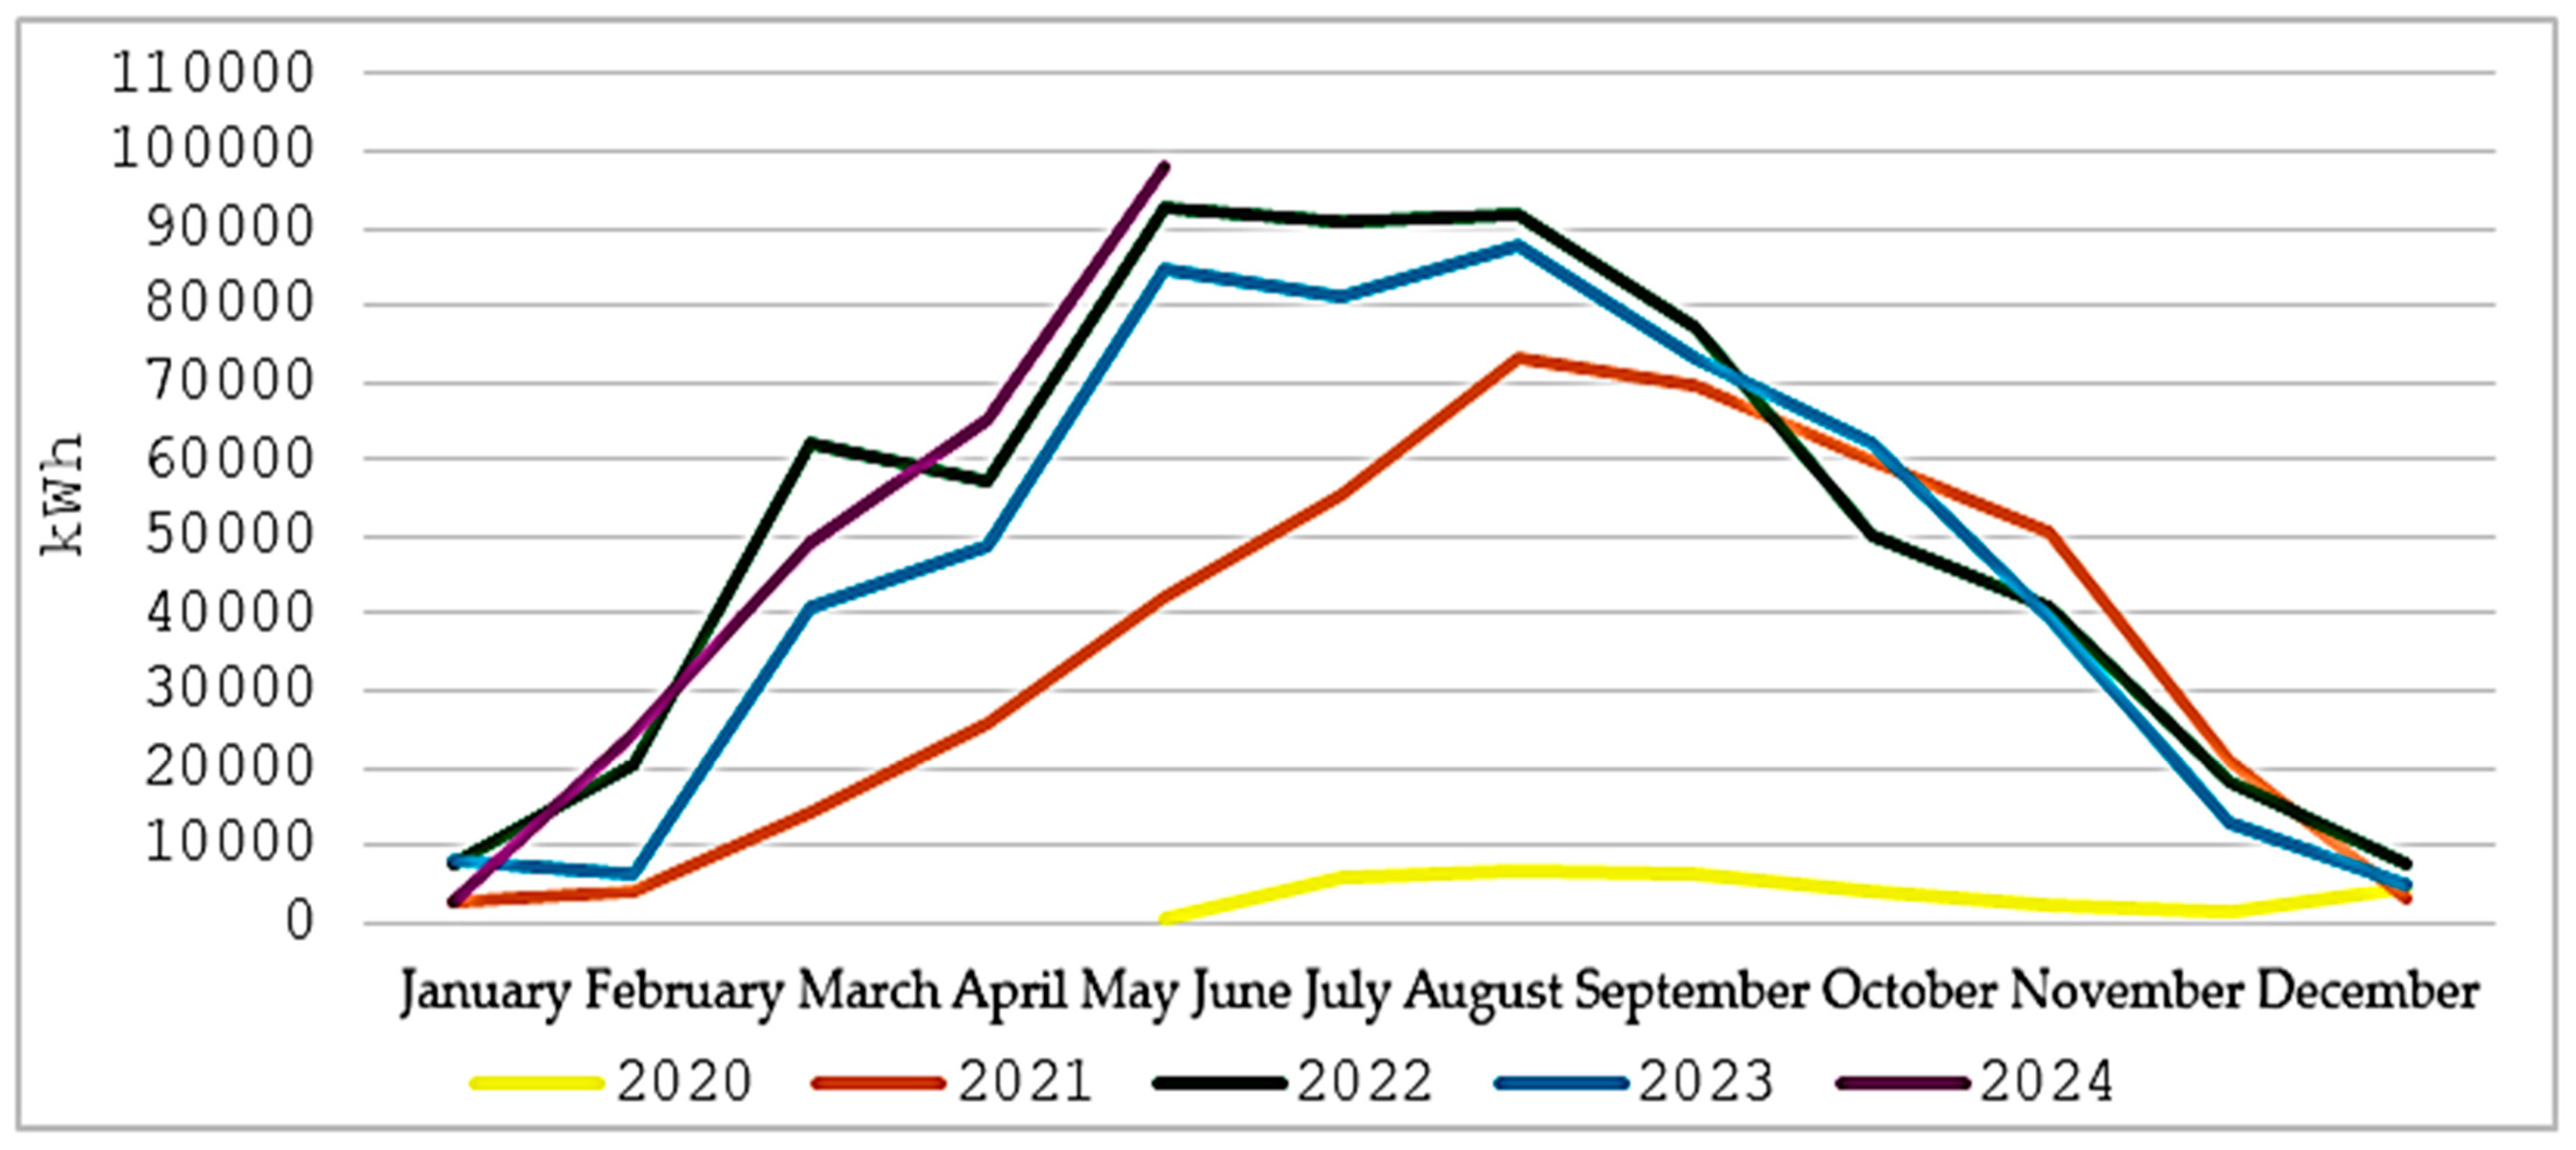
Figure 5 shows the system’s production in subsequent years (indicated in the legend), but the monthly data are superimposed, which makes it possible to compare month to month in different years. As before, the year 2020, marked in yellow, and the period until July 2021, marked in orange, are shown because energy production at this time is also important and counts in the overall calculation, but to compare the results obtained with the same installation power, we take into account the period from July 2021 (orange) and the rest in full (green, blue, purple). The data analyzed in this way confirm the repeatability of production in individual months, which is shown in Figure 5 to show a similar trend in different years for the same seasons.
Monthly productions in given years have been added and presented in Figure 6 as the total production in a given year and the total amount of electricity obtained by the PV installation in the entire period of operation. Figure 6 shows how much electricity the photovoltaic installation produced in a given year, and the sum of all energy obtained is marked in the upper part. The years 2020 and 2021 do not fully reflect production, because the power of the PV system was different, and 2020 is counted from May when the first part of the installation was launched. Similarly, the year 2024 contains data only up to and including May, so these three years cannot be compared to each other, but they are important in the total amount of energy produced by the photovoltaic installation. Valuable data for analysis that can be compared on the same basis are the years 2022 and 2023, because they contain production data for the entire 12 months, with the same total power of the PV system of 655 kW. Comparing these years, we can see that in 2023, the PV installation generated much less electricity, by over 66 MWh, which translates into a decrease in efficiency by approximately 10% compared to the previous year. These differences show how much the photovoltaic system depends on weather conditions and, consequently, it is very difficult to forecast. This relationship is confirmed by the fact that the manufacturing company cannot meet the entire electricity demand solely from a PV installation, but with the use of an energy storage facility, it can significantly reduce the costs incurred in connection with the consumption of electricity from the grid.
The data presented in Figure 4, Figure 5 and Figure 6 show clear differences in energy production that are important for the operational planning of photovoltaic energy companies. During the winter months, it is necessary to secure alternative energy sources or energy storage systems to ensure continuity of operations. High energy production in summer months, such as July, allows for more intensive use of energy in operational activities. Enterprises can schedule the most energy-intensive processes for these months to make the most of energy availability. Additionally, investments in monitoring, maintenance, and cleaning systems for photovoltaic panels are crucial to maintaining high efficiency of energy production throughout the year. Regularly maintaining panels in optimal condition can ensure their maximum performance, especially during months with less favorable weather conditions.

4.2. The Balance of Electricity Consumed, Transferred to the Grid, and Its Overall Production

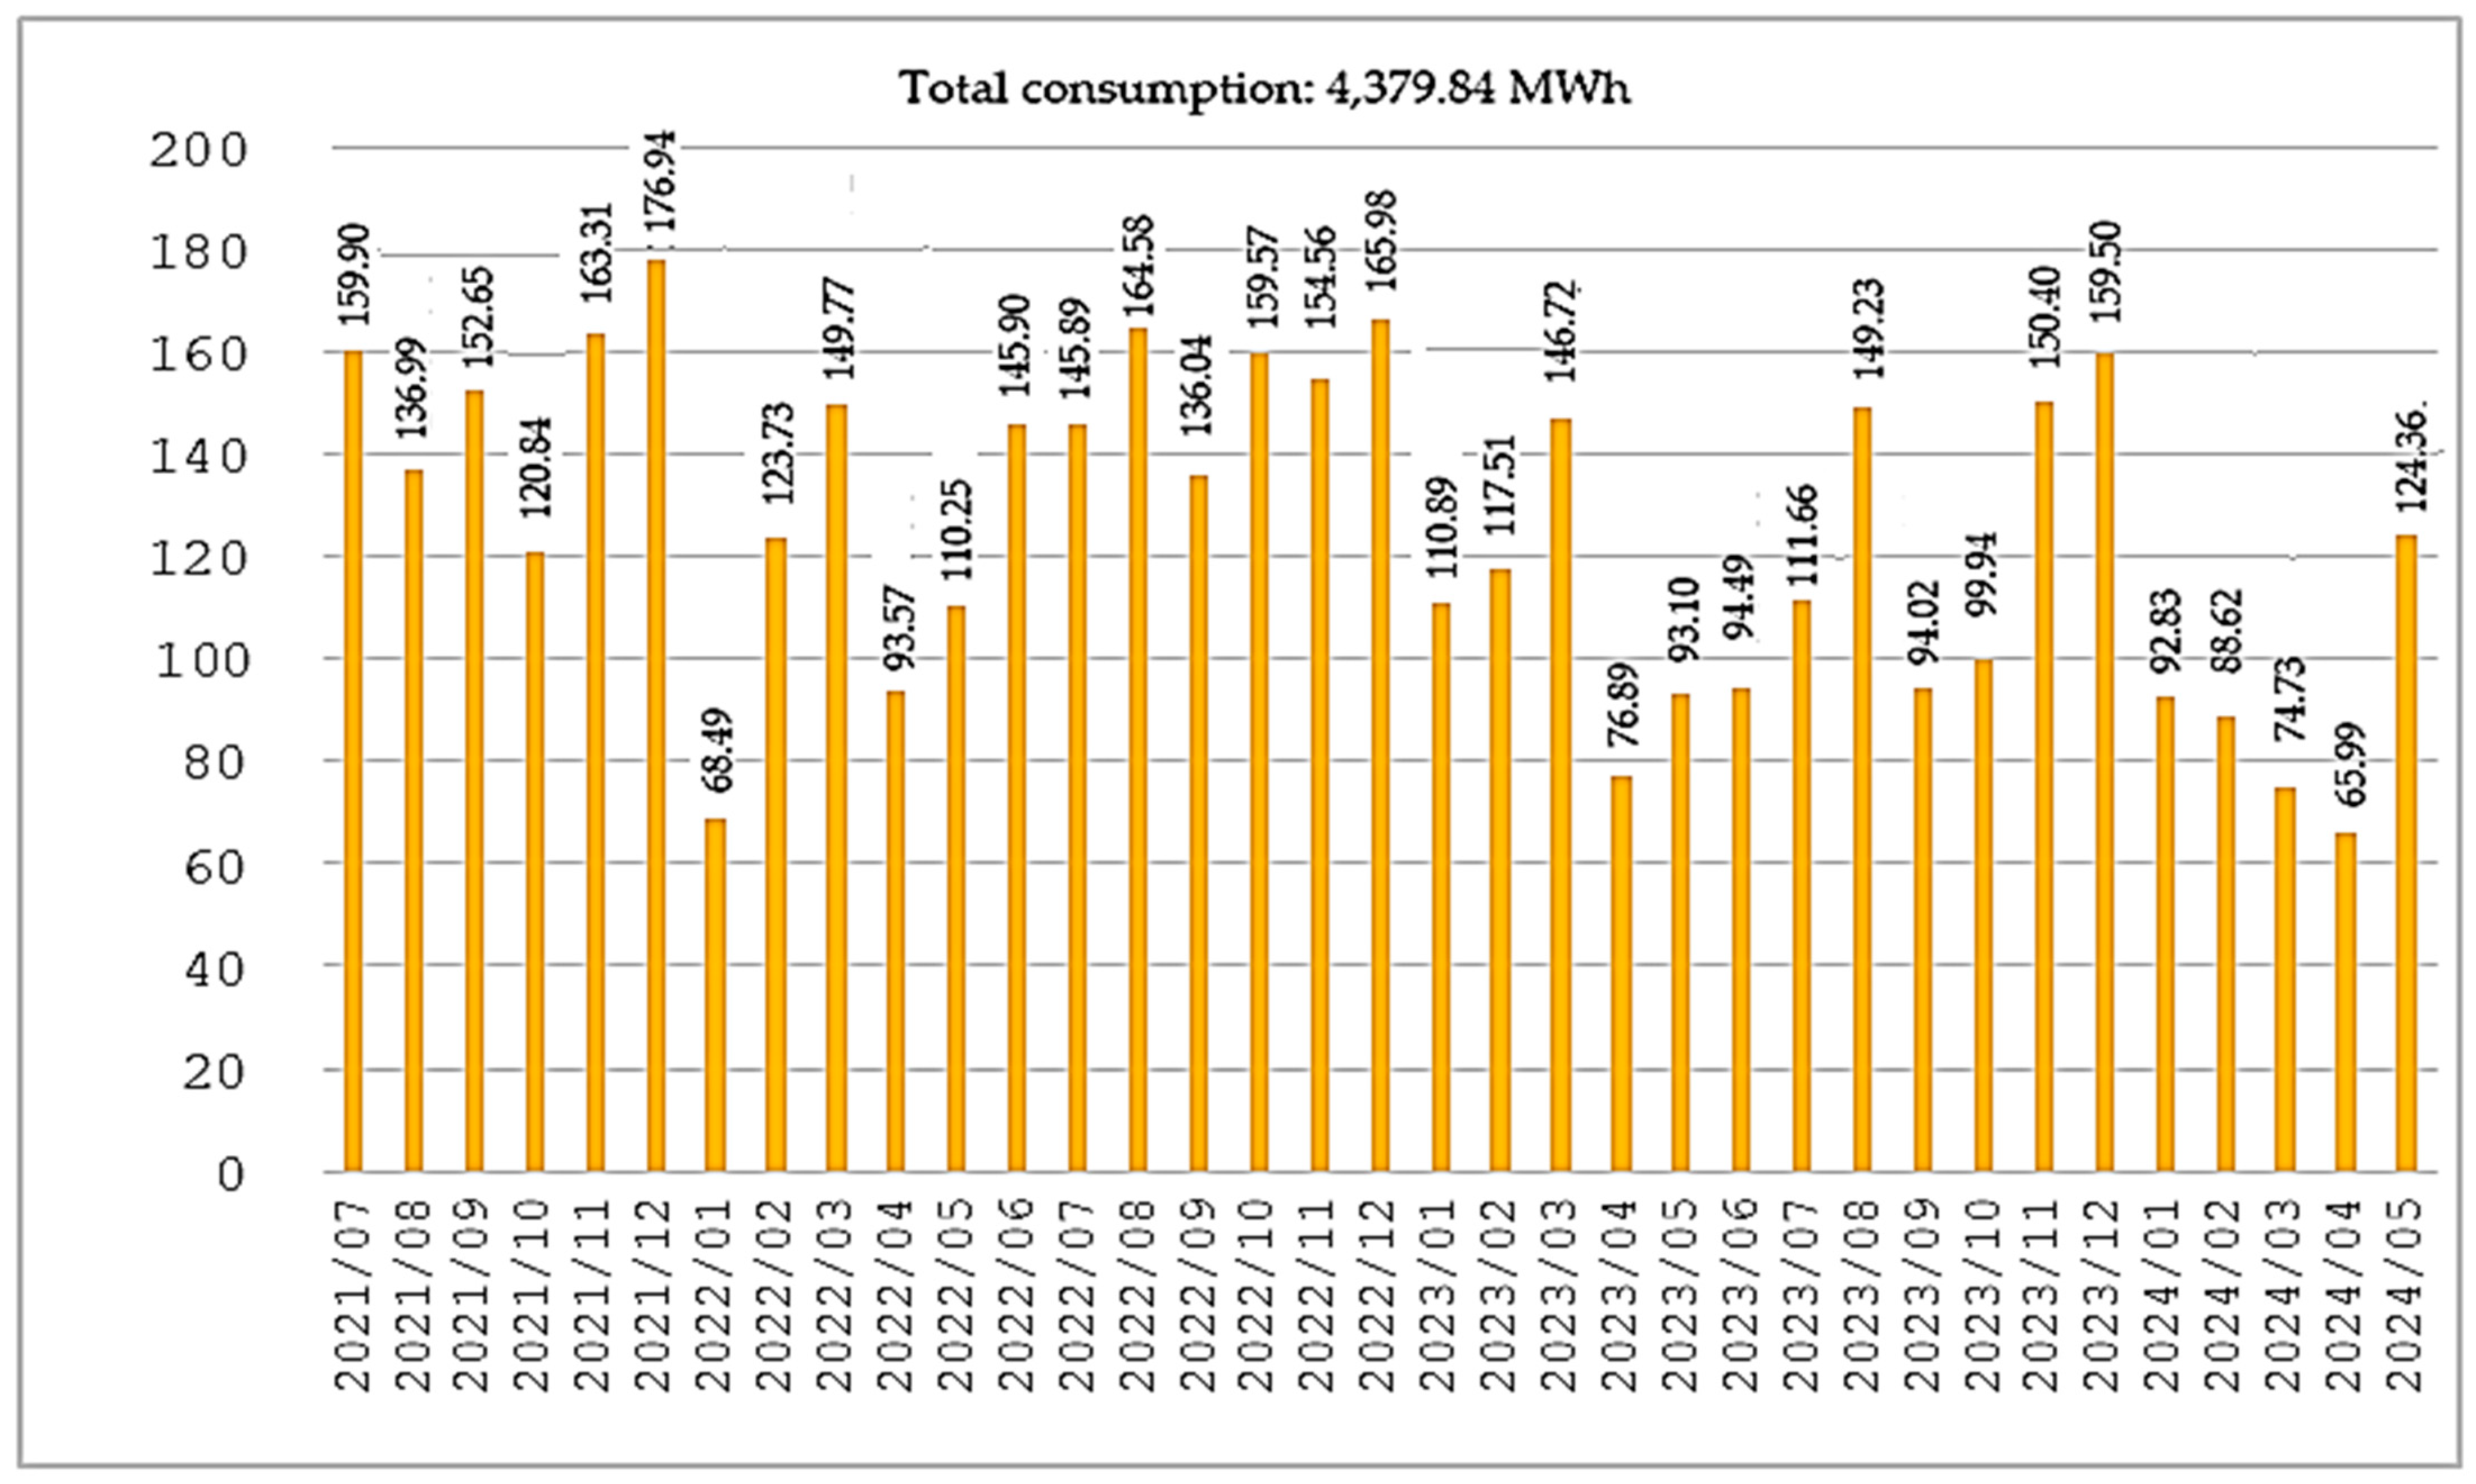
The energy balance of a photovoltaic installation in an enterprise includes the total energy consumed by the company, which consists of energy taken from the grid and consumption of energy produced by the PV system. In addition, the energy fed into the grid and the total energy produced are taken into account. Understanding these aspects is crucial for assessing the efficiency of a photovoltaic system and for the optimal management of a company’s energy resources. This part of the research presents data presenting the overall energy consumption, consumption from the network, and transfer to the network from a photovoltaic installation with a capacity of 655 kW. The analysis of these data was divided into two parts. First, separately for each type of energy component, and the second part describes the groups presented on one chart to characterize the cooperation of the PV installation with the network and the company. Figure 7 shows the company’s total electricity consumption in a given month and the total consumption since the launch of the photovoltaic installation. Figure 7 shows the demand for electricity in the company over the last 35 months. This period is also the period of operation of the PV installation, thanks to which these data will be possible to analyze. During this time, a total of 4380 MWh of electricity was used for the company’s needs. The presented data cannot determine a trend, because the data are not repeatable, but rather there are clear differences between the relevant months in different years. We can mark partial increases for months such as July, August, November, and December. The results depend on the company’s current production and orders received. It is worth noting the maximum consumption in one month, which occurred in December 2021 (178 MWh), and the lowest consumption recorded for April 2024 (66 MWh). The average value for the month in the visible period is approximately 125 MWh. When comparing the data, it can be seen that the described PV installation generated a total of 1683 MWh, which is 38% of the company’s total energy consumption at that time.
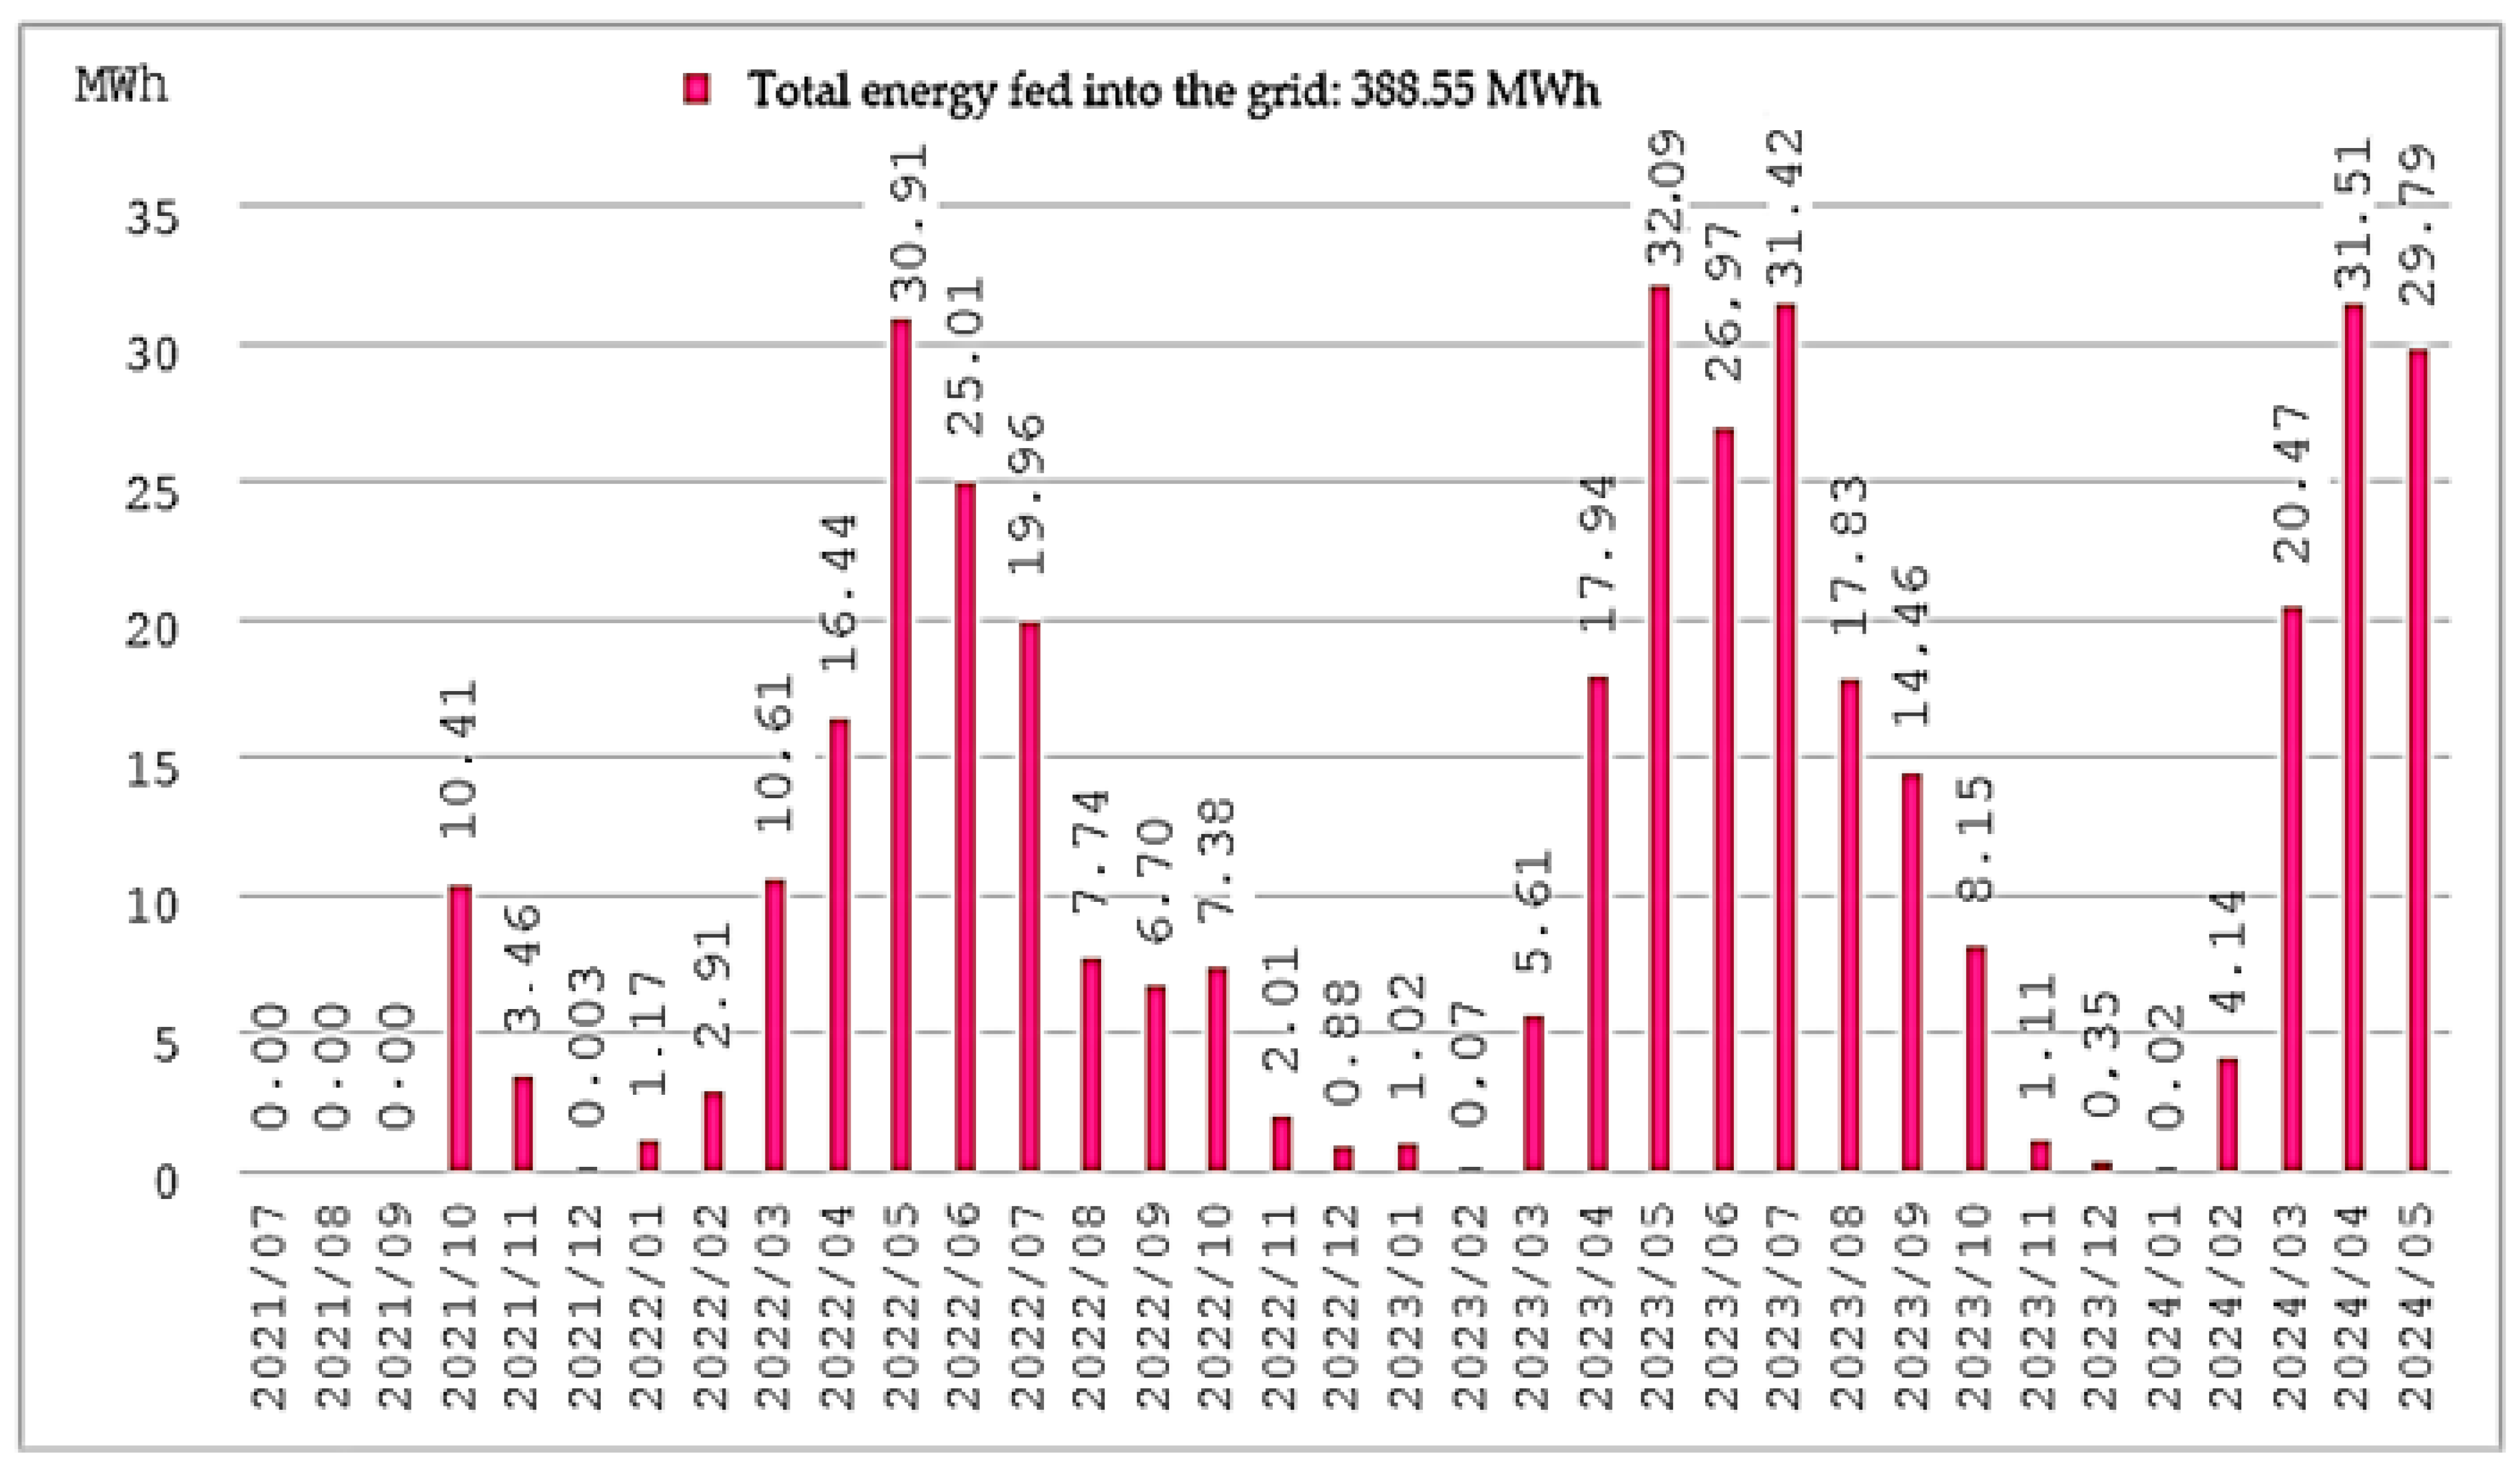
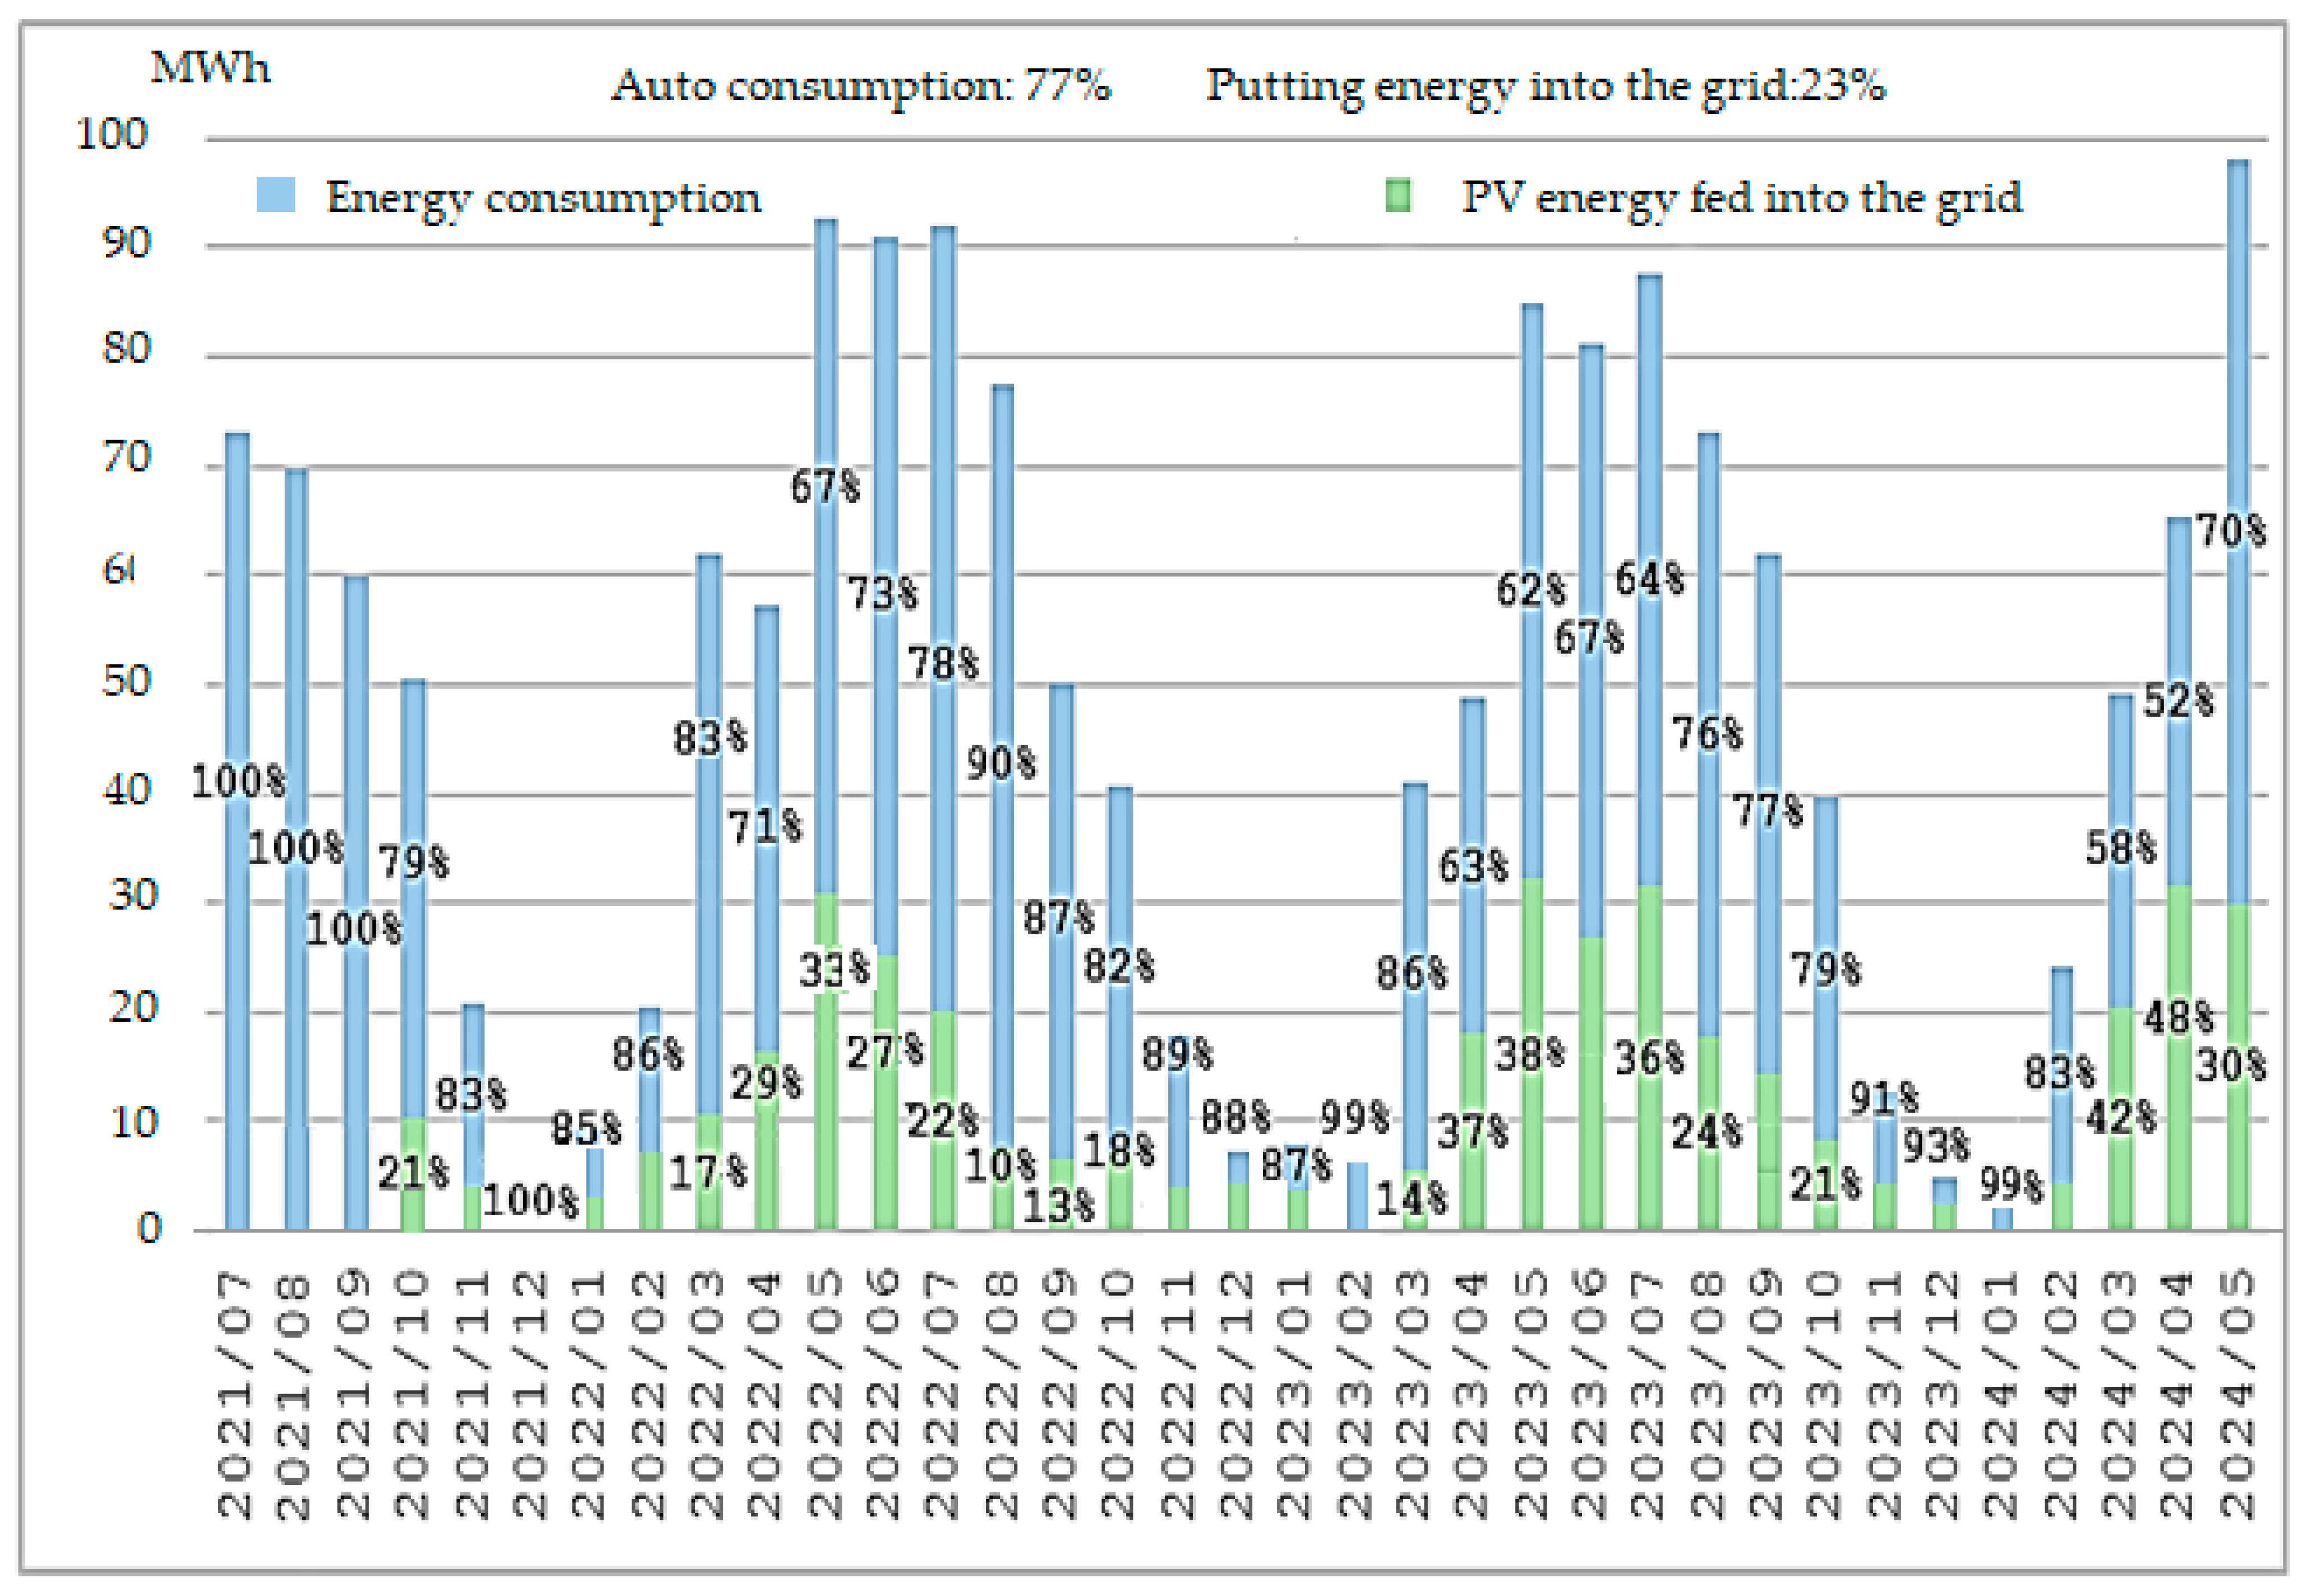
It should be remembered that not all of the energy produced from the PV system was used directly for the company’s needs, but some of it was sold back to the grid (Figure 8). Figure 8 shows a similarity with the data shown in Figure 7, whereas the overall production increases in a given month, there is an increase in energy being fed into the grid, which proves that PV production at a given moment exceeds the energy demand in the company. It is this nature of the data that shows the scope for using energy storage, which is intended to minimize the release of energy into the grid, as it is of little benefit to the company. The difference between the overall production of the PV system and the transmission of energy to the grid shows that at the moment the company directly consumes about 77% of the total production of the PV installation, and the remaining 23% goes to the grid.
The self-consumption chart of electricity produced by the PV installation is shown in Figure 9. In Figure 9, you can see that in the case of lower overall production, less electricity is fed into the grid, and as overall production increases, the percentage of energy fed increases, mainly from April to October. We also see that 77% of the total PV production is directly used for the company’s needs. The remaining 23% goes to the distributor, and it is this percentage that should minimize the potential battery. All the above data presented each of the groups included in the company’s energy balance, individually.
After preliminary analysis of all available data, they were presented collectively in Figure 10, which allows us to finally understand the operating characteristics of a specific photovoltaic installation (without energy storage) in cooperation with the power grid and the enterprise, and highlight places where the use of energy storage could bring additional benefits. In Figure 10, you can see that the superimposed data show the electricity consumed and fed into the grid, the production of the PV system, and the total energy consumption in a given month. This presentation of data allows you to see several dependencies and characteristics of the use of a PV installation without a battery in an enterprise. Additionally, you can determine the relationship between PV production (green line) and energy taken from the grid (orange columns). When PV production increases, energy consumption from the grid decreases, which is best visible in the months from May to July. The opposite is true when production decreases, because at that time the consumption from the network increases significantly, almost to the level of general consumption, which can be seen in December. When we additionally take into account the electricity fed into the grid (blue columns), we also notice a relationship with the previous data, because when PV production increases, the electricity fed into the grid also increases and, in turn, the consumption decreases.
This situation is most visible in May and during the summer months. The distance from the top of the blue column to the green line is the same as the distance from the top of the orange columns to the navy blue line. This proves that the missing electricity, which is not taken from the grid, is filled by photovoltaic energy. The potential use of electricity storage should minimize the blue and orange columns, i.e., the consumption and transfer of electricity to the grid.

4.3. Electricity Storage for PV—Measurement and Analysis

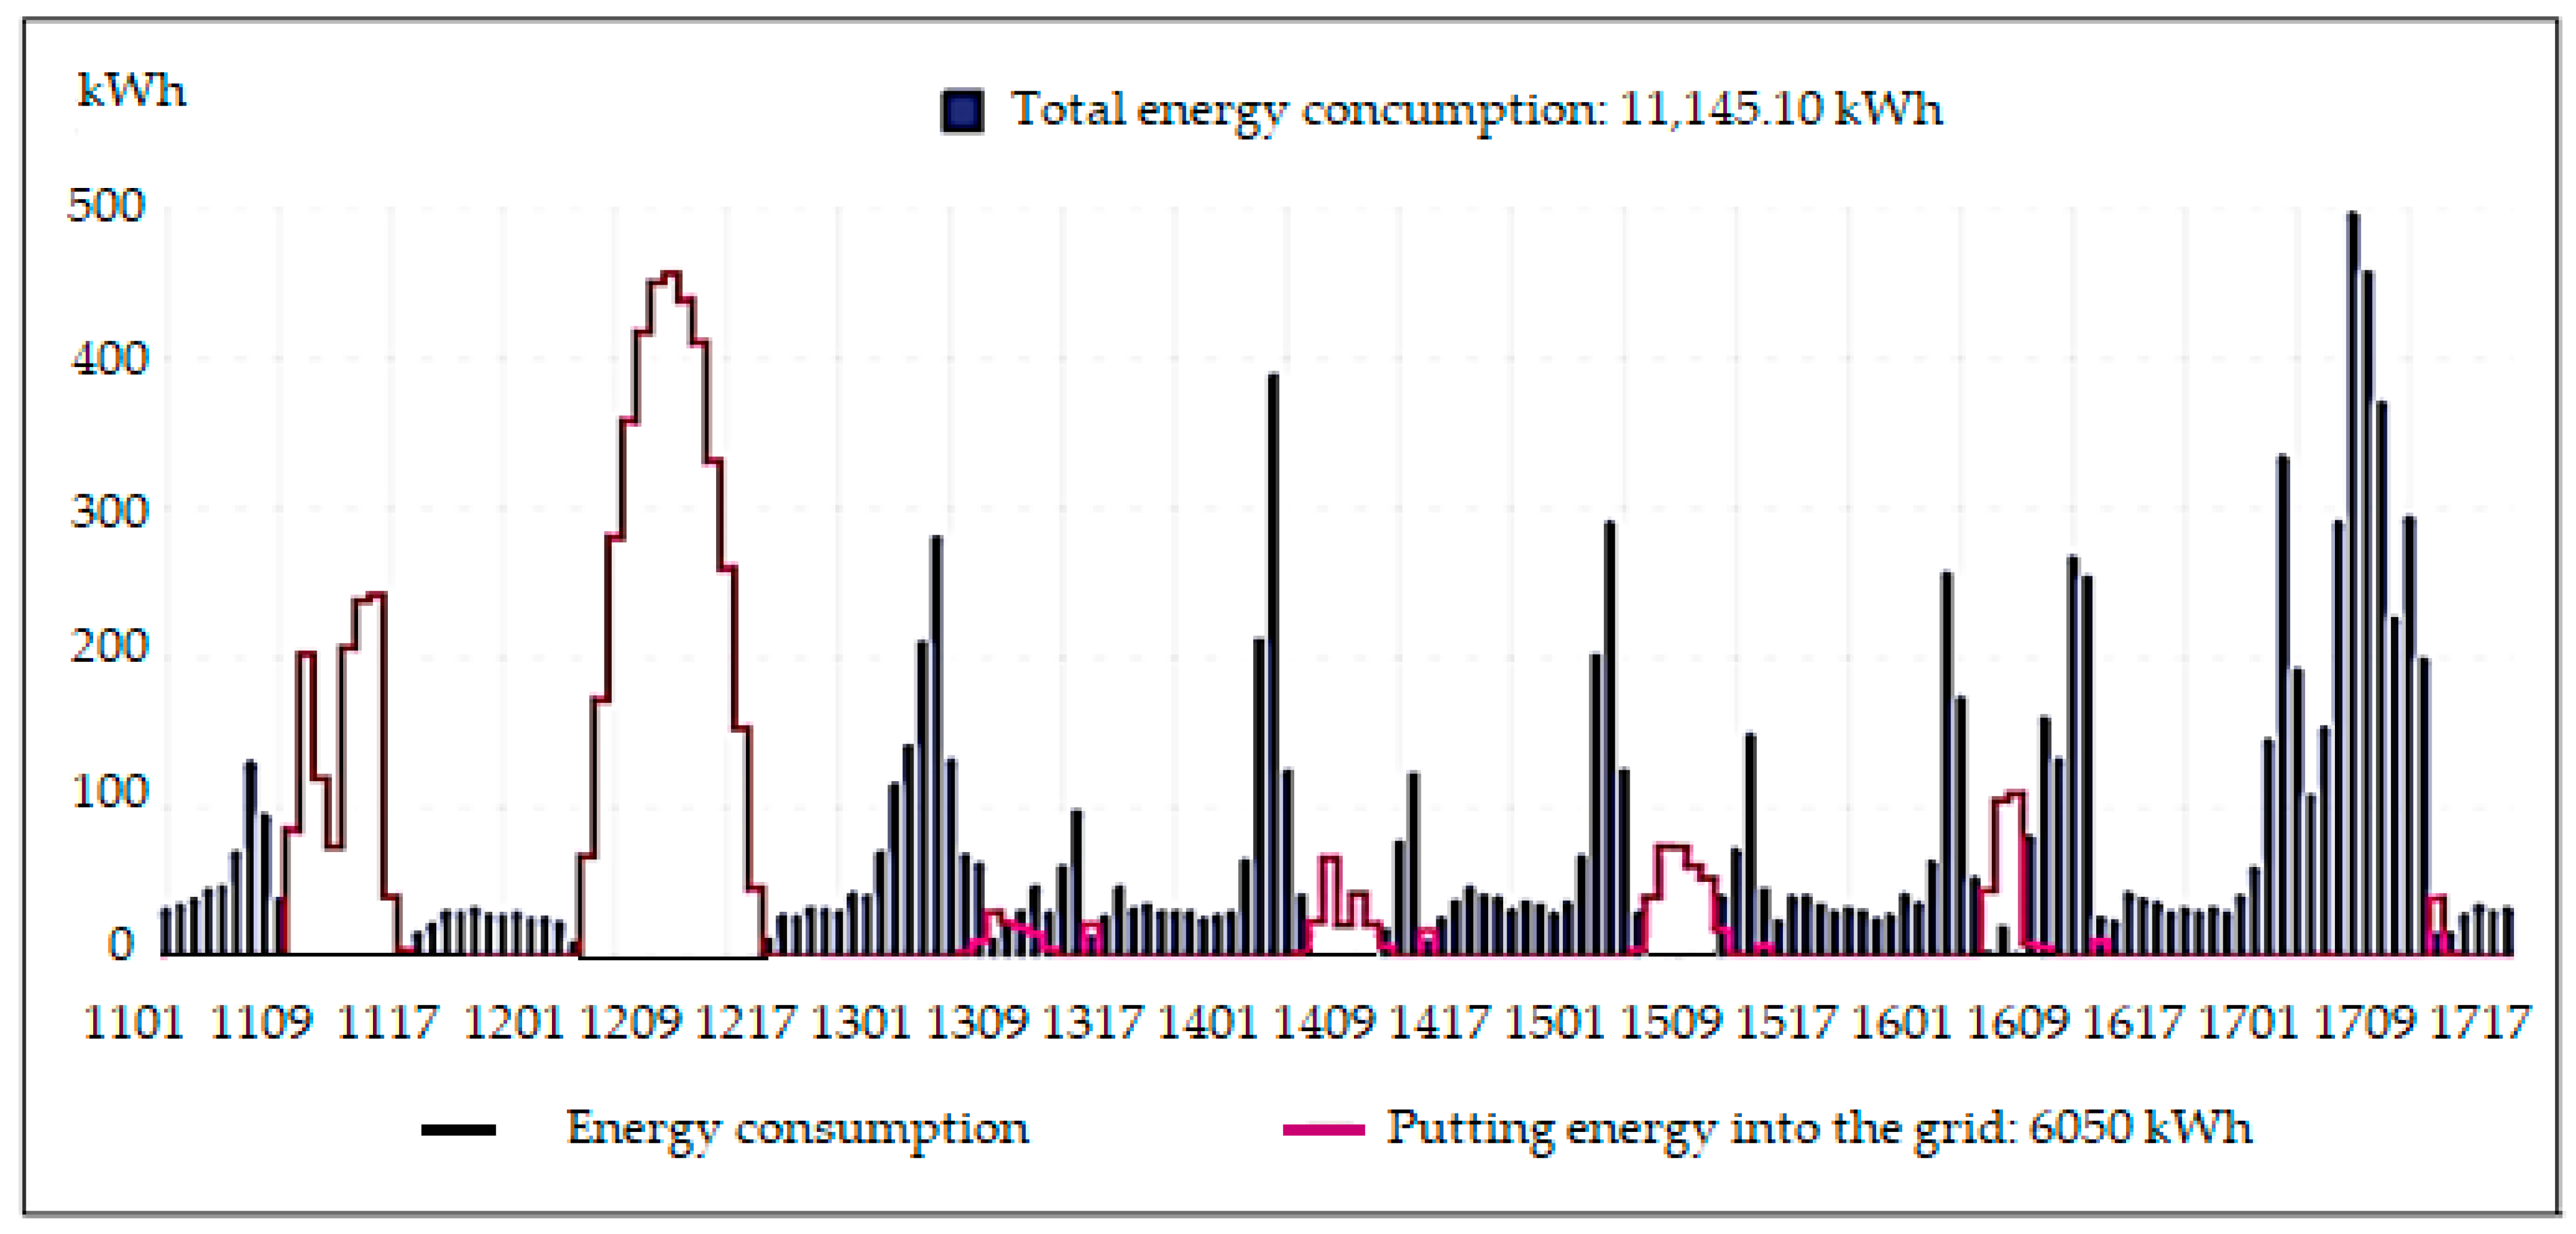
This part of the research aimed to present and indicate situations in the energy balance where the use of energy storage may bring benefits to the analyzed PV installation. For this purpose, very detailed data will be presented, showing the energy distribution over several selected days, in 15 min intervals. This type of analysis should indicate the exact use of batteries, i.e., moments in the 24 h when the energy storage should be charged and then release energy. Only analyzing the data in this context will enable further selection of the energy storage in terms of operating characteristics, capacity, and power. Data from the period 11–17 May 2024 were selected for the initial analysis (Figure 11), which will be narrowed down to one day in the following. In Figure 11, you can see the consumption and delivery of electricity by the company in the selected week of May 2024. Analyzing the data, you can see that on Saturday and Sunday (11 and 12 May 2024) consumption from the network occurs only at night. There is no network consumption during the day (dark blue columns) and the consumption is high (pink line) because these are days when the company is not working. This means that on these days, PV energy meets the entire daily demand, the excess production is fed back to the grid, and the energy demand at night is only maintained by the grid. Taking only these two days into account, the role of the energy storage will be to store part of the energy fed into the grid during the day and to meet a small demand at night. In this way, with optimal PV production, electricity consumption on days off or with limited production can be reduced to zero or negligible values, which will bring tangible benefits throughout the year. Then, on working days (13–17 May 2024, Monday–Friday), you can see its repeated dependencies:
-
Higher consumption from the grid starts in the afternoon between 4 and 8 p.m.—the situation occurs when PV production drops in the afternoon and the energy demand is the same all day long until the machines are turned off.
-
During the night, the consumption from the network is small but constant—the PV installation does not work, and the energy needed to maintain the operation of the devices is taken entirely from the network.
-
The next increase in grid consumption is in the morning between 6 a.m. and 9 a.m.—in this situation, when the company’s production starts around 6 a.m., PV production does not yet produce enough energy, so it must be taken from the grid.
-
Between 9 a.m. and 4 p.m., consumption from the grid decreases to low values and feeding into the grid increases, PV production is high and meets most of the demand, and temporary, dynamic spikes result from the current PV production and demand. Sometimes, at a given moment, the installation has higher production than demand and the energy must be sent to the grid, but there are also temporary drops in PV production when the network makes up for the shortage.
-
An exceptional situation took place on Friday, 17 May, when the grid consumption during the day was high and the transfer practically did not occur—in the week in question, there was one day with less favorable weather conditions, which translated into low PV production and immediately the electricity consumption from the grid increased to the highest level throughout the week.
The situations described provide the basis for identifying places where energy storage would improve the efficiency of the entire system. The basic role of an energy storage facility may be to temporarily store the excess PV energy produced, which now goes to the grid between 9 a.m. and 4 p.m. Purpose of the batteries should eliminate sudden increases in grid consumption during these hours and minimize energy released into the grid at this time. Additionally, filling the warehouse with electricity, which is fed into the grid at noon, can provide the company with energy for the next phase of the day, i.e., between 4 and 8 p.m. In the case of a day with high PV production, the excess PV energy stored on that day can be used the next day for the morning peak in demand.
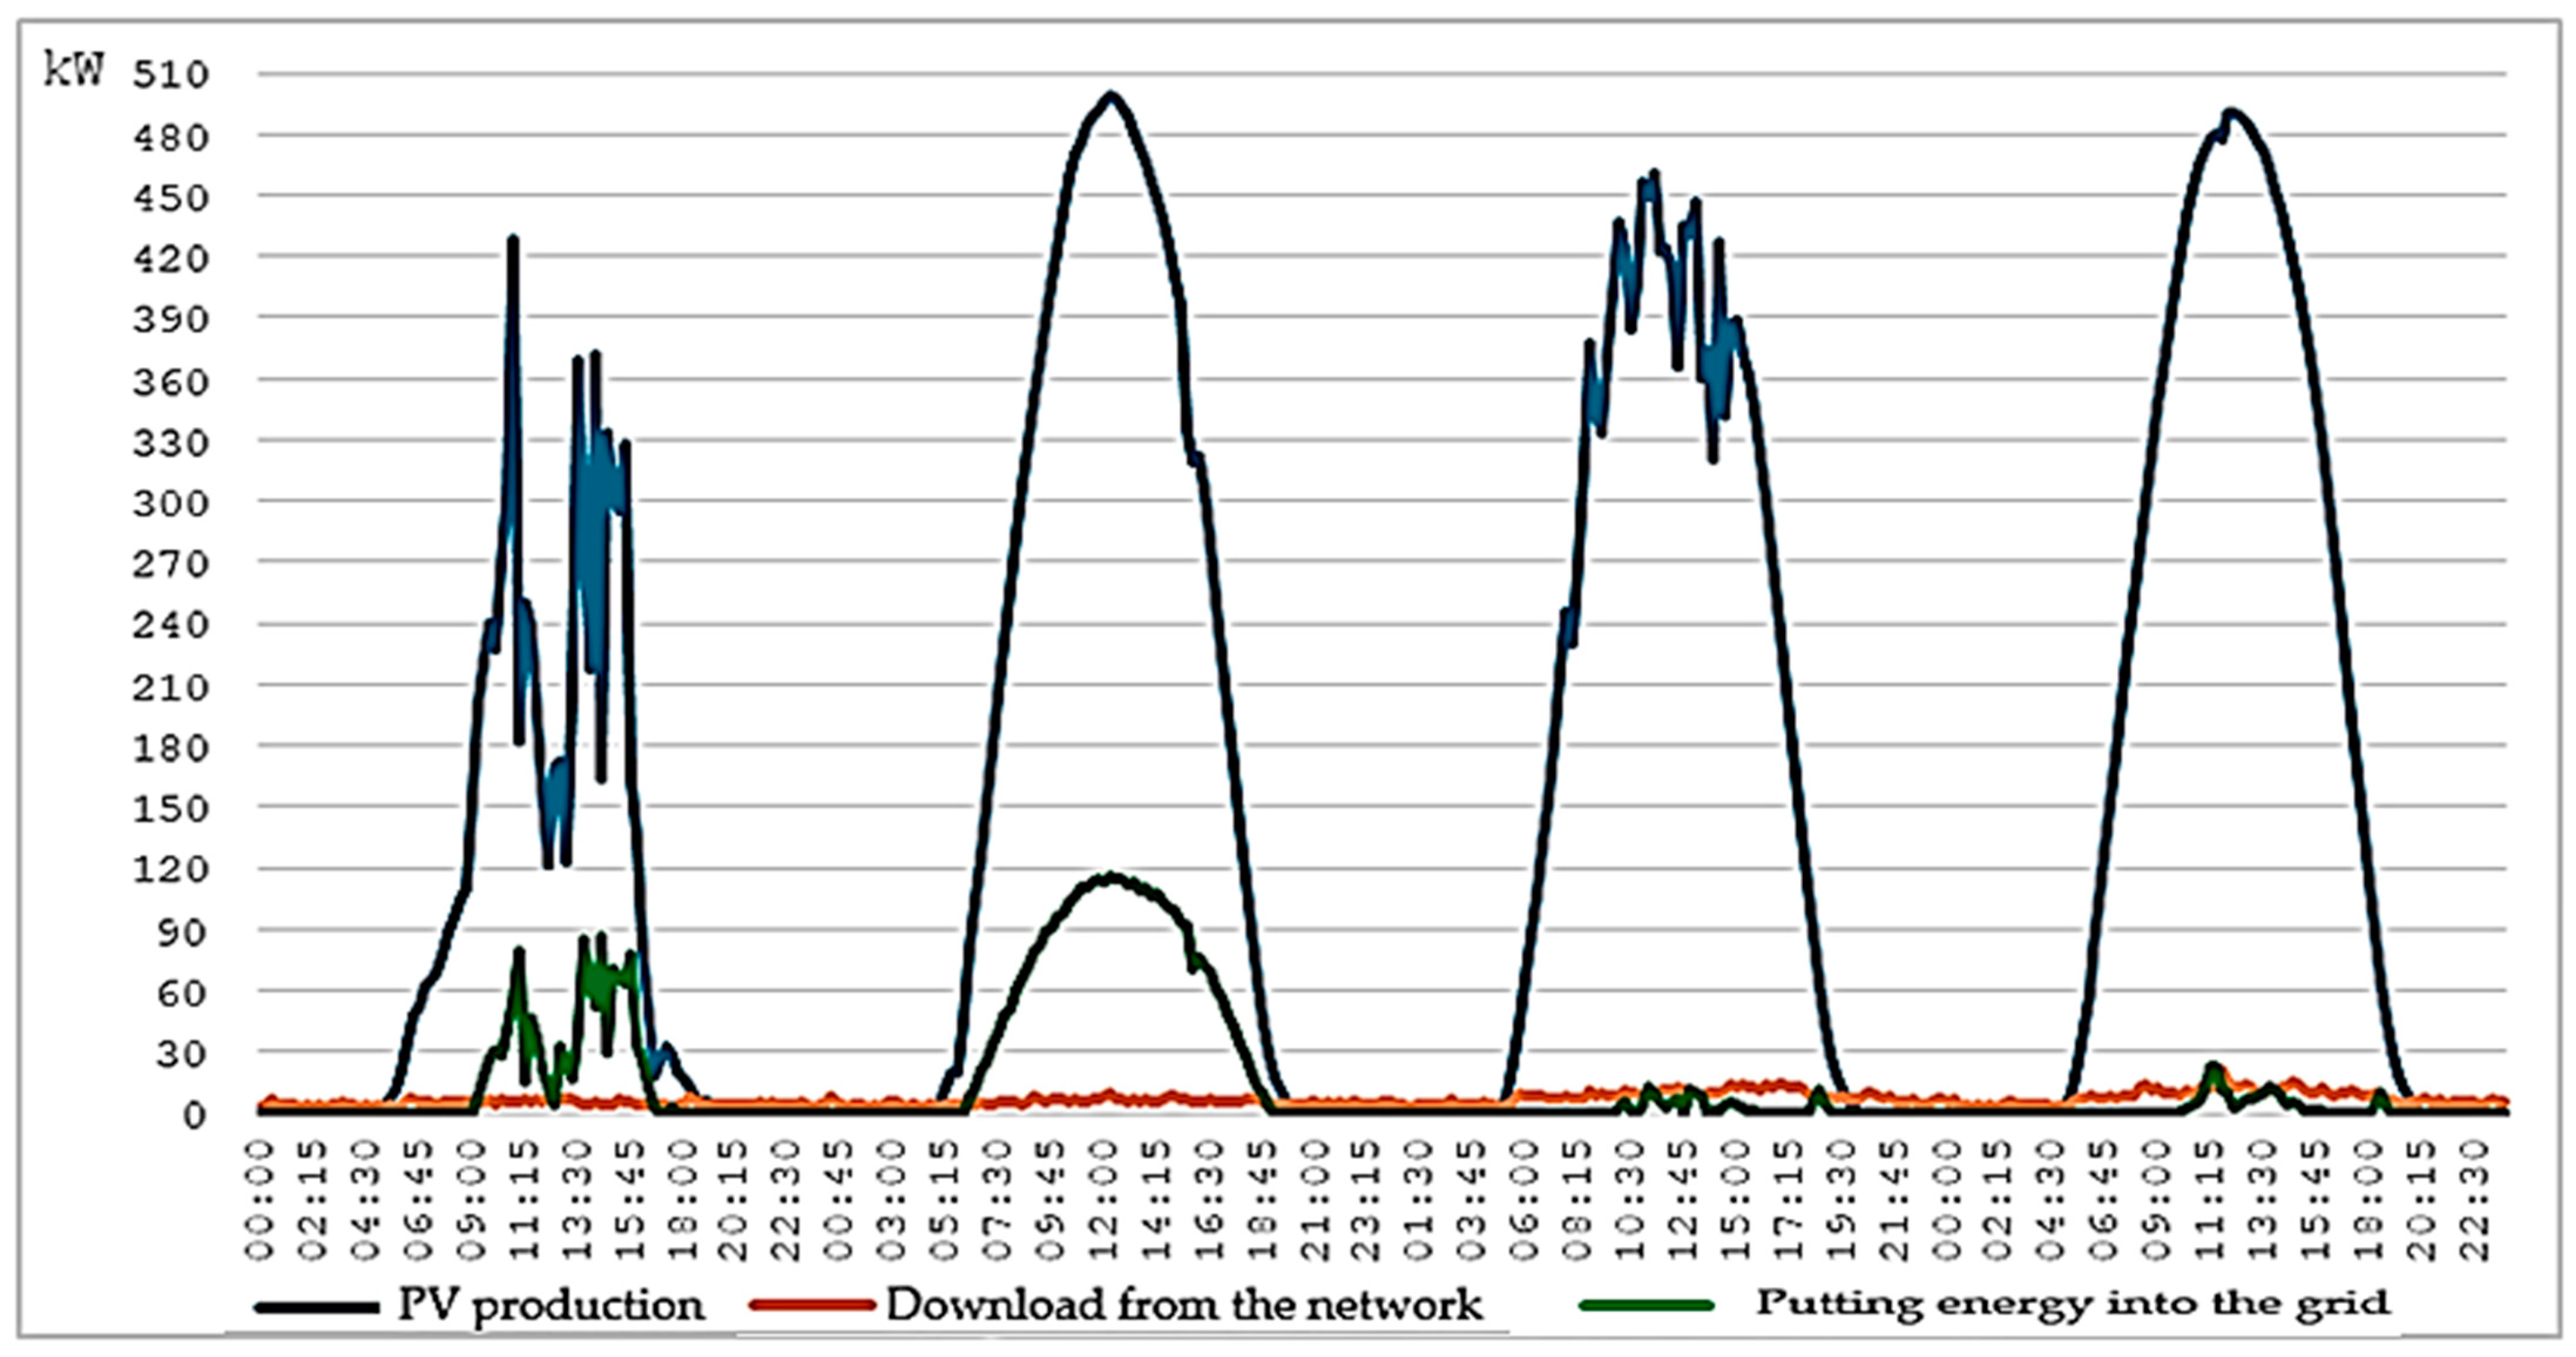
To present the data from (Figure 11) more precisely, they have been narrowed down to four days, from Saturday to Tuesday (11–14 May), and supplemented with 15 min records of photovoltaic energy production. Figure 12 reflects the proportions in the size of individual results and shows the large differences in the current PV production compared to the other data. Mainly, you should pay attention to the value representing the amount of energy produced by PV at a given moment, which reaches high values throughout the day. It can be seen that the energy consumption from the network at a given moment (orange line) remains constant and does not even exceed 15 kW but also does not drop to zero. On non-working days, the consumption is lower and stabilized, and on working days (the right part of the graph), you can see higher consumption and larger deviations. The green line shows the transfer of PV energy to the grid; therefore, it strictly depends on PV production (dark blue line). Large jumps in the PV production chart on Saturday and Monday indicate unstable weather conditions, the opposite is true on Sunday and Tuesday. It is worth explaining the fact that despite much higher PV production, energy is still consumed from the grid and, in addition, part of the production is released. History this is because, depending on weather conditions, the current production varies; hence, there are often situations where at a given moment the energy demand will be, for example, 30 kW and PV production will provide only 5 kW, while in a moment the installation will be able to provide 100 kW and the surplus must go online. It should be remembered that the graph shows 15 min values and the PV installation and machines operate with different loads at each moment. The use of energy storage can supplement the deficiencies at a given moment and, conversely, store the current surplus; i.e., its operation is dynamic to eliminate disproportions at a given moment.
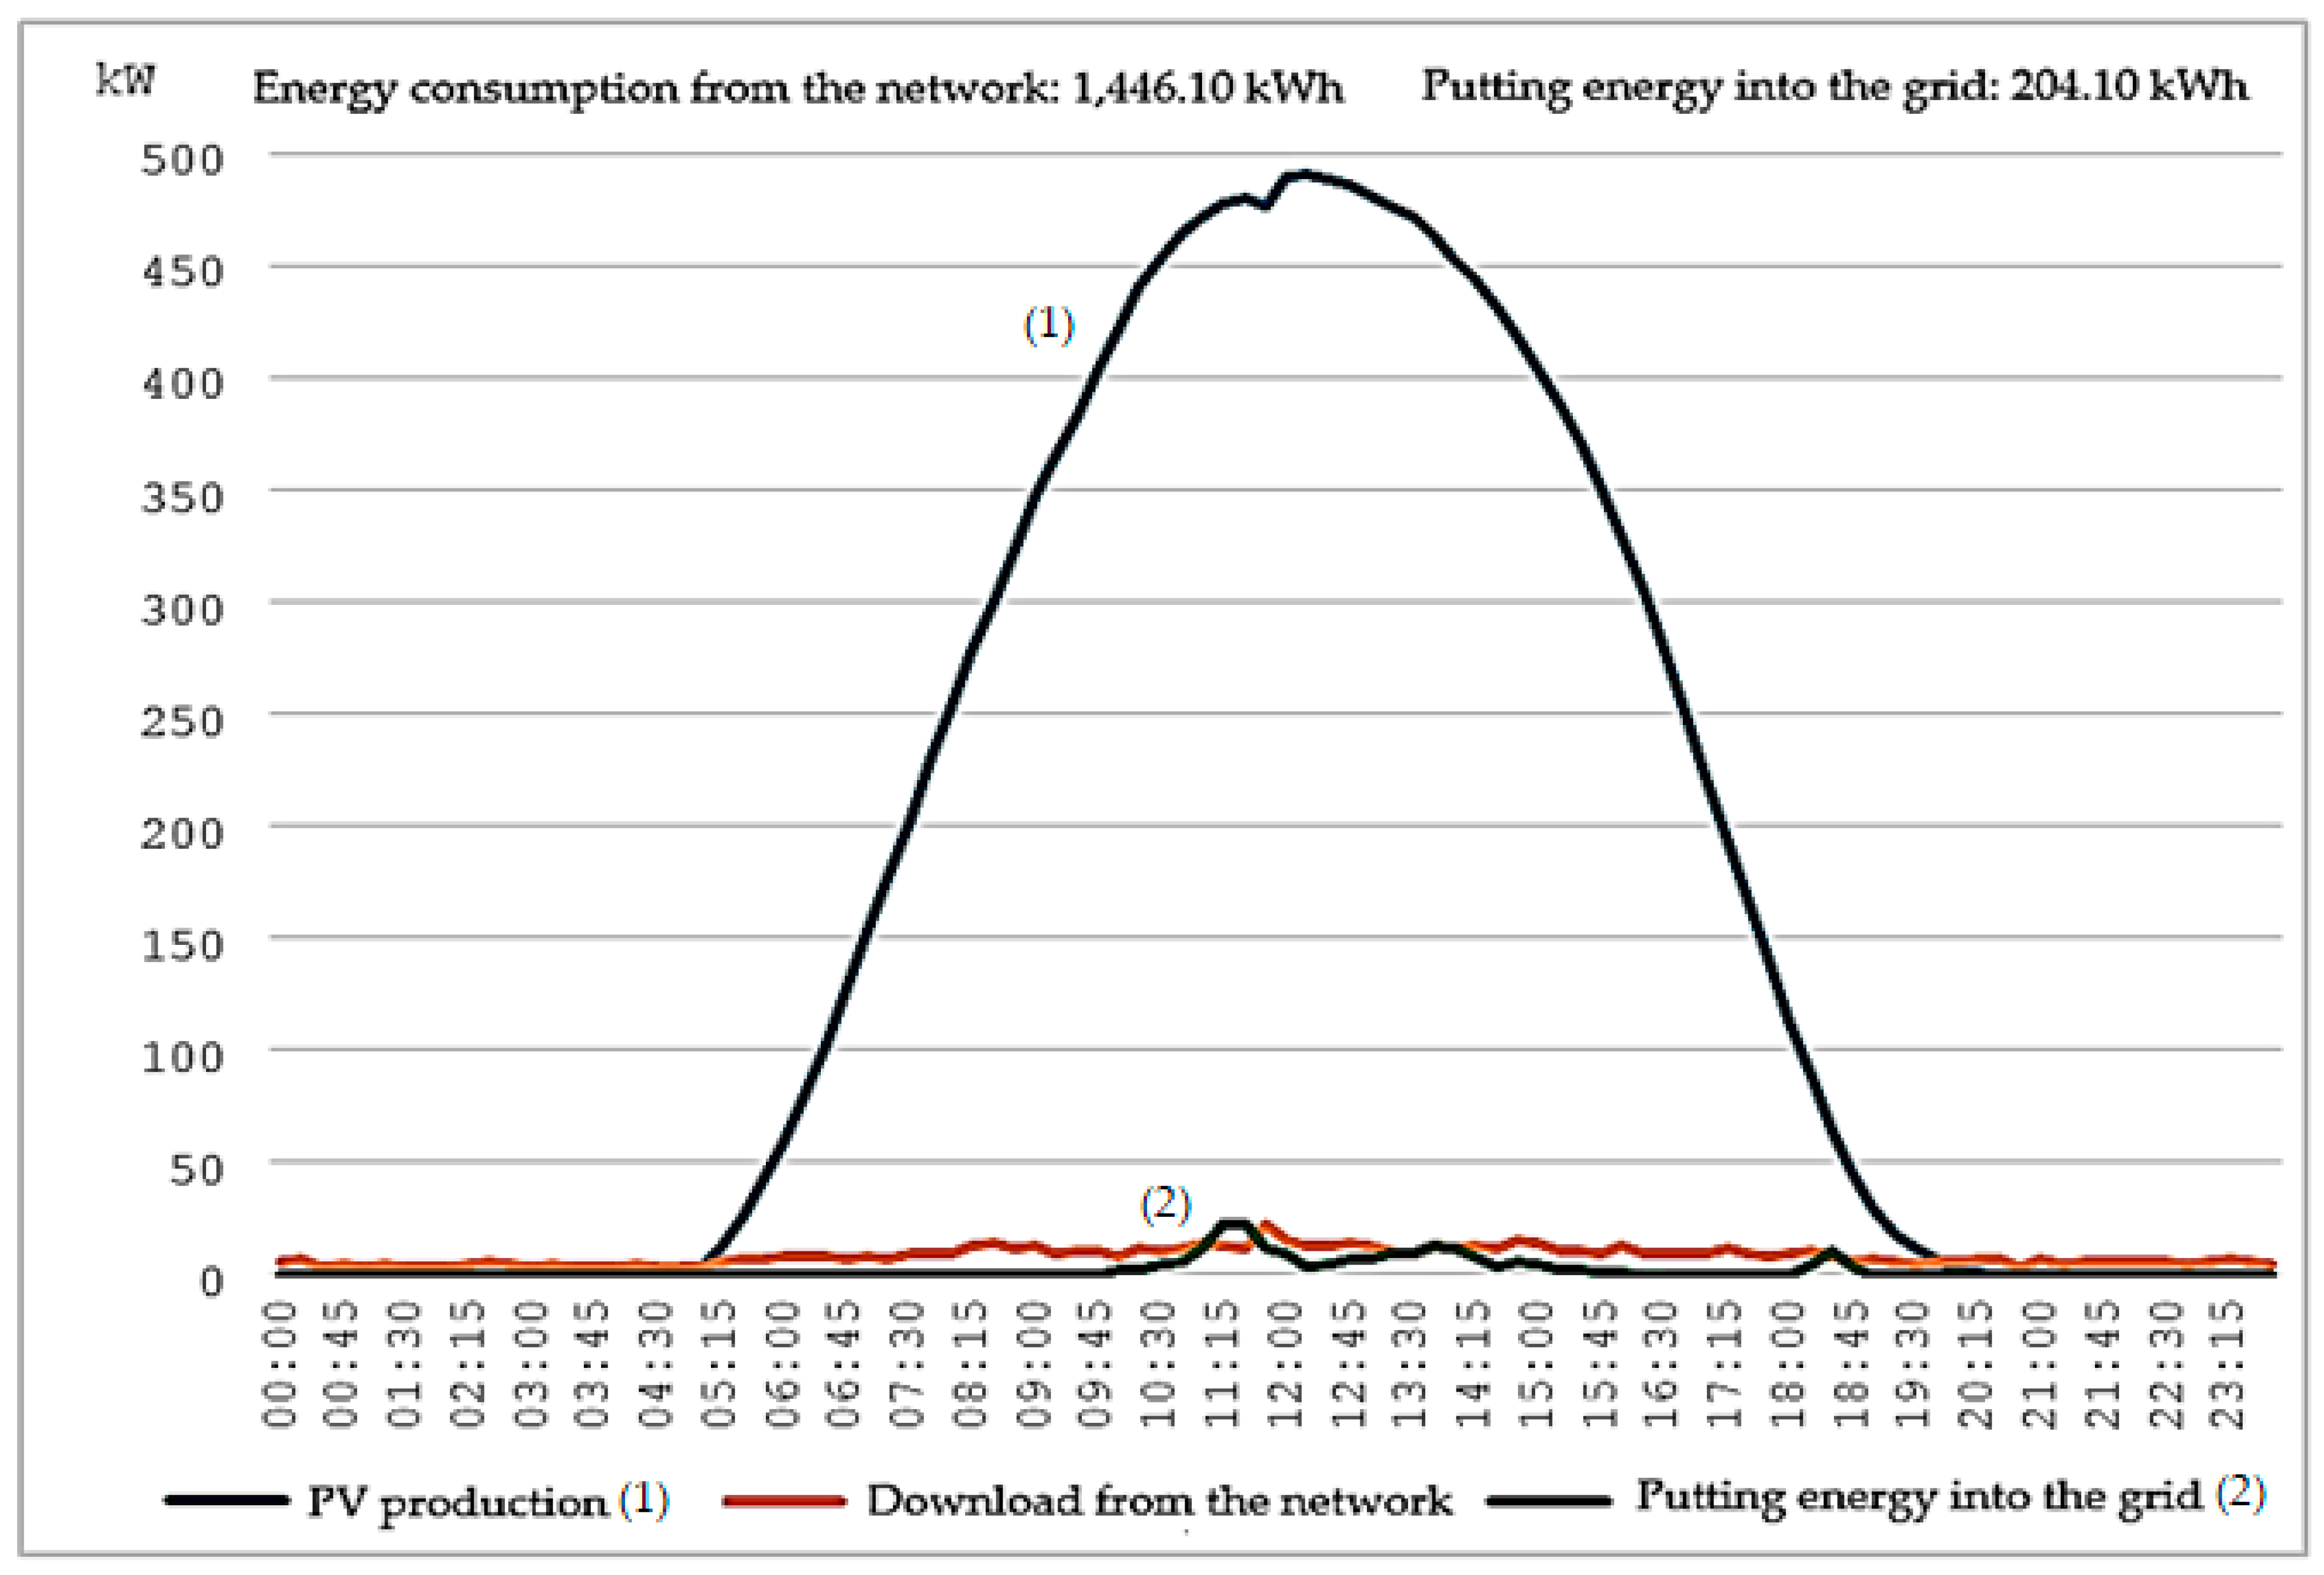
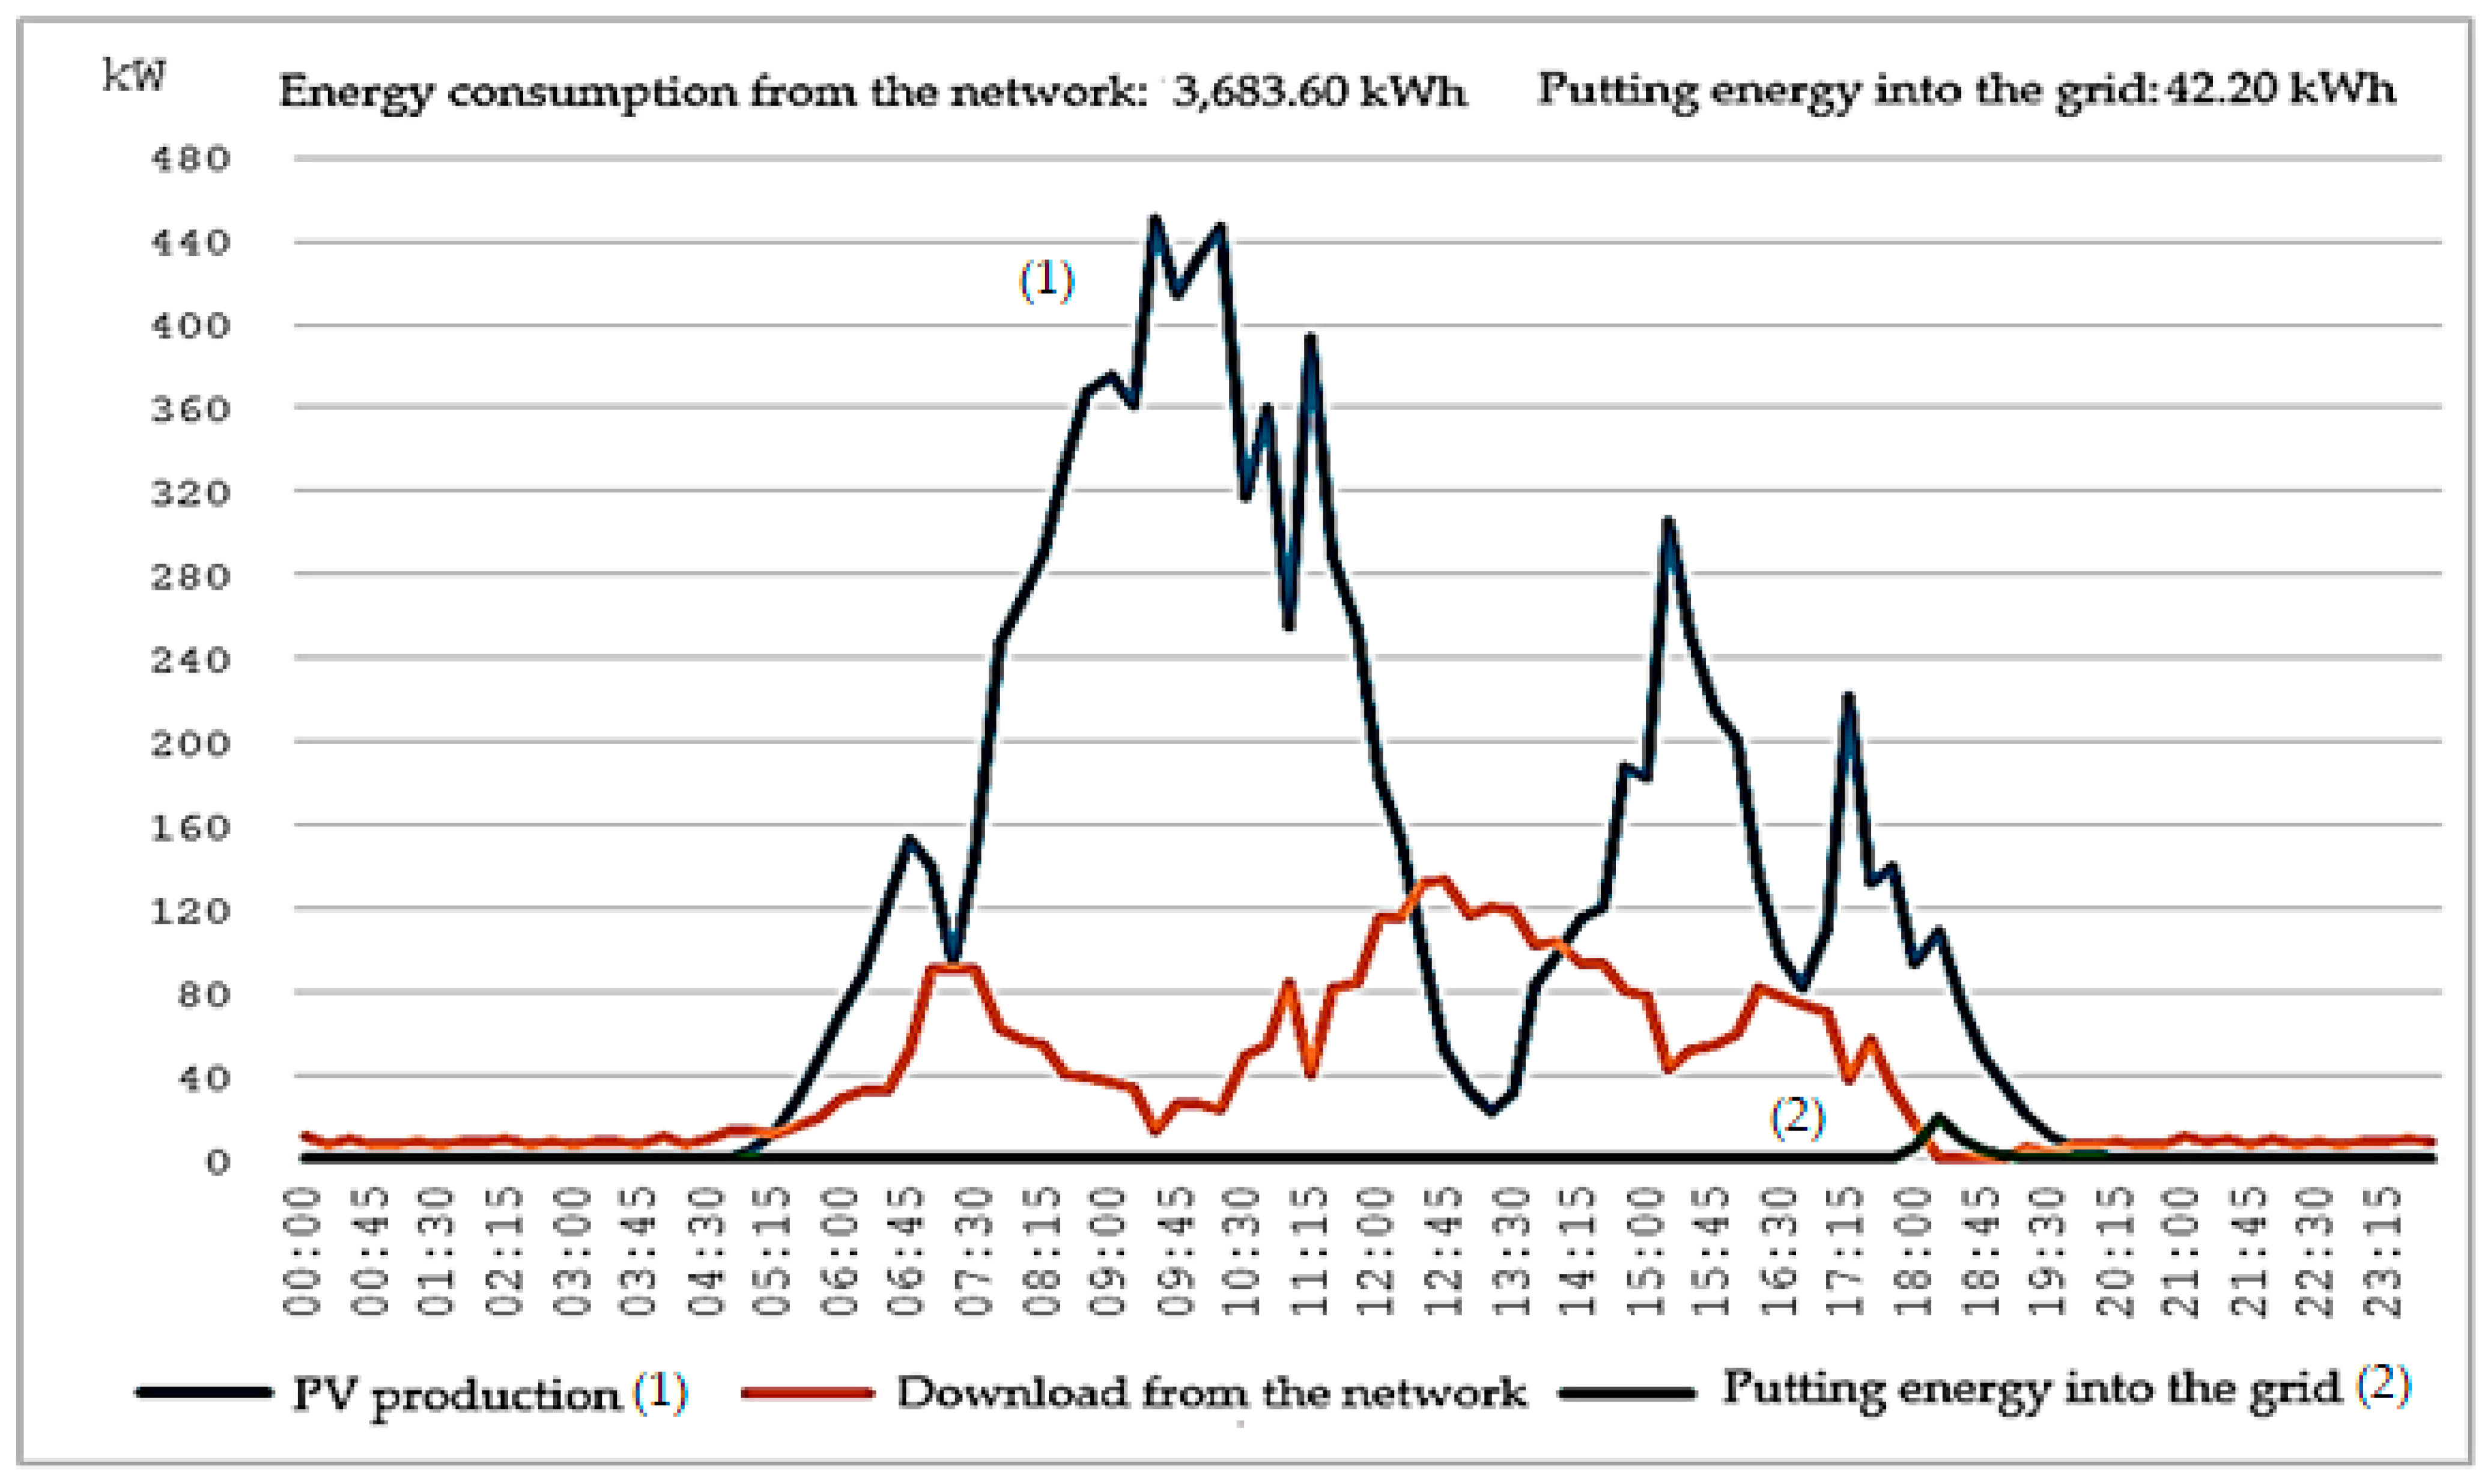
To illustrate the differences daily at different levels of PV production and different energy demands, the daily energy balance is presented in (Figure 13 and Figure 14) divided into 15 min. For comparison, results from two business days were included, i.e., Tuesday and Friday (14 and 17 May 2024). Figure 13 and Figure 14 show two working days with different characteristics. Figure 13 shows a day when electricity consumption was much lower and weather conditions were favorable for PV production, which is confirmed by the dark blue line, gently illustrating the energy produced. Figure 14 reflects data from a day of high energy consumption and lower PV production with constant fluctuations due to changing weather conditions. Despite the different demands on these days, they can be compared at the level of emerging trends. First of all, with high and uniform PV production during the day, the consumption from the grid is stabilized and the delivery is noticeable (Figure 13), while with lower PV production with constant fluctuations, there is a high consumption of electricity from the grid and a low level of its delivery to the grid network, as shown in Figure 14. This is particularly well reflected in the situation in Figure 14, when electricity consumption from the grid exceeds PV production (12–2 p.m.). Generally, the navy blue and orange lines are dependent on each other, which means that when PV production increases, grid consumption decreases. The use of energy storage in such a situation would reduce fluctuations during the day by storing the surplus in the morning, when PV production is high, and releasing electricity at the time of high demand at noon when the efficiency of the PV installation drops. In the case of 14 May, the energy storage would allow for storing the energy fed into the grid (green line) and partially meeting the evening or night demand.
The key data required to prepare a preliminary calculation for the selection of energy storage are the company’s energy balance for 12 months in 15 min cycles. The balance sheet includes data calculated as part of the research: PV energy production and electricity consumption and delivery to the grid. Based on the results summarized in this way, the manufacturer or service companies determine what battery power and capacity will be appropriate for a given installation. In addition to the report, the rated power of the photovoltaic installation and the manufacturer and model of installation components, such as inverters, are important. In this case, it is an installation with a power of 655 kW based on inverters. Depending on the type of components, the possibility of cooperation with an energy storage system is assessed. If the inverters are adapted to work with a battery, the costs of energy storage will be lower, but if the inverters are not able to cooperate, it is necessary to use additional devices that manage and supervise the energy flow.

4.4. Economic Assessment of the Use of Energy Storage—Calculation

The presented options for energy storage for enterprises differ primarily in the power and capacity of the devices, which affects their price. All these parameters have a direct impact on the profitability of the investment during operation. This part of the research presents the economic assessment of the use of energy storage for the analyzed investment. The assessment was made in a calculative approach in the form of the results of cooperation between the proposed energy storage facility and the existing photovoltaic installation in the enterprise. First of all, a basic calculation of the company’s energy demand had to be presented. Table 1 shows the real distribution of energy consumption in 2023, including grid and photovoltaic energy. In total, the company consumed over 1404 MWh of energy, and the installation produced over 550 MWh, of which over 393 MWh was directly consumed, which translated into an overall level of auto-consumption of 71%. The value of direct consumption PV energy was EUR 80. The surplus sold generated an annual revenue of EUR 16. The ordered power is still 800 kW, which generates a monthly cost of EUR 4. The total cost of energy in a given month consists of the sum of energy purchases and the capacity fee. The savings include revenues from the sale of surplus PV energy as the overall benefit of the PV installation in a head-to-head comparison. Reduction in energy consumed from the grid, self-consumption of PV energy, and revenues from energy sales allowed us to save a total of EUR 95,305 this year. Based on Table 1, an energy storage calculation report was prepared to assess the cooperation of the proposed devices with the photovoltaic installation in terms of investment profitability. The research assumed the installation of an energy storage facility with a power of 500 kW and a capacity of 1000 kWh. The benefits generated by the use of energy storage will be related primarily to current costs, taking into account the operating PV installation.
The output data of all calculations carried out are from 2023. The assumptions used for the calculation are presented in Table 2 and Table 3. The presented variant provides for a more powerful and larger energy storage, the contractual power is expected to be reduced by 120 kW and the capacity fee by approximately 80%, which significantly affects the overall costs per year. In Table 3, you can see an increase in self-consumption of PV energy in some months, up to 100%, which results in a low level of sales of surplus PV energy.
A summary of the annual benefits assuming this variant is attached in Table 4.
The PV system with the energy storage forms a whole that, working together, increases the efficiency of the PV installation, but it is worth separating the share of individual elements in the benefit comparison. Thus, from Table 4, it can be seen that the energy storage itself, by increasing the level of auto-consumption and reducing costs related to distribution fees, would save an additional EUR 40 in one year. Combined with PV, this would amount to EUR 128. An important function of the energy storage itself, apart from reducing energy consumption from the grid, is changing the distribution of electricity consumption in zones. Table 5 shows the rate of return on the investment. Table 5 shows that the entire investment, including the PV installation, will pay off within 6 years. In turn, according to the financial calculation of the energy storage itself, the payback period for such an investment is 9 years. The analyzed research variant increases the company’s consumption of PV energy by 14.18% and, by reducing costs for other factors, saves an additional EUR 40 per year.

5. Conclusions

All conducted research, analyses, and calculations are based on real results generated by the operating photovoltaic installation in the described enterprise. Having a complete overview of the characteristics of the 655 kW PV installation and the specificity of its operation over several years of operation, appropriate and applicable energy storage units in various capacity and power configurations were selected.
-
The base values of the calculation reports were the results generated by the PV installation and the energy balance enterprises throughout 2023. Calculations have shown that supplementing the described PV installation with an energy storage facility will increase the current level of auto-consumption of PV energy by over 14%.
-
The increase in self-consumption of electricity produced by PV means a decrease in the amount of electricity purchased from the grid and a reduction in the amount of energy sold, the sale of which is less profitable, which translates into overall savings for the company.
-
The benefits translate into the final effect of the energy storage operation, which brings additional annual savings for the company of approximately EUR 23,000 for a weaker device and approximately EUR 40,000 for a more powerful energy storage. Such values, interpreted only in the context of the efficiency and effectiveness of the photovoltaic energy storage for the company, provide grounds for stating that the use of such a device is justified and can significantly improve the efficiency of the entire photovoltaic system.
-
On the other hand, if the investment profitability factor is taken into account, which in the case of an enterprise is as important as the previous one, the final decision indicating the validity of investing in an electricity storage facility for a PV system is not obvious.
-
With the assumptions defined in this way, for which calculations were made, among others: (device parameters, current electricity prices, amount of distribution fees, and energy storage costs) it can be concluded that despite the relatively high savings generated annually by the electricity storage for the company, this investment is unprofitable. The basis for such a statement is carried out financial calculations, taking into account the necessary financial outlays and the potential profits generated by the device on an annual basis, which showed that the payback period for such an investment is 9 years.
-
Taking into account the specificity of battery devices, which lose their efficiency over time, and also remembering that the manufacturer’s warranty for the devices is only two years, it can be concluded that such a payback period is unfavorable and therefore the investment is not justified in practice. This final decision is influenced primarily by the high price of the electricity storage itself and the currently unpredictable factor of reliability of battery devices over a long period of operation.
To sum up, the conclusions drawn based on the analyses, research, and calculations carried out allow us to conclude that, given the assumptions defined in this way and the current market conditions, an investment in an electricity storage facility for an enterprise with a photovoltaic installation is currently unprofitable. Nevertheless, the demonstrated savings that electricity storage can generate on an annual basis give an optimistic view of the future. The main factor that currently makes investing in an electricity storage unit unprofitable is the high price of the device itself. Reducing this price in the future, possibly thanks to the dynamically developing renewable energy industry, may make such investments profitable.

Author Contributions

Conceptualization, M.N. and J.M.; methodology, M.N. and J.M.; software, M.N.; validation, M.N.; formal analysis, M.N.; investigation, M.N. and J.M.; resources, M.N.; data curation, M.N. and J.M.; writing—original draft preparation, M.N. and J.M.; writing—review and editing, M.N. and J.M.; visualization, M.N.; supervision, M.N. and J.M.; project administration, M.N. and J.M.; funding acquisition, J.M. All authors have read and agreed to the published version of the manuscript.

Funding

AGH University Krakow: Agreement No. 16.16.200.396/B410.

Data Availability Statement

Data are contained within the article.

Conflicts of Interest

The author declares no conflicts of interest.

References

  1. Derski, B. Power Industry in Poland in 2019—Power and Energy Production According to Data PSE. 2019. Available online: https://wysokienapiecie.pl/27524-energetyka-w-polsce-w-2019-roku-moc-produkcja-energii-wg-danych-pse/ (accessed on 31 January 2023).
  2. Fic, K. The Use of a Photovoltaic Installation in the Company. Master’s Thesis, AGH University of Krakow, Kraków, Poland, 2023. [Google Scholar]
  3. Worku, M.Y.; Hassan, M.A.; Abido, M.A. Real-Time Energy Management and Control of Renewable Energy based Microgrid in Grid Connected and Island Modes. Energies 2019, 12, 276. [Google Scholar] [CrossRef]
  4. Benalcazar, P.; Suski, A.; Kamiński, J. The Effects of Capital and Energy Subsidies on the Optimal Design of Microgrid Systems. Energies 2020, 13, 955. [Google Scholar] [CrossRef]
  5. Marszałek, K.; Dyndał, K.; Lewińska, G. Fotowoltaika; Akademia Górniczo-Hutnicza im. St. Staszica w Krakowie: Krakow, Poland, 2021. [Google Scholar]
  6. Szymański, B. Instalacje Fotowoltaiczne; Globenergia: Kraków, Poland, 2018. [Google Scholar]
  7. Gancarczyk, P.; Kielin, J.; Kołodziejczyk, T.; Piasecki, M.; Zboina, J. Selected Usage and Safety Issues in Photovoltaic Installations (Wybrane Zagadnienia Użytkowe i Bezpieczeństwa w Instalacjach Fotowoltaicznych); CNBOP-PIB: Józefów, Poland, 2021. [Google Scholar]
  8. Al Shaqsi, A.Z.; Sopian, K.; Al-Hinai, A. Review of energy storage services, applications, limitations, and benefits. Energy Rep. 2020, 6, 288–306. [Google Scholar] [CrossRef]
  9. Mikulik, J.; Niekurzak, M. Impact of a Photovoltaic Installation on Economic Efficiency on the Example of a Company with High Energy Consumption; Zeszyty Naukowe, Organizacja i Zarządzanie Seria Nr 169; Politechnika Śląska: Gliwice, Poland, 2023. [Google Scholar]
  10. Krawczak, E. Trends in Silicon Solar Cell Technologies (Trendy w Technologiach Krzemowych Ogniw Słonecznych). Ph.D. Thesis, Lublin University of Technology, Lublin, Poland, 2020. Interdisciplinarity in Scientific Research. [Google Scholar]
  11. Flizikowski, J.; Mroziński, A. Photovoltaic Installation Engineering; A Publication Co-Financed from National and Norwegian Funds; Grafpol Agnieszka Blicharz-Kurpińska: Bydgoszcz, Poland, 2016. [Google Scholar]
  12. Kebede, A.A.; Kalogiannis, T.; Van Mierlo, J.; Berecibar, M. A comprehensive review of stationary energy storage devices for large-scale renewable energy sources grid integration. Renew. Sustain. Energy Rev. 2022, 159, 112213. [Google Scholar] [CrossRef]
  13. Niekurzak, M.; Lewicki, W.; Drożdż, W.; Miązek, P. Measures for assessing the effectiveness of investments for electricity and heat generation from the hybrid cooperation of a photovoltaic installation with a heat pump on the example of a household. Energies 2022, 16, 6089. [Google Scholar] [CrossRef]
  14. Höfer, T.; Madlener, R. A participatory stakeholder process for evaluating sustainable energy transition scenarios. Energy Policy 2020, 139, 111277. [Google Scholar] [CrossRef]
  15. Tan, K.M.; Babu, T.S.; Ramachandaramurthy, V.K.; Kasinathan, P.; Solanki, S.G.; Raveendran, S.K. Empowering smart grid: A comprehensive review of energy storage technology and application with renewable energy integration. J. Energy Storage 2021, 39, 102591. [Google Scholar] [CrossRef]
  16. Niekurzak, M. The Potential of Using Renewable Energy Sources in Poland Taking into Account the Economic and Ecological Conditions. Energies 2021, 14, 7525. [Google Scholar] [CrossRef]
  17. Hayibo, K.S.; Pearce, J.M. A review of the value of solar methodology with a case study of the US VOS. Renew. Sustain. Energy Rev. 2021, 137, 110599. [Google Scholar] [CrossRef]
  18. Georgious, R.; Refaat, R.; Garcia, J.; Daoud, A.A. Review on Energy Storage Systems in Microgrids. Electronics 2021, 10, 2134. [Google Scholar] [CrossRef]
  19. Chakraborty, P.; Baeyens, E.; Khargonekar, P.P.; Poolla, K.; Varaiya, P. Analysis of solar energy aggregation under various billing mechanisms. IEEE Trans. Smart Grid 2019, 10, 4175–4187. [Google Scholar] [CrossRef]
  20. Rouzbahani, H.M.; Karimipour, H.; Lei, L. A review on virtual power plant for energy management. Sustain. Energy Technol. Assess. 2021, 47, 101370. [Google Scholar] [CrossRef]
  21. Hossain, E.; Faruque, H.M.R.; Sunny, M.S.H.; Mohammad, N.; Nawar, N. A Comprehensive Review of Energy Storage Systems: Types, Comparison, Current Scenario, Applications, Barriers, and Potential Solutions, Policies, and Future Prospects. Energies 2020, 13, 3651. [Google Scholar] [CrossRef]
  22. Zimm, C.; Goldemberg, J.; Nakicenovic, N.; Busch, S. Is the renewables transformation a piece of cake or a pie in the sky? Energy Strategy Rev. 2019, 26, 100401. [Google Scholar] [CrossRef]
  23. Burgio, A.; Menniti, D.; Sorrentino, N.; Pinnarelli, A.; Leonowicz, Z. Influence and impact of data averaging and temporal resolution on the assessment of energetic, economic and technical issues of hybrid photovoltaic-battery systems. Energies 2020, 13, 354. [Google Scholar] [CrossRef]
  24. Niekurzak, M. Development Directions of Low and Zero Emission Sources in the Transformation of the Energy Sector in Poland Based on the Scenario Method Based on Intuitive Logic; Energetyka/Centralny Zarząd Energetyki, Stowarzyszenie Elektryków Polskich: Warszawa, Poland, 2022; Volume 4, pp. 181–192. ISSN 0013-7294. [Google Scholar]
  25. Shahzad, U.; Radulescu, M.; Rahim, S.; Isik, C.; Yousaf, Z.; Ionescu, S. Do Environment-Related Policy Instruments and Technologies Facilitate Renewable Energy Generation? Exploring the Contextual Evidence from Developed Economies. Energies 2021, 14, 690. [Google Scholar] [CrossRef]
  26. Rangel-Martinez, D.; Nigam, K.; Ricardez-Sandoval, L.A. Machine learning on sustainable energy: A review and outlook on renewable energy systems, catalysis, smart grid and energy storage. Chem. Eng. Res. Des. 2021, 174, 414–441. [Google Scholar] [CrossRef]
  27. Rahman, M.; Oni, A.O.; Gemechu, E.; Kumar, A. Assessment of energy storage technologies: A review. Energy Convers. Manag. 2020, 223, 113295. [Google Scholar] [CrossRef]
  28. Aneke, M.; Wang, M. Energy storage technologies and real-life applications—A state of the art review. Appl. Energy 2016, 179, 350–377. [Google Scholar] [CrossRef]
  29. Salkuti, S.R.; Jung, C.M. Comparative analysis of storage techniques for a grid with renewable energy sources. Int. J. Eng. Technol. 2018, 7, 970–976. [Google Scholar] [CrossRef]
  30. Arsad, A.Z.; Hannan, M.; Al-Shetwi, A.Q.; Mansur, M.; Muttaqi, K.; Dong, Z.; Blaabjerg, F. Hydrogen energy storage integrated hybrid renewable energy systems: A review analysis for future research directions. Int. J. Hydrogen Energy 2022, 47, 17285–17312. [Google Scholar] [CrossRef]
  31. SolarPower Europe. Leading the Energy Transition. Available online: https://www.thesmartere.com/publications/emo2024 (accessed on 14 January 2023).
  32. Dogan, E.; Ulucak, R.; Kocak, E.; Isik, C. The Use of Ecological Footprint in Estimating the Environmental Kuznets Curve Hypothesis for BRICST by Considering Cross-Section Dependence and Heterogeneity. Sci. Total Environ. 2020, 723, 138063. [Google Scholar] [CrossRef]
  33. Alvarado, R.; Tillaguango, B.; Dabar, V.; Ahmad, M.; Isik, C. Ecological footprint, economic complexity and natural resources rents in Latin America: Empirical evidence using quantile regressions. J. Clean. Prod. 2021, 318, 128585. [Google Scholar] [CrossRef]
  34. Isik, C.; Ahmad, M.; Ongan, S.; Ozdemir, D.; Ifran, M.; Alvarado, R. Convergence Analysis of the Ecological Footprint: Theory and Empirical Evidence from the USMCA Countries. Environ. Sci. Pollut. Res. 2021, 28, 32648–32659. [Google Scholar] [CrossRef] [PubMed]
  35. Ahmad, M.; Isik, C.; Jabeen, G.; Ali, T.; Ozturk, I.; Atchike, D. Heterogeneous links among urban concentration, non-renewable energy use intensity, economic development, and environmental emissions across regional development levels. Sci. Total Environ. 2021, 765, 144527. [Google Scholar] [CrossRef] [PubMed]
  36. Hargreaves, J.J.; Jones, R.A. Long-Term Energy Storage in Highly Renewable Systems. Front. Energy Res. 2020, 8, 219. [Google Scholar] [CrossRef]
  37. Jafari, M.; Botterud, A.; Sakti, A. Decarbonizing power systems: A critical review of the role of energy storage. Renew. Sustain. Energy Rev. 2022, 158, 112077. [Google Scholar] [CrossRef]
  38. Kraan, O.; Chappin, E.; Kramer, G.J.; Nikolic, I. The influence of the energy transition on the significance of key energy metrics. Renew. Sustain. Energy Rev. 2019, 111, 215–223. [Google Scholar] [CrossRef]
  39. Niekurzak, M. The use of quantitative methods as measures for forecast electricity demand on the local market in a short time horizon. Przegląd Elektrotech. Stow. Elektr. Pol. 2023, 99, 86–93. [Google Scholar] [CrossRef]
  40. Bhuiyan, E.A.; Hossain, Z.; Muyeen, S.; Fahim, S.R.; Sarker, S.K.; Das, S.K. Towards next generation virtual power plant: Technology review and frameworks. Renew. Sustain. Energy Rev. 2021, 150, 111358. [Google Scholar] [CrossRef]
  41. Niekurzak, M.; Kubińska-Jabcoń, E. Analysis of the Return on Investment in Solar Collectors on the Example of a Household: The Case of Poland. Front. Energy Res. 2021, 9, 660140. [Google Scholar] [CrossRef]
  42. Koohi-Fayegh, S.; Rosen, M. A review of energy storage types, applications and recent developments. J. Energy Storage 2020, 27, 101047. [Google Scholar] [CrossRef]
  43. Kochanek, E. Regional cooperation on gas security in Central Europe. Energy Policy J. 2019, 22, 19–38. [Google Scholar] [CrossRef]
  44. Niekurzak, M.; Mikulik, J. Modelling of Energy Consumption and Reduction of Pollutant Emissions in a Walking Beam Furnace Using the Expert Method—Case Study. Energies 2021, 14, 8099. [Google Scholar] [CrossRef]
  45. Wróblewski, P.; Niekurzak, M. Assessment of the possibility of using various types of renewable energy sources installations in single-family buildings as part of saving final energy consumption in Polish conditions. Energies 2022, 15, 1329. [Google Scholar] [CrossRef]
  46. Versaci, M.; La Foresta, F. Fuzzy Approach for Managing Renewable Energy Flows for DC-Microgrid with Composite PV-WT Generators and Energy Storage System. Energies 2024, 17, 402. [Google Scholar] [CrossRef]
  47. Ali, A.; Aftab, A.; Akram, M.N.; Awan, S.; Muqeet, H.A.; Arfeen, Z.A. Residential Prosumer Energy Management System with Renewable Integration Considering Multi-Energy Storage and Demand Response. Sustainability 2024, 16, 2156. [Google Scholar] [CrossRef]
  48. Ahmad, N.I.; Ali, Z.; Ab. Kadir, M.Z.A.; Osman, M.; Zaini, N.H.; Roslan, M.H. Impacts of Lightning-Induced Overvoltage on a Hybrid Solar PV–Battery Energy Storage System. Appl. Sci. 2021, 11, 3633. [Google Scholar] [CrossRef]
  49. Lu, D.; Peng, Y.; Sun, J. Dual-Stage Optimization Scheduling Model for a Grid-Connected Renewable Energy System with Hybrid Energy Storage. Energies 2024, 17, 737. [Google Scholar] [CrossRef]
  50. Alqahtani, B.; Yang, J.; Paul, M.C. Reliability and dispatchability improvement of a hybrid system consisting of PV, wind, and bio-energy connected to pumped hydropower energy storage. Energy Convers. Manag. 2024, 304, 118212. [Google Scholar] [CrossRef]
  51. Al-Othman, A.; Tawalbeh, M.; Martis, R.; Dhou, S.; Orhan, M.; Qasim, M.; Olabi, A.G. Artificial intelligence and numerical models in hybrid renewable energy systems with fuel cells: Advances and prospects. Energy Convers. Manag. 2022, 253, 115154. [Google Scholar] [CrossRef]
  52. Javed, M.S.; Ma, T.; Jurasz, J.; Canales, F.A.; Lin, S.; Ahmed, S.; Zhang, Y. Economic analysis and optimization of a renewable energy-based power supply system with different energy storages for a remote island. Renew. Energy 2021, 164, 1376–1394. [Google Scholar] [CrossRef]
  53. Bistline, J.; Blanford, G.; Mai, T.; Merrick, J. Modelling variable renewable energy and storage in the power sector. Energy Policy 2021, 156, 112424. [Google Scholar] [CrossRef]
  54. De Rosa, M.; Afanaseva, O.; Fedyukhin, A.V.; Bianco, V. Prospects and characteristics of thermal and electrochemical energy storage systems. J. Energy Storage 2021, 44, 103443. [Google Scholar] [CrossRef]
  55. Niekurzak, M.; Lewicki, W.; Brelik, A. The challenges for social and economic policy related to the energy transformation—Analysis of profitability and minimizing the risk of deciding to invest in a home micro-installation. Eur. Res. Stud. J. 2022, 25, 144–159. [Google Scholar] [CrossRef]
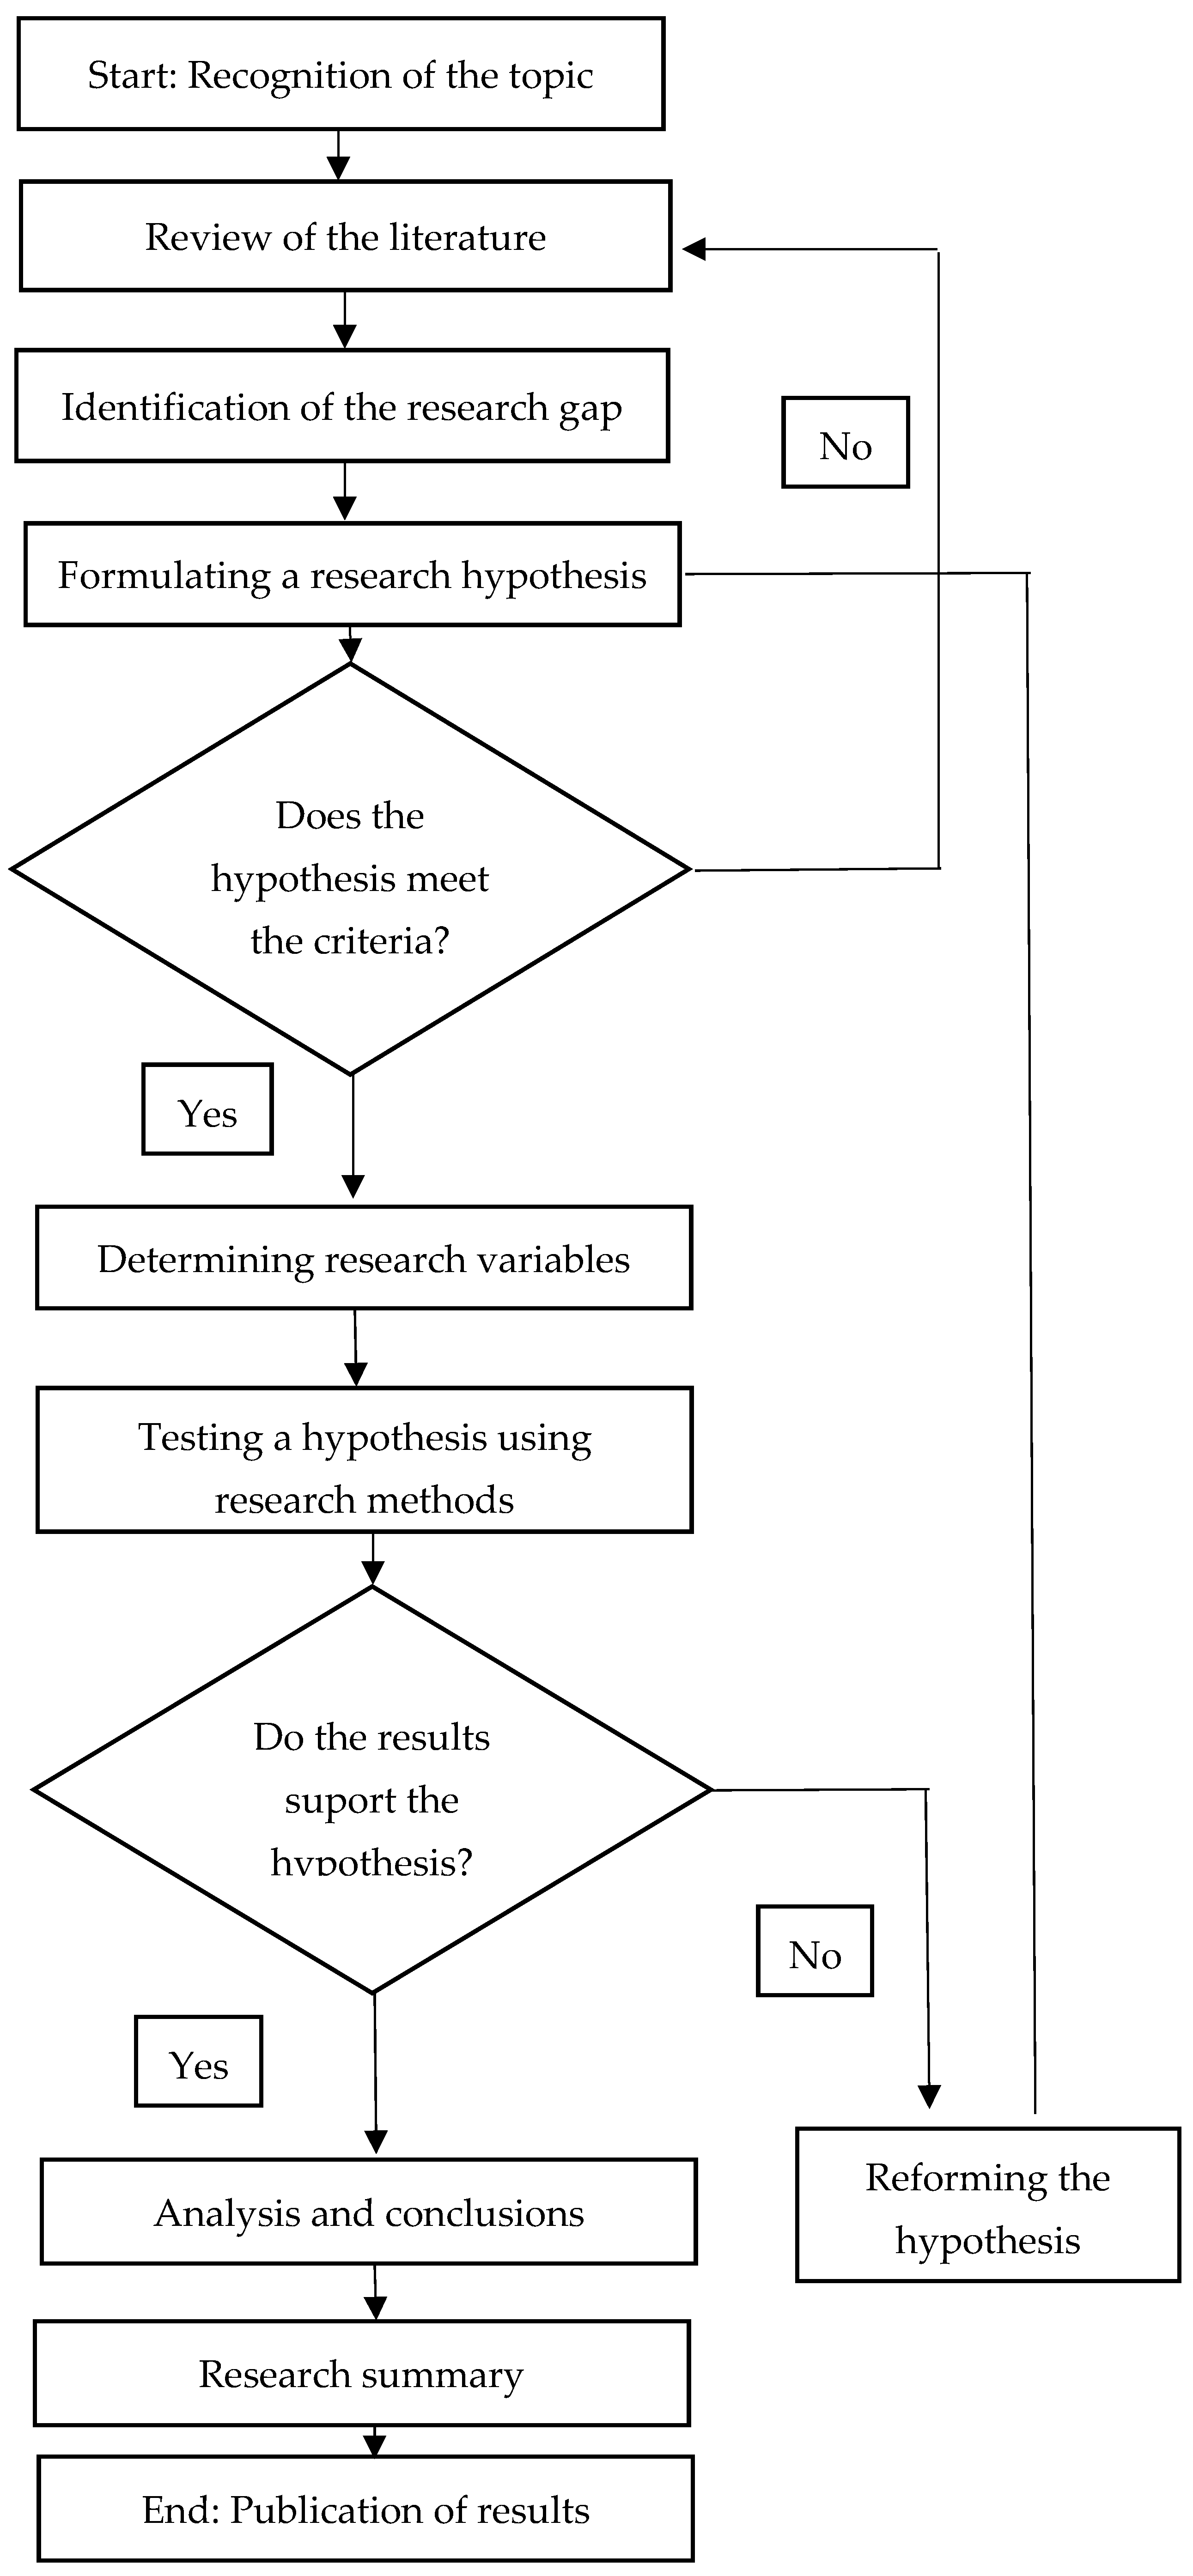
Figure 1. Flowchart of the research methodology.
Energies 17 04740 g001
Figure 2. Exhibition of PV installation modules placed on the company’s roofs.
Energies 17 04740 g002
Figure 3. Monthly characteristics of active power consumption (from the network) in the enterprise.
Energies 17 04740 g003
Figure 4. Monthly production of electricity by the PV system over the entire period of operation.
Energies 17 04740 g004
Figure 5. Monthly electricity production of the PV system—comparison every year.
Energies 17 04740 g005
Figure 6. Electricity production by the PV installation in a given year and total production over the entire period of operation.
Energies 17 04740 g006
Figure 7. Total electricity consumption in the company.
Energies 17 04740 g007
Figure 8. Electricity delivered to the distribution network is produced by a PV installation.
Energies 17 04740 g008
Figure 9. Percentage distribution of electricity produced by PV.
Energies 17 04740 g009
Figure 10. Electricity balance—the entire period of operation of the PV system.
Energies 17 04740 g010
Figure 11. Electricity consumption and delivery to the network in 15 min cycles from 11 May to 17 May 2024.
Energies 17 04740 g011
Figure 12. Consumption, delivery, and production of electricity in 15 min cycles from 11 May to 14 May 2024.
Energies 17 04740 g012
Figure 13. Electricity balance in 15 min cycles on 14 May 2024.
Energies 17 04740 g013
Figure 14. Electricity balance in 15 min cycles on 17 May 2024.
Energies 17 04740 g014
Table 1. Calculation of the demand for electricity in the enterprise, taking into account the photovoltaic installation—2023.
Year
2023
Demand
[kWh]
PV Production
[kWh]
Auto-Consumption
[kWh]
Level of Self-Consumption [%]Energy Consumption
[kWh]
(Surplus) Putting in Energy
[kWh]
Energy Purchase Price
[EUR/kWh]
Energy Sales Price
[EUR/kWh]
Contractual CapacityEnergy Purchase
[EUR]
Energy Sales
[EUR]
Total Energy Cost
[EUR]
Saving
[EUR]
[kW]Fee
[EUR]
I110,8898008698487103,90510230.210.10800321021,18110024,3901524
II117,5086269620199111,307680.210.10800321022,6916.825,9011271
III146,71440,96935,35786111,35856120.200.10800321022,717549.025,9277761
IV76,88448,66630,7276346,15617,9380.200.10800321093521753.012,5627978
V93,07484,78152,6936240,38232,0890.200.10800321081953135.011,40413,827
VI94,48081,19454,2196740,26126,9750.200.10800321081742635.011,38413,643
VII111,65687,73856,3156455,34131,4220.200.10800321011,2473070.014,45614,514
VIII149,22473,15355,3197693,90517,8340.210.10800321019,1661742.022,37613,033
IX94,01062,08547,6217746,38914,4640.210.10800321094081413.012,61711,070
X99,93139,53631,3887968,54481480.210.10800321013,951796.017,1617185
XI150,40012,82311,71291138,68711100.210.10800321028,313109.031,5222500
XII159,4925090774293154,7503480.210.10800321031,59834.034,8071003
SUM1,404,263550,310393,279-1,010,984157,031---38,520205,99315,337.8244,50795,309
Table 2. Assumptions used for energy storage calculations.
Energy StoragePV InstallationNetwork ConnectionFinancing
Power:
500 kW
Capacity:
1000 kWh
Current PV power:
655 kWp
Planned PV power:
0 kWp
Sum:
655 kWp
Power ordered:
800 kW
Planned reduction:
15%
Rate:
4.10 [EUR/kW]
Own
contribution:
100%
Table 3. Demand calculation, PV installation + energy storage.
Year
2023
Demand
[kWh]
PV Production
[kWh]
Auto-Consumption
[kWh]
Level of Self-Consumption [%]Energy Consumption
[kWh]
(Surplus) Putting in Energy
[kWh]
Energy Purchase Price
[EUR/kWh]
Energy Sales Price
[EUR/kWh]
Contractual CapacityEnergy Purchase
[EUR]
Energy Sales
[EUR]
Total Energy Cost
[EUR]
[kW]Fee
[EUR]
I110,88980088008100102,88200.210.10680272820,972023,700
II117,50862696269100111,23900.210.10680272822,677025,405
III146,71440,96939,18796107,52717820.200.10680272821,93617424,664
IV76,88448,66643,7279033,15649380.200.10680272867184839446
V93,07484,78166,6937926,38218,0890.200.106802728535417678082
VI94,48081,19463,2197831,26117,9750.200.106802728634717569075
VII111,65687,73867,9157743,74119,8220.200.1068027288890193711,618
VIII149,22473,15362.3198586,90510,8340.210.10680272817,737105920,465
IX94,01062,08558,6219435,38934640.210.10680272871773399905
X99,93139,53637,3889562,54421480.210.10680272812,73021015,458
XI150,40012,82312,823100137,57700.210.10680272820,086030,814
XII159,49250905090100154,40200.210.10680272831,527034,255
SUM1,404,263550,310471,259-933,00379,051---32,736182,1517725222,887
Table 4. Summary, PV installation + energy storage: S1 is the morning peak, S2 is the afternoon peak, and RD is the rest of the day.
PV installation
Value of PV energy—direct self-consumption: EUR 80
Sale of PV Energy: EUR 8
Level of PV self-consumption
Without warehouse: 71.46%
With stock: 85.64%
Energy storage
Increase in self-consumption of PV energy: EUR 16
Strategy for reducing the ordered power: EUR 6
Energy optimization strategy: EUR 19
Structure in zones
Tariff: B23
          S1   S2    RD
network only:    38%  39%  23%
network + PV:    24%  22%  54%
network + PV + ME:  8%  3%    89%
Total effect of the energy storage: EUR 40
Total PV + Energy storage: EUR 128
Table 5. Financial calculation, PV + ME installation. (All values in the table are in Euro).
Year of CalculationStart12345678910
Expected Increase in Energy Costs10%10%10%10%10%10%10%10%10%10%
Investment costs
Cost of PV installation−364,047
Cost of purchasing energy storage−412,745
Cost of installing an energy storage facility−11,628
Total capital expenditure−788,419
Own a share of the investment 100%−788,419
Service, annual inspections, and software updates 1.5%−11,827−11,827−11,827−11,827−11,827−11,827−11,827−11,827−11,827−11,827−11,827
Total costs/expenses800,245−11,827−11,827−11,827−11,827−11,827−11,827−11,827−11,827−11,827−11,827
Costs/expenses when ordering−800,245
Savings of PV installation
Savings on purchasing energy from the grid—auto-consumption of PV energy079,96787,96496,760106,436117,080128,788141,667155,833171,416188,558
Revenues from the sale of surplus PV energy 77228494934310,27711,30512,43613,67915,04716,55118,207
Energy storage savings
Increase in self-consumption of PV energy015,84217,42619,16921,08623,19425,51428,06530,87133,95837,354
Savings on reduction in contracted capacity057776355699076898458930410,23411,25812,38413,622
Savings on energy optimization018,26420,09022,09924,30926,74029,41432,35535,59139,15043,065
Annual financial benefits0127,570140,327154,360169,796186,775205,453225,998248,598273,458300,803
Annual balance of PV + energy storage0115,744128,501142,534157,970174,949193,627214,172236,772261,631288,977
Cumulative score−800,245−684,502−556,001−413,701−255,499−80,550113,077327,248563,090825,6501,114,626
Disclaimer/Publisher’s Note: The statements, opinions and data contained in all publications are solely those of the individual author(s) and contributor(s) and not of MDPI and/or the editor(s). MDPI and/or the editor(s) disclaim responsibility for any injury to people or property resulting from any ideas, methods, instructions or products referred to in the content.