Abstract
Efficient sizing and economic analysis of community battery systems is crucial for enhancing energy efficiency and sustainability in rooftop PV panel-rich communities. This paper proposes a comprehensive model that integrates key technical and economic factors to optimize the size and operation of the prosumer-owned battery, maximizing the financial returns over the life span of the battery. Sensitivity and uncertainty analyses were also conducted on a number of factors that are constantly changing over the years such as per-unit cost of the battery and interest rate. Monte Carlo simulations were utilized to replicate the unpredictable PV generations and the volatility of house load demands. The developed model is evaluated under three scenarios: a shared community battery for all houses, individual batteries for each house, and a combined system with an additional large load. Particle Swarm Optimization (PSO) is utilized to maximize the formulated objective function subject to the considered constraints. The findings indicate that integrating community batteries offered a substantial economic advantage compared to individual home batteries. The additional revenue stream of incorporating larger consumers looking to reduce their carbon footprint (e.g., commercial) returned a further augmented net present value (NPV). The influence of different tariff structures was also assessed and it was found that critical peak pricing (CPP) was the most prolific. The outcomes offer valuable insights for policymakers and stakeholders in the energy sector to facilitate a more sustainable future.
1. Introduction
Recently, the global shift towards green energy has led to a significant rise in the adoption of photovoltaic (PV) rooftop panels. Australia, for instance, has witnessed a significant growth from approximately 178 MW in 2010 to 34,200 MW in 2023, of which the majority of installations are below 9 kW and typically residential rooftops [1]. The driving force for such change is a result of environmental concerns as well as cost-reduction seeking. While the proliferation of PV panels is certainly favorable and advantageous, it still presents distinctive challenges, particularly when a large percentage of households in a community decide upon installing PV systems. Such complications entail managing the irregularity and intermittency of solar generation, maintaining an energy supply and demand balance, and ensuring equitable and impartial access to the benefits of clean energy. A revolutionary solution, community batteries offer a new way for communities to manage their energy requirements. Community batteries have the ability to store, and discharge during periods of high demand when required, surplus PV energy, thereby enhancing energy utilization and delivering monetary and fiscal benefits to communities [2,3,4].
Community battery systems (CBSs) offer several benefits, such as better energy utilization, grid stability enhancement, and reduction in energy expenses. These systems can aggregate the surplus photovoltaic (PV) energy generated by individual households and store it in a central battery. The stored energy can then be distributed as required to reduce grid dependence and lower energy bills. Nevertheless, despite the potential benefits, several economic and technical variables and constraints make the optimization of a community battery’s capacity functionality essential yet complex.
1.1. Problem Statement
Optimizing a CBS encompasses several interlinked factors, including components such as unit battery costs, degradation rates, tariff structures and configurations, and solar power generation and fluctuation. The current literature primarily centers the focus on particular elements of the CBS, like economic evaluation [2], environmental and ecological impacts [5,6], or different optimization techniques [7,8], often in isolation. The segmented models lack a thorough comprehension of the influence of parameters on the overall performance of the CBS in terms of, for example, effectiveness and economic viability. In addition, there is less emphasis in the literature on various tariff configurations and their potential impacts on the solution. This study aims to establish a complete framework for optimizing CBs and to contribute to the broader objectives of promoting environmental sustainability and enhancing green energy efficiency.
Additionally, this paper delineates how the integration of such technologies assists communities in lowering their carbon footprint, promote self-sufficiency and energy resilience, and encourage environmental sustainability. Furthermore, it highlights the value of prosumers’ collaboration with local governmental authorities and energy providers to maximize the community battery initiatives’ financial, technical, and environmental benefits. The primary objective of this research is to improve solar energy utilization, maximize potential monetary benefits, and foster the adoption of eco-friendly energy systems in community settings.
1.2. Research Scope
The scope of this study entails the development of a holistic methodology to optimize the size of community batteries using historical data in a high PV-penetrated community, the simulation of the proposed system to assess its viability, and the evaluation of the influential levels that key parameters have on the results. The research concentrates on multiple domains to present a thorough analysis of the economic, operational, and environmental facets of CBSs.
First, a mathematical model incorporating critical factors such as battery initial capital costs, degradation rates, PV solar generations, and diverse tariff structures is developed to optimize the community-owned CBS’s capacity and operation, maximizing the financial benefits for the prosumers. Then, through the simulation of different scenarios, the research evaluates the economic feasibility of the proposed approach over a 10-year period, which is the average operational lifespan of commercial lithium-ion batteries and the standard economic evaluation horizon in the literature. This ensures the analysis covers most of the community battery’s practical life, while accounting for the impact of degradation.
Second, a comprehensive sensitivity analysis of key parameters is conducted to assess the influence level of each variable on the optimization outcomes. The assessed variables are the cost per unit of the battery and interest rate (IR). Stochastic Monte Carlo simulations are then utilized to appropriately consider solar energy’s randomness, by systematically adjusting the power within practical ranges, in the economic and technical evaluations of the uncertainty analysis.
Furthermore, the study compares the performance of the proposed methodology under different tariff pricing frameworks to evaluate the efficiency of the CBS and make the most favorable recommendations from the financial perspective to encourage the adoption of this technology. This includes structures such as block tariff, time-of-use (TOU) pricing, critical peak pricing (CPP), and seasonal tariffs.
The presented extensive and holistic approach is believed to ensure the tackling of complex aspects and addresses the multifaceted nature of community battery optimization, as well as offering useful insights and practical solution to promote sustainable energy practices.
This paper is structured into five sectors, each of which addresses various areas of the research conducted to provide a thorough analysis of the optimization process proposed for community battery and PV integrated systems. Section 1 reviews the existing literature and studies on PV systems, energy storage solutions, and community battery systems. Section 2 outlines the overview of the research approach, mathematical modeling, and formulations. Section 3 presents simulation outcomes for each scenario. Section 4 concludes the research and presents suggestions for future works.
2. State of Art
Energy storage systems (ESSs) are vital components to maximally benefit from renewable energy sources due to their intermittent supply. Due to their high ability to store and release excess generated energy, lithium-ion, lead-acid, and flow batteries are common storage examples of such green energy applications to ensure reliability and enhance grid stability [9]. Lithium-ion batteries are frequently preferred for their high energy density and efficiency [10].
From the utility grid perspective, CBs facilitate energy supply during high demand periods, reducing the reliance on the grid, which improves stability due to lower sudden peaks of communal load demands. For the local community, the combined excess of PV energy generation by the participating prosumers can be utilized more effectively to meet the local demand and reduce electricity bills. Therefore, CBSs provide potential benefits to both the utility, through grid stability, and the prosumers, through monetary benefits and energy resilience [7].
CES was first developed to concurrently perform demand load shifting as well as PV energy time-shifting through retail tariffs with variable and changing pricing blocks [3]. Two market designs, taking into account the recent emergence of several local or peer-to-peer (P2P) energy trading networks, specifically addressed the role of electricity storage [11]. Against the background of the framework of Germany’s energy transition, an increasing number of residential households are utilizing their own solar system to partially offset their power usage. These systems bring clustered economic benefits such as reduced energy costs, since the community shifts some of the energy consumption from the grid to stored self-generated PV energy, as well as an improved return on investment and potential revenue by selling any excess energy. In addition to yielding financial rewards, CBSs assist in the reduction in carbon emissions and the carbon footprint, particularly when paired with PV systems. This facilitates the shift towards a more sustainable future [12].
The optimization of CBSs has been investigated in several studies. Abdulla et al. [13] proposed an optimized sizing approach that determines the most efficient size and management of the CBSs that yields maximum economic benefits. Another study [14] emphasized how economic consideration alone will not be sufficient in the absence of environmental factors. The authors illustrated the necessity for methodologies to entail both financial and ecological factors.
A novel approach combining energy disaggregation was proposed [11] to distinguish net load from generated PV power and battery charging and discharging power. An energy management optimization system was implemented and integrated into a community microgrid system. The cost function included battery degradation costs as well as a dynamic penalty that accounts for the actual operational costs [12]. Ansari et al. [15] conducted economic analysis to determine the optimal size and operation method of an energy storage system in a PV–grid integrated network.
Research has already indicated that user-owned BESSs, including residual sharing and storage sharing, yields a higher net present value compared to other BESS ownership structures [16]. Nevertheless, the decline of on-grid electricity prices caused by the widespread adoption of PV power generation has made it crucial to avoid excessively large battery sizes when using community energy regulation. It is, therefore, also necessary to rationally optimize the battery capacity [17,18].
While there has been a lack of energy management strategies that tackle different interaction possibilities among community-clustered solar plus battery prosumers, a study [19] proposed an optimal EMS approach. The system involves the participation of five solar plus battery prosumers in the energy community in the aggregated aFRR market. The main objective of the study was to minimize the total costs of ownership for each prosumer, and results were validated through different scenarios’ simulations. The proposed system enabled a decrease in the levelized cost of energy (LCOE) for all members of the community compared to the base-case scenario.
In 2023, a comprehensive study was conducted to analyze and quantify the advantages of CBs, particularly in a setting of collaboration between a distributed system operator (DSO) and an energy community [20]. A linear optimization model was developed to take the power flow constraints and battery degradation factor into account, which then highlighted the influence of considering degradation models. The findings found far fewer violations of the voltage limits in the absence of this factor, underscoring the essence of holistic modeling in such applications. The authors proceeded by performing a sensitivity analysis to identify the most influential parameters on the voltage violations. Economic evaluation, however, was excluded from the research.
Zhang et al. [21] performed a comparative analysis of multiple typical storage sharing schemes, which were developed based on different installation structures and sharing techniques. A load optimization model was established to reduce the total power cost of industrial parks, based on the features of each scheme using real historical data. Considering P2G and P2P energy exchange scenarios, [22], Yaldiz et al. evaluated the financial contribution of each in an optimized PV-BESS integrated system. The aim of this system is to maximize the return of users and net profit after costs. The results demonstrated that utilizing P2P energy trading schemes leads to significant advantages for the consumers that transition into prosumers in the proposed framework.
A multi-objective optimization methodology was developed and applied to optimize the battery size and evaluate the parameters having an impact on the optimization system. This, however, only considered one tariff pricing scheme [23]. Another techno-enviro-economic study on community battery storage systems [24] investigated and compared the ROI and payback on two tariff structures. The results concluded that while a flat tariff maximizes PV energy consumption, a TOU tariff allows greater cost reductions. Both structures could pay back total manufacturing carbon emissions within 8 years. The study, however, did not include any other structures. According to two studies [23,24], recent research lacks holistic analysis of different tariff pricing approaches in community battery projects. Prior research has illustrated the benefits of including battery energy storage systems [25,26]. Furthermore, extensive research on optimal battery sizing [27,28], as well as battery performance and life-cycle enhancements [16], has been conducted.
While there has been a lack of consideration of optimal BESS sizing and operation in a community under different BESS ownership structures, the authors in [16] examined two distinct ownership structures for optimal BESS sizing: one structure where the energy service provider (ESP) owned the BESS, and the other one where the users owned the shared community battery. Research has shown that although an ESP-owned structure lowered the prosumers’ energy expenses without having to incur the initial capital cost of the battery, the community-owned structure demonstrated a higher net present value (NPV). This paper, however, did not examine the impacts of various tariff structures or present the parameters having the most influence on the optimization system and economic benefits.
An extensive review of the current existing literature highlights the growing attention on CBSs, particularly within the framework of multi-household environments and communities. The review, nonetheless, uncovers notable gaps that this research aims to address. Some of these are summarized in Table 1.

Table 1.
Summary comparison between recent studies and this research.
Despite the significant advancements and substantial contributions in the literature in terms of CBS integration and optimization, there are still a number of gaps, as presented in the preceding section, which this research aims to address. As the authors in [20] highlighted, the inclusion of a degradation factor has greatly influenced the results. Therefore, this research intends to formulate a holistic approach, taking into account various parameters to maximize the monetary income for the community in a community-owned structure.
With that, not only are simulations run using historical data as a case study to evaluate the suggested methodology, but extensive risk and uncertainty analyses are also performed to evaluate the influential impact of key parameters on the results. Monte Carlo simulations are utilized to generate and iterate the unpredictable nature of solar power generation. Nevertheless, as there is a major gap in assessing the impact of different tariff pricings and structures, additional investigations are undertaken to provide stakeholders and policymakers with suggestions to aid with the encouragement of community battery integration, resulting in ecological sustainability.
3. The Proposed Methodology
As the focus of the present work is to optimize the community-owned CBS in order to yield the most economic benefits to the prosumers, where PV integration is high, the approach involves holistic modeling to accurately account for all the potential associated costs. This includes considering the capital cost of the battery being owned and implemented by the prosumers, potential expenditures with degradation, tariff rates, savings from monetized carbon emission reductions, energy trading among households, the utility grid, and the community battery. Figure 1 represents a community composed of n houses with rooftop PV systems and a community battery.
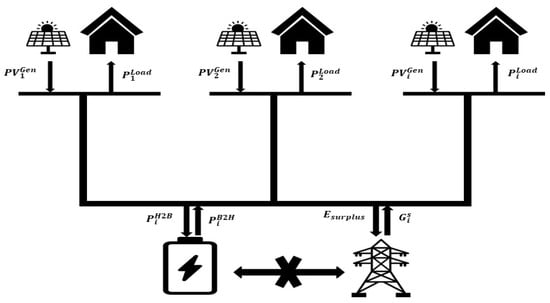
Figure 1.
Grid, PV, and community battery.
The allocation of energy flow from the community battery is primarily directed to supply the involved households during peak demand hours, while the second priority is the shoulder hours, depending on tariff structures. The initial consideration will be TOU due to the diversity and widespread use, followed by simulations of other existing structures. The financial dynamics of this scheme are influenced by the discrete rates at which energy trading transactions among the three-element system (grid, CBS, and PVs) occur.
3.1. Time-of-Use Pricing
The determination of energy costs supplied by the distribution firm is based on the utilization of available 24 h data. The present computation integrates TOU pricing, which includes peak load demand, shoulder load demand, and off-peak load demand. The temporal divisions for different categories of electricity use, together with the related kilowatt-hour rates, are determined based on schedules given by utility companies and the associated tariff structures. A generalized model is presented in the following quasi-code.
where account for the timely schedules of the peak, shoulder, and off-peak hours in a TOU setting. : Binary control parameter for hourly cost calculation.
Hours h = 1, 2, 3, 4…….24
3.2. Network Costs
Often neglected in research, costs for transmission, distribution, and local transport of energy pertain to the expenses affiliated with conveying the energy when integrating a community battery in a certain locality. These costs are referred to as network costs. In Australia, the cost of energy per kWh comprises two distinct elements: the cost of the energy itself and the cost of transferring it. The cost of transporting energy locally within a community is relatively cheaper than in a wider distribution network according to the National Energy Rules (NER) and is referred to as the Local Use of Service (LUoS). Local energy exchange includes peer-to-peer (P2P) energy exchange between consumers, as well as energy exchange to and from the common CES [37,38]. Although minor, it is added in this research for more accuracy. The value per kWh will depend on the network provider and is applied to every charge and discharge of the battery [39].
3.3. Problem Formulation
The combined total cost of electricity (COE) for a community of n households and a given tariff structure before and after CBS integration is modeled in (1) and (2), respectively. The calculations are performed over the life span of the battery in order to determine the community savings after integrating the battery.
where : combined total COE for n households before CBS integration; : per kWh energy cost based on the tariff’s pricing scheme at time h for 24 h of the day; : binary control parameter; is the tariff’s combination; : grid supply power to house i; : combined total COE for n households before CBS integration; : selling rate of power to community battery; : buying rate of power from community battery; : power from house i to battery;: power from battery to house i; is the cost per kWh using the local network (LUoS).
The total combined surplus power at times where PV generation exceeds the load demand while the community battery is unable to be further charged due to constraints and limitations set in Section 3.7 is calculated in (3). This power is fed to the grid to benefit from the Feed-in-Tariff (FiT) as in (4), and the total financial benefits as a result of the CBS’s integration are subsequently calculated in (5).
where : total combined surplus energy in kWh; : PV generation in kW; : load power in kW, : cost benefit from selling surplus energy; : selling cost per kWh while differentiates between FiT and large load (LL) rate for different cases; : total financial benefits as a result of CBS’s integration.
3.4. Battery Costs
Comprised of three primary elements, the cost of the battery incorporates the installation cost of the battery, degradation-associated losses, and ongoing operation and maintenance costs of the battery, as presented in (6)–(8). One of the most dominant factors of these is the battery installation costs, consisting of the costly price of the battery, the labor required for installation, and the necessary infrastructure. The operation costs in (7) account for potential lost revenue due to standby periods of the battery, as well as the maintenance cost accounted for each full charge and discharge cycle [40,41,42].
where : battery per-unit cost; : battery installation’s cost; : annual maintenance and operation associated losses; Annual Cycle Count (ACC): number of full charge and discharge cycles the battery undergoes in a year; Cost per Cycle (CPC): maintenance cost accounted for each full charge and discharge cycle; Annual Standby Losses (ASL): amount of energy lost while the battery is in standby mode; : Battery size in kWh.
To accurately capture the losses associated with the battery’s degradation over time, a dynamic empirical model accounting for temperature, SOC, and rate of charge and discharge is presented in (8) using the Arrhenius relation and capacity fade [43]. This capacity degradation is then used to compute monetized losses based on the energy lost over time that could have been sold to the grid as modeled in (9).
where the capacity at time t; the initial capacity; : a degradation rate that expresses the impact of the following parameters; the operating temperature in Kelvin; : time in years; the charge and discharge rate; : the annual degradation-associated losses.
3.5. Savings in Emissions Cost
As this work seeks to illustrate not only economic benefits but also environmental encouragement, evaluating the cost savings in carbon emissions derived from the implementation of the community battery system is instrumental. Equation (10) quantifies the economic benefits associated with these reductions, and is supported by analysis reports presented by the International Energy Agency (IEA) [44]. Therefore, the addition of this factor allows for a comprehensive evaluation of both the sustainability and cost-effectiveness of CBSs.
where : total cost saved in emission; : total unit power supplied from battery to house load in a year; cost per tonne of emissions; : per kg of Co2 emission in 1 kWh.
3.6. Particle Swarm Optimisation
In complex systems with multiple parameters and frequently changing inversely interlinked variables, optimization techniques are often used to find the best possible solution for a problem given a set of constraints and objectives. The objective can be to find the best value of a specific variable to either maximize or minimize the fit function. In the realm of ESSs, the size of the battery is a major contributor, particularly when the main objective is financial. If the battery size increases, it is able to store greater amounts of energy, which can then be economically rewarding. However, due to the high per-unit cost of the lithium-ion batteries, the larger the battery, the more costly the system gets.
Therefore, finding the optimal or near-optimal size of the battery where all costs are considered in the yearly cash flow and with respect to the operational lifespan of the battery requires the utilization of an optimization technique.
This research employs PSO due to its flexibility, convergence to global optimum, which provides high efficiency and robustness to uncertainty, and its ease of implementation. Each particle updates its position every iteration based on its personal best position, the best global position among the particles, and its former speed vector, as in (11). Equation (12) updates the particle’s position. The inertia weight balances exploration and exploitation, while the acceleration coefficients influence individual and social learning, and determine the convergence rate. Equation (13) gradually decreases the inertia weight with each iteration to converge. The pseudo-code is shown in Figure 2.
where N: the number of particles; = the velocity of particle at iteration; : the inertia weight of the particle; = the velocity of particle at iteration; the acceleration coefficients for exploitation and exploration; = randomly generated binary numbers; : the best position of the particle obtained based upon its own experience, gbest; : global best position of the communicated particles in the population; = the position of the particle at the iteration; : maximum and minimum values of inertia weight; MaxIter: maximum number of iterations.

Figure 2.
Pseudo-code for PSO steps.
3.7. Model Objective Function
In the optimization process, the algorithm iteratively adjusts the battery size to maximize the fitness function defined in (14), taking into account the annual cash flow based on (1)–(7). The NPV is then calculated in (15) for more accurate analysis by discounting future cash flows by an interest factor .
where : the net yearly cashflow; NPV: the net present value considering interest factor ; and SizeCB is the battery size that is being optimally sized by PSO.
3.8. Model Constraints and Restrictions
To ensure both the accuracy and authenticity of the proposed model and improve economic and operational performance, a number of constraints and regulations were considered, (16)–(20). These constraints serve a significant role to precisely reflect the real-world practical operational limitations and verify that the optimization method’s generated results are practical.
Precisely modeling the battery’s State of Charge (SOC) requires complex processes and techniques. Although the SOC determination is impacted by factors such as the operating conditions of the battery and battery ageing, which require machine learning or traditional models to estimate [45], this study limits the SOC through industrial standards to avoid deep discharging and overcharging, conforming to the battery management’s recommended guidelines [46]. Equations (16) and (17) not only limit the SOC, but also ensure continuity through subsequent days [47].
The battery’s maximum charging capacity is set to restrict the charging of the community battery at time t to avoid overcharging beyond the specified manufacturer guidelines [48]. Moreover, the system exhibits a round-trip efficiency of a given percentage by the manufacturer [49]. This suggests that there is a percentage energy loss recorded throughout the energy transfers between individual houses and the community batteries, and vice versa, as referenced in the work of [16]. Equation (19) ensures the optimization returns a positive NPV, while (20) maintains balance in power at each step of the simulations.
where : the total power transactions; : efficiency factor of the CBS; : the total balanced power after the round-trip efficiency losses.
In the event of multiple load demands exceeding the available energy in the CB, the model prioritizes the house with highest cumulative contribution until time h of day x, encouraging more contributions and larger scaling of PVs. The proposed model is presented in (21) and (22).
where : energy contribution by house i; cumulative contribution from the start until day x and hour h iterate over preceding days until conflict.
3.9. Sensitivity and Uncertainty Analyses
Sensitivity analysis assesses the influence level of selected components and helps identify the most significant components through deliberate manipulations of certain factors within practical ranges. The coefficient of variation (CV), a standardized measure of dispersion of a probability distribution, is used on the simulations’ results to quantify the impact of each factor [50]. The larger the CV, the greater the vulnerability of the system to changes in the specific factor, whereas a low value indicates high resistance of the model to the parameter’s changes. It is calculated as the ratio of the standard deviation to the mean , as shown in (23).
Due to the stochastic nature of solar, which affects PV power generation and causes loads to have high volatility, uncertainty analysis utilizing Monte Carlo simulations based on probabilistic distribution entity is utilized [51]. The iterated simulations depict the potential weather conditions and potential grid consumption variations from the assumed model, by adding or subtracting generated variants defined by a standard deviation range. The method used is mathematically modeled in (24) and (25).
where and : the adjusted PV generation and load, equivalent to the sum of base values and the random variation , and , for iteration . is drawn from a normal distribution with mean and standard deviation .
4. Results and Discussion
4.1. Input Parameters
The number of households chosen for this study is five, to limit computational time, considering each has a different load demand. All share the same PV generation, as varying this parameter is not within the scope of this research, and they are considered to be in same locality. The per-hour household consumption data and solar generation data are both taken from [52]. The daily average load demand and PV generation curves of each household are shown in Figure 3. Table 2 summarizes the settings specified for the simulation. A thorough review of the existing literature and industry standards determined the selection of parameters to accurately evaluate the effectiveness of the model [10,14,49,53,54,55,56,57]. PSO and simulations in this research were conducted on three different cases using MATLAB, and are summarized as:
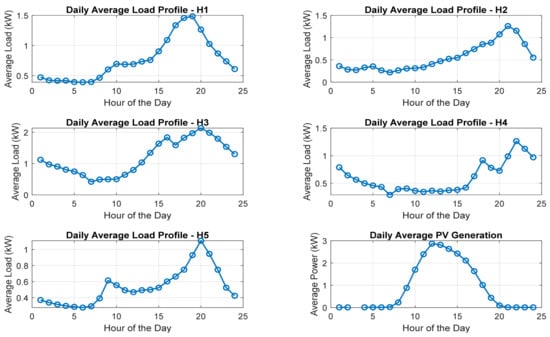
Figure 3.
Daily average load profiles and PV generation.

Table 2.
Input parameters.
- Case 1: Prosumer-owned CBS to serve the community, optimized based on the mathematical model.
- Case 2: Multiple home-owned batteries for comparison with community battery outcomes in the first case.
- Case 3: A novel scheme where the CBS capacity is optimized to not only serve the community, but also feed larger consumers like business and industrial areas.
4.2. Case Studies
PSO simulation results from (13) offer comparisons among various battery utilization scenarios in a community setting, which can lead to valuable insights. The results for each case are presented in Table 3. Equations (1)–(3) are adjusted for case 2 to calculate individual rather than collective outcomes. In case 3, (4) utilizes a higher rate than the FiT rate by using an average value of the ToU prices. This indicates that the surplus green energy can benefit both the community financially, as well as the large load with a non-costly transition to clean energy.

Table 3.
Comparison of results.
NPVs for individual households when each owns their own respective home batteries vary between AUD 4152.10 and AUD 5578.93, amounting to AUD 25,312.60 in total for a clustered battery size of 32 kWh for case 2. This combined total is lower than the returned NPV in case 1, of AUD 34,847.39, where a community battery is shared and owned by the prosumers. The optimal battery size for the community battery is 24 kwh, indicating that battery utilization is improved when it aggregates the supply and demand profiles of several houses. This occurs as the combining of loads can smoothen the peaks and valleys of demand.
In addition, with multiple houses the distinct consumption patterns balance out, leading to a consistent and more efficient battery utilization in higher rates and lower underutilization. This is known in the distribution system field as “diversified demand” [58]. This can be seen in Figure 4. Therefore, while individual home batteries may offer customized solutions, they may not be as economically advantageous as community batteries.
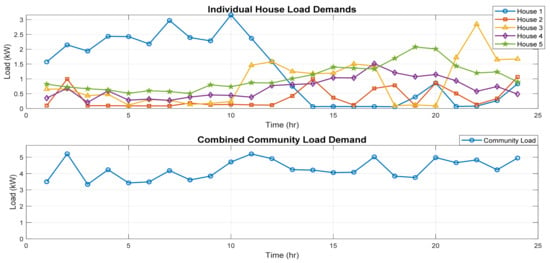
Figure 4.
Individual vs. clustered load demand data samples.
Lastly, the introduction of an additional potential scheme, with larger consumers, returned an optimal battery size of 30 kwh, yielding to the highest NPV value out of all three case studies of AUD 55,705.30. In comparison with case 2, for a smaller size with respect to the combined sizes of home batteries, the NPV is more than doubled. This exemplifies the capacity of the community battery to not only cater to the energy requirements of a certain locality, but also to supply larger consumers.
The Ant Bee Colony (ABC) algorithm, which is another swarm-based optimization method [59], was used in case 1 to compare its performance with PSO. The ABC simulations returned an optimal battery size of 24 kWh, similar to that determined by PSO, highlighting the viability of both algorithms in this model. The iteration against best cost curves for both optimization algorithms is presented in Figure 5, with PSO converging to the highest fitness level faster than ABC.
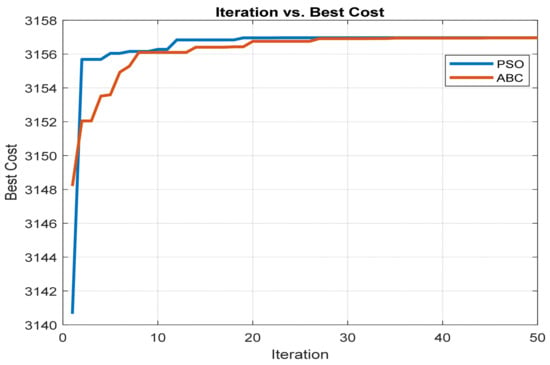
Figure 5.
Best cost function against iteration for PSO and ABC.
4.3. Sensitivity and Uncertainty Analyses Results
Sensitivity analysis was conducted on two parameters: the cost per unit of the battery and the interest rate affecting the NPV. Some research indicates that there could be a decrease in lithium-ion battery costs [60], whereas other studies point to uncertainties and possible increases due to fluctuations in raw material prices [61]. Therefore, the per-unit cost of the battery was adjusted systematically from −30% to +30% in increments of 5% relative to its base value of 0%. This was applied to other parameters for direct comparison using CV. The selected ranges account for potential variations influenced by technological advancements and market dynamics [10,49].
A summary of the sensitivity analysis results is tabulated in Table 4 below to provide an overview of each parameter’s impacts on the NPV and battery size over the three distinct scenarios. Figure 6 presents the slopes of deviations from base values across the two parameters. The steeper the slope, the more sensitive the results to the parameter.

Table 4.
Summary of sensitivity analysis results.
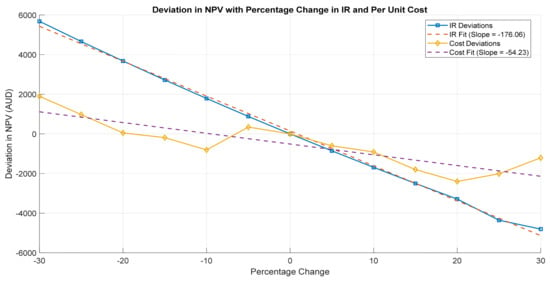
Figure 6.
Deviation in NPV with percentage change in parameters.
Monte Carlo simulations were conducted to generate 100 random scenarios for PV generation and load demand over a 10-year period. These scenarios were based on a normal distribution, with a standard deviation of ±10% for PV generation and ±15% for load demand, centered around a mean of zero. This was performed on the main case integrating the proposed CBS’s model, shown in case 1. The histograms in Figure 7 and Figure 8 display the mean simulated data for the simulations. Figure 9 and Figure 10 present the ranges and frequencies of NPVs, highlighting both risks and benefits, as well as an overlayed PDF curve, displayed in red line, to present the likelihood of each result.
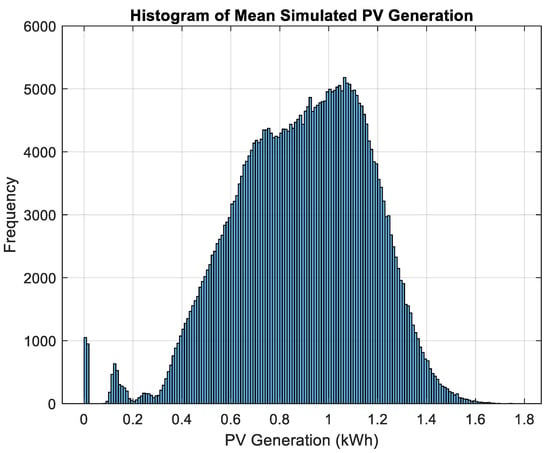
Figure 7.
Histogram of mean simulated generations.
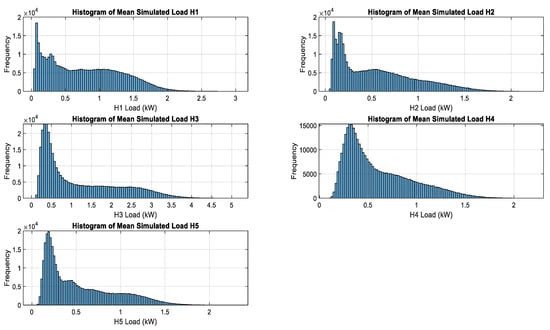
Figure 8.
Histogram of mean simulated load demands.
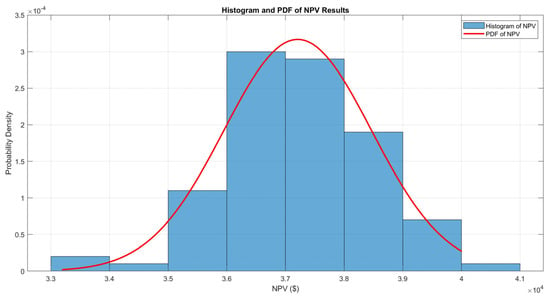
Figure 9.
Histogram and PDF of NPV results for PV variations.
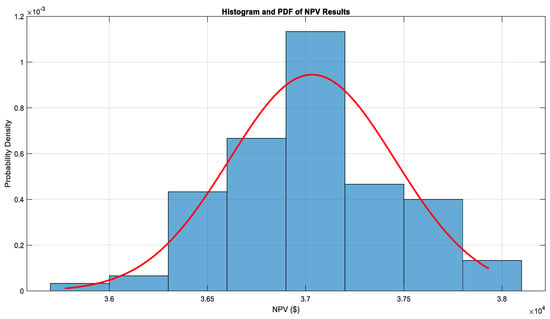
Figure 10.
Histogram and PDF of NPV results for load variations.
Based on the results and the calculated CV values, which provide a standardized measure of variability, the interest rate for each parameter was outlined as having the most significant impact on the NPV. Following this was the per-unit cost of the battery with a relatively moderate impact. This indicates that the interest rate and battery cost play significant roles in determining the economic viability of community battery systems.
The uncertainty simulations yielded a mean NPV of AUD 37,207.58 for the Monte Carlo-simulated PV generation and a mean NPV of AUD 37,015.55 for the simulated load demands. The results deviated by AUD 1259.59 and AUD 1874.19, respectively, indicating positive returns with moderate variability, driven by the inherent randomness in solar generation and the volatility of load demands. The probability density functions (PDFs) and histograms illustrate the associated risks and potential profitability, highlighting the range of possible outcomes for PV generation and load demand, along with their corresponding NPVs. The use of Monte Carlo simulations has enhanced confidence in the forecasting models, providing increased reliability under real-world conditions.
4.4. Impact of Tariff Structures on NPV and Battery Sizing
Simulations were conducted under various common tariff structures to evaluate the system’s performance under different pricing schemes. Not only do the results provide an outlook of different tariff structures impacts on the proposed model, but they also determine the most advantageous ones for community battery integration. The explored tariff structures are block tariff, seasonal tariff, TOU, flat-rate tariff, and CPP. A summary of each tariff’s pricing scheme is tabulated in Table 5. Results of the simulations are presented in Table 6 and Figure 11.

Table 5.
Tariff structures and pricing schemes.

Table 6.
Tariff structures: analysis results.
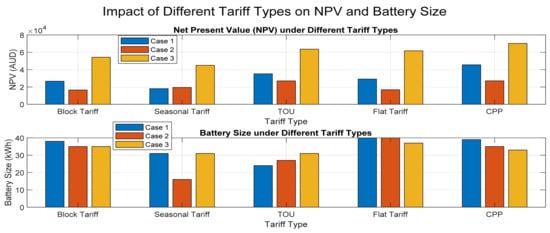
Figure 11.
Impact of different tariff structures on NPV and battery size.
Consistently yielding the greatest NPV in all cases, CPP and TOU tariffs allow for strategic utilization of the battery during periods of high costs, thereby maximizing financial returns. In case 3, in which the community battery serves both the community and larger consumers, CPP returned the highest NPV of AUD 70,252.03. This indicates effective employment of the battery in such scenarios.
Moderately favorable structures were both the flat and block tariffs. While the flat tariff returned a more consistent and predictable revenue, the block tariff’s hierarchical structure produced varying results depending on levels of consumption. In cases 1 and 2, flat tariff’s simulations suggested the largest size out of all, which indicates a preference for greater storage to make the most out of the fixed pricing.
Despite the high summer rates, seasonal tariff returned the lowest NPVs. This is due to the low winter rates, which reduce the overall potential earnings over the year. In case 2, the battery size required under seasonal tariff was significantly lower, reflecting a reduction in the optimization potential.
Between the main cases, i.e., case 1 and case 3, the implementation of the CPP and block tariff structures led to larger battery sizes, reflecting a strategy of optimizing the storage’s capacity in peak price periods.
Lastly, the battery size results displayed greater uniformity and consistency in case 3 across various schemes. This suggests that although there are major discrepancies between various systems, the additional capacity required to cater to the larger consumers mitigates those disparities.
5. Conclusions and Future Work
This paper aimed to develop a holistic approach to optimize the economic performance of community battery systems in conjunction with PV generation and maximize the returns to the prosumers owning the shared battery. The proposed paradigm considers several critical factors, a few of which can often be neglected, such as network costs, degradation costs, and quantified monetary benefits from carbon emission reduction. PSO was used to optimize the battery size for maximum NPV returns in various scenarios and pricing models. Community batteries proved to be more financially viable than home batteries, especially under a CPP scheme.
This was because these models enable strategic battery utilization during higher costs. A novel scheme of considering and integrating major energy users who want to lower their carbon footprint highlighted community batteries’ potential to support broader energy networks and promote environmental practices. Lastly, the sensitivity analysis results demonstrated a significant influence on the NPV of the interest rate, followed by the unit cost of the battery. An uncertainty analysis conducted on the PV generation highlighted the importance of taking into account random characteristics associated with renewable energy when sizing community batteries. This was underscored by the significant variances in the Monte Carlo simulations’ outcomes.
While this study presents an extensive methodology and analysis, future works can build upon and broaden this work’s findings through a number of avenues. Shared community batteries require prosumers’ interactions and engagements. It is important to analyze the social and behavioral factors in order to deploy such systems effectively. Future research can also explore the integration of CBSs with other energy storage technologies and their role in grid stabilization. Evaluating and assessing various battery technologies through comparative assessments may also provide a more profound understanding and selection of the most suitable approach for specific communities. These include solid-state batteries, flow batteries, vanadium redox, and hybrid systems.
Author Contributions
Conceptualisation and methodology, Z.R., E.P. and S.R.; software, Z.R.; validation, Z.R.; formal analysis, Z.R. and E.P.; investigation, Z.R.; resources, Z.R.; data curation, Z.R. and S.R.; writing—original draft preparation, Z.R.; writing—review and editing, E.P. and S.R.; visualisation, Z.R.; supervision, E.P. and S.R.; project administration, E.P. and S.R.; funding acquisition, S.R. All authors have read and agreed to the published version of the manuscript.
Funding
This research received no external funding.
Data Availability Statement
Data are contained within the article.
Conflicts of Interest
The authors declare no conflicts of interest.
References
- Boulaire, F.A.; Love, J.G.; Mohammadshahi, S.S.; Mackinnon, I.D. Hybrid PV Systems–Optimizing CPV and SiPV Ratio to Increase Sustainability of Hydrogen Production. Adv. Sustain. Syst. 2024, 8, 2400058. [Google Scholar] [CrossRef]
- Pasqui, M.; Becchi, L.; Bindi, M.; Intravaia, M.; Grasso, F.; Fioriti, G.; Carcasci, C. Community Battery for Collective Self-Consumption and Energy Arbitrage: Independence Growth vs. Investment Cost-Effectiveness. Sustainability 2024, 16, 3111. [Google Scholar] [CrossRef]
- Parra, D.; Norman, S.A.; Walker, G.S.; Gillott, M. Optimum community energy storage for renewable energy and demand load management. Appl. Energy 2017, 200, 358–369. [Google Scholar] [CrossRef]
- Hoon, J.; Tan, R.H. Grid-connected solar PV plant surplus energy utilization using battery energy storage system. In Proceedings of the 2020 IEEE Student Conference on Research and Development (SCOReD), Batu Pahat, Malaysia, 27–29 September 2020; IEEE: Piscataway, NJ, USA; pp. 1–5. [Google Scholar]
- Simpa, P.; Solomon, N.O.; Adenekan, O.A.; Obasi, S.C. The safety and environmental impacts of battery storage systems in renewable energy. World J. Adv. Res. Rev. 2024, 22, 564–580. [Google Scholar] [CrossRef]
- Breeze, P. The environmental impact of energy storage technologies. In Power System Energy Storage Technologies; Academic Press: Cambridge, MA, USA, 2018; pp. 79–84. [Google Scholar]
- Gholami, K.; Nazari, A.; Thiruvady, D.; Moghaddam, V.; Rajasegarar, S.; Chiu, W.-Y. Risk-constrained community battery utilisation optimisation for electric vehicle charging with photovoltaic resources. J. Energy Storage 2024, 97, 112646. [Google Scholar] [CrossRef]
- Jiang, C.; Wang, H. Network-Aware Value Stacking of Community Battery via Asynchronous Distributed Optimization. arXiv 2024, arXiv:2403.13255. [Google Scholar]
- Luo, X.; Wang, J.; Dooner, M.; Clarke, J. Overview of current development in electrical energy storage technologies and the application potential in power system operation. Appl. Energy 2015, 137, 511–536. [Google Scholar] [CrossRef]
- Nykvist, B.; Nilsson, M. Rapidly falling costs of battery packs for electric vehicles. Nat. Clim. Change 2015, 5, 329–332. [Google Scholar] [CrossRef]
- Lüth, A.; Zepter, J.M.; Del Granado, P.C.; Egging, R. Local electricity market designs for peer-to-peer trading: The role of battery flexibility. Appl. Energy 2018, 229, 1233–1243. [Google Scholar] [CrossRef]
- Ali, L.; Azim, M.I.; Peters, J.; Bhandari, V.; Menon, A.; Tiwari, V.; Green, J.; Muyeen, S. Application of a community battery-integrated microgrid in a blockchain-based local energy market accommodating P2P trading. IEEE Access 2023, 11, 29635–29649. [Google Scholar] [CrossRef]
- Abdulla, K.; De Hoog, J.; Muenzel, V.; Suits, F.; Steer, K.; Wirth, A.; Halgamuge, S. Optimal operation of energy storage systems considering forecasts and battery degradation. IEEE Trans. Smart Grid 2016, 9, 2086–2096. [Google Scholar] [CrossRef]
- Narayanan, V.; Baird, K.; Tay, R. Investment decisions: The trade-off between economic and environmental objectives. Br. Account. Rev. 2021, 53, 100969. [Google Scholar] [CrossRef]
- Ansari, B.; Shi, D.; Sharma, R.; Simoes, M.G. Economic analysis, optimal sizing and management of energy storage for PV grid integration. In Proceedings of the 2016 IEEE/PES Transmission and Distribution Conference and Exposition (T&D), Dallas, TX, USA, 3–5 May 2016; IEEE: Piscataway, NJ, USA; pp. 1–5. [Google Scholar]
- Rodrigues, D.L.; Ye, X.; Xia, X.; Zhu, B. Battery energy storage sizing optimisation for different ownership structures in a peer-to-peer energy sharing community. Appl. Energy 2020, 262, 114498. [Google Scholar] [CrossRef]
- Ntube, N.; Li, H. Stochastic multi-objective optimal sizing of battery energy storage system for a residential home. J. Energy Storage 2023, 59, 106403. [Google Scholar] [CrossRef]
- Jiang, X.; Jin, Y.; Zheng, X.; Hu, G.; Zeng, Q. Optimal configuration of grid-side battery energy storage system under power marketization. Appl. Energy 2020, 272, 115242. [Google Scholar] [CrossRef]
- Aranzabal Santamaria, I.; Gómez Cornejo, J.; López Ropero, I.; Zubiria Gómez, A.; Mazón Sainz-Maza, A.J.; Feijoo Arostegui, A.; Gaztañaga Aranzamendi, H. Optimal Management of an Energy Community with PV and Battery-Energy-Storage Systems. Energies 2023, 16, 789. [Google Scholar] [CrossRef]
- Berg, K.; Rana, R.; Farahmand, H. Quantifying the benefits of shared battery in a DSO-energy community cooperation. Appl. Energy 2023, 343, 121105. [Google Scholar] [CrossRef]
- Zhang, Z.; Zhou, K.; Yang, S. Optimal selection of energy storage system sharing schemes in industrial parks considering battery degradation. J. Energy Storage 2023, 57, 106215. [Google Scholar] [CrossRef]
- Yaldız, A.; Gökçek, T.; Şengör, İ.; Erdinç, O. Optimal sizing and economic analysis of Photovoltaic distributed generation with Battery Energy Storage System considering peer-to-peer energy trading. Sustain. Energy Grids Netw. 2021, 28, 100540. [Google Scholar] [CrossRef]
- Chen, X.; Liu, Z.; Wang, P.; Li, B.; Liu, R.; Zhang, L.; Zhao, C.; Luo, S. Multi-objective optimization of battery capacity of grid-connected PV-BESS system in hybrid building energy sharing community considering time-of-use tariff. Appl. Energy 2023, 350, 121727. [Google Scholar] [CrossRef]
- Dong, S.; Kremers, E.; Brucoli, M.; Rothman, R.; Brown, S. Improving the feasibility of household and community energy storage: A techno-enviro-economic study for the UK. Renew. Sustain. Energy Rev. 2020, 131, 110009. [Google Scholar] [CrossRef]
- Nguyen, S.; Peng, W.; Sokolowski, P.; Alahakoon, D.; Yu, X. Optimizing rooftop photovoltaic distributed generation with battery storage for peer-to-peer energy trading. Appl. Energy 2018, 228, 2567–2580. [Google Scholar] [CrossRef]
- Liu, N.; Cheng, M.; Yu, X.; Zhong, J.; Lei, J. Energy-sharing provider for PV prosumer clusters: A hybrid approach using stochastic programming and stackelberg game. IEEE Trans. Ind. Electron. 2018, 65, 6740–6750. [Google Scholar] [CrossRef]
- Alsaidan, I.; Khodaei, A.; Gao, W. A comprehensive battery energy storage optimal sizing model for microgrid applications. IEEE Trans. Power Syst. 2017, 33, 3968–3980. [Google Scholar] [CrossRef]
- Yang, Y.; Bremner, S.; Menictas, C.; Kay, M. Battery energy storage system size determination in renewable energy systems: A review. Renew. Sustain. Energy Rev. 2018, 91, 109–125. [Google Scholar] [CrossRef]
- Hossain, M.A.; Pota, H.R.; Squartini, S.; Zaman, F.; Muttaqi, K.M. Energy management of community microgrids considering degradation cost of battery. J. Energy Storage 2019, 22, 257–269. [Google Scholar] [CrossRef]
- Heinisch, V.; Odenberger, M.; Göransson, L.; Johnsson, F. Prosumers in the electricity system—Household vs. system optimization of the operation of residential photovoltaic battery systems. Front. Energy Res. 2019, 6, 145. [Google Scholar] [CrossRef]
- Gabr, A.Z.; Helal, A.A.; Abbasy, N.H. Multiobjective optimization of photo voltaic battery system sizing for grid-connected residential prosumers under time-of-use tariff structures. IEEE Access 2021, 9, 74977–74988. [Google Scholar] [CrossRef]
- Sampath, L.M.I.; Weng, Y.; Xie, J.; Gooi, H.B.; Nguyen, H.D. Battery service lifespan constrained prosumer optimization model for P2P energy trading. In Proceedings of the 2022 IEEE Power & Energy Society General Meeting (PESGM), Denver, CO, USA, 17–21 July 2022; IEEE: Piscataway, NJ, USA; pp. 1–5. [Google Scholar]
- Palahalli, H.; Maffezzoni, P.; Gruosso, G. Modeling photovoltaic generation uncertainties for monte carlo method based probabilistic load flow analysis of distribution network. In Proceedings of the 2020 55th International Universities Power Engineering Conference (UPEC), Turin, Italy, 1–4 September 2020; pp. 1–6. [Google Scholar]
- Yuan, H.; Gao, Z.; Zhu, M.; Haider, U.; da Silva, N.P.; Fu, Y.; Xia, C.; Yan, C. A Novel Flexible Distributed P2P Energy Management Framework for Energy Community Considering Battery Storages. In Proceedings of the 2023 Power Electronics and Power System Conference (PEPSC), Hangzhou, China, 24–26 November 2023; pp. 213–219. [Google Scholar]
- Knežević, G.; Maligec, M.; Golub, V.; Topić, D. The optimal utilization of the battery storage for a virtual prosumer participating on a day-ahead market. In Proceedings of the 2020 International Conference on Smart Systems and Technologies (SST), Osijek, Croatia, 14–16 October 2020; pp. 155–160. [Google Scholar]
- Angizeh, F.; Parvania, M. Stochastic risk-based flexibility scheduling for large customers with onsite solar generation. IET Renew. Power Gener. 2019, 13, 2705–2714. [Google Scholar] [CrossRef]
- Shaw, M. Community Batteries: A Cost/Benefit Analysis; The Australian National University: Canberra, ACT, Australia; ARENA: Canberra, ACT, Australia, 2020. [Google Scholar]
- AEMC. 2019 Retail Energy Competition Review; AEMC: Sydney, NSW, Australia, 2019. [Google Scholar]
- Australian Energy Regulator. State of the Energy Market 2020; Australian Energy Regulator: Canberra, ACT, Australia, 2020. [Google Scholar]
- Knehr, K.W.; Kubal, J.J.; Nelson, P.A.; Ahmed, S. Battery Performance and Cost Modeling for Electric-Drive Vehicles (A Manual for BatPaC v5. 0); Argonne National Lab.(ANL): Argonne, IL, USA, 2022. [Google Scholar]
- Gailani, A.; Al-Greer, M.; Short, M.; Crosbie, T. Degradation cost analysis of li-ion batteries in the capacity market with different degradation models. Electronics 2020, 9, 90. [Google Scholar] [CrossRef]
- Cole, W.; Frazier, A.W.; Augustine, C. Cost Projections for Utility-Scale Battery Storage: 2021 Update; National Renewable Energy Lab.(NREL): Golden, CO, USA, 2021. [Google Scholar]
- Lewerenz, M.; Käbitz, S.; Knips, M.; Münnix, J.; Schmalstieg, J.; Warnecke, A.; Sauer, D.U. New method evaluating currents keeping the voltage constant for fast and highly resolved measurement of Arrhenius relation and capacity fade. J. Power Sources 2017, 353, 144–151. [Google Scholar] [CrossRef]
- IEA. Multiple Benefits of Energy Efficiency; International Energy Agency: Paris, France, 2019; Available online: https://www.iea.org/reports/multiple-benefits-of-energy-efficiency (accessed on 19 August 2024).
- Liu, Y.; He, Y.; Bian, H.; Guo, W.; Zhang, X. A review of lithium-ion battery state of charge estimation based on deep learning: Directions for improvement and future trends. J. Energy Storage 2022, 52, 104664. [Google Scholar] [CrossRef]
- Divya, K.C.; Østergaard, J. Battery energy storage technology for power systems—An overview. Electr. Power Syst. Res. 2009, 79, 511–520. [Google Scholar] [CrossRef]
- Lund, P.D.; Lindgren, J.; Mikkola, J.; Salpakari, J. Review of energy system flexibility measures to enable high levels of variable renewable electricity. Renew. Sustain. Energy Rev. 2015, 45, 785–807. [Google Scholar] [CrossRef]
- Komarnicki, P.; Lombardi, P.; Styczynski, Z.; Komarnicki, P.; Lombardi, P.; Styczynski, Z. Electric Energy Storage System; Springer: Berlin/Heidelberg, Germany, 2017. [Google Scholar]
- Schimpe, M.; Naumann, M.; Truong, N.; Hesse, H.C.; Santhanagopalan, S.; Saxon, A.; Jossen, A. Energy efficiency evaluation of a stationary lithium-ion battery container storage system via electro-thermal modeling and detailed component analysis. Appl. Energy 2018, 210, 211–229. [Google Scholar] [CrossRef]
- Liu, F.C.; Geng, L. The variation coefficient method for reliability sensitivity analysis of cylindrical helical spring. Appl. Mech. Mater. 2011, 55, 285–290. [Google Scholar] [CrossRef]
- Zhang, F.; Wang, X.; Wang, W.; Zhang, J.; Du, R.; Li, B.; Liu, W. Uncertainty analysis of photovoltaic cells to determine probability of functional failure. Appl. Energy 2023, 332, 120495. [Google Scholar] [CrossRef]
- Rhodes, J.D.; Upshaw, C.R.; Harris, C.B.; Meehan, C.M.; Walling, D.A.; Navrátil, P.A.; Beck, A.L.; Nagasawa, K.; Fares, R.L.; Cole, W.J. Experimental and data collection methods for a large-scale smart grid deployment: Methods and first results. Energy 2014, 65, 462–471. [Google Scholar] [CrossRef]
- Faruqui, A.; Sergici, S.; Sharif, A. The impact of informational feedback on energy consumption—A survey of the experimental evidence. Energy 2010, 35, 1598–1608. [Google Scholar] [CrossRef]
- Byrne, R.H.; Silva Monroy, C.A. Estimating the Maximum Potential Revenue for Grid Connected Electricity Storage; Sandia National Lab.(SNL-NM): Albuquerque, NM, USA, 2012. [Google Scholar]
- Chi, C.; Ma, T.; Zhu, B. Towards a low-carbon economy: Coping with technological bifurcations with a carbon tax. Energy Econ. 2012, 34, 2081–2088. [Google Scholar] [CrossRef]
- Wang, J.; Liu, P.; Hicks-Garner, J.; Sherman, E.; Soukiazian, S.; Verbrugge, M.; Tataria, H.; Musser, J.; Finamore, P. Cycle-life model for graphite-LiFePO4 cells. J. Power Sources 2011, 196, 3942–3948. [Google Scholar] [CrossRef]
- Glasserman, P. Monte Carlo Methods in Financial Engineering; Springer: Berlin/Heidelberg, Germany, 2004; Volume 53. [Google Scholar]
- Kersting, W.H. Distribution system modeling and analysis. In Electric Power Generation, Transmission, and Distribution; CRC Press: Boca Raton, FL, USA, 2018; pp. 26-1–26-58. [Google Scholar]
- Singh, S.; Kanwar, N. Renewable energy management using improved ABC algorithm for residential community. AIP Conf. Proc. 2019, 2200, 020098. [Google Scholar]
- Ziegler, M.S.; Song, J.; Trancik, J.E. Determinants of lithium-ion battery technology cost decline. Energy Environ. Sci. 2021, 14, 6074–6098. [Google Scholar] [CrossRef]
- Mauler, L.; Duffner, F.; Zeier, W.G.; Leker, J. Battery cost forecasting: A review of methods and results with an outlook to 2050. Energy Environ. Sci. 2021, 14, 4712–4739. [Google Scholar] [CrossRef]
Disclaimer/Publisher’s Note: The statements, opinions and data contained in all publications are solely those of the individual author(s) and contributor(s) and not of MDPI and/or the editor(s). MDPI and/or the editor(s) disclaim responsibility for any injury to people or property resulting from any ideas, methods, instructions or products referred to in the content. |
© 2024 by the authors. Licensee MDPI, Basel, Switzerland. This article is an open access article distributed under the terms and conditions of the Creative Commons Attribution (CC BY) license (https://creativecommons.org/licenses/by/4.0/).