Article

Heat Transfer of Crude Waxy Oil with Yield Stress in a Pipe

by
Uzak Zhapbasbayev
1,
Timur Bekibayev
1,*,
Maksim Pakhomov
2 and
Gaukhar Ramazanova
1,*
1
Scientific Laboratory “Energy Modeling”, Satbayev University, Almaty 050013, Kazakhstan
2
Kutateladze Institute of Thermophysics SB RAS, Novosibirsk 630090, Russia
*
Authors to whom correspondence should be addressed.
Energies 2024, 17(18), 4687; https://doi.org/10.3390/en17184687
Submission received: 15 August 2024 / Revised: 6 September 2024 / Accepted: 16 September 2024 / Published: 20 September 2024
(This article belongs to the Special Issue Heat Transfer in Heat Exchangers)

Abstract

:
This article is devoted to the study of heat exchange of a heated flow of waxy oil in a pipe. Heat exchange between the waxy oil flow and the surrounding environment decreases the oil temperature and sharply increases the rheological properties. The appearance of a solid-like region within the yield-stress fluid flow is a non-trivial problem. This flow property greatly complicates the numerical solution of the system of equations governing the flow and heat transfer of viscoplastic fluids. The Bingham–Papanastasiou model allows one to solve the problem by regularizing the formula for effective molecular viscosity. The novelty of this work lies in establishing the dependence of the Nusselt number on the Reynolds and Bingham numbers for the flow of viscoplastic fluid in a pipe. Via calculations, velocity, temperature, and pressure distributions in the flow were obtained for Bingham numbers ranging from 1.7 to 118.29 and Reynolds numbers ranging from 104 to 2615. The Nusselt number dependence increases with the increase in the Reynolds number and decreases with the decrease in the Bingham number along the pipe length.

1. Introduction

Non-Newtonian fluids with yield shear stress are encountered in various industrial processes, such as the transportation of crude waxy oil in underground and underwater pipelines of offshore fields [1,2,3,4].
Non-Newtonian fluids have an inherent time characteristic, often referred to as the fluid time scale. The time scales of non-Newtonian fluids are determined by the ratio of their physicochemical properties and flow parameters. However, in the heat exchange of non-Newtonian fluids, ambiguous results have been obtained. In a non-circular pipe, heat transfer of a viscoelastic fluid increases the Nusselt number [5]. The same increase in the Nusselt number is shown for the flow of viscoplastic fluid in a pipe [6]. In mixed convection in a square room, the average value of the Nusselt number decreases with increasing Bingham number [7]. A similar result was obtained in natural convection of Bingham fluid in a cavity [8].
A study of heat transfer in a developed Bingham fluid flow in an annular channel [9] was conducted with constant heat flux at the walls and by considering viscous dissipation. It was demonstrated that the influence of the Bingham number on the Nusselt number depended on various flow and heat transfer parameters, such as the radius ratio of the annular channel and the heat flux ratio between the outer and inner walls [9].
The influence of Reynolds and Brinkman numbers on the variation in the local Nusselt number along the length of a pipe was studied in [10] for a single Bingham number. The exponential dependencies of the Nusselt number along the length of the pipe were obtained for various Reynolds and Brinkman numbers [10].
The effect of thermal radiation was investigated in flows of a viscous fluid with stretching converging and diverging channels in [11]. In [12], convective heat transfer in a transverse flow of viscoplastic fluid in elliptical tubes was studied. In [13], the linear instability characteristics of Newtonian and Bingham fluid flows in an annular tube were investigated, highlighting the impact of yield stress on flow stability behavior. The lattice Boltzmann method is applied to model the natural convection of viscoplastic fluid in an inclined housing with internal cold circular/elliptical cylinders in [14,15,16,17]. In [18], mixed convection of a viscoplastic fluid was studied during the heating of the bottom wall in cylindrical shells with a rotating end wall. The work [19] presents progress in numerical modeling of viscoplastic fluid flows (part I) in a circular porous ring. The double-diffusive natural convection and entropy generation of a Bingham fluid in an inclined cavity were studied in [20]. The thermocapillary convection stability of a Bingham fluid in an infinite fluid layer was examined in [21]. The fully developed forced convection of Phan-Thien–Tanner fluid in channels with a constant wall temperature was investigated in [22]. Channel flows of Bingham fluid thinning under shear were studied in [23].
As seen in [11,12,13,14,15,16,17,18,19,20,21,22,23], various aspects of the convective heat transfer of Bingham fluids have previously been studied. It also follows that there are not many studies that provide a detailed analysis of the flow and heat transfer patterns of yield-stress viscoplastic fluids.
This study presents the results of numerical modeling of heat transfer of laminar flow of heated waxy oil with viscoplastic properties in a pipe.

2. Heat Transfer Model

2.1. Formulation of the Problem

A flow of waxy oil with an initial temperature of t1 and an average velocity of u1 is considered (see Figure 1). The transfer of heat from the fluid within the pipe to the surrounding environment resulted in a reduction in temperature along the length of the pipe. As the temperature decreased, the viscosity and yield stress of the waxy oil increased. As the flow progressed, the Newtonian waxy oil flow transitioned into a viscoplastic state, starting from the pipe wall. At certain yield stress values, a stagnation zone appeared near the pipe wall, where the flow velocity was zero. The impact of the stagnation zone on heat transfer processes, as well as determining the heat exchange at the wall, was of interest for the pipe flow of the waxy oil.
The Reynolds number ( R e ) and the Prandtl number ( P r ) were calculated from the oil parameters at the pipe inlet, and the Bingham number ( B n ) was calculated from the parameters of the oil at the pipe wall.

2.2. The Bingham–Papanastasiou Model

The effective molecular viscosity μ e f f , according to the rheology of a viscoplastic fluid, was expressed as follows [24,25,26]:
μ e f f = μ p + τ 0 γ ˙ 1 , i f τ > τ 0 , i f τ τ 0 ,
where μ p is the plastic viscosity, and τ 0 is the yield stress; the remaining expressions of Formula (1) are given in [27].
However, due to mathematical difficulties, expression (1) could not be used without regularization. For regulation, the below formula was used [28]. In this case, the effective viscosity had a limitation as the shear rate tended to zero γ ˙ → 0:
μ e f f = μ p + τ 0 1 exp 1 0 3 γ ˙ γ ˙ .

2.3. Basic Heat Transfer Equations

The system of equations of motion and energy of an incompressible viscoplastic fluid in dimensionless variables has the following form:
U z ¯ + 1 r ¯ r ¯ ( r ¯ V ) = 0
U U z ¯ + V U r ¯ = P z ¯ + 1 R e z ¯ 2 μ e f f U z ¯ + 1 r ¯ r ¯ μ e f f r ¯ ( U r ¯ + V z ¯ )
U V z + V V r = P r + 1 R e z μ e f f V z + U r 2 μ e f f V r 2 + 1 r r 2 r μ e f f V r
c ¯ p U θ z ¯ + c ¯ p V θ r ¯ = 1 P e 2 θ z ¯ 2 + 1 r ¯ r ¯ r ¯ θ r ¯ + B r P e Φ ( z ¯ , r ¯ )
where z ¯ = z / R ; r ¯ = r / R ; U = u / u 1 ; V = v / u 1 ; P = p / ρ u 1 2 ; θ = t t w / t 1 t w ; c ¯ p = c p ( t ) / c p 1 ; Re, Pe, and Br are Reynolds, Peclet, and Brinkman numbers, respectively; and Φ ( z ¯ , r ¯ ) is the dissipation function.
The dependences of the coefficients of plastic viscosity μp(t), yield stress τ 0 ( t ) , and heat capacity cp(t) on temperature are given in [27].

2.4. Boundary Conditions

The following boundary conditions are imposed on the pipe wall:
r ¯   = 1 :   U = V = 0   and   θ = 0 .
The conditions are set on the axis of the pipe:
r ¯   = 0 :   U r ¯ = V r ¯ = θ r ¯ = 0 .
The constant variable conditions were set at the pipe inlet as follows:
z ¯ =   0 :   U = 1 ,   V = 0 ,   θ = 1 .
The soft boundary conditions were set for the variables at the pipe outlet as follows:
z ¯ = L / R :   U z ¯ = V z ¯ = θ z ¯ = 0 .

3. The Numerical Solution

The control volume method with the staggered grid is used to solve the problem numerically. The algorithm used for solving Equations (3)–(6) for the variable “velocity–pressure components” is described in detail in [27]. The distinctive feature of the algorithm used for the numerical solution of the problem is the dependence of the molecular effective viscosity μ eff on μ p ( t ) and τ 0 ( t ) . Therefore, energy Equation (6) is solved first. The convective terms of Equation (6) are approximated using a second-order upwind scheme, and the diffusive terms are treated with a second-order accurate scheme [27]. The SIMPLE algorithm [27] is used to solve the continuity Equation (3) and momentum Equations (4) and (5), as well as to determine the velocity components and pressure.
Numerical calculations are conducted using our own software product.
The numerical calculation method was verified and validated through a comparison with the data presented in [10,13]. The velocity profiles were compared with the Bingham fluid flow results presented in [10,13], and the temperature distributions were compared with the data from [10]. Our results show agreement with the findings of these studies [27].

4. Discussion of Calculated Data

Calculations are given in the pipe with parameters [27]. The mean flow velocity u1 ranged between 0.025 and 0.5 m/s at an initial temperature t 1 = 25 °C;. The density of the waxy oil was considered a constant, having a value of 850 kg/m3. Furthermore, the pipe wall temperature t w was assumed to be constant and equal to 5 and 10 °C. The Reynolds number Re = ρ u 1 R / μ p 1 , the Bingham number B n = τ 0 w R / ( μ p w u 1 ) , and the Brinkman number B r = μ p w u 1 2 / λ ( t 1 t w ) varied as follows: R e = 104 to 2615, B n = 118.29 to 1.7, and B r = 0.0009 to 0.00023. The Brinkman number was found to be exceedingly small due to the low average velocity, so its influence was not considered in the calculations.

4.1. Calculation Data at Different Velocities and Constant Wall Temperatures

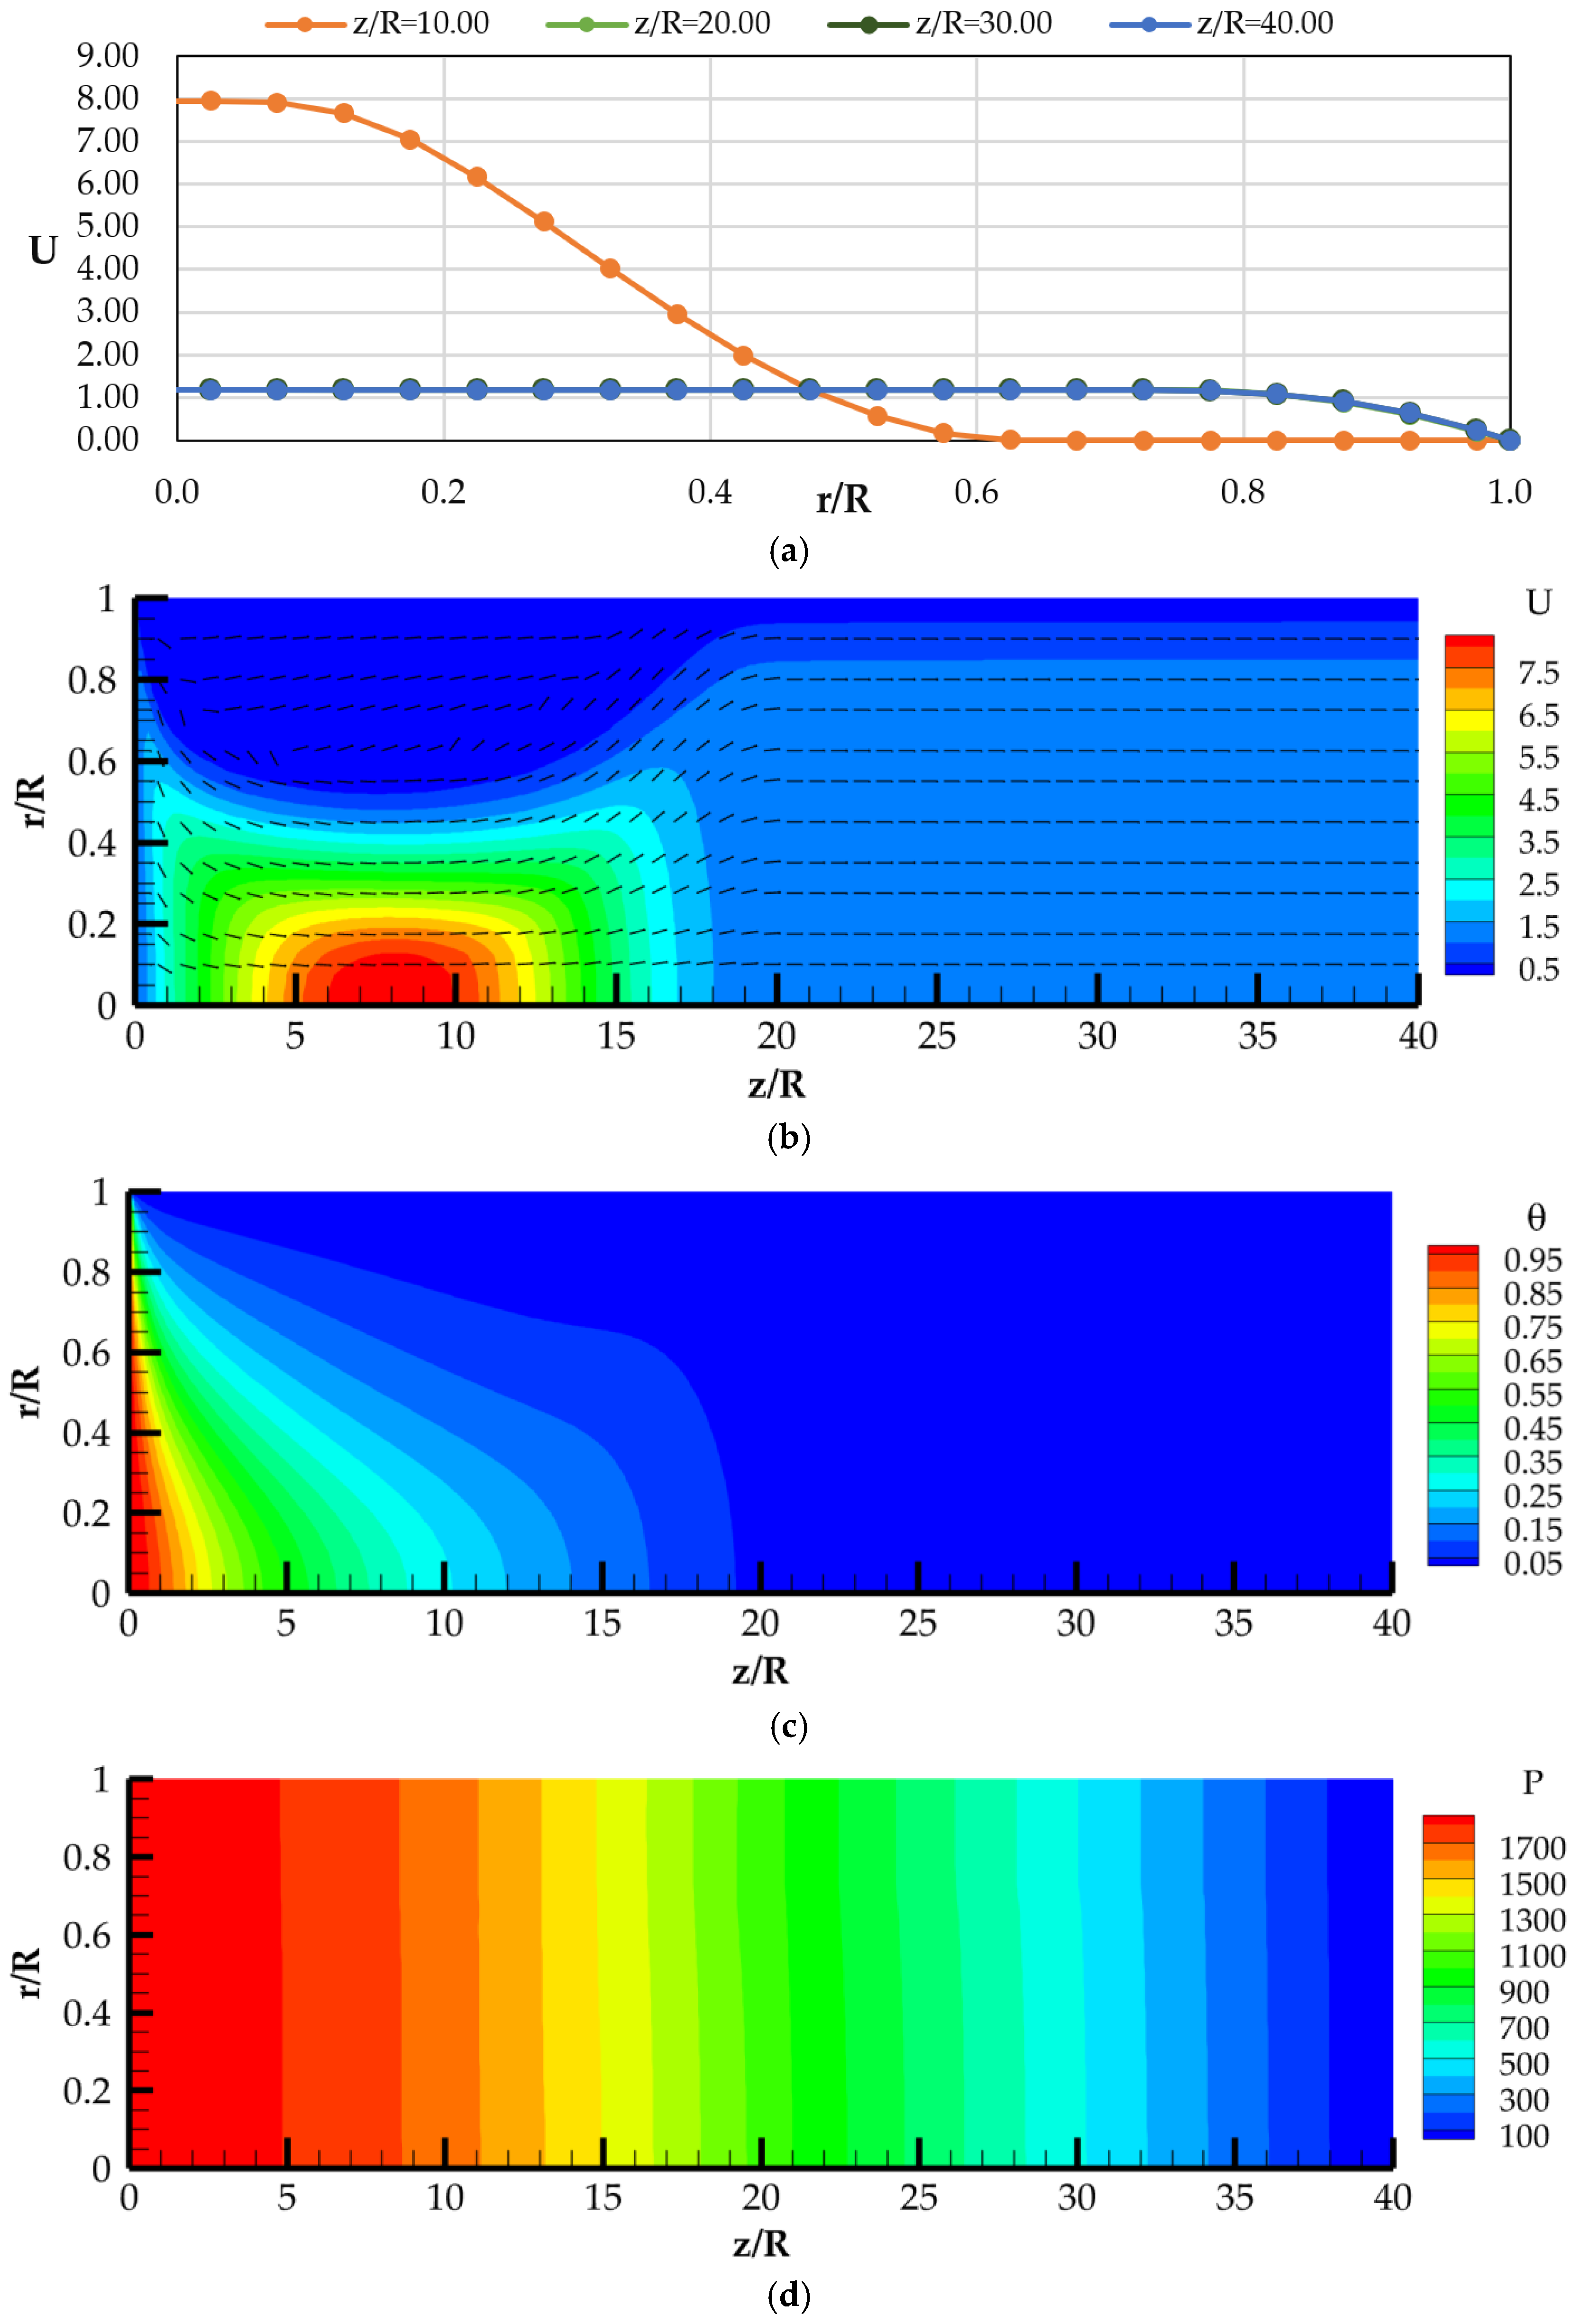
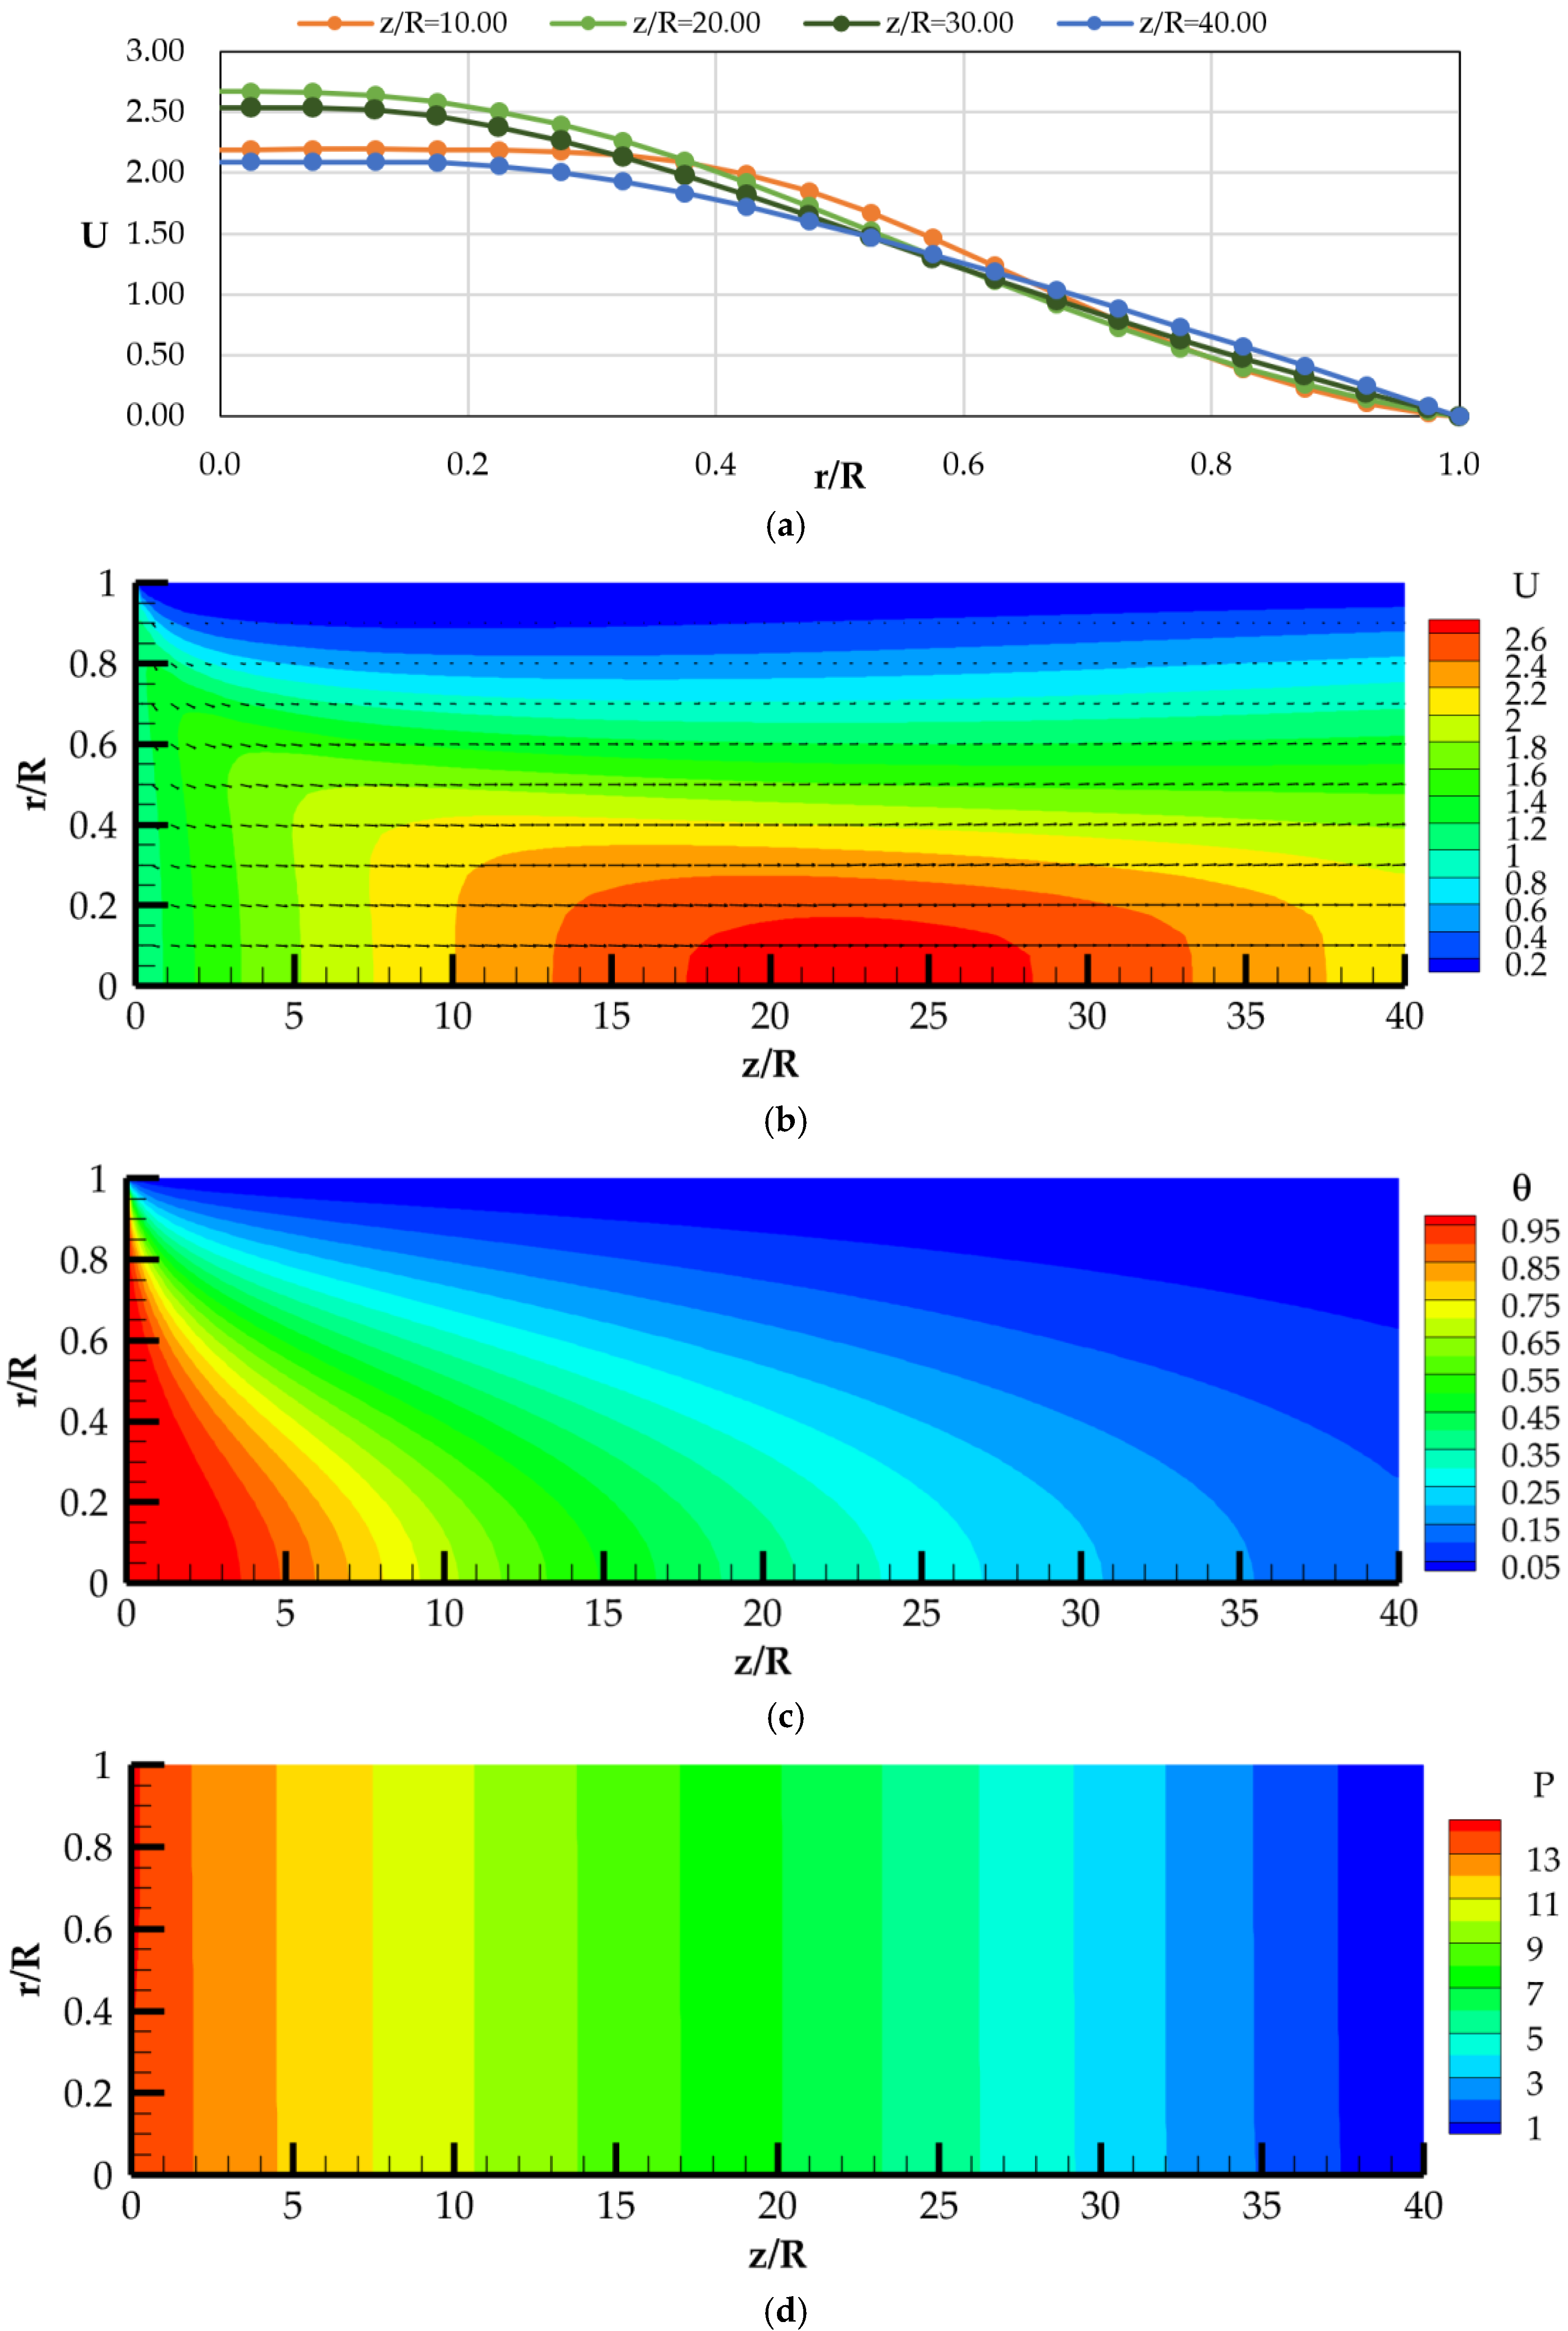
Figure 2 shows the calculation data at an average velocity u 1 = 0.05 m/s, an inlet oil temperature t 1 = 25 °C, a pipe wall temperature t w = 5 °C, a Reynolds number R e = 261, and a Bingham number B n = 118.29.
The axial velocity profiles show a stagnation zone (see Figure 2a), where the velocity is zero. The stagnation zone occurs due to the high yield stress and plastic viscosity values of the waxy oil. The appearance of the stagnation zone leads to a sharp change in the direction of the velocity vector. At the onset, the velocity vector is oriented towards the pipe axis (see Figure 2b). As the flow progresses, the vector shifts towards the wall (see Figure 2b), beyond the stagnation zone the velocity vector is directed along the pipe axis.
The stagnation zone reduces the cross-sectional area of the pipe in which the flow of waxy oil occurs. Therefore, the axial velocity profile U stretches with the maximum value ( U   = 8) along the pipe axis (see Figure 2a).
As seen in Figure 2c, the contours of excess temperature show a sharp decrease in the maximum value θ m due to cooling with heat exchange at the wall. Convective heat transfer causes the redistribution of the inlet temperature across the pipe cross-section. The oil is then in a viscoplastic state, and the axial velocity profile has the typical shape of the Bingham flow shape in the z / R = 40 section of the pipe (see Figure 2a). These results are also in agreement with the data from [29].
The pressure contours show the distributions of P (see Figure 2d). The pressure value is constant across the pipe cross-section and decreases along its length. The dimensionless pressure value at the pipe inlet is P = 1850 or p = 3931 Pa. A pressure drop of Δ p = 3931 Pa ensures the movement of waxy oil in the pipe.
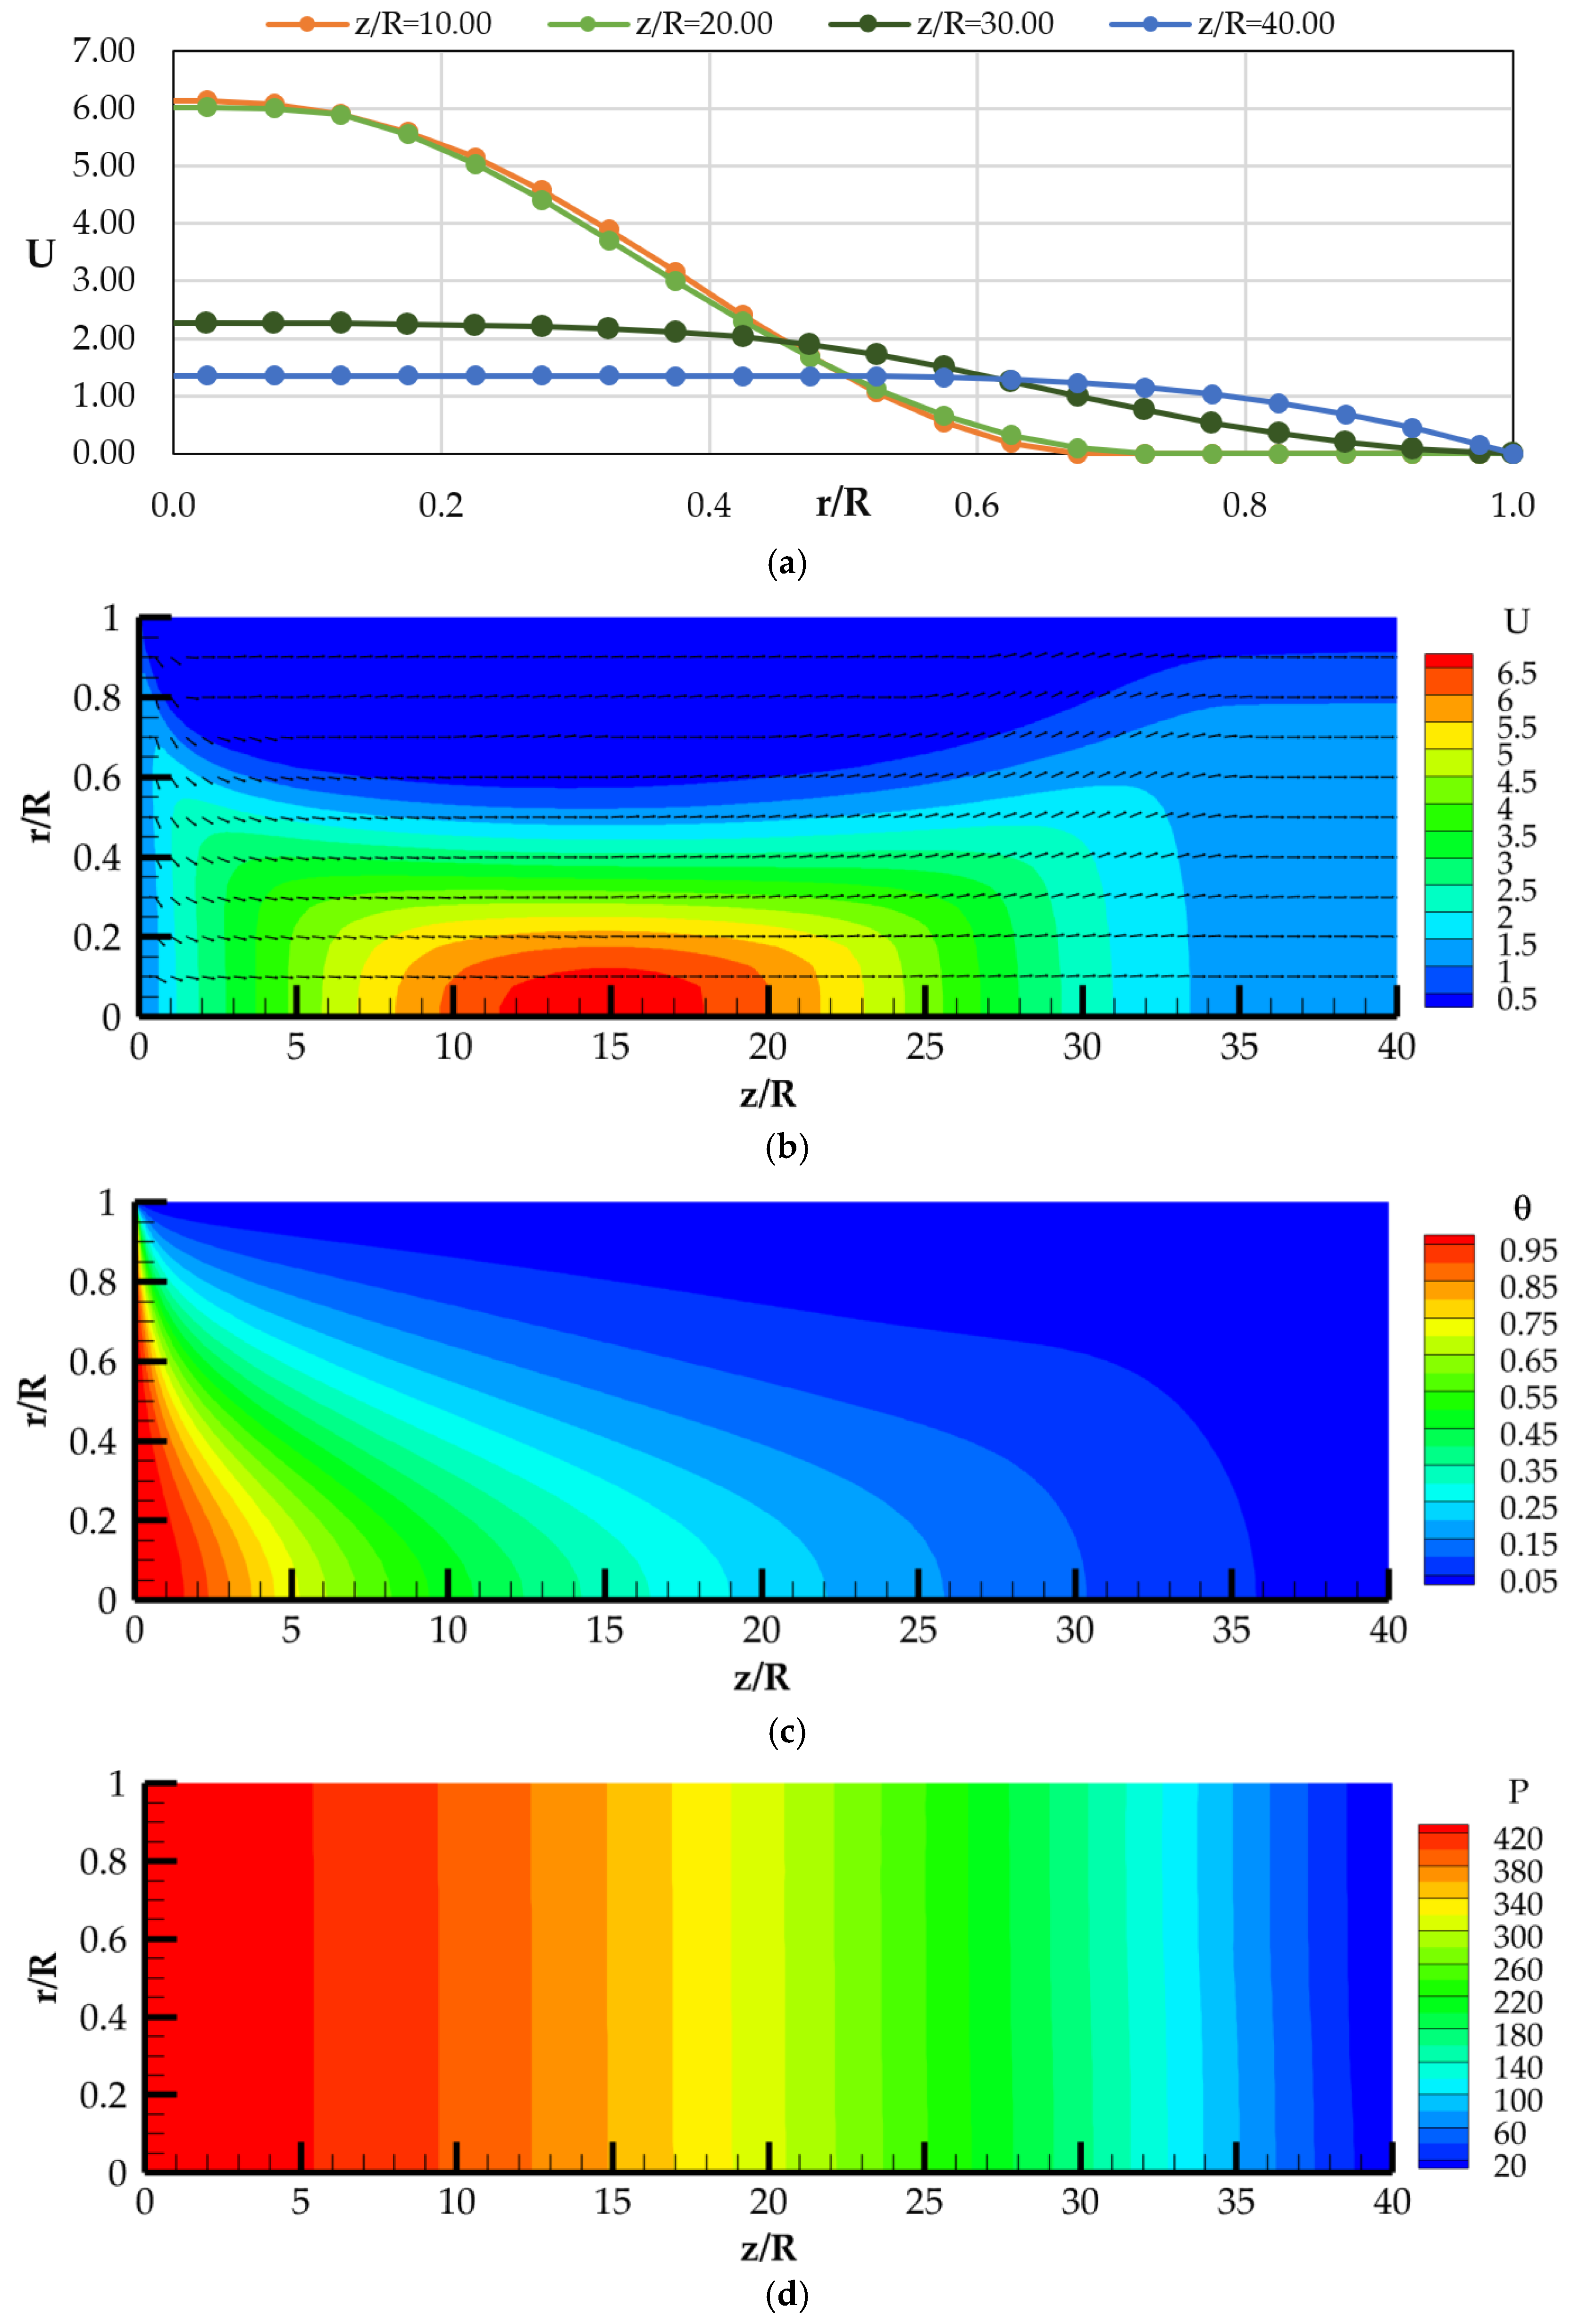
Figure 3 shows the calculated data for u1 = 0.10 m/s, t1 = 25 °C, tw = 5 °C, R e = 523, and B n = 59. Here, the growth of the stagnation zone and the zero value of the axial velocity profile along the pipe radius were also obtained (see Figure 3a) [27].
The velocity vector contours show the location of the stagnation zone in the flow field (see Figure 3b).
As shown in Figure 3b, the stagnation zone initially expands radially, reaches its maximum value, and then contracts radially towards the pipe wall. This trend is explained by the temperature distribution of the oil flow (see Figure 3c). At first, the temperature drops sharply due to heat exchange with the cold wall. Starting from z / R = 5, with the change in the direction of the velocity vector and convective heat flow, the temperature decreases monotonously (see Figure 3c). At z / R = 15, the convective heat flow is directed toward the wall, leading to temperature equalization in the flow field. Therefore, the radial profiles of the axial velocity U have the form of a Bingham flow and agree with the data of [29].
The pressure contours are shown in Figure 3d. The Bingham number in this case is B n = 59.14, which is almost half that in the previous case. This result indicates the reduced influence of yield stress and plastic viscosity on the flow’s hydraulic losses. The pressure drop is Δ p = 3655 Pa, which is less than in the previous case (see Figure 3d).
Figure 4 shows the calculated data for u 1 = 0.20 m/s, t1 = 25 °C, tw = 5 °C, R e = 1046, and B n = 29.57. The increases in the average flow velocity to 0.20 m/s and the Reynolds number to 1046 increase the influence of the inlet temperature t1 = 25 °C on heat transfer and temperature distribution along the pipe length.
As can be seen from the velocity vector isolines, the stagnation zone occupies a large area in the flow region (see Figure 4b). The region with the maximum velocity value is located in the near-axis zone (see Figure 4b). The velocity vector contours illustrate the impact of convective heat transfer on the temperature distribution. The temperature contours define the thermal state of the oil and the yield stress and plastic viscosity distributions of the oil in the flow region (see Figure 4c).
The pressure contours show a decrease in the hydraulic losses of the waxy oil flow (see Figure 4d). The pressure drop in this case is Δ p = 2822 Pa, which is lower than in the previous case (see Figure 4d).
The next series of calculations was carried out at tw = 10 °C. Figure 5 presents the calculation data at u1 = 0.05 m/s, t1 = 25 °C, tw = 10 °C, R e = 261, and B n = 17.01.
Under this regime, intense radial heat transfer occurs, alongside the equalization of excess oil temperature θ across the pipe cross-section (see Figure 5c). At the pipe outlet cross-section, the oil temperature has a uniform distribution equal to the wall temperature.
According to the temperature distribution, the axial velocity profiles transform to the form of the Bingham fluid flow (see Figure 5a). Starting at z / R = 15, the Bingham fluid flow profile can be seen. At the outlet section, the profile occupies the entire cross-section of the pipe (see Figure 5a).
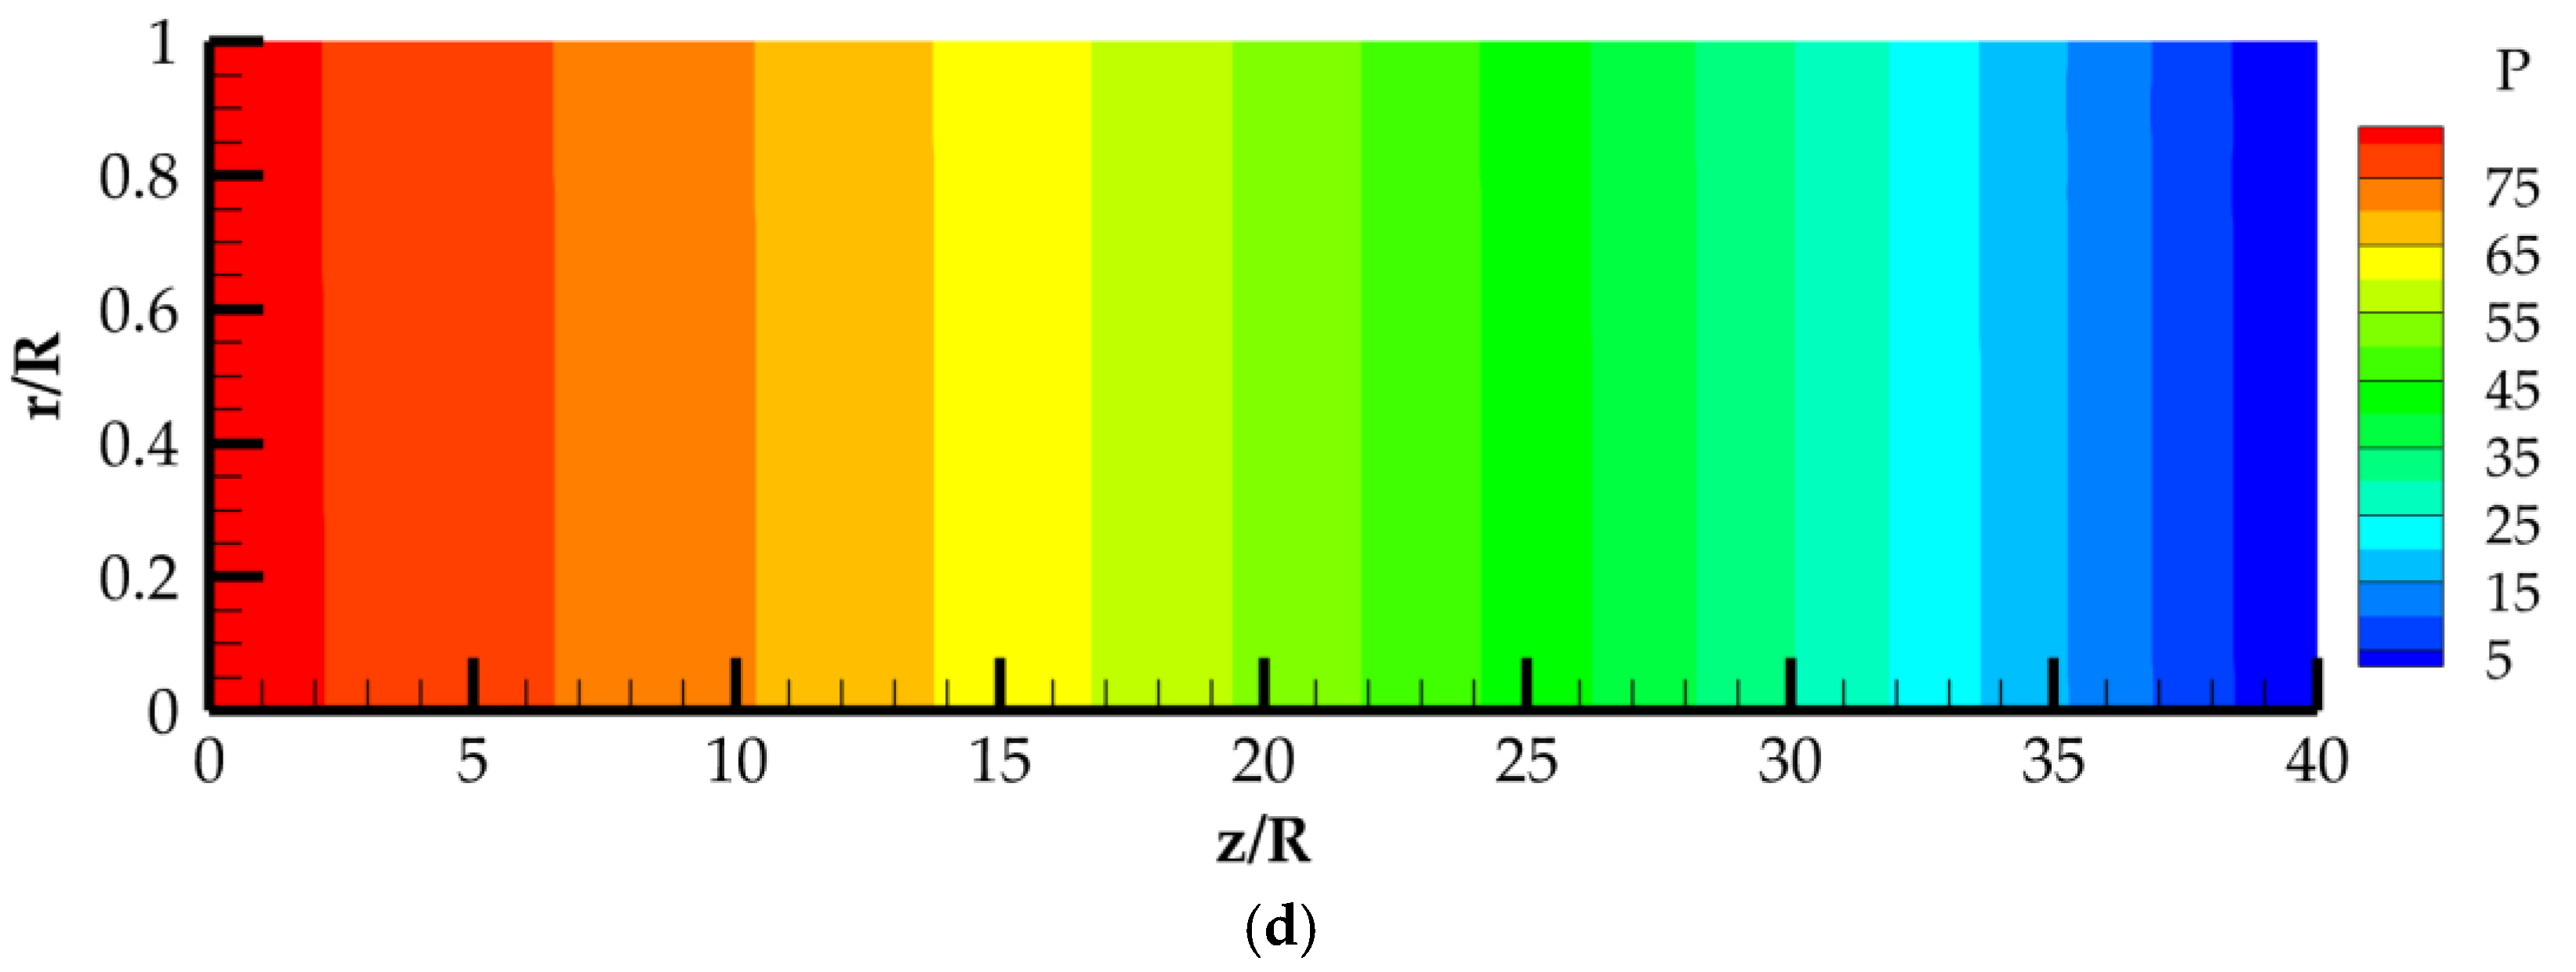
The velocity vector contours show convective heat transfer (see Figure 5b). The pressure drop of 367.6 Pa determines the flow of viscoplastic fluid in the pipe (see Figure 5d).
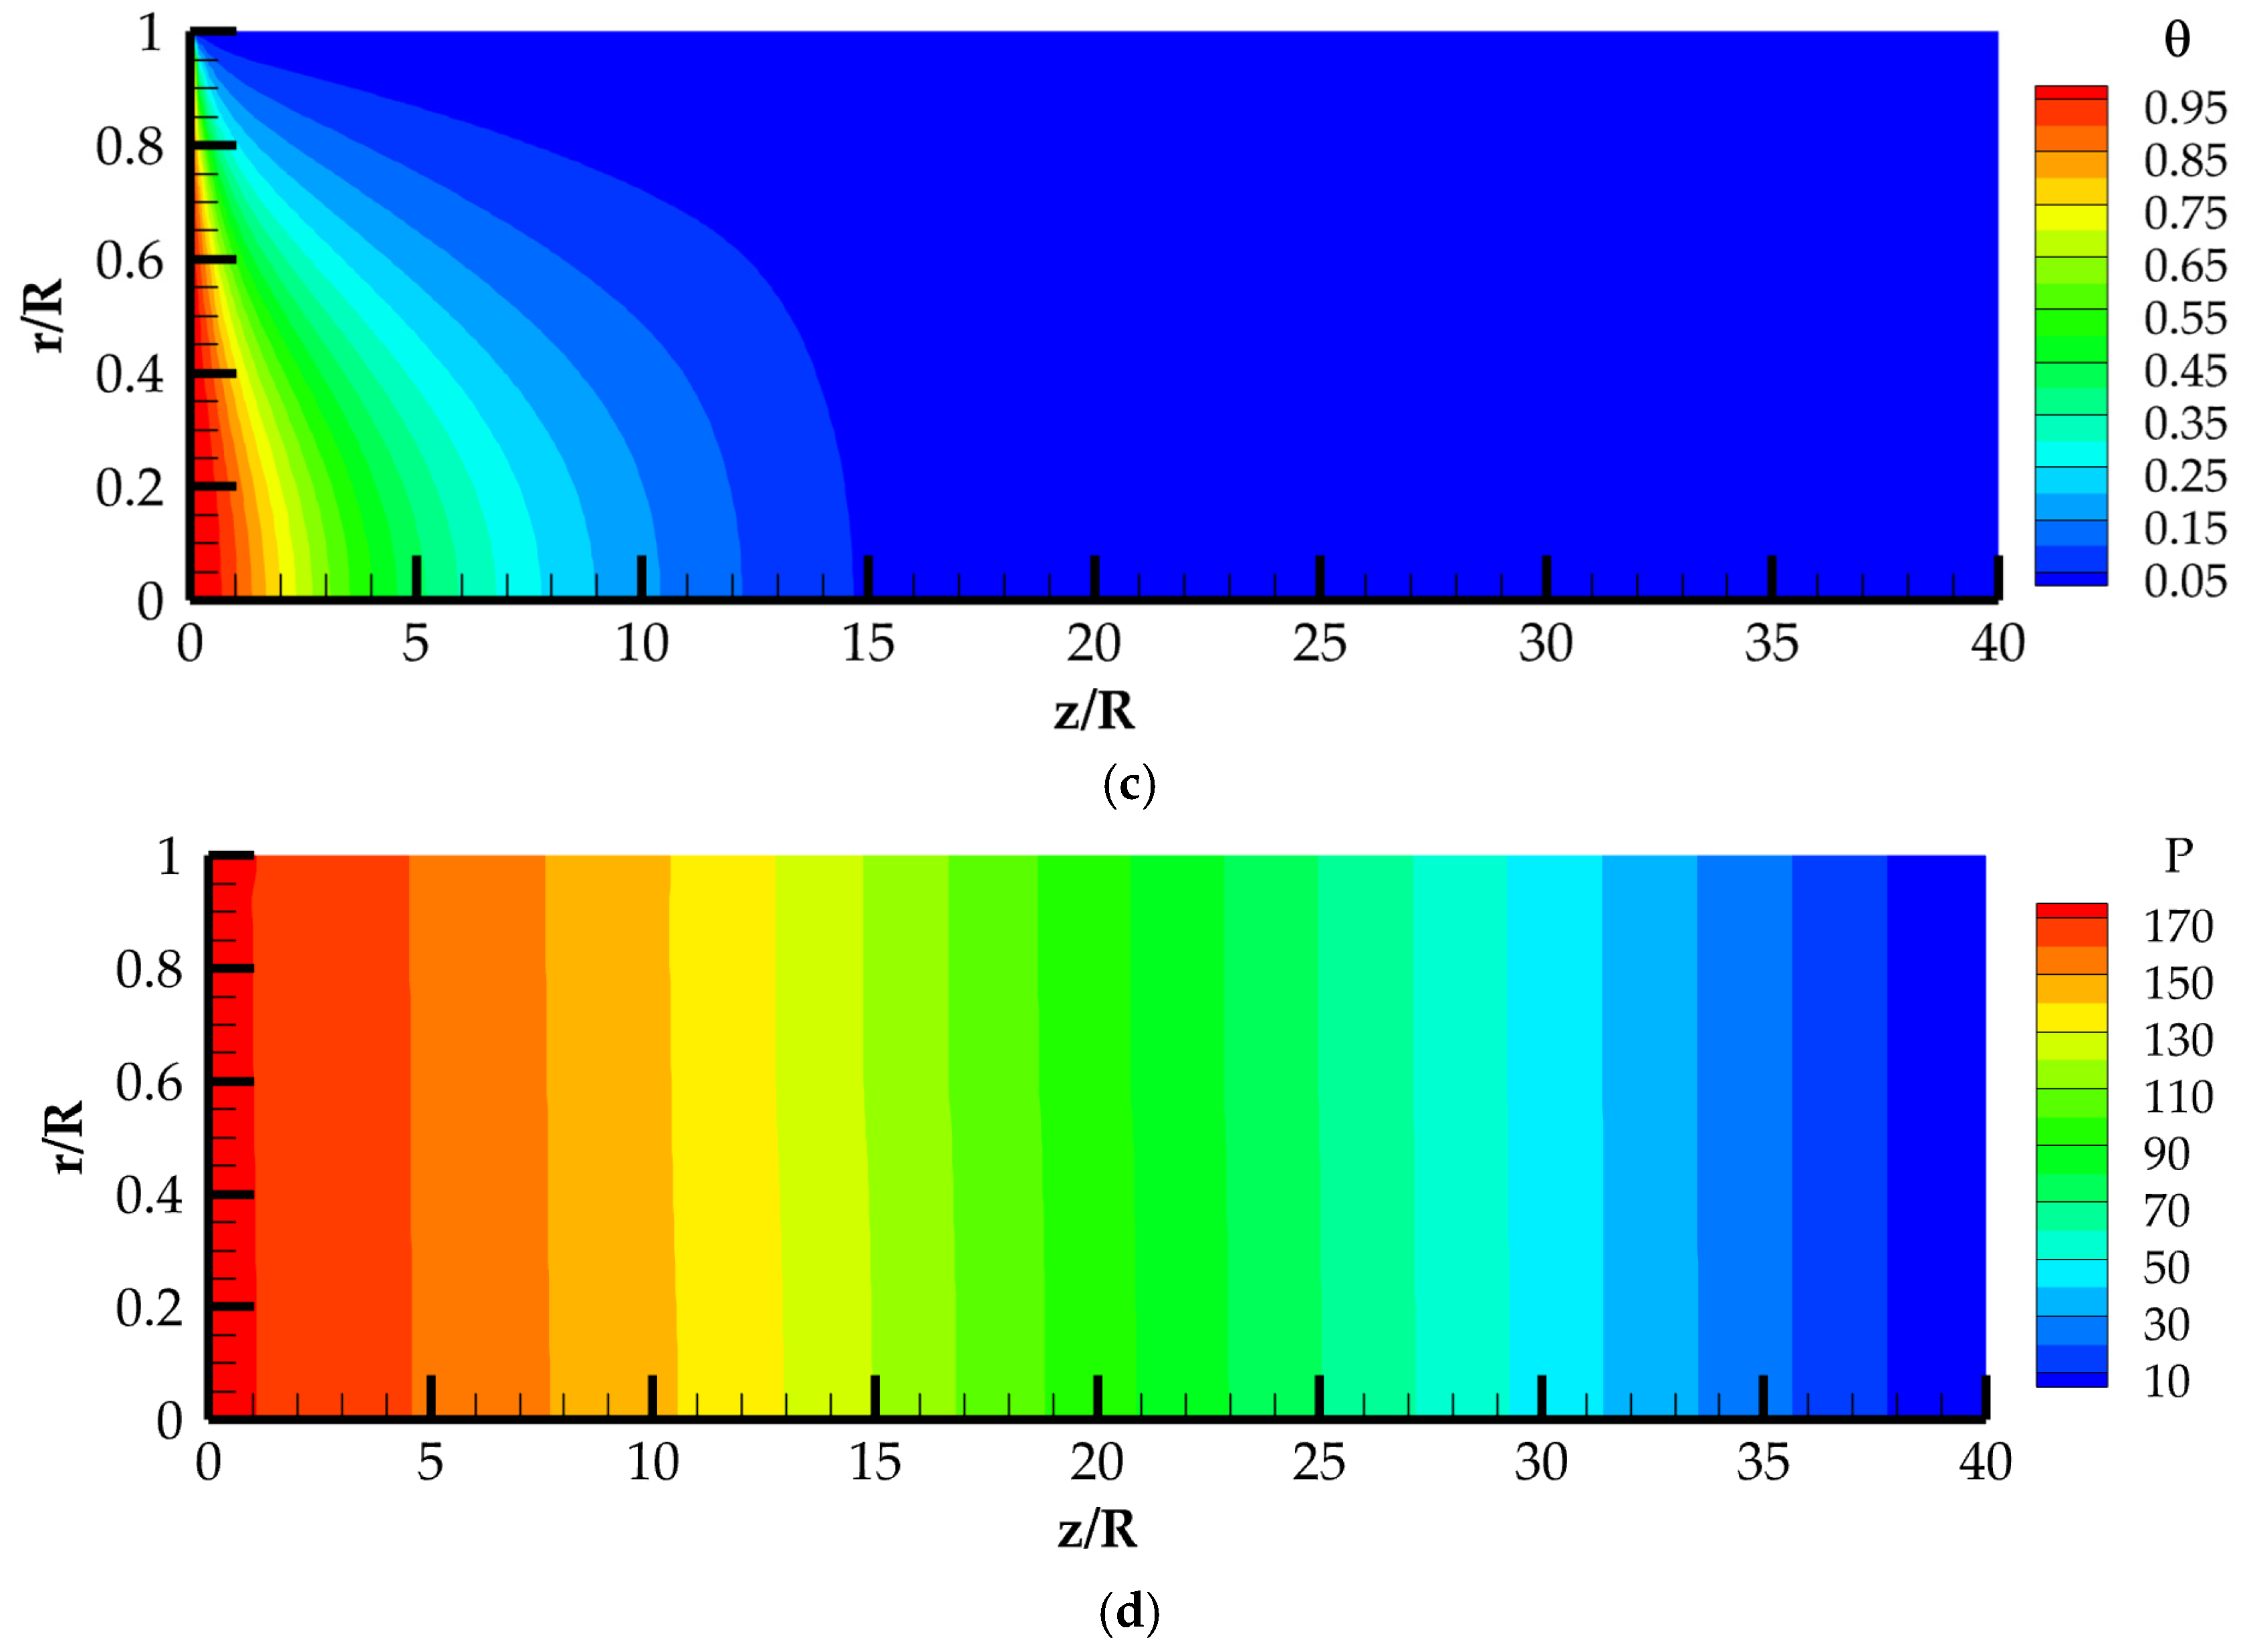
The calculated data for u1 = 0.10 m/s, t1 = 25 °C, tw = 10 °C, R e = 523, and B n = 8.51 are presented in Figure 6.
The value u1 = 0.10 m/s increases heat transfer in the axial direction of the flow. The axial velocity U value changes more slowly compared to the previous case, with a maximum value of U m = 1.34 at the pipe outlet cross-section (see Figure 6a). The stagnation zone occupies a small area and the axial velocity U profile has a constant core in the near-axis zone.
Increasing the average velocity enhances convective heat transfer and the influence of the inlet oil temperature in the axial direction (see Figure 6c). The elevated temperature field reduces the distribution of parameters τ 0 w ( t ) , μ p w ( t ) . Hydraulic losses of the viscoplastic fluid flow decrease ( Δ p = 395 Pa), as shown by the pressure distribution contour (see Figure 6d).
The computational data for u1 = 0.20 m/s, t1 = 25 °C, tw = 10°C, R e = 1046, B n = 4.25 are presented in Figure 7.
The axial velocity U profile barely has a stagnation zone (see Figure 7a). In the cross-section z / R = 10, it has a constant core corresponding to the shape of the Bingham fluid flow (see Figure 7a). In the cross-sections z / R = 20 and 30, a developing flow with an increasing velocity at the pipe axis can be observed. At the outlet cross-section z / R = 40, the velocity has a constant core in the near-axis zone (see Figure 7a). Changes in the U profile can be explained by the temperature distribution (see Figure 7b). These results are in qualitative agreement with the data of [29].
The increase in convective heat transfer, caused by the increases in average velocity to u1 = 0.20 m/s and, consequently, the Reynolds number to R e = 1046, leads to the inlet temperature t1 = 25 °C having influences at greater distances along the pipe length. This is facilitated by the value tw = 10 °C. Overall, the temperature field is higher compared to previous cases. The parameters μ p w t ,   τ 0 w ( t ) of waxy oil are lower compared to previous cases.
The pressure drop is Δ p = 476 Pa (see Figure 7d). An increase in the pressure drop compared to previous cases can be noted, caused by the increase in the average flow velocity.

4.2. Relationship between the Nusselt Number and the Reynolds and Bingham Numbers

The paper considers heat exchange of a developing flow of viscoplastic fluid, when μ p ( t ) and τ 0 ( t ) depend on temperature. Therefore, determining the Nusselt number is of interest. The Nusselt number N u is determined by the formula
N u = 2 θ m θ r ¯ r ¯ = 1 ,
where θ m ( z ¯ ) = t m t w / ( t 1 t w ) , and the average mass temperature tm( z ¯ ) is found by the following formula:
t m = ( 2 / u 1 R 2 ) 0 R t ( r ) u ( r ) r d r .
Figure 8 shows the distribution of the Nusselt number N u along the length of the pipe for different Reynolds numbers R e . The Nusselt number values N u ( z ¯ , Re )   are calculated based on the temperature distribution at t w = 10 °C.
The Bingham number B n = τ 0 w R / ( μ p w u 1 ) is found at tw = 10 °C and mean inlet velocity u 1 . The Bingham number varies with changes in the inlet mean velocity.
The calculated Nusselt number N u data are generalized via regression analysis, starting from the axial coordinate z ¯ = 5 along the pipe length. At the beginning of the pipe, the Nusselt number tends towards infinity due to the temperature gradient at the wall; this fact is also noted in [10].
The dependence of the Nusselt number N u on the Reynolds number R e and the axial coordinate z is given by
N u Z ¯ , R e = max 0 , k 1 X + k 6 Y 4 + k 2 X + k 7 Y 3 + k 3 X + k 8 Y 2 + k 4 X + k 9 Y + k 5 X + k 10 X = l o g 10 Z ¯ ,         Y = l o g 10 R e
The coefficients in Equation (12) are as follows:
k 1 = 1.483869 ,   k 2 = 17.31024 ,   k 3 = 75.066642 ,   k 4 = 142.81337 ,   k 5 = 101.918102 ,   k 6 = 1.076043 ,   k 7 = 12.783783 ,   k 8 = 56.836661 ,   k 9 = 109.579193 ,   k 10 = 78.525222 .
Figure 8 shows the distribution of the Nusselt number N u along the pipe length for different values of the Reynolds number R e . At R e = 104 and Bingham B n = 42.58, starting at z ¯ = 11.5, the Nusselt number tends towards zero, indicating that there is essentially no heat exchange between the flow and the pipe wall. In this regime, the inlet temperature of the oil quickly becomes uniform across the cross-section, and from z ¯ = 11.5, which is equal to the wall temperature. A similar effect occurs at R e = 261 and B n = 17.01, where starting from z / R = 26, the oil temperature becomes equal to the wall temperature. An increase in the Reynolds number R e from 523 to 2615 in addition to a reduction in the Bingham number from 8.51 to 1.7, leads to an increase in the Nusselt number (see Figure 8).
The calculated data show agreement between the analytical dependence (12) and the numerical values of the Nusselt number (see Figure 8).
Thus, an increase in the Reynolds number R e   leads to an increase in the Nusselt number N u ( z ¯ , Re ) along the length of the pipe. It is also noteworthy that the increase in the Nusselt number N u ( z ¯ , Re ) is achieved by decreasing the Bingham number B n .

5. Conclusions

The article studies heat transfer during the laminar flow of waxy oil in a pipe taking into account the dependence μ p t ,   τ 0 t on temperature. A numerical solution of the system of equations of motion and heat transfer of a viscoplastic fluid is obtained. The calculations established the influence of the R e and B n numbers on the axial velocity profiles, temperature, and pressure distribution.
The formation of the stagnation zone, where the flow velocity is zero, depends on the Bingham number B n . As the Bingham and Reynolds numbers increase, the stagnation zone in the near-wall region of the pipe increases. This outcome significantly impacts the heat transfer of the viscoplastic fluid with the wall and the temperature distribution across the pipe cross-section.
The dependence of the Nusselt number N u ( z ¯ , Re ) on the Reynolds number along the pipe length was determined for different values of the Bingham number B n . It is established that this dependence N u ( z ¯ , Re ) increases as the Reynolds number R e increases, i.e., the heat transfer with the pipe wall increases as the Bingham number decreases.

Author Contributions

Conceptualization, U.Z. and M.P.; methodology, U.Z., M.P. and T.B.; software, T.B.; validation, M.P., T.B. and G.R.; investigation, U.Z. and T.B.; data curation, T.B.; writing—original draft preparation, U.Z. and G.R.; visualization, T.B. and G.R.; supervision, U.Z.; project administration U.Z. and G.R.; funding acquisition, U.Z. All authors have read and agreed to the published version of the manuscript.

Funding

The financial support for this research project was provided by the Science Committee of the Ministry of Science and Higher Education of the Republic of Kazakhstan (Grant number AP23486543 for 2024–2026).

Data Availability Statement

The original contributions presented in the study are included in the article, further inquiries can be directed to the corresponding authors.

Conflicts of Interest

The authors declare no conflicts of interest.

Nomenclature

Latin
BnBingham number
BrBrinkman number
c p heat capacity, J/(kg·°C)
Dinner diameter of pipe, m
Lpipe length, m
NuNusselt number
PePeclet number
PrPrandtl number
ReReynolds number
Rinner radius of pipe, m
Greek
γ ˙ strain rate tensor, 1/s
μ e f f effective molecular viscosity, Pa·s
μ p plastic viscosity, Pa·s
Λthermal conductivity, W/m·°C
ρdensity, kg/m3
τ 0 yield shear stress, Pa
τshear stress, Pa

References

  1. Barnes, H.A. The Yield Stress—A Review or ‘παντα ρει’−Everything Flows? J. Non-Newton. Fluid Mech. 1999, 81, 133–178. [Google Scholar] [CrossRef]
  2. Zhapbasbayev, U.K.; Ramazanova, G.I.; Bossinov, D.Z.; Kenzhaliyev, B.K. Flow and Heat Exchange Calculation of Waxy Oil in the Industrial Pipeline. Case Stud. Therm. Eng. 2021, 26, 101007. [Google Scholar] [CrossRef]
  3. Tugunov, P.I.; Novoselov, V.I. Transportation of Viscous Oil and Petroleum Products Through Pipelines; Nedra: Moscow, Russia, 1972. (In Russian) [Google Scholar]
  4. Aiyejina, A.; Chakrabarti, D.P.; Pilgrim, A.; Sastry, M.K.S. Wax formation in oil-pipelines: A critical review. Int. J. Multiph. Flow 2011, 37, 671–694. [Google Scholar] [CrossRef]
  5. Letelier, M.F.; Siginer, D.A.; Barrera, C.; González, A.; Boutaous, M. Forced convection in non-circular tubes with non-linear viscoelastic fluids including viscous dissipation. Int. J. Therm. Sci. 2020, 150, 106122. [Google Scholar] [CrossRef]
  6. Vradis, G.C.; Dougher, J.; Kumar, S. Entrance pipe flow and heat transfer for a Bingham plastic. Int. J. Heat Mass Transf. 1993, 36, 543–552. [Google Scholar] [CrossRef]
  7. Boutra, A.; Ragui, K.; Benkahla, Y.K.; Labsi, N. Mixed convection of a Bingham fluid in differentially heated square enclosure with partitions. Theor. Found. Chem. Eng. 2018, 52, 286–294. [Google Scholar] [CrossRef]
  8. Kefayati, G. Lattice Boltzmann method for natural convection of a Bingham fluid in a porous cavity. Phys. A Stat. Mech. Appl. 2019, 521, 146–172. [Google Scholar] [CrossRef]
  9. Coelho, P.M.; Poole, R.J. Heat transfer of Bingham fluids in an annular duct with viscous dissipation. Heat Transf. Eng. 2017, 39, 1749–1765. [Google Scholar] [CrossRef]
  10. Min, T.; Choi, H.G.; Yoo, J.Y.; Choi, H. Laminar convective heat transfer of a Bingham plastic in a circular pipe II. Numerical approach hydrodynamically developing flow and simultaneously developing flow. Int. J. Heat Mass Transfer. 1997, 41, 3689–3701. [Google Scholar] [CrossRef]
  11. Adnan, M.; Asadullah, U.; Khan, N.; Ahmed, S.T. Mohyud-Din, Analytical and numeri-cal investigation of thermal radiation effects on flow of viscous incompressible fluid with stretchable convergent/divergent channels. J. Mol. Liq. 2016, 224, 768–775. [Google Scholar] [CrossRef]
  12. Hermany, L.; Lorenzini, G.; Klein, R.; Zinani, F.; dos Santos, E.; Isoldi, L.; Rocha, L. Constructal design applied to elliptic tubes in convective heat transfer cross-flow of viscoplastic fluids. Int. J. Heat Mass Transf. 2018, 116, 1054–1063. [Google Scholar] [CrossRef]
  13. Sahu, K.C. Linear instability in a miscible core-annular flow of a Newtonian and a Bingham fluid. J. Non-Newton. Fluid Mech. 2019, 264, 159–169. [Google Scholar] [CrossRef]
  14. Kefayati, G.; Tang, H. MHD mixed convection of viscoplastic fluids in different aspect ratios of a lid-driven cavity using LBM. Int. J. Heat Mass Transf. 2018, 124, 344–367. [Google Scholar] [CrossRef]
  15. Kefayati, G.R.; Tang, H. Lattice Boltzmann simulation of viscoplastic fluids on natural convection in inclined enclosure with inner cold circular/elliptical cylinders (Part II: Two cylinders). Int. J. Heat Mass Transf. 2018, 123, 1163–1181. [Google Scholar] [CrossRef]
  16. Kefayati, G.; Tang, H. Lattice Boltzmann simulation of viscoplastic fluids on natural convection in inclined enclosure with inner cold circular/elliptical cylinders (Part III: Four cylinders). Int. J. Heat Mass Transf. 2018, 123, 1182–1203. [Google Scholar] [CrossRef]
  17. Kefayati, G.; Tang, H. Lattice Boltzmann simulation of viscoplastic fluids on natural convection in an inclined enclosure with inner cold circular/elliptical cylinders (Part I: One cylinder). Int. J. Heat Mass Transf. 2018, 123, 1138–1162. [Google Scholar] [CrossRef]
  18. Turan, O.; Chakraborty, N. The effects of bottom wall heating on mixed convection of yield stress fluids in cylindrical enclosures with a rotating end wall. Int. J. Heat Mass Transf. 2018, 121, 759–774. [Google Scholar] [CrossRef]
  19. Ragui, K.; Boutra, A.; Bennacer, R.; Benkahla, Y.K. Progress on numerical simulation of yield stress fluid flows (Part I): Correlating thermosolutal coefficients of Bingham plastics within a porous annulus of a circular shape. Int. J. Heat Mass Transf. 2018, 126, 72–94. [Google Scholar] [CrossRef]
  20. Kefayati, G. Double-diffusive natural convection and entropy generation of Bingham fluid in an inclined cavity. Int. J. Heat Mass Transf. 2018, 116, 762–812. [Google Scholar] [CrossRef]
  21. Hu, K.-X.; He, M.; Chen, Q.-S.; Liu, R. On the stability of thermocapillary convection of a Bingham fluid in an infinite liquid layer. Int. J. Heat Mass Transf. 2018, 122, 993–1002. [Google Scholar] [CrossRef]
  22. Coelho, P.; Pinho, F.; Oliveira, P. Fully developed forced convection of the Phan- Thien–Tanner fluid in ducts with a constant wall temperature. Int. J. Heat Mass Transf. 2002, 45, 1413–1423. [Google Scholar] [CrossRef]
  23. Fusi, L.; Farina, A.; Rajagopal, K.R.; Vergori, L. Channel flows of shear-thinning fluids that mimic the mechanical response of a Bingham fluid. Int. J. Non-Linear Mech. 2022, 138, 103847. [Google Scholar] [CrossRef]
  24. Bingham, E.C. Fluidity and Plasticity; McGraw-Hill: New York, NY, USA, 1922. [Google Scholar]
  25. Wilkinson, W.L. Non-Newtonian fluids. In Fluid Mechanics, Mixing and Heat Transfer; Pergamon Press: London, UK, 1960. [Google Scholar]
  26. Klimov, D.M.; Petrov, A.G.; Georgievsky, D.V. Viscoplastic Flows: Dynamic Chaos, Stability and Mixing; Publishing House Nauka: Moscow, Russia, 2005. (In Russian) [Google Scholar]
  27. Zhapbasbayev, U.K.; Bekibayev, T.T.; Pakhomov, M.A.; Ramazanova, G.I. Numerical Modeling of Non-Isothermal Laminar Flow and Heat Transfer of Paraffinic Oil with Yield Stress in a Pipe. Energies 2024, 17, 2080. [Google Scholar] [CrossRef]
  28. Papanastasiou, T.C. Flows of materials with yield. J. Rheol. 1987, 31, 385–404. [Google Scholar] [CrossRef]
  29. Vinay, G.; Wachs, A.; Agassant, J.-F. Numerical simulation of non-isothermal viscoplastic waxy crude oil flows. J. Non-Newton. Fluid Mech. 2005, 128, 144–162. [Google Scholar] [CrossRef]
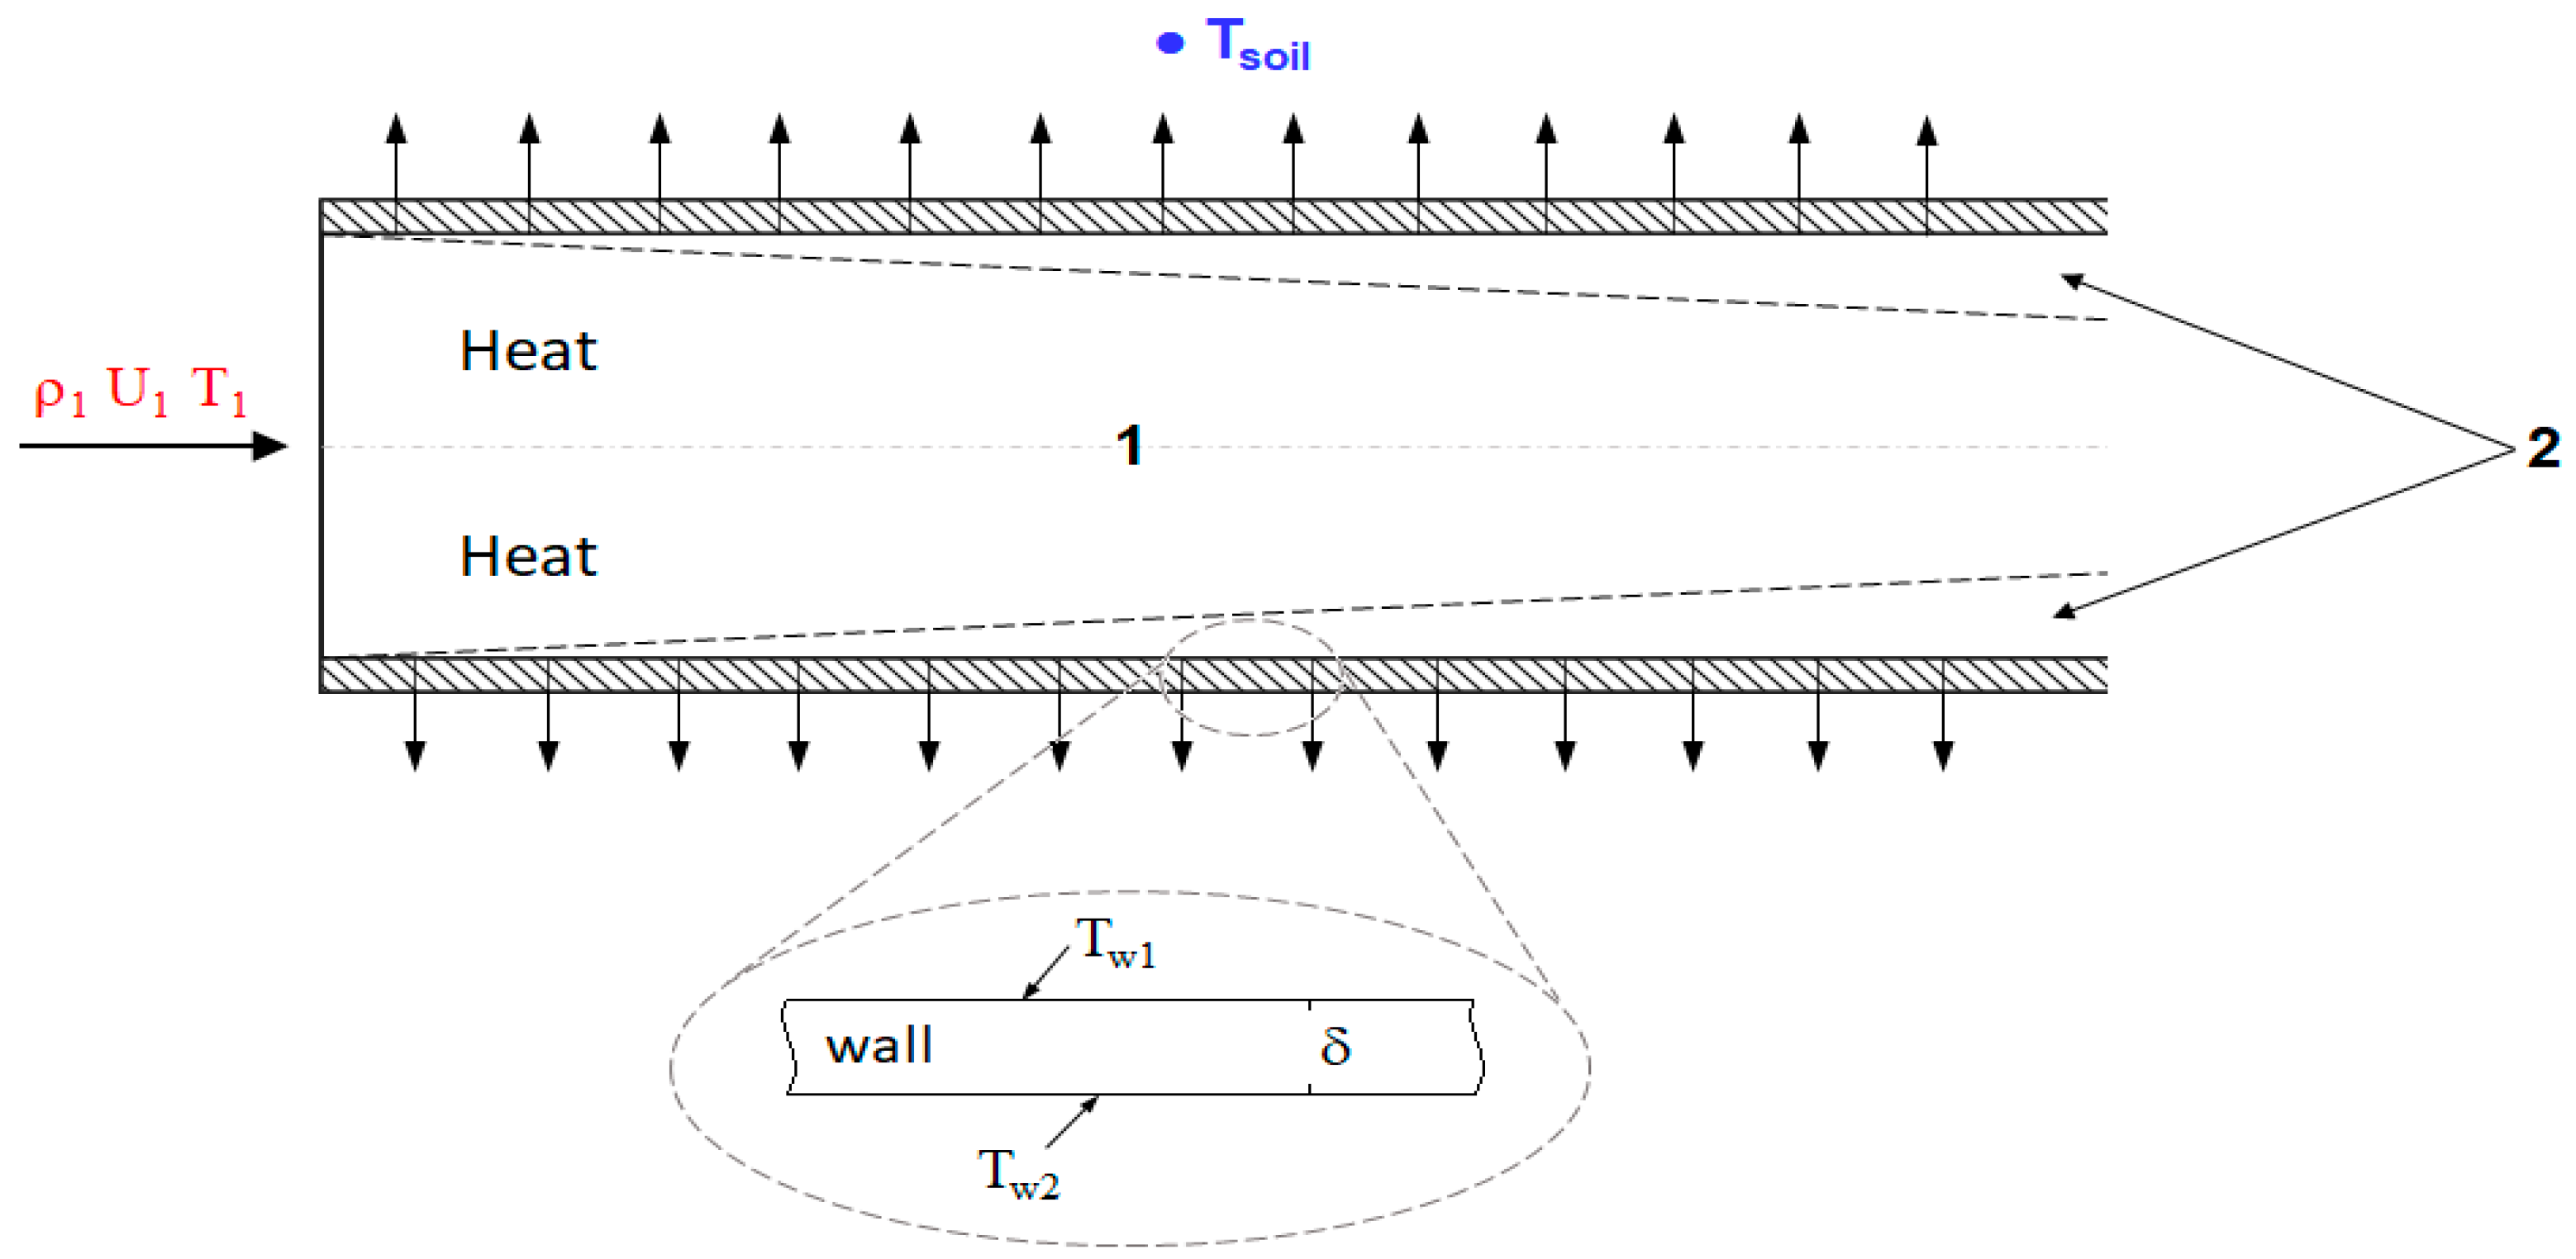
Figure 1. Flow heat exchange diagram: 1—Newtonian fluid flow; 2—Non-Newtonian fluid flow.
Energies 17 04687 g001
Figure 2. Calculated data of velocity U (a), velocity vector contours (b), temperature θ (c), and pressure P (d) at Re = 261, Bn = 118.29.
Energies 17 04687 g002
Figure 3. Calculated data of velocity U (a), velocity vector contours (b), temperature Θ (c), and pressure P (d) at R e = 523, and B n = 59.14.
Energies 17 04687 g003
Figure 4. Calculated data of velocity U (a), velocity vector contours (b), temperature θ (c), and pressure P (d) at R e = 1046, and B n = 29.57.
Energies 17 04687 g004aEnergies 17 04687 g004b
Figure 5. Calculated data of velocity U (a), velocity vector contours (b), temperature θ (c), and pressure P (d) at R e = 261, and B n = 17.01.
Energies 17 04687 g005aEnergies 17 04687 g005b
Figure 6. Calculated data of velocity U (a), velocity vector contours (b), temperature θ (c), and pressure P (d) at R e = 523, and B n = 8.51.
Energies 17 04687 g006
Figure 7. Calculated data of velocity U (a), velocity vector contours (b), temperature θ (c), and pressure P (d) at R e = 1046, and B n = 4.25.
Energies 17 04687 g007
Figure 8. The distribution of the Nusselt number along the pipe length at a wall temperature t w = 10 °C and various Reynolds and Bingham numbers.
Energies 17 04687 g008
Disclaimer/Publisher’s Note: The statements, opinions and data contained in all publications are solely those of the individual author(s) and contributor(s) and not of MDPI and/or the editor(s). MDPI and/or the editor(s) disclaim responsibility for any injury to people or property resulting from any ideas, methods, instructions or products referred to in the content.