Article

Comparative Analysis of Magnetic Field Distribution Characteristics of Two Shapes of Air-Core Bridge Arm Reactors

Department of Electrical Engineering, Tsinghua University, Beijing 100084, China
*
Author to whom correspondence should be addressed.
Energies 2024, 17(18), 4652; https://doi.org/10.3390/en17184652
Submission received: 20 July 2024 / Revised: 12 September 2024 / Accepted: 13 September 2024 / Published: 18 September 2024
(This article belongs to the Section F1: Electrical Power System)

Abstract

:
The application of air-core reactors in power systems is extensive and primarily aimed at enhancing system stability, limiting short-circuit currents, and providing reactive power compensation. Currently, the type most commonly used in power systems is the cylindrical-shaped air-core reactor (CAR), known for its stable mechanical structure and mature manufacturing process. However, the external magnetic field generated by this reactor propagates over a considerable distance in the air, which can interfere with the normal operation of many power electronic devices. This paper presents a comparative analysis between a novel annular-shaped air-core bridge arm reactor (AABAR) and the widely used cylindrical-shaped air-core bridge arm reactor (CABAR) within a DC transformer system. The comparison focuses on the magnetic field distribution, including magnetic flux density, magnetic field radiation range, and magnetic field energy, as well as the attenuation characteristics of these physical quantities. The concept of magnetic clearance (MC) is introduced as a quantitative metric. Through finite element simulation software (AEDT 2021 R1), it is demonstrated that the annular-shaped air-core reactor design can significantly improve spatial utilization and reduce the actual usage space of the reactors in DC transformer systems.

1. Introduction

With the rapid development of renewable energy sources such as wind and solar power, power systems require more efficient and flexible transmission and distribution methods [1]. DC transformers can effectively convert DC power at different voltage levels, which is particularly important for long-distance high-voltage direct current (HVDC) systems [2,3,4]. DC transformers not only improve energy transmission efficiency and reduce transmission losses but also facilitate smooth power flow between different grids, enhancing system stability and reliability [5,6,7].
Bridge arm reactors (BARs) play a crucial role as an essential component of DC transformers. Their functions include suppressing circulating currents between bridge arms, inhibiting the rapid rise of bridge arm currents during short-circuit faults, and effectively mitigating high-frequency harmonics [8,9]. The performance requirements for reactors have increased with the widespread application of power electronic devices in power systems. Since power electronic devices are sensitive to electromagnetic radiation, BARs must possess excellent magnetic field containment capabilities [10,11]. The radiation range of these reactors must be controlled within specific limits to ensure minimal magnetic field energy leakage, preventing the generation of eddy currents in surrounding metal structures, grounding grids, and other metallic loops, which could cause electromagnetic interference and excessive temperature increases in secondary systems [12,13,14,15]. Additionally, if the magnetic field strength around air-core reactors in the operational area exceeds the standard exposure limits, it may pose health risks to personnel [16].
In practical engineering, the concept of magnetic clearance (MC) is introduced as a metric to quantify the attenuation characteristics of the external magnetic fields of air-core reactors, guiding the design and maintenance of the reactors [17]. Furthermore, the insulation clearance (IC) is specified to quantify the minimum safe distance that prevents dielectric breakdown under operating voltage and overvoltage conditions [18].
For high-voltage large-capacity cylindrical air-core reactors (HLCARs), the lack of a fixed magnetic circuit results in the working magnetic field diverging into space, making the MC significantly larger than the insulation clearance. This necessitates a larger space for the actual use of air-core reactors [19,20]. In DC transformer systems and other space-sensitive applications, the magnetic field coverage of air-core reactors critically impacts the feasibility of compact system design [21,22,23,24].
For the case of the DC transformer system studied in this paper, if a direct short circuit occurs across a set of bridge arms, the resulting short-circuit current cannot be adequately protected by existing devices [25,26,27]. One way to overcome this problem is to place the bridge arm reactors adjacent to each valve section, incorporating the reactors into the short-circuit loop. This configuration slows down the rise rate of the bridge arm current, allowing sufficient time for protective actions [28,29]. However, the valve hall space is limited, and the power electronic devices within are highly sensitive to electromagnetic interference, necessitating reactors with high volumetric density, smaller radiation range, and minimal magnetic leakage [30,31]. Based on the parameters in Table 1, two different shapes of BARs are designed in this paper, both with an inductance value of 5 mH (3D models shown in Figure 1). Detailed simulations were conducted to study the magnetic field characteristics of the two reactor shapes, demonstrating the advantages of the annular-shaped air-core bridge arm reactor (AABAR) in the DC transformer system.
The specific technical requirements and electrical parameters for the BARs in the DC transformer were as follows:
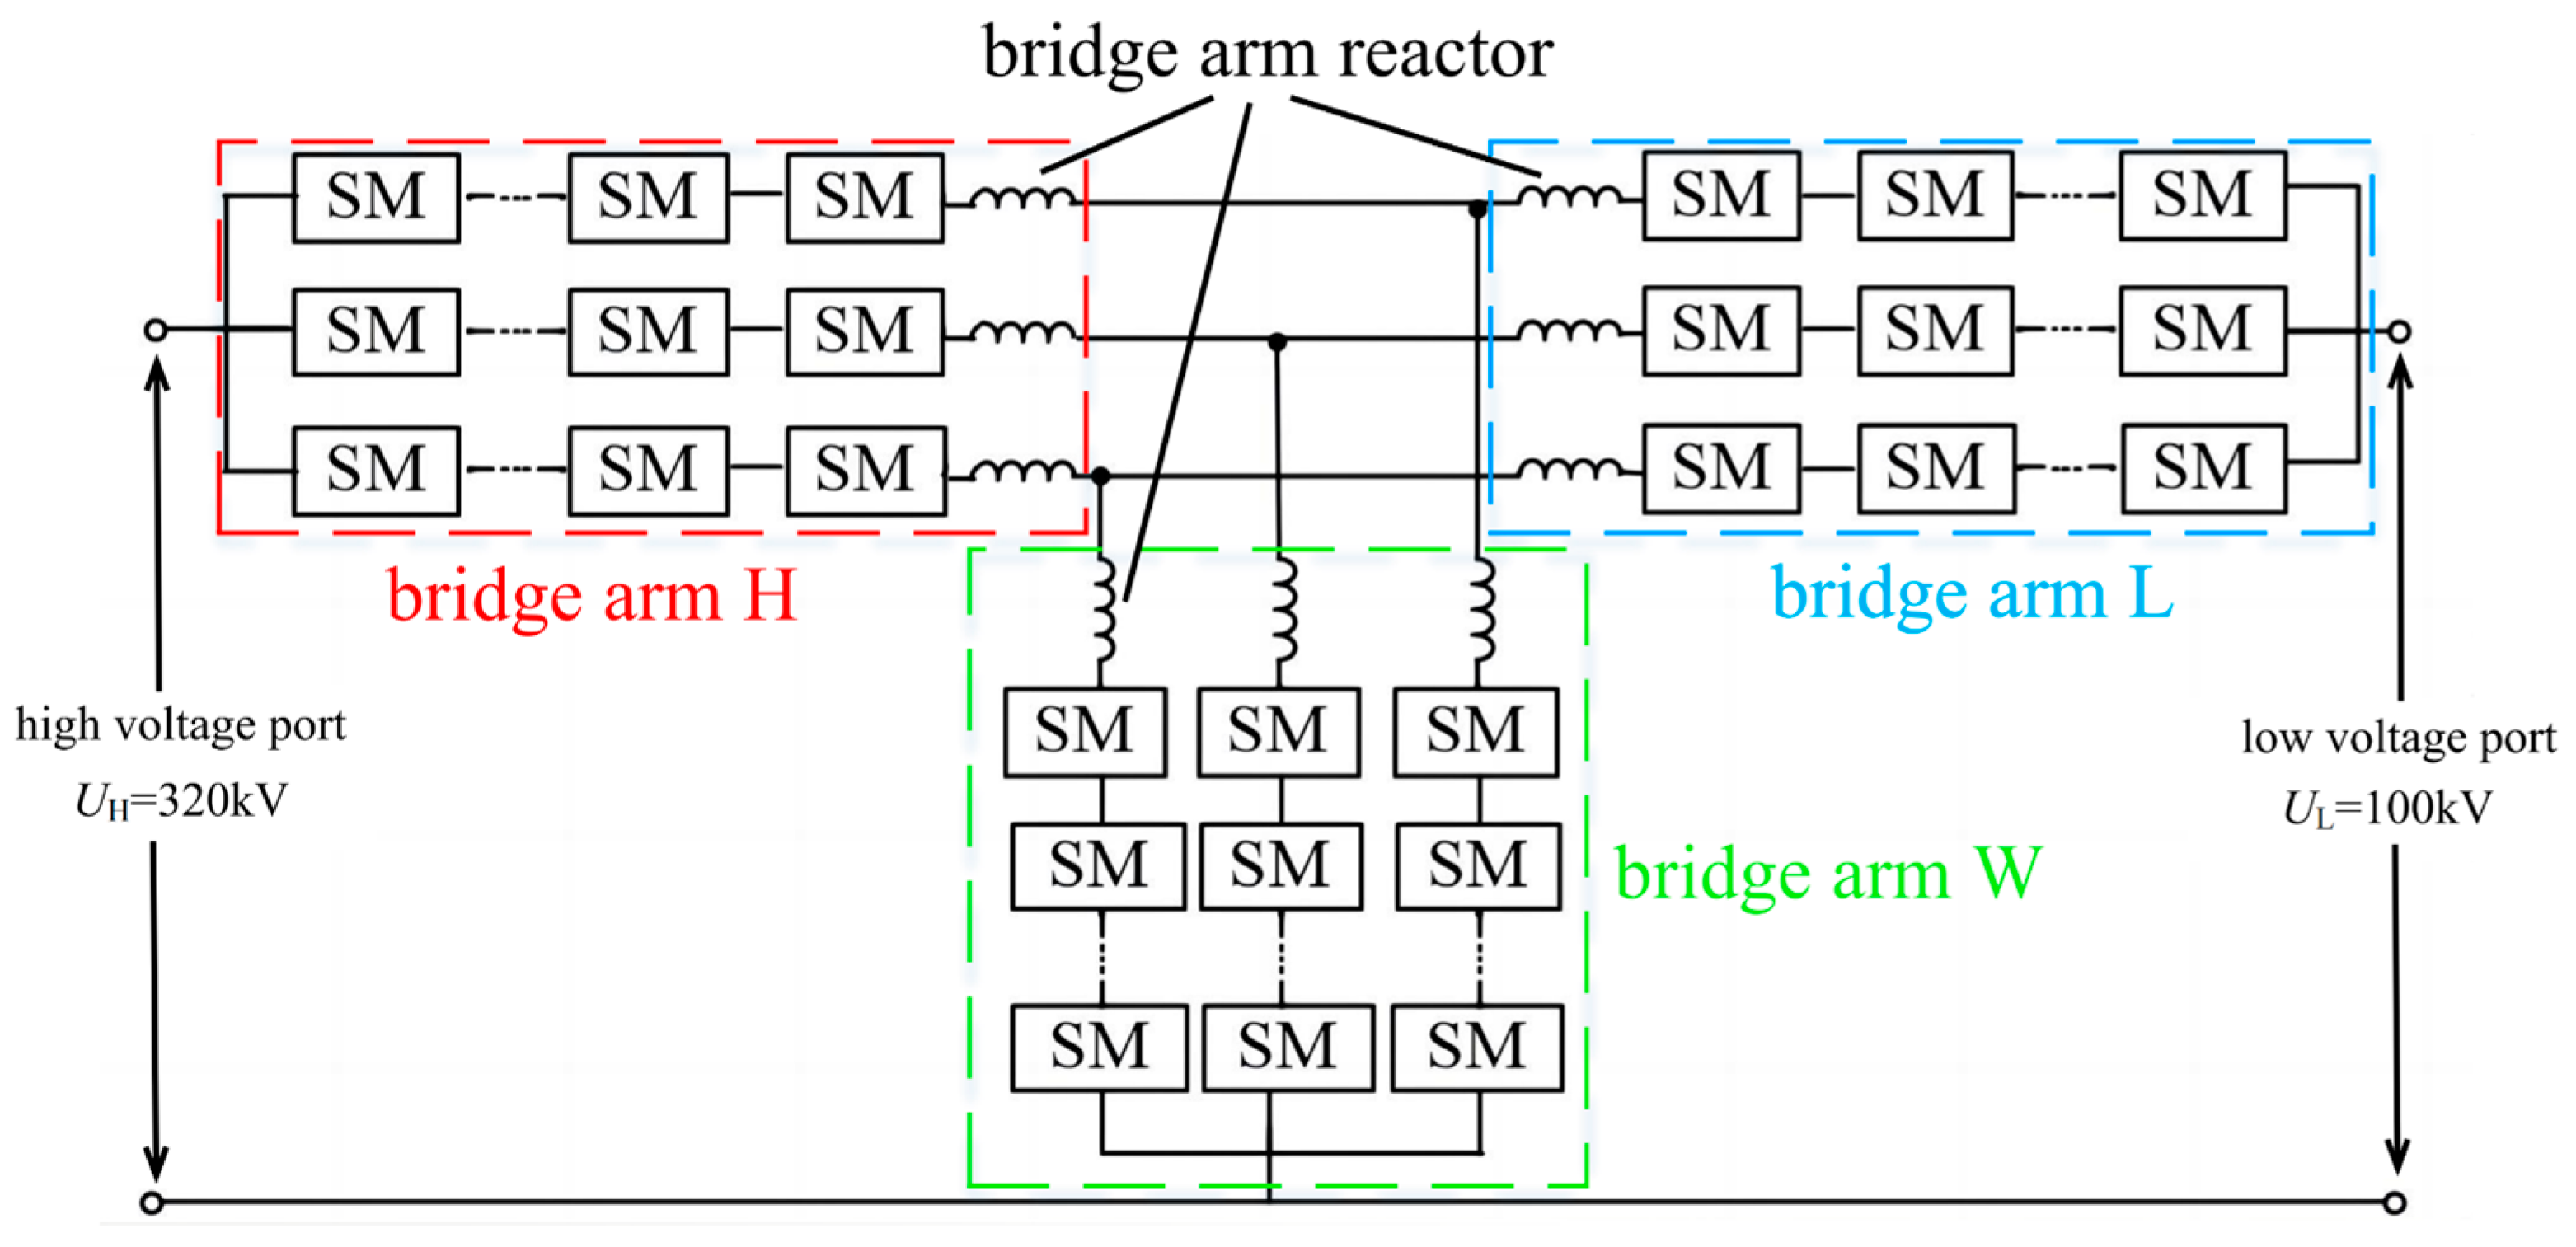
The single-pole topology of the DC transformer is shown in Figure 2. The topology consisted of three identical phase units, each comprising three bridge arms, designated as H, L, and W. Each bridge arm is composed of a certain number of sub-modules and a BAR. The sub-modules could have been configured as half-bridge or full-bridge sub-modules based on the system design [32].
The capacity of the DC transformer was 1000 MW bipolar, and the electrical parameters of the BARs are shown in Table 1. It can be seen that the inductance design values for the H, L, and W BARs were 5 mH each. The spatial requirements of the HVDC converter were influenced not only by the SM modules but also by the magnetic field distribution of the BARs. During the design of the reactors, special attention was paid to ensuring that the BARs did not cause electromagnetic interference with the sub-module protection switches, control boards, or other components in the valve assembly. The electromagnetic interference resistance of the sub-modules met the highest test level requirements specified by the GB/T 17626.8-2006 electromagnetic compatibility standards [33].

2. Establishment of Finite Element Models for Two Shapes of BARs

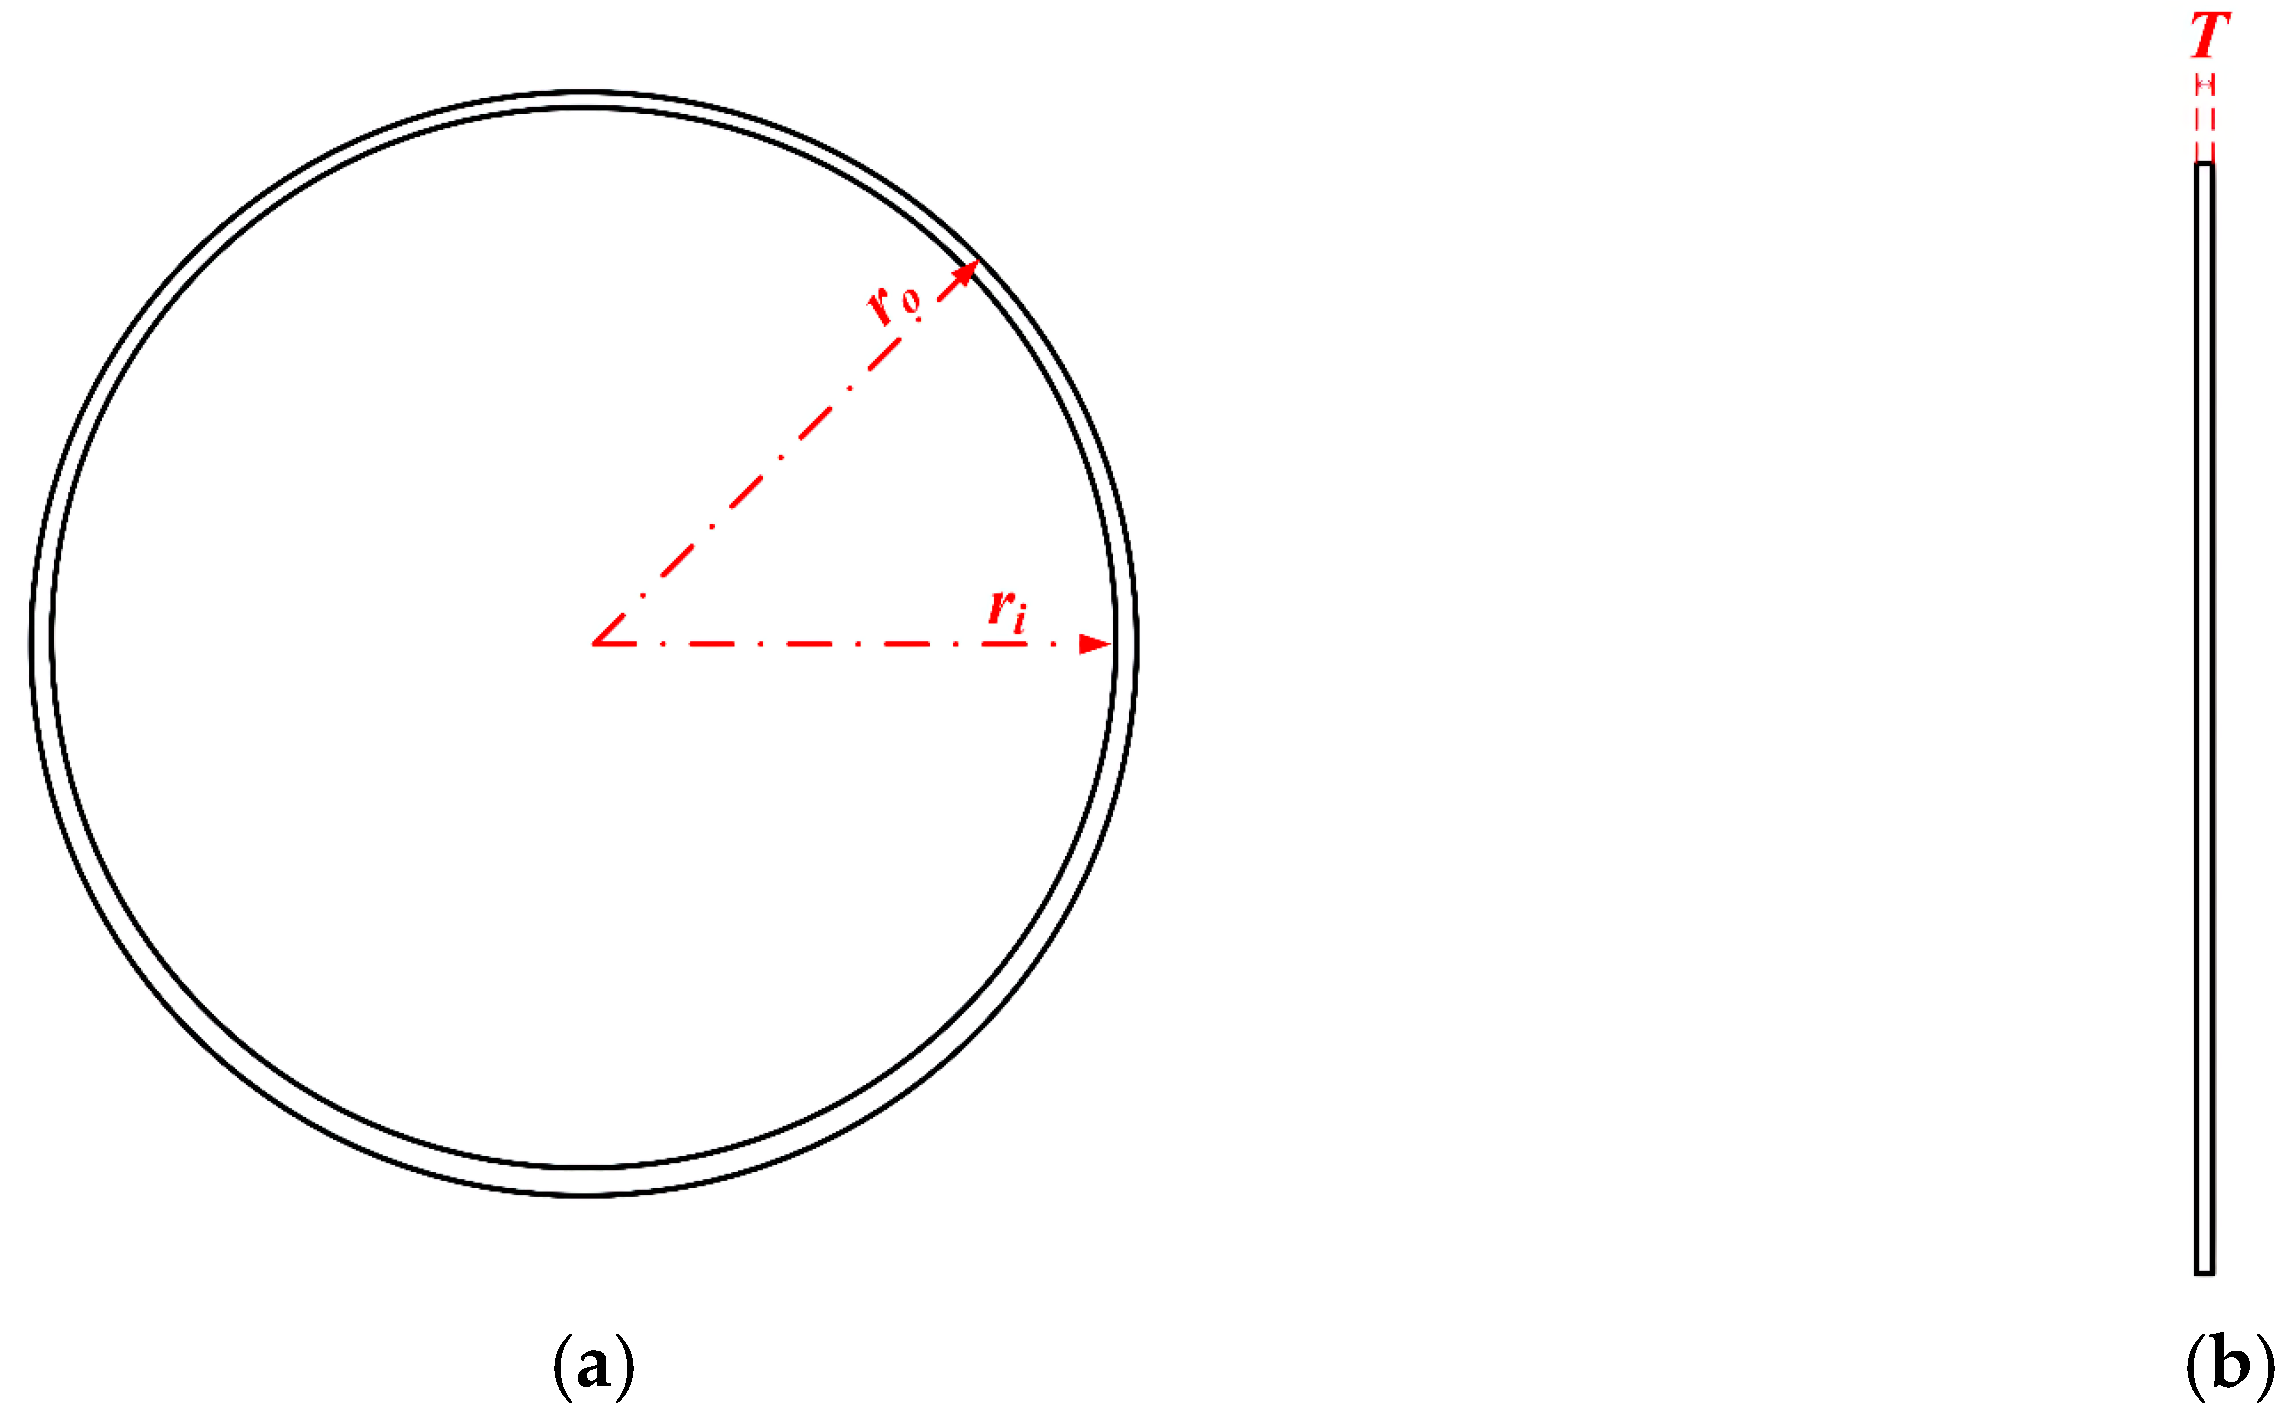
First, it was essential to determine the geometric parameters and inductance values of the two different shapes of BARs. Both shapes were constructed from winding coils, as shown in Figure 3, with a total number of N. The front and top views of the CABAR, along with their parameter annotations, are depicted in Figure 4a,b, respectively. Similarly, the front and top views of the AABAR, along with their parameter annotations, are shown in Figure 4c,d. The specific parameter values involved in Figure 3 and Figure 4 are detailed in Table 2.
Finite element models of the magnetic fields for the two different shapes of BARs—AABAR and CABAR—were established. Both reactors had an inductance value of 5 mH. The finite element simulation model for CABAR is relatively well-established; thus, this paper focuses primarily on the establishment of the finite element model for the AABAR [34].
The AABAR consisted of 111 winding turns. Due to the use of flat wire winding transposition technology, which involves multiple small-section copper flat wires arranged in a transposed structure with each small flat copper wire undergoing an equal number of transpositions along the total length, the skin effect was minimized. Therefore, the impact of the skin effect has not been considered in this study. The winding was treated as a coil domain in the solution domain, assuming that the current was uniformly distributed within the coil domain (this practice had a minimal impact on the magnetic field calculation results but simplified the computation process).
From symmetry analysis, it is known that within the calculation region of a single winding turn, there are two boundary conditions, as shown in Equation (1) (ideal magnetic conductor boundary and magnetic insulation boundary):
n × H = 0 n × A = 0
where n is the normal vector of the surface, H is the magnetic field strength, and A is the vector magnetic potential.
Ideal magnetic conductor boundary conditions were used for the rectangular surface boundaries in the calculation region, while magnetic insulation boundary conditions were used for all other surfaces.
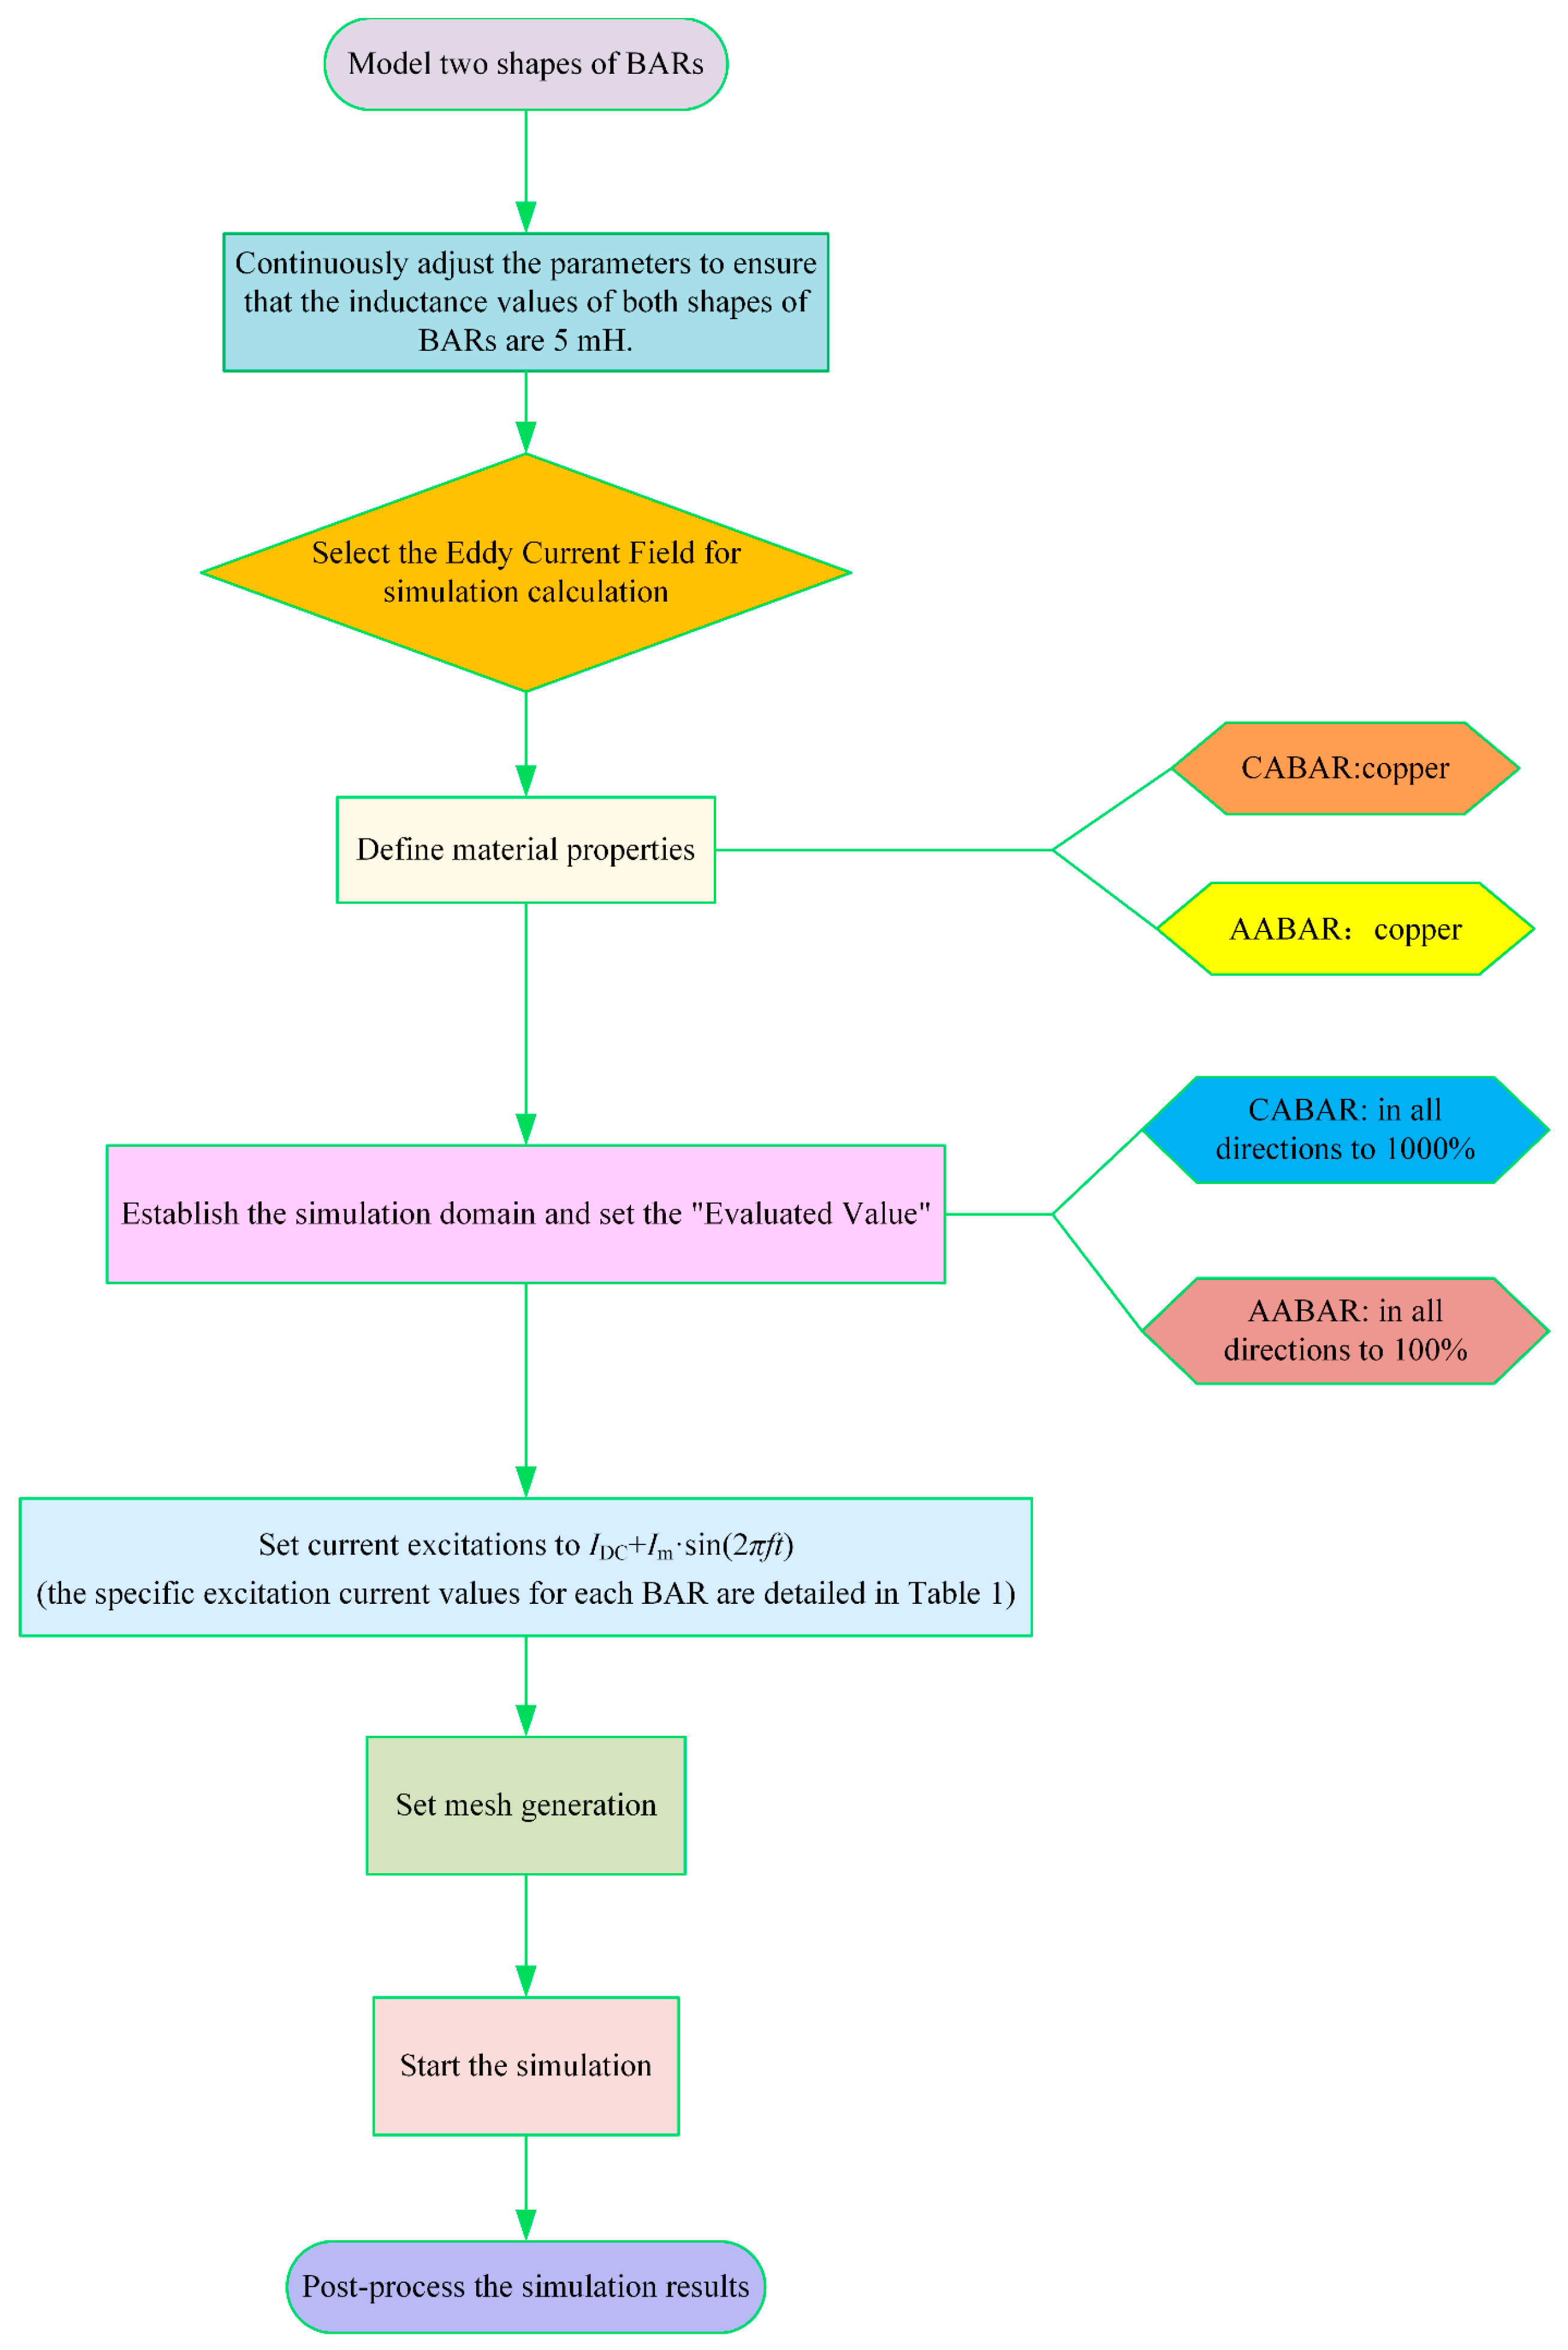
Under the excitation parameters of the H-BAR shown in Table 1, the magnetic flux density cloud diagram of the vertical section of the two symmetrical winding turns obtained through finite element simulation is shown in Figure 5. It can be seen that the magnetic field energy is mainly concentrated inside the AABAR, with relatively low magnetic flux density outside the reactor. Therefore, the outer boundary of the solution domain for the finite element model does not need to be selected too far. The finite element simulation steps for the two BARs are detailed in Figure 6.

3. Comparative Analysis of Magnetic Field Characteristics of Two Types of BARs

This chapter describes the simulation study of the two types of BARs based on the parameters of the H-BAR shown in Table 1. The steady-state excitation current was set to −0.43 kA (DC) + 2.47 kA (AC, 200 Hz).

3.1. Calculation and Analysis of Magnetic Flux Density Distribution for Different Shapes of Air-Core Reactors

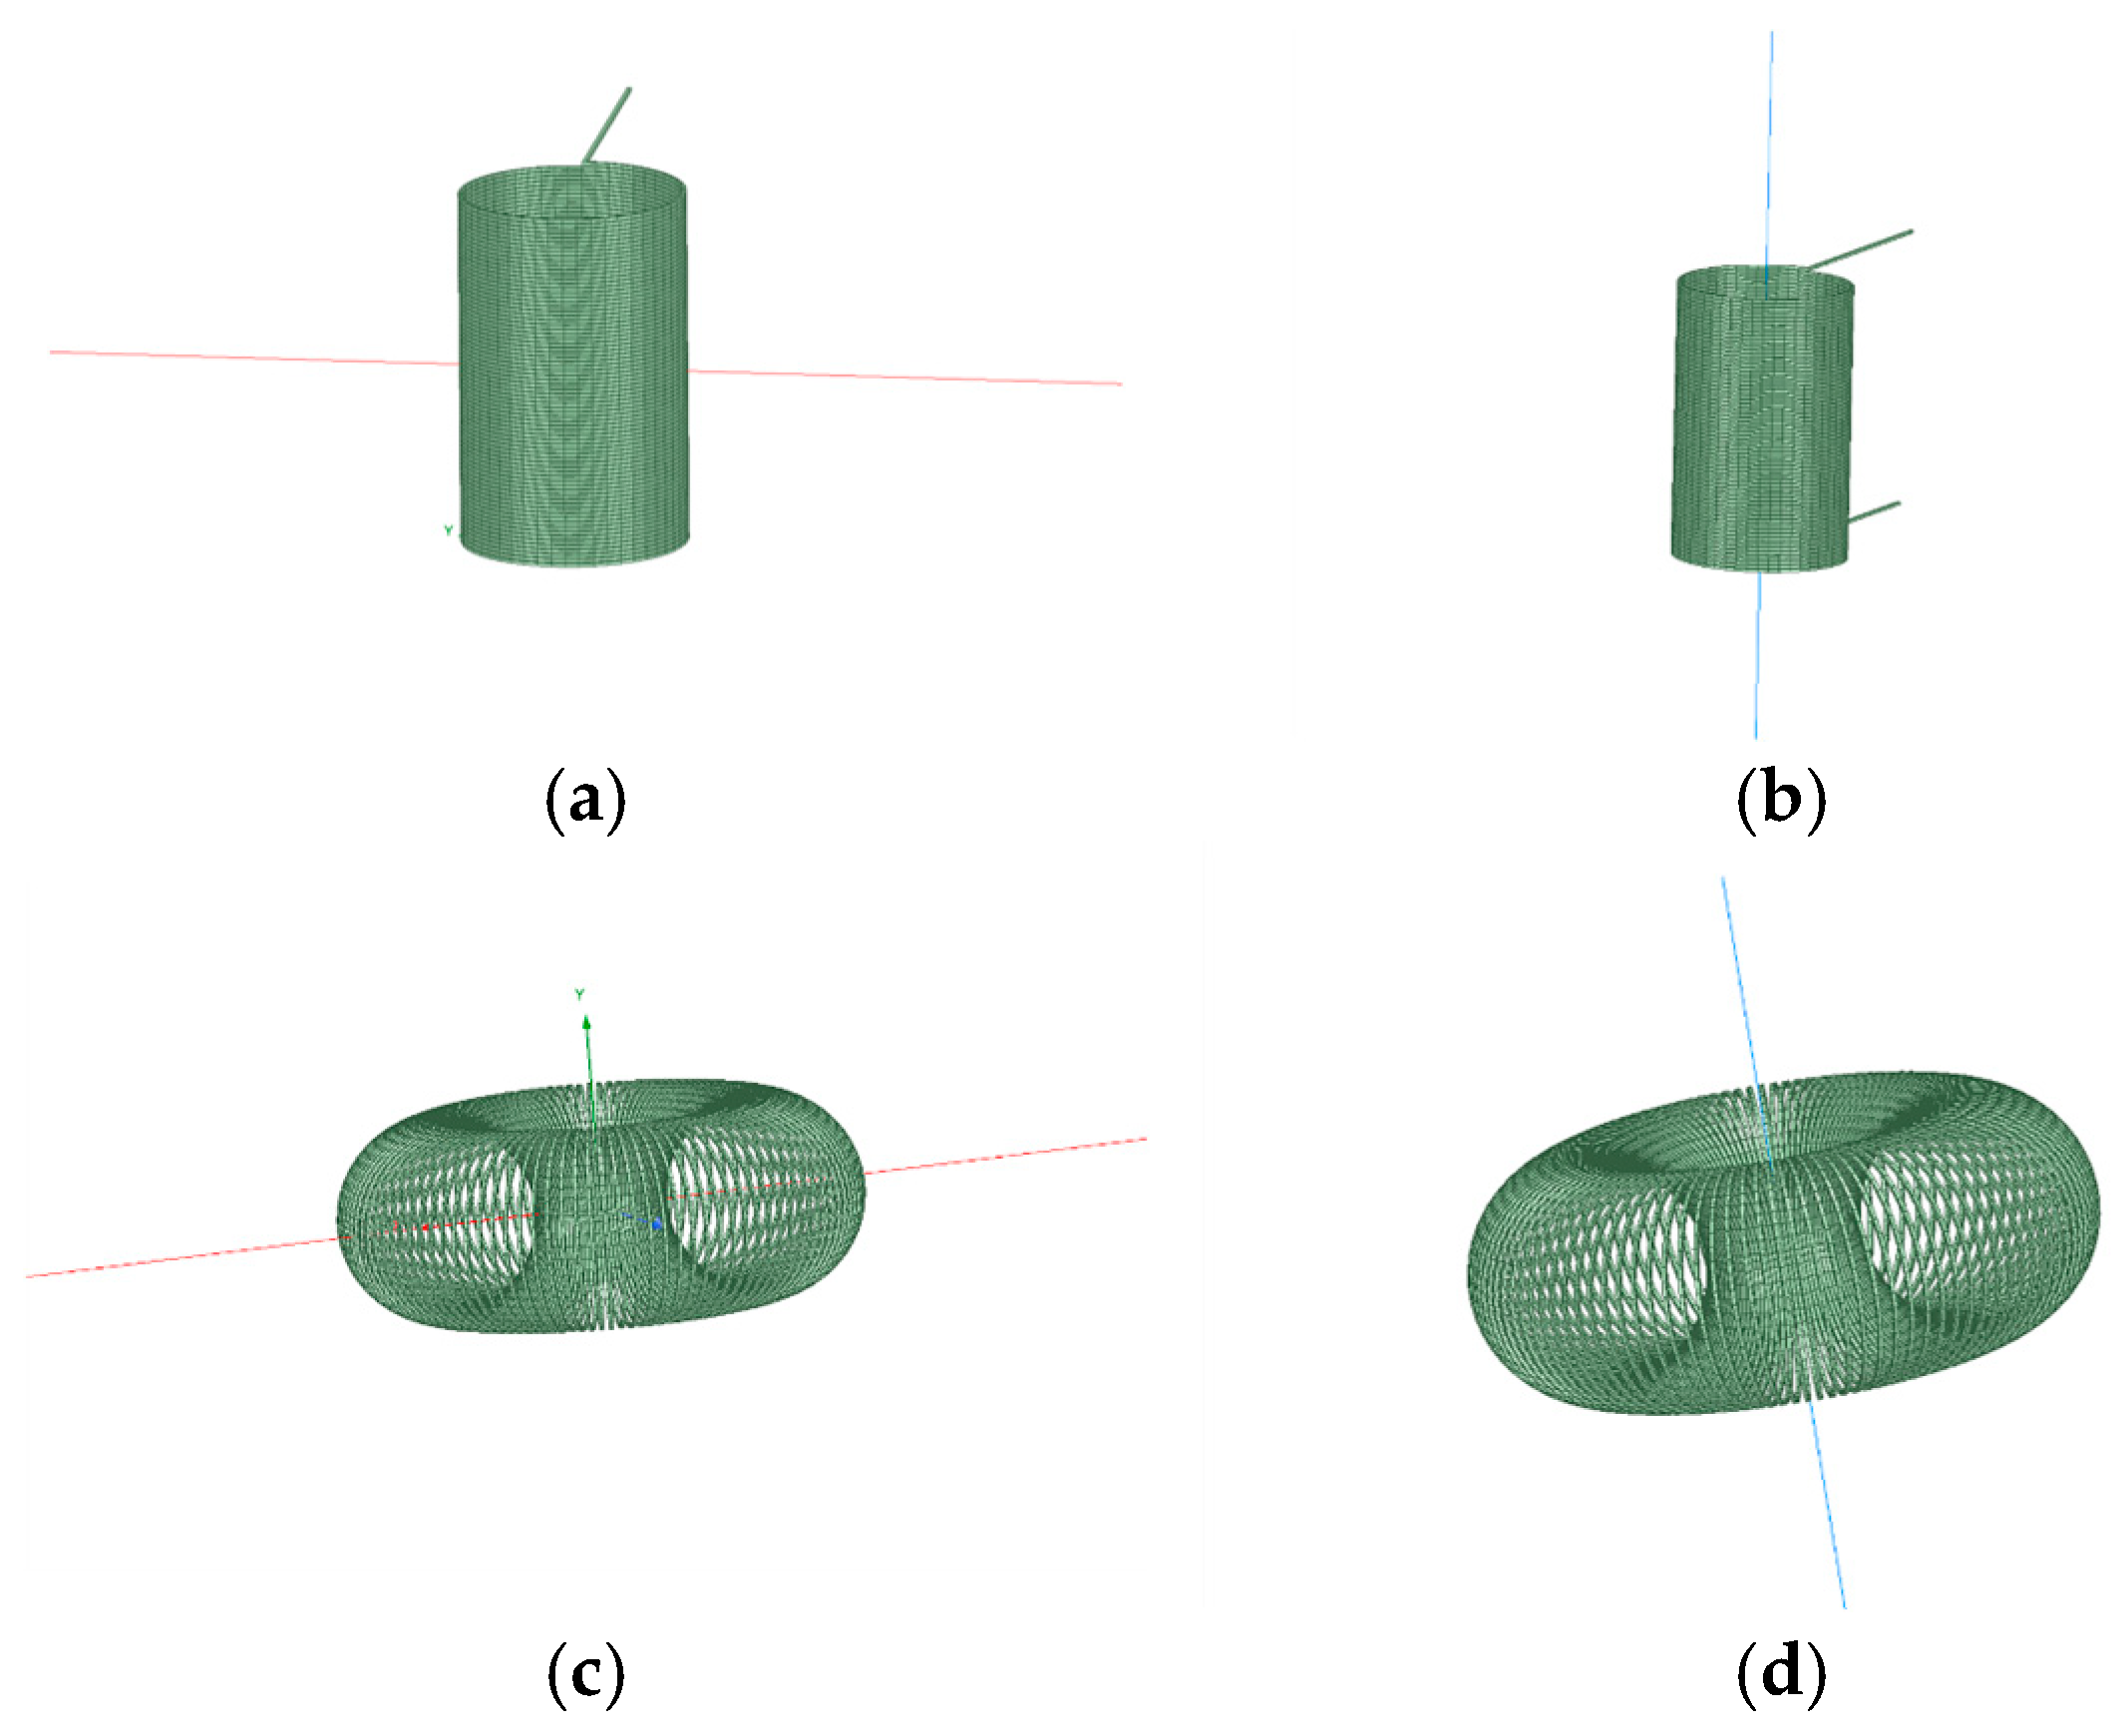
In the simulation models, for the CABAR, the transverse and longitudinal data were extracted along the transverse central axis and the longitudinal central axis of the cylinder, respectively. For the AABAR, the transverse data were extracted along the axis with the maximum width, and the longitudinal data were extracted along the axis with the minimum height, as shown in Figure 7.
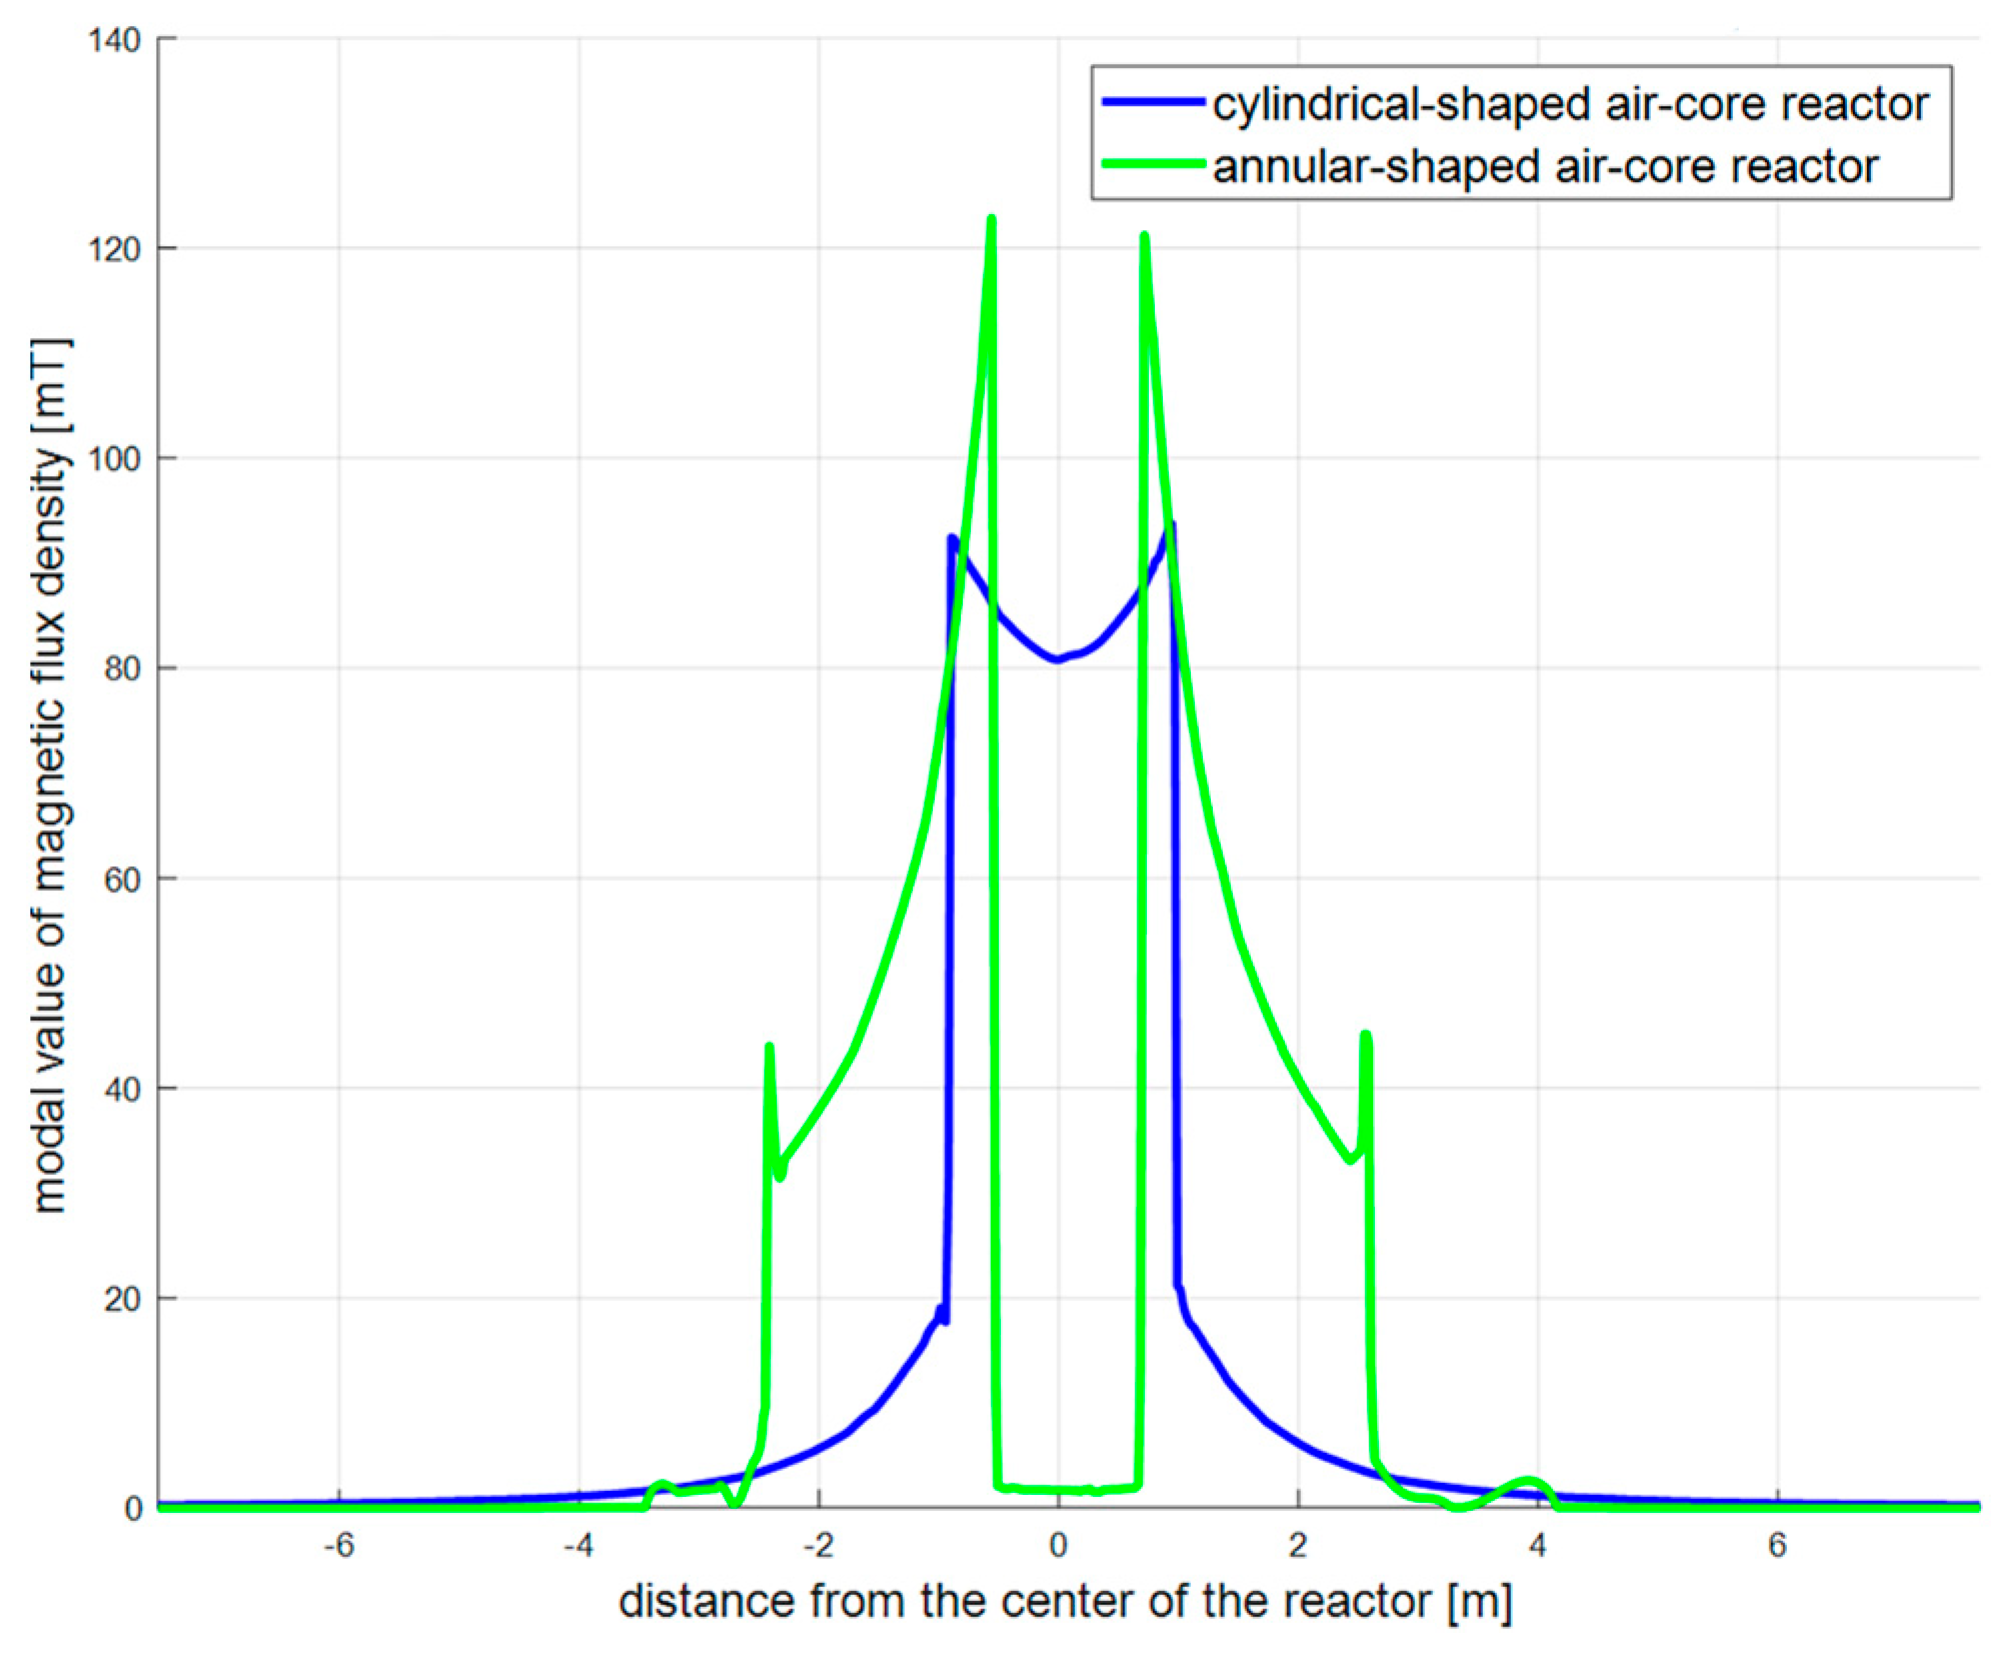
The MC defined in this case refers to the distance required to avoid inducing excessive circulating currents in large metallic structures or closed loops formed by conductors, corresponding to the distance at which the magnetic flux density decreases from its maximum value to 2 mT. Using the transverse and longitudinal lines in Figure 7 as data extraction tools, the simulation results of the magnetic flux density magnitude for the two shapes of BARs are shown in Figure 8.
It can be seen that when the excitation current flows through, the flux density attenuation rate of the AABAR is significantly higher than that of the CABAR, as shown in Figure 9. The magnetic clearance for the AABAR is 0.25 m, while that for the CABAR is 2.5 m, representing a 90% reduction in magnetic clearance for the AABAR compared with the CABAR, according to the same magnetic field standards.

3.2. Calculation and Analysis of the Radiation Range of Different Shapes of BARs

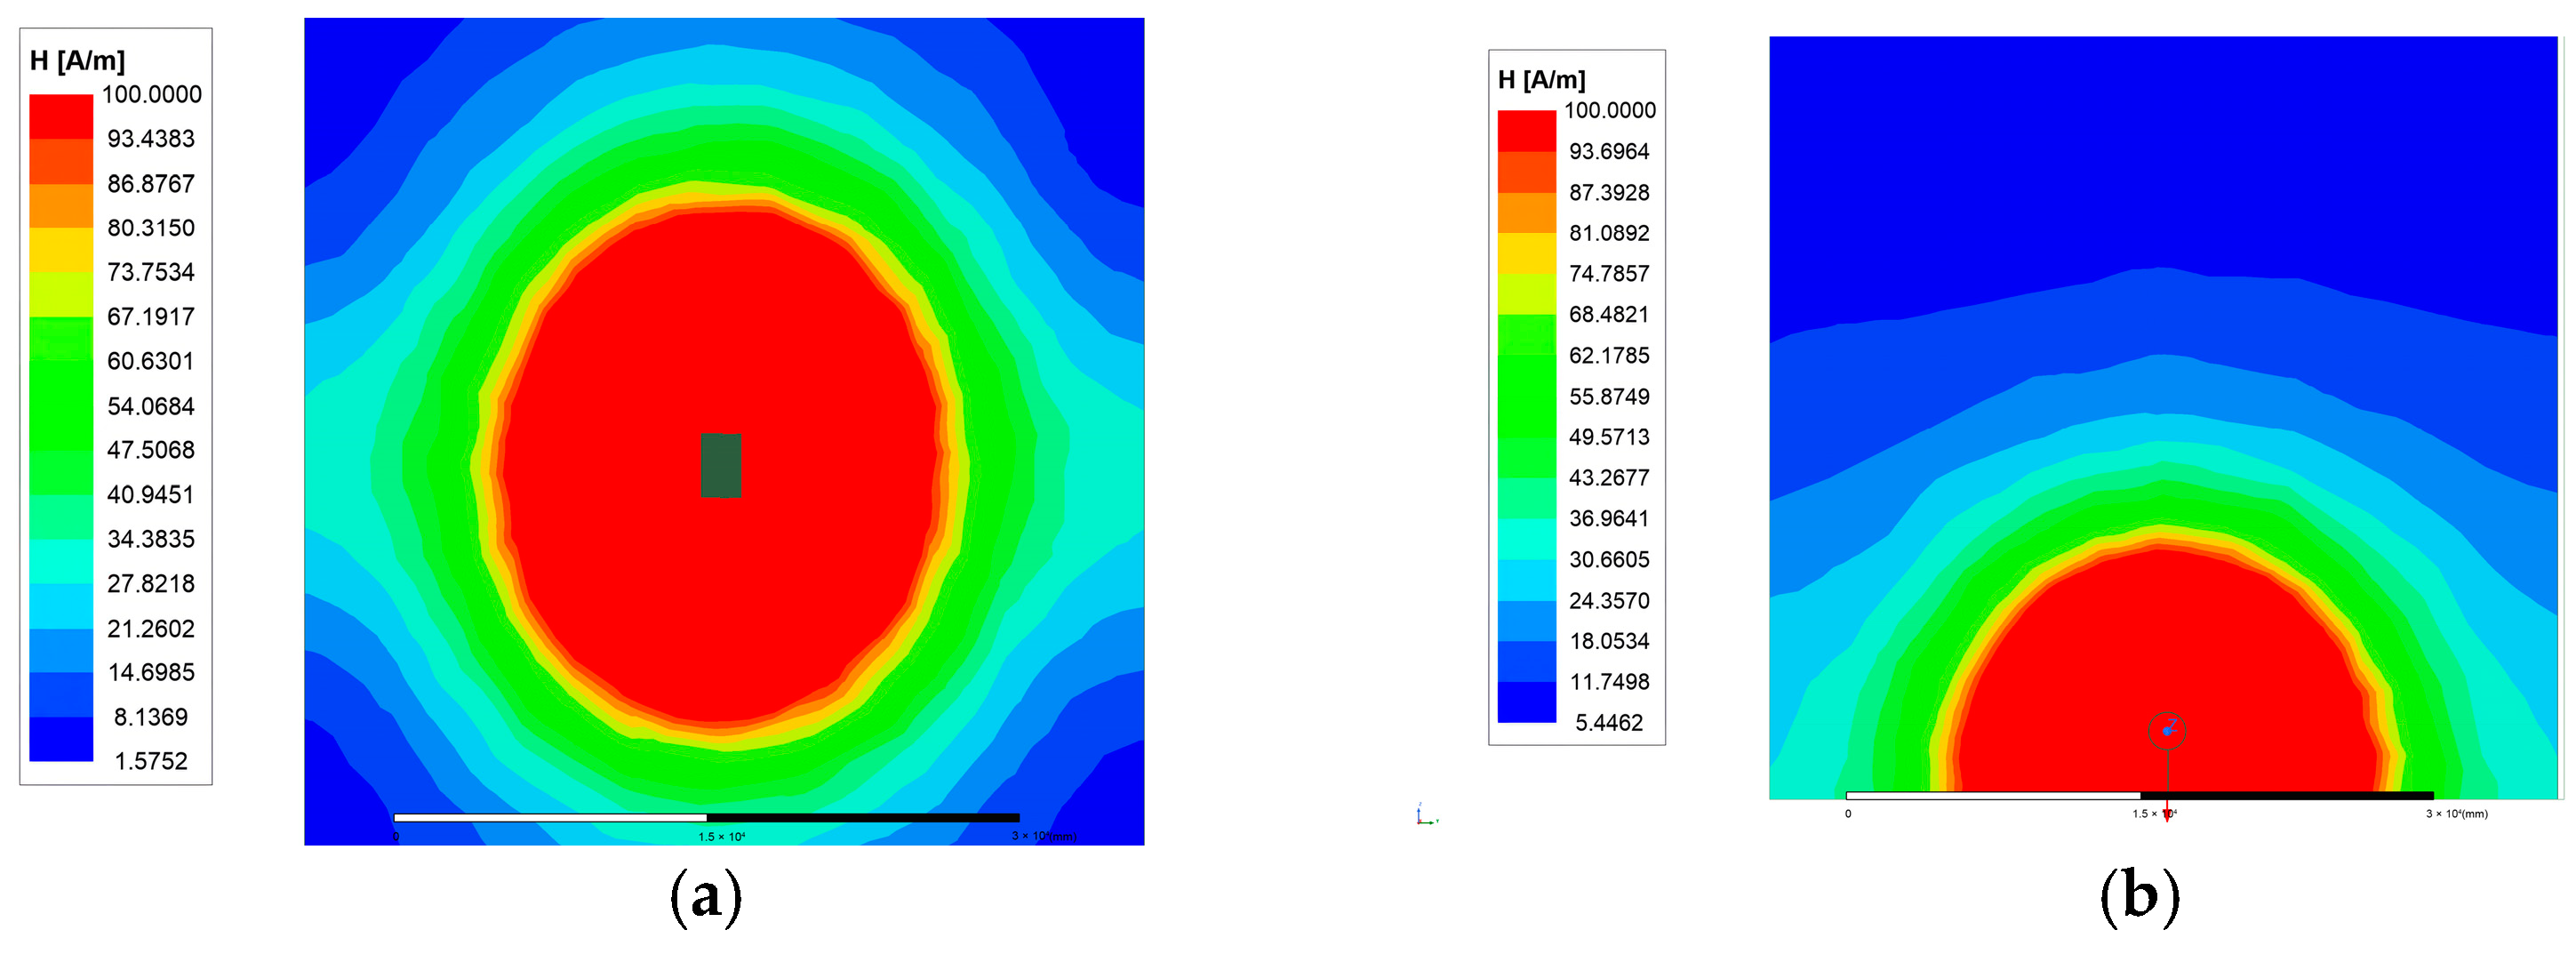
The radiation requirements were set according to the highest test level specified in the GB/T 17626 electromagnetic compatibility standard: 100 A/m. The radiation ranges for the two different shapes of BARs were calculated, as shown in Figure 10.
The simulation results indicate that under the same radiation requirements, the AABAR meets the electromagnetic radiation requirements within a circular area with a radius of approximately 3.2 m. In contrast, the CABAR meets the requirements within an elliptical area with a major axis of 11 m and a minor axis of 10 m. The radiation area of the AABAR is approximately 90.69% smaller than that of the CABAR.

3.3. Calculation and Analysis of Magnetic Field Energy Distribution of Different Shapes of BARs

Magnetic field energy density ω is an important physical quantity that describes the energy stored in a magnetic field per unit volume. Its relationship with other physical quantities in the magnetic field is shown in Equation (2):
ω = 1 2 B H
where ω is the magnetic field energy density, B is the magnetic flux density, and H is the magnetic field intensity.
In addition to studying the magnetic flux density and magnetic field strength distributions of the two BARs, examining their magnetic field energy density distributions is also essential for a comprehensive comparison of the magnetic field characteristics of the AABAR and CABAR. Using the data extraction lines in Figure 7, the distribution of magnetic field energy along the transverse and longitudinal central axes was calculated, as shown in Figure 11.
The simulation results show that the peak magnetic field energy density of the CABAR is 1.74 kJ/m3, while that of the AABAR is 3 kJ/m3. The internal magnetic field energy of the AABAR is higher in the transverse direction than that of the CABAR, but the external magnetic field energy radiation range of the AABAR is smaller. The transverse and longitudinal magnetic field energy influence ranges for the CABAR are 5 m and 4 m, respectively, while those for the AABAR are 3 m and 2.5 m, respectively. Compared with the CABAR, the energy influence range of the AABAR is reduced by 40% and 37.5% in the transverse and longitudinal directions, respectively.

4. Conclusions

In the study of the DC transformer using the H bridge arm reactor as an example, the following conclusions were drawn:
(1)
The magnetic clearance of the AABAR was reduced by 90% compared with the CABAR. This indicates that the AABAR structure can significantly reduce the magnetic clearance of large-capacity BARs.
(2)
The internal energy of the AABAR was found to be higher than that of the CABAR; however, the energy influence range of the AABAR was reduced by 40% and 37.5% in the transverse and longitudinal directions, respectively, compared with the CABAR. This demonstrates that the AABAR has lower external magnetic field energy leakage and a smaller influence distance than the CABAR.
(3)
Under the same radiation standard (100 A/m), the radiation area of the AABAR was reduced by approximately 90.69% compared with the CABAR. This shows that under the same radiation standard, the radiation range of the CABAR far exceeds that of the AABAR, making the AABAR structure advantageous in terms of radiation protection design.
In summary, compared with the CABAR, the AABAR exhibits a faster attenuation rate of external magnetic flux density and magnetic field energy with increasing distance from the reactor body, and significantly reduces the radiation range under the same radiation standards. Additionally, for applications using multiple AABARs, the absence of mutual inductance allows a reduction in the spatial distance between reactors, further minimizing the actual usage space of the reactors. Therefore, the novel AABAR design can optimize the surrounding magnetic field environment and reduce the magnetic clearance range, particularly in applications requiring high spatial efficiency and low electromagnetic interference, such as the studied DC transformer system or offshore wind power platforms. This can significantly reduce the actual space occupied by large-capacity air-core reactors.

Author Contributions

Conceptualization, T.J. and Z.Y.; Software, T.J.; Validation, T.J. and Z.Y.; Writing—original draft, T.J.; Writing—review & editing, T.J. and Z.Y. All authors have read and agreed to the published version of the manuscript.

Funding

This research received no external funding.

Data Availability Statement

The data presented in this study are available from the corresponding authors upon reasonable request.

Conflicts of Interest

The authors declare no conflicts of interest.

References

  1. Xiao, D.; Chen, B.; Li, Z.; Fu, X.; Wei, C.; Lu, D. Editorial: Control, operation, and trading strategies for intermittent renewable energy in smart grids. Front. Energy Res. 2023, 11, 1139238. [Google Scholar] [CrossRef]
  2. Youngquist, R.C.; Ihlefeld, C.M.; Starr, S.O. A DC transformer. IEEE Trans. Power Electron. 2014, 29, 42–44. [Google Scholar] [CrossRef]
  3. Cao, Y.; Ngo, K.; Dong, D. A scalable electronic-embedded transformer, a new concept toward ultra-high-frequency high-power transformer in DC–DC converters. IEEE Trans. Power Electron. 2023, 38, 9278–9293. [Google Scholar] [CrossRef]
  4. Purgat, P.; Prakoso, R.A.; Mackay, L.; Qin, Z.; Ramirez-Elizondo, L.; Bauer, P. A partially rated DC-DC converter for power flow control in meshed LVDC distribution grids. In Proceedings of the 2018 IEEE Applied Power Electronics Conference and Exposition (APEC), San Antonio, TX, USA, 4–8 March 2018; pp. 1591–1596. [Google Scholar] [CrossRef]
  5. Denniston, N.; Massoud, A.M.; Ahmed, S.; Enjeti, P.N. Multiple-module high-gain high-voltage DC–DC transformers for offshore wind energy systems. IEEE Trans. Ind. Electron. 2011, 58, 1877–1886. [Google Scholar] [CrossRef]
  6. Sessa, S.D.; Chiarelli, A.; L’Abbate, A.; Benato, R. Availability assessment methods for HVDC systems: A review. In Proceedings of the 2019 AEIT HVDC International Conference (AEIT HVDC), Florence, Italy, 9–10 May 2019; pp. 1–6. [Google Scholar] [CrossRef]
  7. Li, R.; Yu, L.; Xu, L.; Adam, G.P. Coordinated control of parallel DR-HVDC and MMC-HVDC systems for offshore wind energy transmission. IEEE J. Emerging Sel. Top. Power Electron. 2020, 8, 2572–2582. [Google Scholar] [CrossRef]
  8. Yuan, J.; Zhang, W.; Sun, Y.; Zhou, H.; Liu, J.; Liu, Y.; Tan, J. Topological design of a novel magnetically saturated bridge arm reactor with controllable inductance. In Proceedings of the 2024 IEEE 21st Biennial Conference on Electromagnetic Field Computation (CEFC), Jeju, Republic of Korea, 2–5 June 2024; pp. 1–2. [Google Scholar] [CrossRef]
  9. Zhao, W.; Xie, N.; Zhao, B.; Xie, Z.; Yue, J.; Xie, W. Finite element simulation analysis of three-phase bridge arm reactor of modular multilevel converter. In Proceedings of the 2020 IEEE 4th Conference on Energy Internet and Energy System Integration (EI2), Wuhan, China, 30 October–1 November 2020; pp. 2920–2924. [Google Scholar] [CrossRef]
  10. Yang, J.; Zhang, W.; Zou, L.; Wang, Y.; Sun, Y.; Feng, Y. Research on distribution and shielding of spatial magnetic field of a DC air core smoothing reactor. Energies 2019, 12, 937. [Google Scholar] [CrossRef]
  11. Yuan, F.; Yuan, Z.; Chen, L.; Wang, Y.; Liu, J.; He, J.; Pan, Y. Thermal and electromagnetic combined optimization design of dry type air core reactor. Energies 2017, 10, 1989. [Google Scholar] [CrossRef]
  12. Zhu, J.; Yang, J.; Zhao, L. Study on checking calculation of temperature field based on body winding and metal accessories for bridge arm reactor. In Proceedings of the 2022 IEEE International Conference on High Voltage Engineering and Applications (ICHVE), Chongqing, China, 25–29 September 2022; pp. 1–4. [Google Scholar] [CrossRef]
  13. Wang, Y.; Chen, X.; Pan, Z.; Lu, H.; Wen, X.; Jiang, Z.; Chen, B.; Chen, T. Theoretical and experimental evaluation of the temperature distribution in a dry type air core smoothing reactor of HVDC station. Energies 2017, 10, 623. [Google Scholar] [CrossRef]
  14. Wu, J.; Chang, Z.; Zhang, H.; Zhang, M.; Peng, Y.; Liao, J.; Huang, Q. Thermal simulation and analysis of dry-type air-core reactors based on multi-physics coupling. Energies 2023, 16, 7456. [Google Scholar] [CrossRef]
  15. Chen, C.; Shang, X.; Chen, P.; Zhou, G.; Liang, Y.; Yang, J.; Ma, L.; Qi, L. Simulation analysis on heating of metal structure in leakage magnetic field of arm inductor in converter station. In Proceedings of the 2021 International Conference on Advanced Electrical Equipment and Reliable Operation (AEERO), Beijing, China, 15–17 October 2021; pp. 1–4. [Google Scholar] [CrossRef]
  16. Burke, P.; Lau, T.; Fawzi, T. Shielding of air core-reactors. IEEE Trans. Magn. 1983, 19, 2070–2072. [Google Scholar] [CrossRef]
  17. IEEE. IEEE Standard for Requirements, Terminology, and Test Code for Dry-Type Air-Core Series-Connected Reactors; IEEE Std C57.16-2011 (Revision of IEEE Std C57.16-1996); IEEE: Piscataway, NJ, USA, 2012; pp. 1–127. [Google Scholar] [CrossRef]
  18. IEEE. IEEE Approved Draft Guide for Recommended Electrical Clearances and Insulation Levels in Air Insulated Electrical Power Substations; IEEE P1427/D5.1; IEEE: Piscataway, NJ, USA, 2020; pp. 1–49. [Google Scholar]
  19. Cui, Z.; Qian, G.; Liu, Y.; Hao, C.; Yang, C.; Liu, Y. Study on electromagnetic shielding of the distributed current sensor for dry-type air-core reactor. In Proceedings of the 2020 IEEE International Conference on High Voltage Engineering and Application (ICHVE), Beijing, China, 6–10 September 2020; pp. 1–4. [Google Scholar] [CrossRef]
  20. Zhou, K.; Li, Z.; Gong, W.; Zhao, S.; Wen, C.; Song, Y. Influence of magnetic field generated by air core reactors in SVC-based substation and an optimal suppression method based on fuzzy comprehensive evaluation. IEEE Trans. Electromagn. Compat. 2020, 62, 1961–1970. [Google Scholar] [CrossRef]
  21. Sun, X.; Guo, L.; Zou, C.; Cheng, J.; Zhu, J.; Zhang, W.; Huang, K.; Zhao, L.; Rao, H.; Lv, J. Design selection research on LCC-MMC multiterminal hybrid HVDC dry-type air-core reactors. In Proceedings of the 2020 IEEE International Conference on High Voltage Engineering and Application (ICHVE), Beijing, China, 6–10 September 2020; pp. 1–4. [Google Scholar] [CrossRef]
  22. Zhao, C.; Jiang, S.; Xie, Y.; Wang, L.; Zhang, D.; Ma, Y.; Zhang, Y.; Li, M. Analysis of fault and protection strategy of a converter station in MMC-HVDC system. Sustainability 2022, 14, 5446. [Google Scholar] [CrossRef]
  23. Zhu, Y.; Li, Y. Optimal configuration of smoothing reactors and current limiting reactors in LCC-MMC HVDC network. In Proceedings of the 2022 IEEE 5th International Electrical and Energy Conference (CIEEC), Nanjing, China, 27–29 May 2022; pp. 1540–1544. [Google Scholar] [CrossRef]
  24. Kontos, E.; Bauer, P. Reactor design for DC fault ride-through in MMC-based multi-terminal HVDC grids. In Proceedings of the 2016 IEEE 2nd Annual Southern Power Electronics Conference (SPEC), Auckland, New Zealand, 5–8 December 2016; pp. 1–6. [Google Scholar] [CrossRef]
  25. Solak, K.; Rebizant, W.; Mieske, F. Development and validation of the high-voltage direct-current modular multilevel converter (HVDC-MMC) model for converter transformer protection studies. Sensors 2024, 24, 3126. [Google Scholar] [CrossRef] [PubMed]
  26. Xu, X.; Wang, D.; Zhou, X.; Tao, L. Suppression of negative sequence current on HVDC modular multilevel converters in offshore wind power. J. Mar. Sci. Eng. 2024, 12, 383. [Google Scholar] [CrossRef]
  27. Hu, W.; Li, F. Improved topology and control strategies for DC converters in wind power full DC systems. Electronics 2024, 13, 400. [Google Scholar] [CrossRef]
  28. Jiang, Q.; Tao, Y.; Li, B.; Liu, T.; Chen, Z.; Blaabjerg, F.; Wang, P. Joint limiting control strategy based on virtual impedance shaping for suppressing DC fault current and arm current in MMC-HVDC systems. J. Mod. Power Syst. Clean Energy 2023, 11, 2003–2014. [Google Scholar] [CrossRef]
  29. Sun, S.; Wang, S.; Sun, Y.; Yu, X.; Yin, R.; Hu, H.; Ding, H.; Li, J.; Cao, L. Analysis of the hybrid-MMC-HVDC short-circuit current under MMC AC system symmetrical fault. In Proceedings of the 2021 3rd Asia Energy and Electrical Engineering Symposium (AEEES), Chengdu, China, 26–29 March 2021; pp. 41–45. [Google Scholar] [CrossRef]
  30. Huang, X.; Liu, Q.; Pan, X.; Jin, S.; Chen, H.; Wang, X.; Zhao, F.; Chen, L.; Zhang, H. An equivalent modeling method for wideband magnetic radiation interference of power-electronic equipment. Electronics 2024, 13, 2481. [Google Scholar] [CrossRef]
  31. Liang, J.; Zhou, Z.; Xiao, Z.; Liu, H.; Lu, Z.; Su, L.; Guo, W.; Deng, X. Analysis of electromagnetic interference for anti-medal UHF RFID temperature tag in high power electronic equipment. Electronics 2023, 12, 3577. [Google Scholar] [CrossRef]
  32. Yang, J.; He, Z.; Pang, H.; Tang, G. The hybrid-cascaded DC–DC converters suitable for HVdc applications. IEEE Trans. Power Electron. 2015, 30, 5358–5363. [Google Scholar] [CrossRef]
  33. GB/T 17626.8-2006; Electromagnetic Compatibility—Testing and Measurement Techniques—Power Frequency Magnetic Field Immunity Test. Standards Press of China: Beijing, China, 2006.
  34. Gao, L.; Ji, S.; Zhu, L.; Yang, H.; Zhang, F.; Li, J.; Hui, S. Vibration and noise characteristics of air-core reactor used in HVDC converter stations. IEEE Trans. Power Deliv. 2022, 37, 1068–1077. [Google Scholar] [CrossRef]
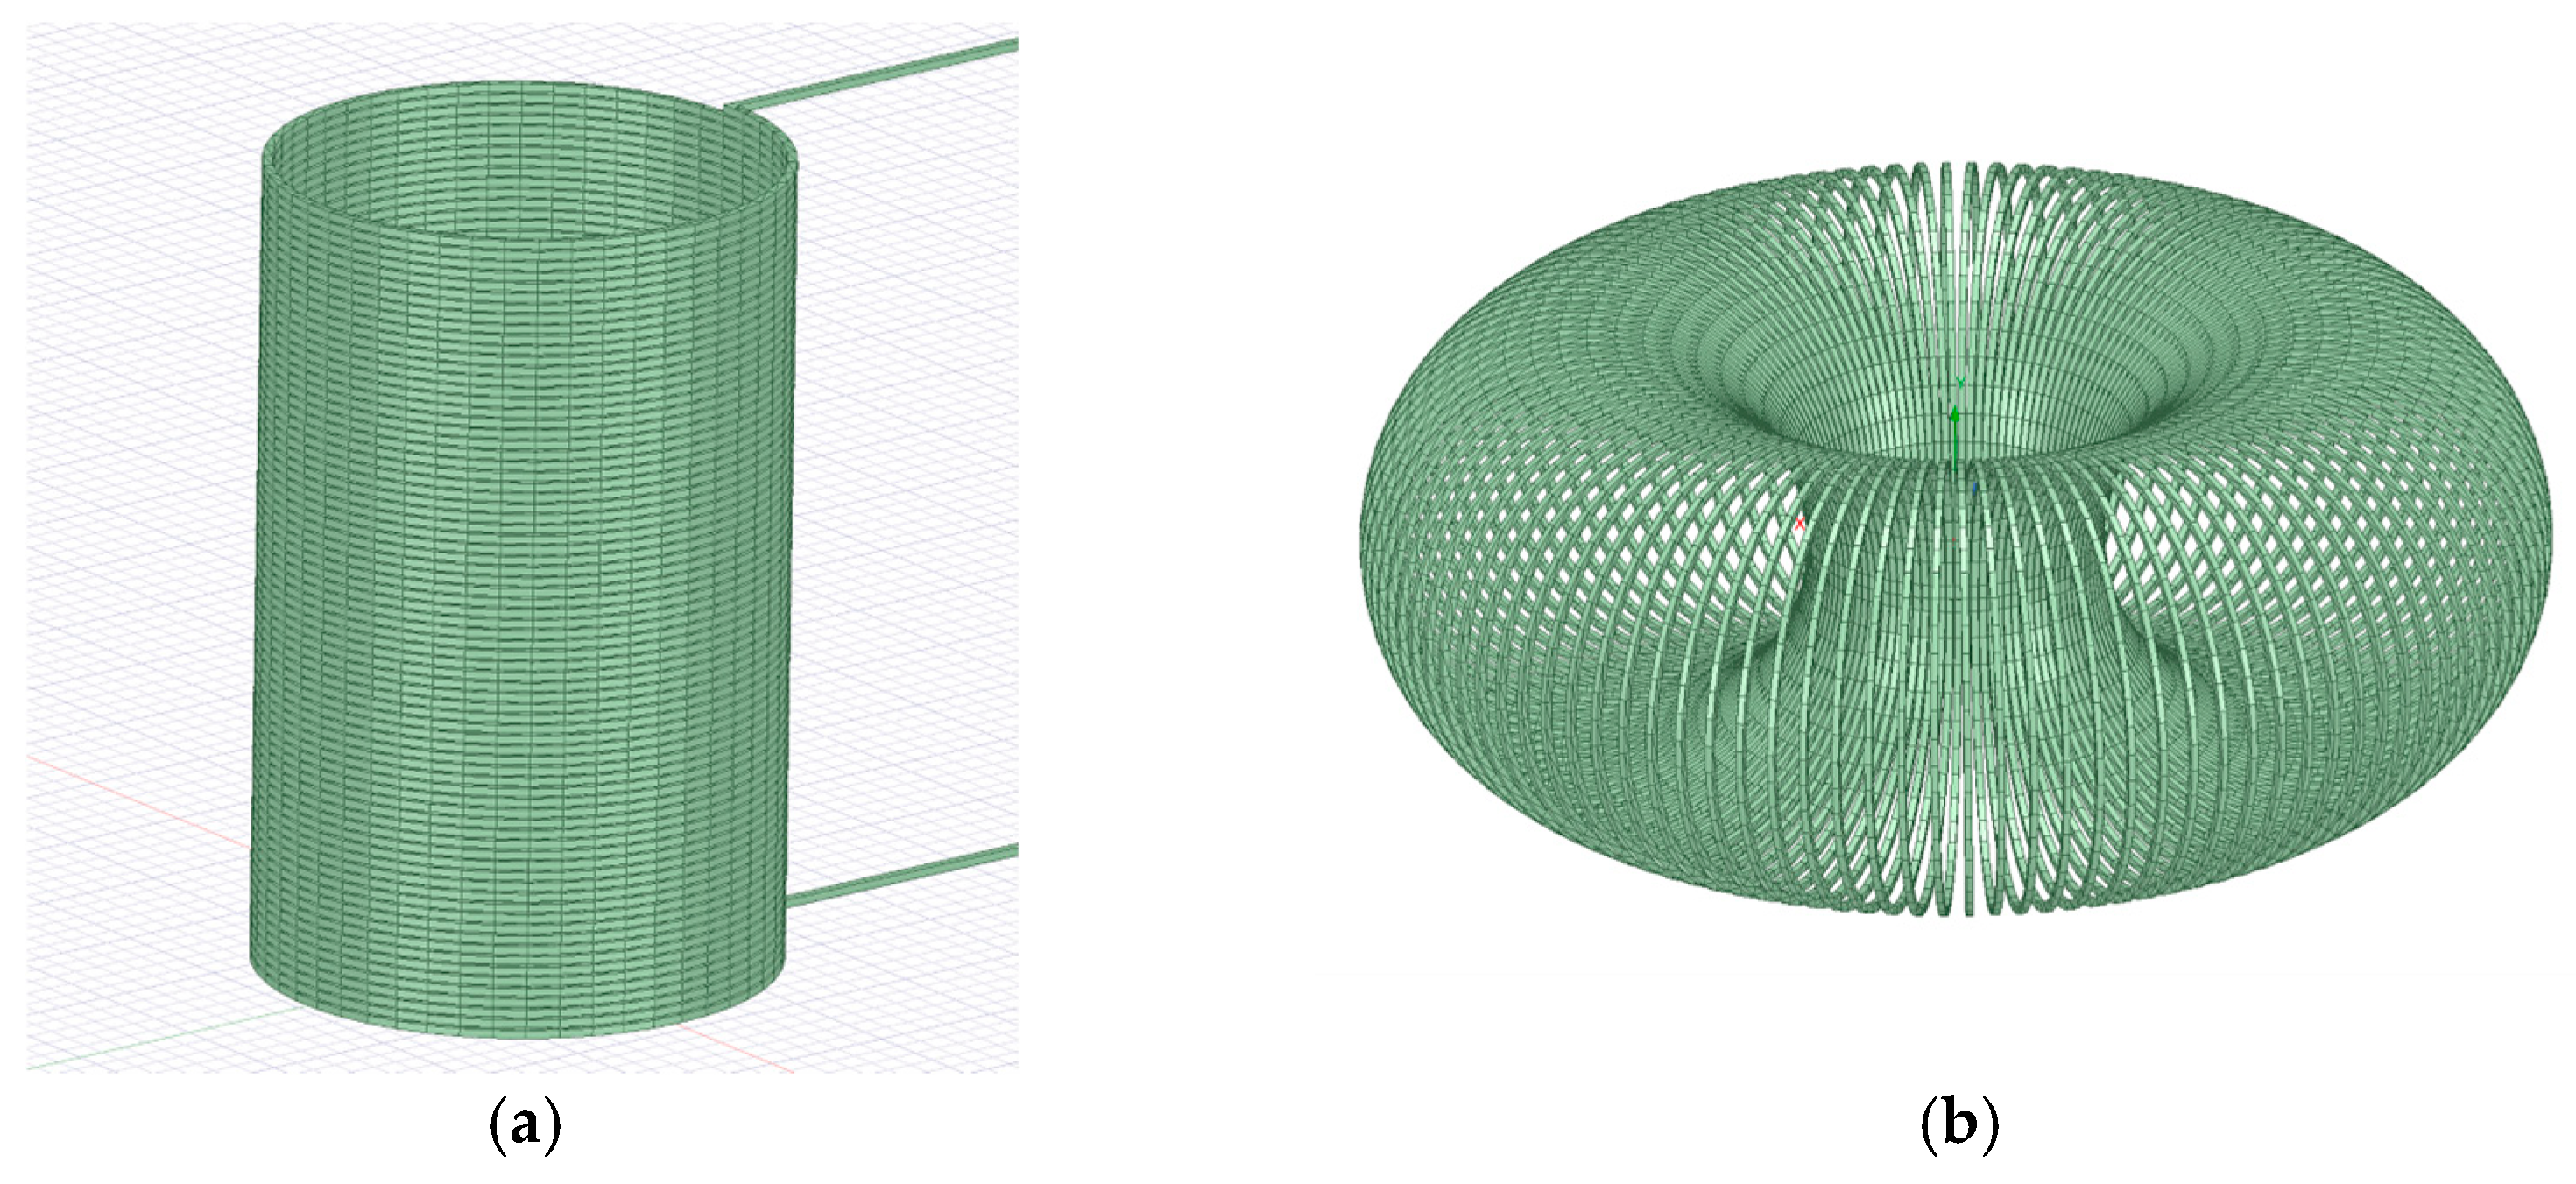
Figure 1. 3D models of two shapes of bridge arm air-core reactor: (a) CABAR; (b) AABAR.
Energies 17 04652 g001
Figure 2. Topology of the DC transformer and the configuration positions of the BARs.
Energies 17 04652 g002
Figure 3. Schematic diagrams of the winding coils constituting the two BARs: (a) front view of the winding coil; (b) side view of the winding coil.
Energies 17 04652 g003
Figure 4. Geometric views and parameter annotations of the CABAR and AABAR: (a) front view and parameter annotations of the CABAR; (b) top view and parameter annotations of the CABAR; (c) front view and parameter annotations of the AABAR; (d) top view and parameter annotations of the AABAR. r i is the inner radius of the winding coils constituting both shapes of BARs; r o is the outer radius of the winding coils constituting both shapes of BARs; T is the thickness of the winding coil; R i is the inner radius of both shapes of BARs; R o is the outer radius of both shapes of BARs; H is the height of both shapes of BARs; d is the inter-turn distance of the CABAR; d min is the minimum inter-turn distance of the AABAR; d max is the maximum inter-turn distance of the AABAR.
Energies 17 04652 g004
Figure 5. Vertical section schematic and magnetic field physical quantities diagram of the AABAR: (a) vertical section schematic; (b) magnetic flux density cloud diagram of the vertical section; (c) 3D distribution diagram of magnetic field energy.
Energies 17 04652 g005
Figure 6. Simulation process flowchart of two shapes of BARs.
Energies 17 04652 g006
Figure 7. Schematic diagram of data extraction lines: (a) transverse data extraction line for CABAR; (b) longitudinal data extraction line for CABAR; (c) transverse data extraction line for AABAR; (d) longitudinal data extraction line for AABAR.
Energies 17 04652 g007
Figure 8. Simulation results of magnetic flux density magnitudes for the two types of air-core reactors: (a) transverse magnetic flux density of CABAR; (b) transverse magnetic flux density of AABAR; (c) longitudinal magnetic flux density of CABAR; (d) longitudinal magnetic flux density of AABAR.
Energies 17 04652 g008aEnergies 17 04652 g008b
Figure 9. Comparison of flux densities of reactors with different shapes.
Energies 17 04652 g009
Figure 10. Simulation cloud diagrams of the radiation range for the two shapes of BARs: (a) front view of the radiation range of CABAR; (b) front view of the radiation range of AABAR; (c) top view of the radiation range of CABAR; (d) top view of the radiation range of AABAR.
Energies 17 04652 g010aEnergies 17 04652 g010b
Figure 11. Simulation results of magnetic field energy density for the two shapes of air-core reactors: (a) transverse magnetic field energy density of CABAR; (b) transverse magnetic field energy density of AABAR; (c) longitudinal magnetic field energy density of CABAR; (d) longitudinal magnetic field energy density of AABAR.
Energies 17 04652 g011aEnergies 17 04652 g011b
Table 1. Electrical parameters of the BARs.
NameValue/RequirementRemarks
Bridge arm HDesign inductance value of the H-BAR5 mH
Steady-state current−0.43 kA (DC) + 2.47 kA (AC)AC component frequency is 200 Hz
Transient-state current6 kA
7.13 kA/ms and 0.21 kA/ms
Peak fault
Current rise rate and decline rate
Steady-state voltage22 kVPeak value
Transient-state voltage12 kVPeak value
Bridge arm WDesign inductance value of the W-BAR5 mH
Steady-state current1.27 kA (DC) + 2.49 kA (AC)AC component frequency is 200 Hz
Transient-state current5 kA
4.03 kA/ms and 0.25 kA/ms
Peak fault
Current rise rate and decline rate
Steady-state voltage22 kVPeak value
Transient-state voltage50 kVPeak value
Bridge arm LDesign inductance value of the L-BAR5 mH
Steady-state current−0.85 kA (DC) + 0.06 kA (AC)AC component frequency is 200 Hz
Transient-state current1.08 kA
0.23 kA/ms and 0.34 kA/ms
Peak fault
Current rise rate and decline rate
Steady-state voltage1.7 kVPeak value
Transient-state voltage30 kVPeak value
Table 2. Comparison of parameters for two types of BARs.
L (mH)N r i (mm) r o (mm) T (mm) R i (m) R o (m) H (m) d (mm) d min (mm) d max (mm)
CABAR575950980350.950.983.0355//
AABAR5111950980350.62.561.96/4.29141.67
Disclaimer/Publisher’s Note: The statements, opinions and data contained in all publications are solely those of the individual author(s) and contributor(s) and not of MDPI and/or the editor(s). MDPI and/or the editor(s) disclaim responsibility for any injury to people or property resulting from any ideas, methods, instructions or products referred to in the content.