Impacts of Natural Gas Pipeline Congestion on the Integrated Gas–Electricity Market in Peru
Abstract
1. Introduction
- A comprehensive quantitative and qualitative analysis of the interdependencies between electricity systems and natural gas (NG) networks within an integrated market context. This involves examining how these two energy systems interact and influence each other, identifying key factors that affect their performance and reliability.
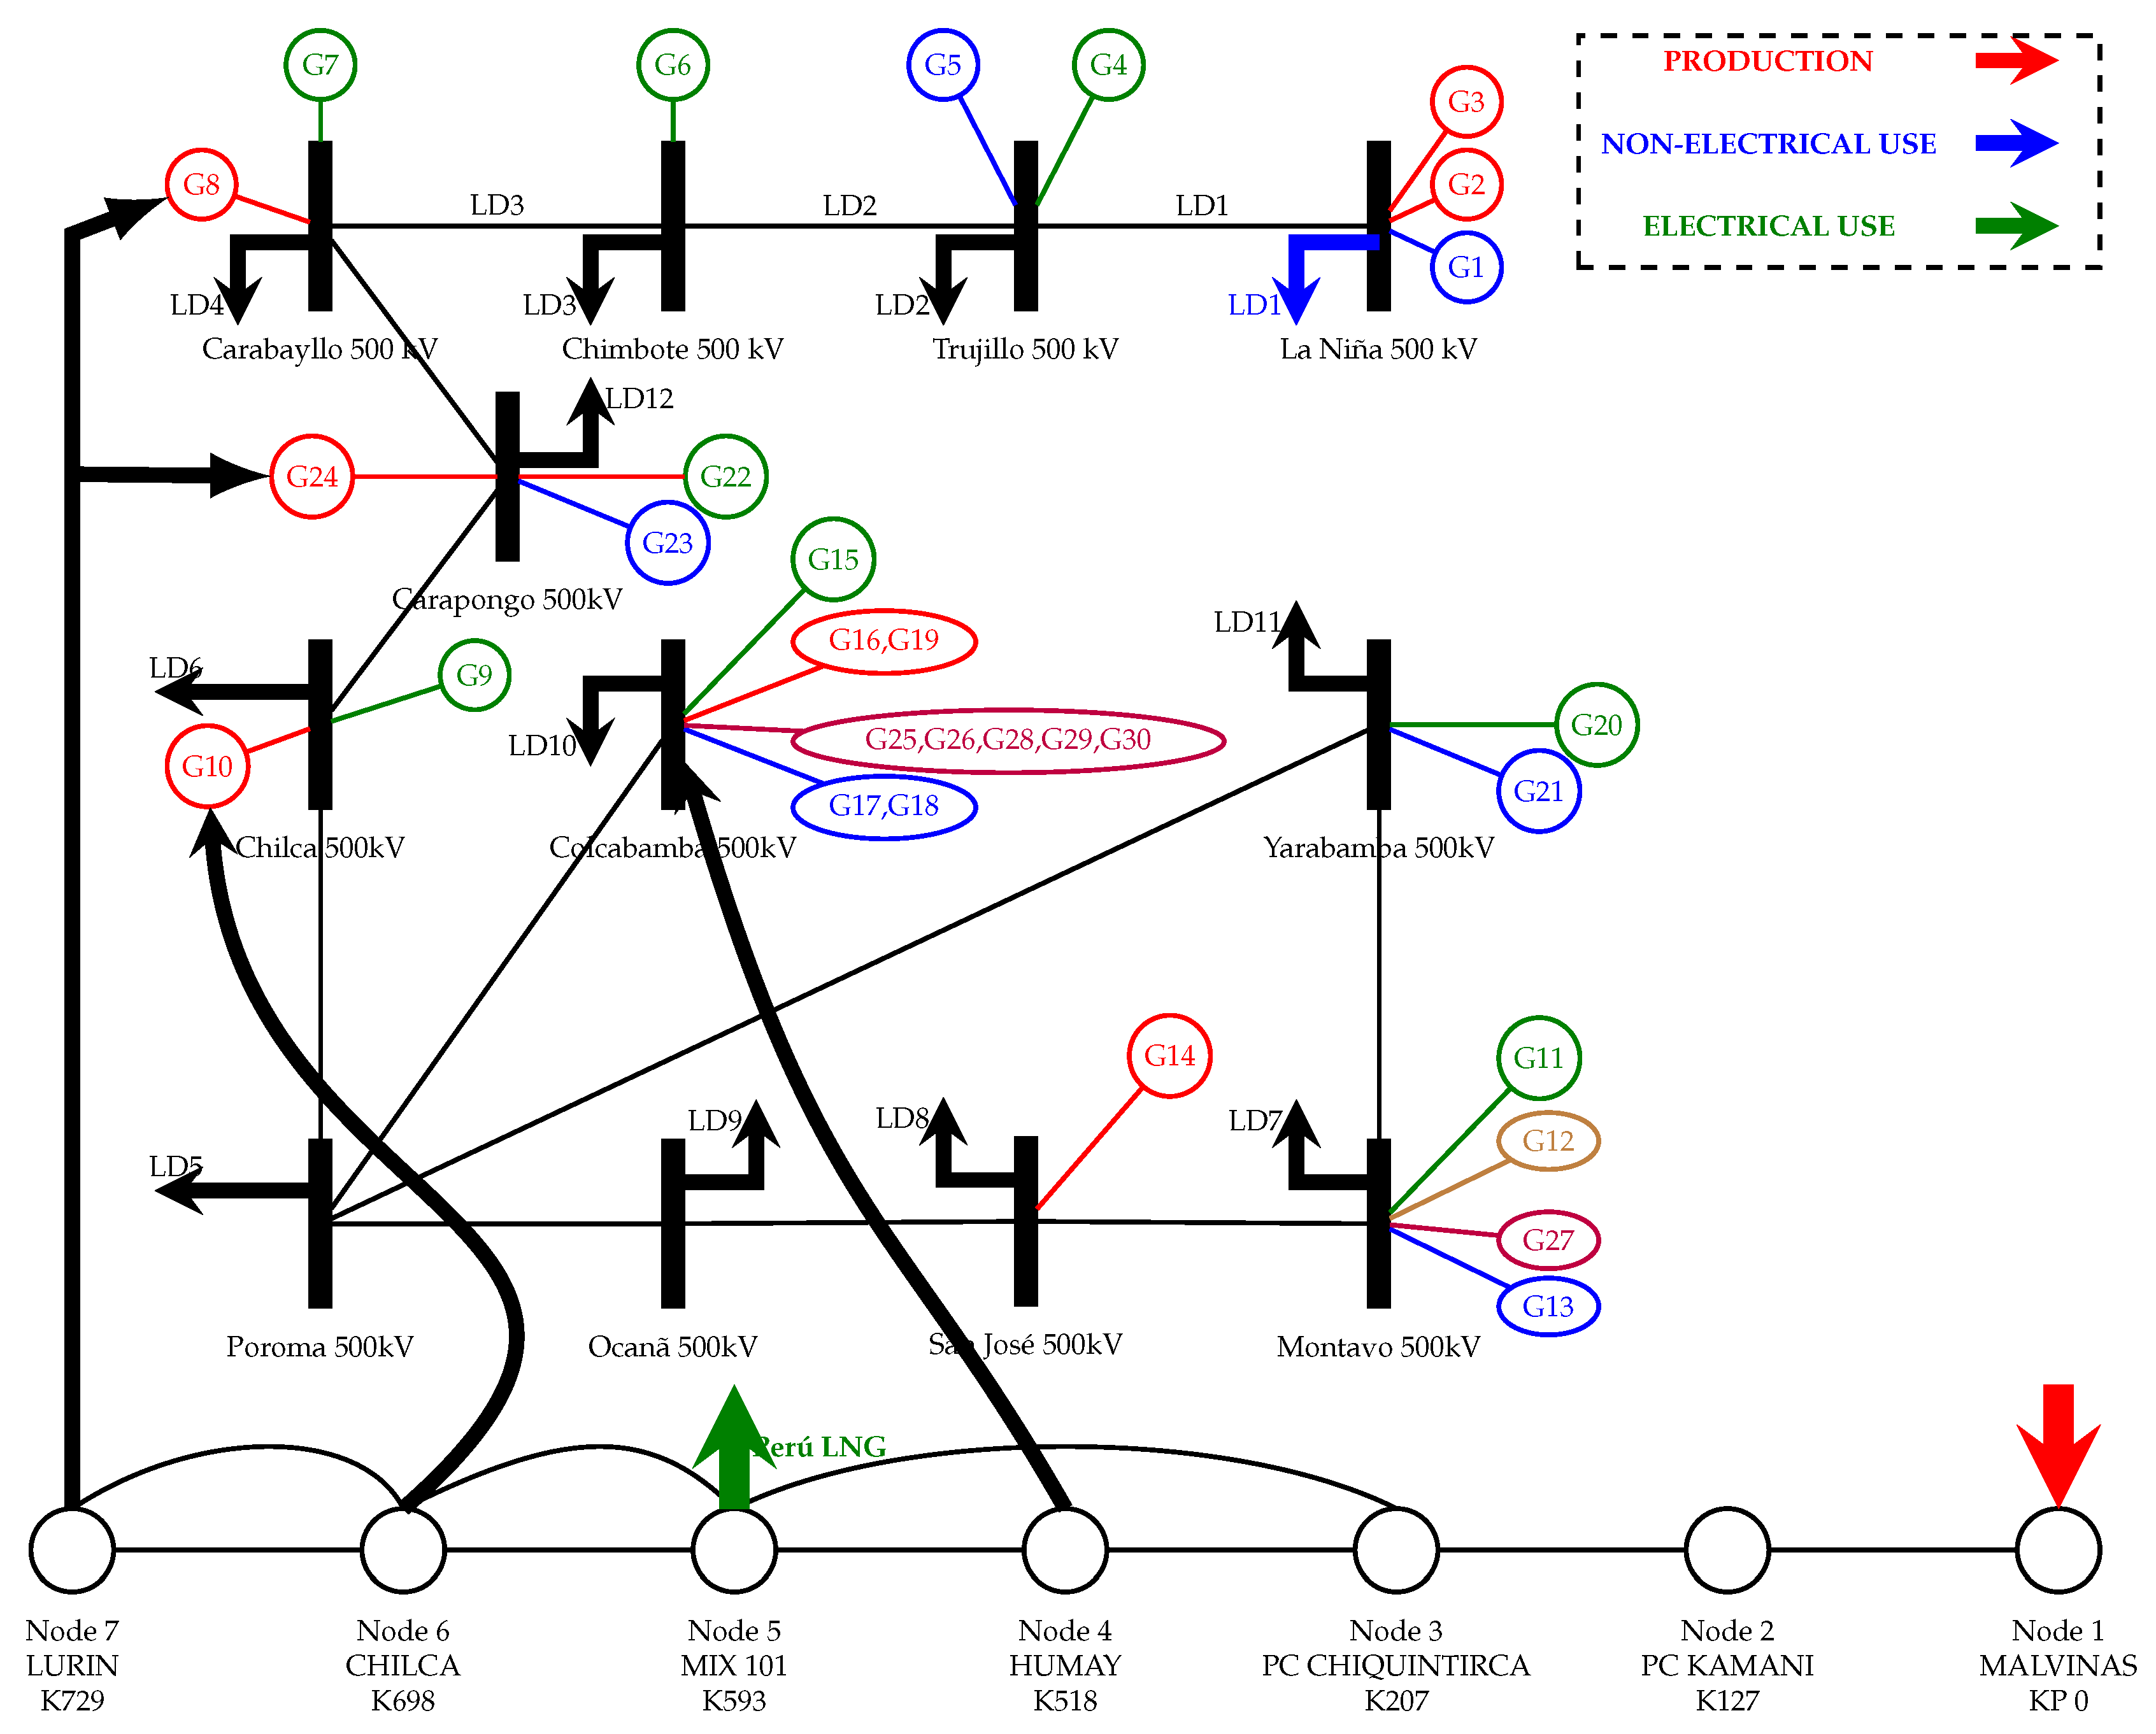
- The development and presentation of a reduced equivalent electrical network model for the SEIN (Interconnected Electrical System of Peru) at the 500 kV level. This model simplifies the complex electrical network, making it easier to study and understand. Additionally, an equivalent model for the Peruvian natural gas pipeline system is provided, facilitating a better understanding of the gas network’s behavior and its interaction with the electrical system.
- Insights into the economic and physical impacts of congestion in natural gas pipelines on both the short-term electricity market and the transmission network. This includes analyzing how bottlenecks in the gas pipeline system can affect electricity prices, supply reliability, and the overall efficiency of the energy market.
- Proposals for mitigation mechanisms through strategic public policies aimed at alleviating the economic and physical effects of congestion. These mechanisms are designed to ensure the reliable and efficient operation of the integrated gas–electricity system by addressing the root causes of congestion and improving coordination between the gas and electricity sectors.
2. The Model Proposed for the Integrated Analysis of the Electricity and Gas Systems
2.1. Gas–Electricity Optimization Model
2.1.1. Equivalent Reduced Model of the SEIN Peru
2.1.2. Equivalent Model of the Peruvian Natural Gas Pipeline Network
2.2. Objetive Function
- Power Balance: There must be a continuous balance between energy supply and demand, ensuring that load flows are within network restrictions.
- Individual Generator Constraints: Each generator operates under specific constraints, including dispatch price, generation limits, and other operational limitations.
- Power Transmission Constraints: The transmission system is governed by constraints to ensure its reliable and secure operation. These include line capacities, voltage limits, and other transmission-related factors.
- Natural Gas Source and Pipeline Limits: The model considers limitations on the availability of natural gas and the capacity of pipelines, ensuring that the supply remains within specified limits.
- Natural Gas Network Constraints: The natural gas network faces operational constraints, such as pressure limits, flow capacity limits, and other network-related constraints.
- Coupling Constraints: There are specific constraints on the coupling between the electrical and gas systems, ensuring coordinated operation while respecting the operational limits and capabilities of each system.
- Hydroelectric Power Plants: The model assumes a linear cost function for hydroelectric power plants, which simplifies representation and excludes a hydro-thermal coupling.
- Time Resolution: The model uses a one-hour time resolution to analyze a 24-h day, allowing it to capture temporal dynamics and variations in demand and generation profiles.
- Transmission Costs: The objective function of the model excludes transmission costs, focusing primarily on minimizing generation and natural-gas-related costs.
- : Active Power delivered by generator g at period t, measured in [MW].
- : Characteristic constants for each gas and diesel thermal generator, used in the quadratic equation for computing the cost of energy production from each bus generator. These constants depend on the power output of the generator and are measured in [USD/MW2], [USD/MW], and [USD], respectively.
- : Cost of Generation with Diesel in [USD].
- : Cost of generation with conventional and non-conventional renewable sources in [USD].
- : Cost of energy storage system in [USD] that remains fixed throughout the period.
- : NG supply at node n in period t, measured in [ m3/h].
- : Unit price of NG, measured in [USD/m3].
- : NG flow from node m to node n in period t, measured in [ m3/h].
- : Unit cost of NG transportation in [USD/m3].
- : number of pipes in the gas network.
- : Number of supply points in the NG network.
- : Number of power plants in the network.
2.2.1. Electrical System
- (a)
- Power flow:Notation:where:: Active power at bus i during period t, measured in megawatts (MW);: Reactive power generated at bus i during period t, measured in megavolt-amperes reactive (MVAR);: Impedance of the line between bus i and j, incorporating both resistance and reactance components;: Angle of total line admittance between bus i and j, representing the phase difference that affects power flow;: Voltage phase shift angle at bus i, indicating the difference in phase angle of the voltage relative to a reference point;: Maximum limit of active power transferable in the section from node k to node m, specified in megawatts (MW);: Active power in the section from bus k to bus m, measured in megawatts (MW);
- (b)
- Losses in the electrical network:where:: Active power losses within the network during period t, measured in megawatts (MW);: Reactive power losses within the network during period t, measured in megavolt-amperes reactive (MVAR);: Total active power delivered by the generators in the network during period t, aggregated across all N buses, in MW;: Total active power demand at all N buses in the network during period t, in MW;: Total reactive power supplied by the generators in the network during period t, aggregated across all N buses, in MVAR;: Total reactive power demand at all N buses in the network during period t, in MVAR;N: The total number of buses in the electrical network.
- (c)
- Power balance:where:: Total variable active power delivered by generator g to bus i at time t, measured in megawatts (MW);: Total variable reactive power delivered by generator g to bus i at time t, measured in megavolt-amperes reactive (MVar);: Total active power load on bus i during period t, measured in MW;: Total reactive power load on bus i during period t, measured in MVar;The units of measurement for these variables are specified as follows: active power is expressed in megawatts (MW) and reactive power in megavolt-amperes reactive (MVar), aligning with the standard units of power in electrical engineering.The units are in values per unit (p.u.), the units of active power are in MW, and the units of reactive power are in MVar.
2.2.2. Natural Gas Network
- (a)
- Energy Dispatch Equations for Thermal Power Plants Fueled with Natural Gas (NGFTPUs):Taking into account a pipeline network composed of various nodes, each with a defined requirement for natural gas () aimed at generating electricity, the formulas documented in [17] serve to characterize the operation of each Natural Gas Fueled Thermal Power Unit ().where:: Power generated in MW by NG thermal plant;: Flow of NG from node n to the generator, measured in cubic meters per second (m3/s);: Efficiency of the thermal power plant, a dimensionless coefficient;: Low Heating Value Constant equivalent to 35.07 MW/(m3/s).Equation (16) delineates the capacity constraints for the Natural Gas Fueled Thermal Power Units (NGFTPUs) situated at node n within the pipeline network. It is essential to highlight that NGFTPUs operate with a minimum non-zero capacity to maintain operational stability. This requirement is crucial for ensuring the reliable and secure operation of the NGFTPUs.Equation (17) specifies the electrical power demand , highlighting the system’s reliance on thermal generation using natural gas. It demonstrates how Natural Gas Fueled Thermal Power Units (NGFTPUs) dynamically manage energy dispatch in response to system demand, contingent upon the natural gas network’s capacity to meet gas requirements. The aim is to optimize operation efficiency, thereby reducing both energy production and gas transportation costs within the pipeline network.Equation (18) quantifies the relationship between the input of NG fuel and the resulting production of electrical energy, reflecting the efficiency and operational characteristics of the combined-cycle NGFTPUs.Equation (16) outlines the generation capacity constraints of the Natural Gas Fueled Thermal Power Units (NGFTPUs) at node n. It is critical to recognize that the correlation between energy generation and the flow of natural gas is complex and non-linear, influenced by a multitude of factors. These encompass the specific attributes of the thermal power plant, the inherent properties of the natural gas, and environmental variables pertinent to the location, such as altitude (measured in meters above sea level) and climatic conditions (including temperature and relative humidity). As documented in [17], this intricate interplay means that energy output in a combined cycle plant is best represented through a cubic function of natural gas flow. Thus, this nuanced relationship can be encapsulated in the subsequent mathematical expression.In Equation (19), the coefficients , , and depend on the specific characteristics of the natural gas thermal generation plants. However, determining these coefficients can be a complex task. As a result, for the purposes of the research work conducted in [17,18], a simplified approximation was employed. The simplified Equation (19) was applied to the test networks in the research work, assuming that for each unit of power produced in megawatts (MW), approximately 0.05 m3/s or 4320 m3/day of natural gas is required.where:= 0.0023148 MWatts day/106 m3
- (b)
- NG flow equations:As discussed in Section 2.1.2, we established that the pipeline network’s equivalent model consists of nodes for importing or exporting natural gas (NG), adhering to the principle of mass balance at each node. Consequently, the NG injection flows into a node are balanced by the NG flows allocated for both electrical generation and non-electrical uses, as supported by the findings in [17].where:: NG supply at node n, measured in cubic meters per hour (m3/h) or cubic meters per day (m3/day);: NG flow from node m to node n, expressed in cubic meters per hour (m3/h) or cubic meters per day (m3/day);: NG flow from node n to the generator, measured in cubic meters per second (m3/s);: NG demand for non-electric use at node n, specified in cubic meters per hour (m3/h) or cubic meters per day (m3/day).Equation (21) shows the natural gas flow balance at node “n”. Likewise, it is important to consider that these flows are influenced by various characteristics associated with natural gas, including the natural gas pressure at the inlet and outlet of the node, as well as the pipe section. To describe the relationship between pressure and natural gas flow, the Weymouth Equation (22) is employed. This equation defines the relationship between pressures and the flow of NG, providing a valuable tool for analyzing and understanding the behavior of natural gas flow within the system.where:: Pressure at node n, measured in bars;: Pressure at node m, in bars;: Constant reflecting the chemical composition of the NG and the characteristics of the section of the NG pipeline, given in cubic meters to the sixth power per square bars (m6/bars2).Subject to the following constraints:: Maximum NG flow from node n to node m, specified in cubic meters per hour (m3/h);: Minimum NG flow from node n to node m, in cubic meters per hour (m3/h);: Maximum pressure allowed at node n, measured in bars;: Minimum pressure allowed at node n, in bars;: Maximum limit of the NG supply delivered by the producer or importer node n (m3/h);: Minimum limit of the NG supply delivered by the producer or importer node n (m3/h)The constant depends on the characteristics of the NG pipeline, such as the diameter, length, and roughness of its walls, among other aspects, and the chemical composition of the NG.The constant is influenced by several factors related to the natural gas (NG) pipeline, including its diameter, length, the roughness of its internal walls, among other physical characteristics, as well as the chemical composition of the NG itself.If , this indicates that the natural gas (NG) flow is directed from node n to node m. Conversely, if , it signifies that the NG flow reverses, moving from node m to node n. Equation (23) models the NG flow within the pipeline network as a quadratic function of the pressure at the respective end nodes. Specifically, when the inlet pressure at node n exceeds the outlet pressure at node m (), it results in natural gas flowing from node n to node m ().Equation (23) imposes a unique constraint at each node, often necessitating the use of compressors. These devices are crucial for boosting the pressure at specific nodes where an increase in natural gas (NG) pressure is required. By enhancing the pressure, compressors enable a greater flow of NG than what would be possible under standard conditions, thereby aiding in the efficient redirection of NG throughout the network. For instance, in scenarios like in Peru, elevating the NG pressure is essential for transporting gas across challenging terrains such as the Andes mountains. Consequently, compressors allow for bypassing the maximum flow constraints, facilitating the injection of larger volumes of NG into the gas pipeline transmission networks. Nonetheless, it remains critical to ensure that pressure levels are kept within their prescribed limits to preserve the operational integrity and safety of the system.Similarly, constraint (26) regarding the supply of natural gas adapts dynamically. If at node n, it signifies that the node acts as a producer or importer of natural gas. On the other hand, if at node n, it denotes that the node serves as a consumer of natural gas, encompassing both electrical and non-electrical consumption. This constraint effectively captures the varied roles and functions of nodes within the natural gas network, accounting for the intricate balance of supply and demand.The function , introduced in Equation (22), is utilized to determine the direction of natural gas (NG) flow.For instance, if the flow from node m to node n is designated as positive, and the outcome of the simulation yields , this indicates that the natural gas (NG) flow direction is indeed from node m to node n. Conversely, should the simulation result in , it implies that the NG flows in the pipeline are directed from node n to node m.The inequality presented in Equation (25) highlights the physical constraints inherent to gas pipelines, specifically addressing the maximum and minimum flow limits of natural gas (NG) that delineate flow directionality within the system. Under typical circumstances, the lower limit is set to zero, indicating no reverse flow is allowed. However, in the presence of compressors within the pipeline, a minimum flow rate greater than zero may be established to ensure effective gas transportation. Conversely, the maximum flow rate is determined by the pipeline’s capacity and can be quantified through the subsequent equation:If , it indicates that the natural gas (NG) flow is directed from node i to node j. Conversely, if , the NG flow reverses, moving from node j to node i. To accurately model this behavior, a binary variable is incorporated into the equation, transforming the formulation into a combinatorial problem.: Internal diameter of the natural gas (NG) duct, measured in millimeters (mm);z: NG compressibility factor, a dimensionless unit valued at 0.8;T: Constant temperature for NG, set at 281.15 Kelvin (K);: Length of the NG pipeline section from node n to node m, in kilometers (km);: Density of NG relative to air, a dimensionless value of 0.6106 and;: Absolute roughness of the NG duct, quantified as 0.05 mm.
3. Case Study and Results Analysis
3.1. Congestion Effects of a Natural Gas Pipeline
| Conditions |
| No reduction in the capacity of the NG pipeline |
| Reduction of the capacity of the NG pipeline to 60% |
| Reduction of the capacity of the NG pipeline to 70% |
3.2. Impact of Reduced NG Pipeline Capacity on Generation Plant Operations
3.3. Variation of Bus Prices in Scenarios Considering the Reduction of the Maximum Capacity of the Main Natural Gas Pipeline
3.4. Effects on Load Flows in Congestion Scenarios of a Natural Gas Pipeline
3.5. Discussion
4. Conclusions
Author Contributions
Funding
Data Availability Statement
Acknowledgments
Conflicts of Interest
Nomenclature
| A | The electrical current flow measured in amperes (A) |
| AC | Alternating current |
| These constants are integral to the quadratic equation used to compute the energy production cost from each bus generator. They vary based on the generator’s power output and are denoted in [USD/MW2], [USD/MW], and [USD], respectively. | |
| The cost associated with generating electricity using diesel, expressed in [USD]. | |
| The cost of generating electricity using both conventional and non-conventional renewable energy sources, in [USD]. | |
| Cost of energy storage system in [USD] that remains fixed throughout the period. | |
| CDF | Conceptual data abstraction called Common Data Format for storing, manipulating, and accessing multidimensional datasets |
| Constant dependent on the chemical structure of the NG, and the characteristics of the nm section of the NG duct (m6/bars2) | |
| Internal diameter of NG duct (mm) | |
| Voltage phase shift angle on bus i. | |
| The demand for natural gas for non-electrical uses at node n, expressed in m3/h or m3/day. | |
| The volume of natural gas flowing from node n to the generator, in m3/s. | |
| The volume of natural gas transported from node m to node n, in m3/h or m3/day. | |
| The upper limit on the volume of natural gas flow from node n to node m, in m3/h. | |
| The lower limit on the volume of natural gas flow from node n to node m, in m3/h. | |
| The flow of natural gas between nodes n and m during period t, measured in 106 m3/h. | |
| The volume of natural gas transported from Node n to Node o, in m3/h or m3/day. | |
| The total number of power plants within the network. | |
| 0.0023148 MWatts day/106 m3 | |
| Low Heating Value Constant equivalent to 35.07 MW/(m3/s) | |
| NG pipeline length nm (km) | |
| Thermal power plant efficiency | |
| N | Bus number in the electrical network |
| Number of supply points in the NG network | |
| The active power load on bus i during period t, measured in MW. | |
| The power generated at a bus, in MW. | |
| number of pipes in the gas network | |
| Unit price of NG in [] | |
| Active Power delivered by the generator g in the period t in [MW]. | |
| Power generated in MW by NG thermal plant | |
| Variable Active Power delivered by the generator g on the bus i at time t in [MW] | |
| Offset angle | |
| Maximum limit of active power in the section k-m (MW)) | |
| Active Power in the section k-m (MW) | |
| Active power on the bus i in the period t | |
| Active power losses in period t | |
| Pressure reached at node m (bars) | |
| Pressure reached at node n (bars) | |
| Maximum pressure limit at node n, (bars) | |
| Minimum pressure limit at node n, (bars) | |
| Unit cost of NG transportation in [] | |
| Reactive Load on the bus i in the period t | |
| Reactive Power generated in bus i in the period t | |
| Reactive Power Losses in the period t | |
| NG supply at node n in (m3/h or m3/day) | |
| Maximum limit of the NG supply delivered by the producer or importer node n (m3/h) | |
| Minimum limit of the NG supply delivered by the producer or importer node n (m3/h) | |
| Supply of NG supplied at node n in period t in [106 m3/h] | |
| T | Temperature constant of NG, 281.15 K |
| US American Dollars | |
| V | Volt unit of potential difference |
| Final bus voltage, p.u. | |
| Bus voltage value i; | |
| W | Power Unit in Watts |
| X | Electrical impedance |
| Y | Admittance |
| Impedance of the line between busbars i and j | |
| z | compressibility factor of NG, 0.8 (dimensionalless) |
| Density of NG with respect to air, 0.6106 (dimensionalless) | |
| Angle of the tension in bar i | |
| Absolute roughness of the NG duct, 0.05 mm | |
| Efficiency of the thermoelectric plant | |
| Angle of total line admittance between busbars i and bus j | |
| Total energy generated on the bus i in the period t | |
| Total Active Energy in bus i in period t | |
| Total Reactive Energy in bus i in the period t | |
| Reactive load on bus i in period t | |
| Active Power of the thermogenerators connected on the bus i | |
| Total Reactive Power of the thermogenerators | |
| z | NG compressibility factor, 0.8 (dimensionalless units) |
| Abbreviations | |
| Council for Electrical System Economy Operating | |
| Discrete Non-Linear Programming | |
| General Algebraic Modeling System | |
| Gigawatts | |
| International electrical and electronics engineers | |
| kilometers | |
| Key point | |
| Kilo volts | |
| LNG | Liquefied natural gas |
| Natural Gas | |
| Natural-Gas-Fueled Thermoelectric Power Units | |
| Million Metric Standard Cubic Meters | |
| Mega Volt-Amper | |
| Megawatts | |
| Peruvian National Interconnected System | |
| Stochastic Dual Dynamic Programming | |
| Natural-Gas-Fueled Thermoelectric Power Units |
References
- Xing, J.; Wu, P. Optimal Planning of Electricity-Natural Gas Coupling System Considering Power to Gas Facilities. Energies 2021, 14, 3400. [Google Scholar] [CrossRef]
- Saedi, I.; Mhanna, S.; Mancarella, P. Integrated electricity and gas system modelling with hydrogen injections and gas composition tracking. Appl. Energy 2021, 303, 117598. [Google Scholar] [CrossRef]
- Ameli, H.; Qadrdan, M.; Strbac, G. Coordinated Operation of Gas and Electricity Systems for Flexibility Study. Front. Energy Res. 2021, 8, 17. [Google Scholar] [CrossRef]
- Qin, G.; Yan, Q.; Kammen, D.M.; Shi, C.; Xu, C. Robust optimal dispatching of integrated electricity and gas system considering refined power-to-gas model under the dual carbon target. J. Clean. Prod. 2022, 371, 133451. [Google Scholar] [CrossRef]
- AlHajri, I.; Ahmadian, A.; Elkamel, A. Techno-economic-environmental assessment of an integrated electricity and gas network in the presence of electric and hydrogen vehicles: A mixed-integer linear programming approach. J. Clean. Prod. 2021, 319, 128578. [Google Scholar] [CrossRef]
- Rubio-Barros, R.; Ojeda-Esteybar, D.; Ano, O.; Vargas, A. Combined Operational Planning of Natural Gas and Electric Power Systems: State of the Art. In Natural Gas; Potocnik, P., Ed.; IntechOpen: Rijeka, Croatia, 2010; Chapter 12. [Google Scholar] [CrossRef]
- Pambour, K.A.; Cakir Erdener, B.; Bolado-Lavin, R.; Dijkema, G.P.J. Development of a Simulation Framework for Analyzing Security of Supply in Integrated Gas and Electric Power Systems. Appl. Sci. 2017, 7, 47. [Google Scholar] [CrossRef]
- Hibbard, P.J.; Schatzki, T. The Interdependence of Electricity and Natural Gas: Current Factors and Future Prospects. Electr. J. 2012, 25, 6–17. [Google Scholar] [CrossRef]
- Ventosa, M.; Baillo, A.; Ramos, A.; Rivier, M. Electricity market modeling trends. Energy Policy 2005, 33, 897–913. [Google Scholar] [CrossRef]
- Yang, L.; Zhao, X.; Li, X.; Feng, X.; Yan, W. An MILP-Based Optimal Power and Gas Flow in Electricity-gas Coupled Networks. Energy Procedia 2019, 158, 6399–6404. [Google Scholar] [CrossRef]
- Navarro, R.; Rojas, H.; De Oliveira, I.S.; Luyo, J.E.; Molina, Y.P. Optimization Model for the Integration of the Electric System and Gas Network: Peruvian Case. Energies 2022, 15, 3847. [Google Scholar] [CrossRef]
- Rojas, H. Despacho Integrado de Sistemas Eléctricos de Potencia y de Gas Natural considerando Energías Renovables y Sistemas de Almacenamiento. Fondo Editor. UNI 2022, 1, 147. [Google Scholar]
- Jenkins, S.E. Interdependency of electricity and natural gas markets in the united states: A dynamic computational model. Mass. Inst. Technol. Technol. Policy Program 2014, 1, 84. [Google Scholar]
- Erdener, B.C.; Pambour, K.A.; Lavin, R.B.; Dengiz, B. An integrated simulation model for analysing electricity and gas systems. Int. J. Electr. Power Energy Syst. 2014, 61, 410–420. [Google Scholar] [CrossRef]
- Gil, M.; Dueñas, P.; Reneses, J. Electricity and Natural Gas Interdependency: Comparison of Two Methodologies for Coupling Large Market Models Within the European Regulatory Framework. IEEE Trans. Power Syst. 2016, 31, 361–369. [Google Scholar] [CrossRef]
- De Wolf, D.; Smeers, Y. The Gas Transmission Problem Solved by an Extension of the Simplex Algorithm. Manag. Sci. 2000, 46, 1454–1465. [Google Scholar] [CrossRef]
- An, S.; Li, Q.; Gedra, T. Natural gas and electricity optimal power flow. In Proceedings of the 2003 IEEE PES Transmission and Distribution Conference and Exposition (IEEE Cat. No.03CH37495), Dallas, TX, USA, 7–12 September 2003; Volume 1, pp. 138–143. [Google Scholar] [CrossRef]
- Liu, C.; Shahidehpour, M.; Fu, Y.; Li, Z. Security-Constrained Unit Commitment with Natural Gas Transmission Constraints. IEEE Trans. Power Syst. 2009, 24, 1523–1536. [Google Scholar] [CrossRef]


| Name Line (500 kV) | From (Bus) | To (Bus) | Admittance Y | PHI (°) | R (p.u.) | X (p.u.) | LIMIT (MVA) |
|---|---|---|---|---|---|---|---|
| LT La Niña—Trujillo 500 kV | 1 | 2 | 28.33 | −1.49 | 0.0027 | 0.0352 | 420.3 |
| LT Trujillo—Chimbote 500 kV | 2 | 3 | 62.38 | −1.51 | 0.001 | 0.016 | 438.6 |
| LT Chimbote—Carabayllo 500 kV | 3 | 4 | 23.15 | −1.5 | 0.003 | 0.0431 | 376.6 |
| LT Carabayllo—Carapongo 500 kV | 4 | 12 | 292.1 | −1.45 | 0.0004 | 0.0034 | 1379.7 |
| LT Carapongo—ChilcaCTM 500 kV | 12 | 6 | 129.34 | −1.48 | 0.0007 | 0.0077 | 780 |
| LT Chilca—Poroma 500 kV | 6 | 5 | 20.99 | −1.49 | 0.0037 | 0.0475 | 646.3 |
| LT Poroma—Ocoña 500 kV | 5 | 9 | 71.51 | −1.37 | 0.0028 | 0.0137 | 491 |
| LT Ocoña—San José 500 kV | 9 | 8 | 140.08 | −1.37 | 0.0014 | 0.007 | 267.5 |
| LT San José—Montalvo 500 kV | 8 | 7 | 166.09 | −1.37 | 0.0012 | 0.0059 | 0 |
| LT Montalvo—Yarabamba 500 kV | 7 | 11 | 76.16 | −1.5 | 0.0009 | 0.0131 | 584.2 |
| LT Yarabamba—Poroma 500 kV | 11 | 5 | 35.48 | −1.43 | 0.004 | 0.0279 | 0 |
| LT Poroma—Colcabamba 500 kV | 5 | 10 | 47.42 | −1.44 | 0.0028 | 0.0209 | 889.2 |
| Number Bus | Name Bus | Voltage p.u. | Angle (°) | Load MW | Load MVAR | Gen MW | Gen MVAR | Base kV |
|---|---|---|---|---|---|---|---|---|
| B1 | La Nina 500 kV | 1.000 | −40.16 | 420.3 | 230 | 96.3 | 32.7 | 500 |
| B2 | Trujillo 500 kV | 1.000 | −33.54 | 438.6 | 224.7 | 30.3 | 39.5 | 500 |
| B3 | Chimbote 500 kV | 1.000 | −26.73 | 376.6 | 87.1 | 333.5 | 167.8 | 500 |
| B4 | Carabayllo 500 kV | 1.000 | −6.63 | 1379.7 | 900.5 | 908.6 | 643.6 | 500 |
| B5 | Poroma 500 kV | 0.969 | −7.39 | 780 | 101.7 | 0 | 0 | 500 |
| B6 | Chilca 500 kV | 1.000 | 0 | 646.3 | 517.3 | 1841 | 735.5 | 500 |
| B7 | Montalvo 500 kV | 1.000 | −10.49 | 491 | 268.6 | 167 | 150.7 | 500 |
| B8 | San Jose 500 kV | 0.999 | −10.67 | 267.5 | 70.5 | 0 | 316 | 500 |
| B9 | Ocoña 500 kV | 0.986 | −9.60 | 0 | −96.8 | 0 | 0 | 500 |
| B10 | Colcabamba 500 kV | 1.000 | −1.74 | 584.2 | 452.5 | 1332.6 | 307.6 | 500 |
| B11 | Yarabamba 500 kV | 1.000 | −7.64 | 0 | −150 | 383 | 167 | 500 |
| B12 | Carapongo 500 kV | 1.000 | −4.11 | 889.2 | 646.8 | 1251.3 | −1.3 | 500 |
| Line | Node Start | Node End | Has Compresor | Diameter (Inch) | Length km | Accountability |
|---|---|---|---|---|---|---|
| 1 | Node 1 (Malvinas) | Node 2 (Kamani) | YES | 32 | 126.7 | main network |
| 2 | Node 2 (Kamani) | Node 3 (Chiquintirca) | YES | 32 | 81.27 | main network |
| 3 | Node 3 (Chiquintirca) | Node 4 (Humay) | NO | 24 | 309.93 | main network |
| 4 | Node 4 (Humay) | Node 5 (Mix 101) | NO | 18 | 75.24 | main network |
| 5 | Node 3 (Chiquintirca) | Node 5 (Mix 101) | NO | 34 | 406 | Peru LNG |
| 6 | Node 5 (Mix 101) | Node 6 (Chilca) | NO | 18 | 105 | main network |
| 7 | Node 5 (Mix 101) | Node 6 (Chilca) | NO | 24 | 105 | Loop coast |
| 8 | Node 6 (Chilca) | Node 7 (Lurín) | NO | 18 | 31.16 | main network |
| 9 | Node 6 (Chilca) | Node 7 (Lurín) | NO | 24 | 31.16 | Loop coast |
| Node | Name | KP | Zone | North | East |
|---|---|---|---|---|---|
| 1. | Malvinas | KP 0 | 18 | 8,689,907.55 | 724,013.26 |
| 2. | Kamani | KP 127 | 18 | 8,599,403.00 | 691,070.00 |
| 3. | Chiquintirca | KP 207 | 18 | 8,599,333.00 | 691,017.00 |
| 4. | Humay | KP 517.9 | 18 | 8,480,890.00 | 404,048.00 |
| 5. | Mix 101 (CUA) | KP 594.9 | 18 | 8,536,618.00 | 361,063.00 |
| 6. | Chilca | KP 699 | 18 | 8,614,339.00 | 314,286.00 |
| 7. | Lurin | KP 729 | 18 | 8,640,336.00 | 300,970.00 |
| Level Productión | Use Max (Elect/No Elect) | Level of Pressure | |||||
|---|---|---|---|---|---|---|---|
| Node | Name | ||||||
| Min | Max | Min (bar) | Max (bar) | ||||
| MMPCD | MMPCD | MMPCD | MMPCD | ||||
| 1. | MALVINAS | 460 | 1605 | 0 | 0 | 147 | 147 |
| 2. | KAMANI | 460 | 1605 | 0 | 0 | 136 | 147 |
| 3. | CHIQUINTIRCA | 225 | 435 | 0 | 0 | 109 | 147 |
| 4. | HUMAY | 196 | 386 | 49 | 0 | 120 | 135 |
| 5. | MIX 101 | 416 | 936 | 0 | 620 | 113 | 102 |
| 6. | CHILCA | 203 | 516 | 420 | 0 | 104 | 54 |
| 7. | LURIN | 203 | 516 | 0 | 516 | 104 | 46 |
| Hour | 16 August 2022 | Hour | 16 August 2022 | Hour | 16 August 2022 |
|---|---|---|---|---|---|
| 01:00 | 5.99 | 09:00 | 6.61 | 17:00 | 6.97 |
| 02:00 | 5.87 | 10:00 | 6.87 | 18:00 | 6.80 |
| 03:00 | 5.75 | 11:00 | 6.99 | 19:00 | 7.06 |
| 04:00 | 5.76 | 12:00 | 7.11 | 20:00 | 7.09 |
| 05:00 | 5.83 | 13:00 | 6.94 | 21:00 | 7.05 |
| 06:00 | 5.96 | 14:00 | 6.90 | 22:00 | 6.92 |
| 07:00 | 6.19 | 15:00 | 7.01 | 23:00 | 6.66 |
| 08:00 | 6.35 | 16:00 | 7.06 | 00:00 | 6.29 |
Disclaimer/Publisher’s Note: The statements, opinions and data contained in all publications are solely those of the individual author(s) and contributor(s) and not of MDPI and/or the editor(s). MDPI and/or the editor(s) disclaim responsibility for any injury to people or property resulting from any ideas, methods, instructions or products referred to in the content. |
© 2024 by the authors. Licensee MDPI, Basel, Switzerland. This article is an open access article distributed under the terms and conditions of the Creative Commons Attribution (CC BY) license (https://creativecommons.org/licenses/by/4.0/).
Share and Cite
Navarro, R.; Rojas, H.; Luyo, J.E.; Silva, J.L.; Molina, Y.P. Impacts of Natural Gas Pipeline Congestion on the Integrated Gas–Electricity Market in Peru. Energies 2024, 17, 4586. https://doi.org/10.3390/en17184586
Navarro R, Rojas H, Luyo JE, Silva JL, Molina YP. Impacts of Natural Gas Pipeline Congestion on the Integrated Gas–Electricity Market in Peru. Energies. 2024; 17(18):4586. https://doi.org/10.3390/en17184586
Chicago/Turabian StyleNavarro, Richard, Hugo Rojas, Jaime E. Luyo, Jose L. Silva, and Yuri P. Molina. 2024. "Impacts of Natural Gas Pipeline Congestion on the Integrated Gas–Electricity Market in Peru" Energies 17, no. 18: 4586. https://doi.org/10.3390/en17184586
APA StyleNavarro, R., Rojas, H., Luyo, J. E., Silva, J. L., & Molina, Y. P. (2024). Impacts of Natural Gas Pipeline Congestion on the Integrated Gas–Electricity Market in Peru. Energies, 17(18), 4586. https://doi.org/10.3390/en17184586


