
LightGBM-, SHAP-, and Correlation-Matrix-Heatmap-Based Approaches for Analyzing Household Energy Data: Towards Electricity Self-Sufficient Houses


Abstract
1. Introduction
- Electricity Management and Efficiency: Accurate predictions enable better management of energy resources within households. By understanding and anticipating electricity needs, house owners and energy service providers can optimize energy usage, reduce waste, and implement more effective electrical energy-saving measures.
- Cost Savings: Forecasting ESSR aids in planning and budgeting for energy costs. Households can identify patterns in their energy usage and take steps to reduce their consumption during peak periods, potentially lowering their electricity bills.
- Integration of Renewable Energy: For households investing in renewable energy technologies such as solar panels or fuel cells, accurate consumption predictions are essential. By knowing their electricity needs, homeowners can size their renewable energy systems appropriately and ensure that these systems meet their demands effectively.
- Grid Management and Stability: On a larger scale, predicting ESSR aids in managing and stabilizing the electricity grid. Accurate forecasts help utility companies balance supply and demand, preventing outages and ensuring a reliable power supply.
- Environmental Impact: Reducing electricity consumption through accurate predictions can decrease a household’s carbon footprint. Lower energy use translates to reduced greenhouse gas emissions, contributing to broader efforts to combat climate change.
- Climate and Weather Conditions: Weather patterns significantly impact household electricity use. For instance, heating needs in winter and cooling demands in summer can cause fluctuations in electricity consumption. Accurate weather data and forecasts are necessary for precise predictions.
- Household Size and Occupancy: The number of residents and their daily activities influence electricity use. Larger households or those with varying occupancy patterns may have different consumption patterns compared to smaller or consistently occupied homes.
- Income and Lifestyle: Household income and lifestyle choices affect energy consumption. Higher-income households might use more energy-intensive appliances, while lifestyle habits, such as energy-efficient practices, can also play a role.
- Appliance Usage: The type, age, and efficiency of appliances and electronics in a household impact electricity consumption. Energy-efficient appliances and smart home technologies can help reduce overall usage, while older or less efficient appliances may lead to higher consumption.
- Behavioral Patterns: Individual behaviors, such as the frequency of using electrical appliances and the times when energy is used, influence overall consumption. Behavioral data, including patterns of use, can improve the accuracy of consumption predictions.
- Building Characteristics: The design and insulation of a home, including factors like the size of the home, insulation quality, and window types, affect heating and cooling needs, which in turn impact electricity consumption.
- Energy Policies and Tariffs: Changes in energy policies and tariffs can influence household electricity use. For instance, time-of-use pricing might encourage households to shift their energy use to off-peak hours.
1.1. Related Work
1.2. Research Gap
1.3. Motivation
1.4. Novelty and Contributions
1.5. Organization of This Article
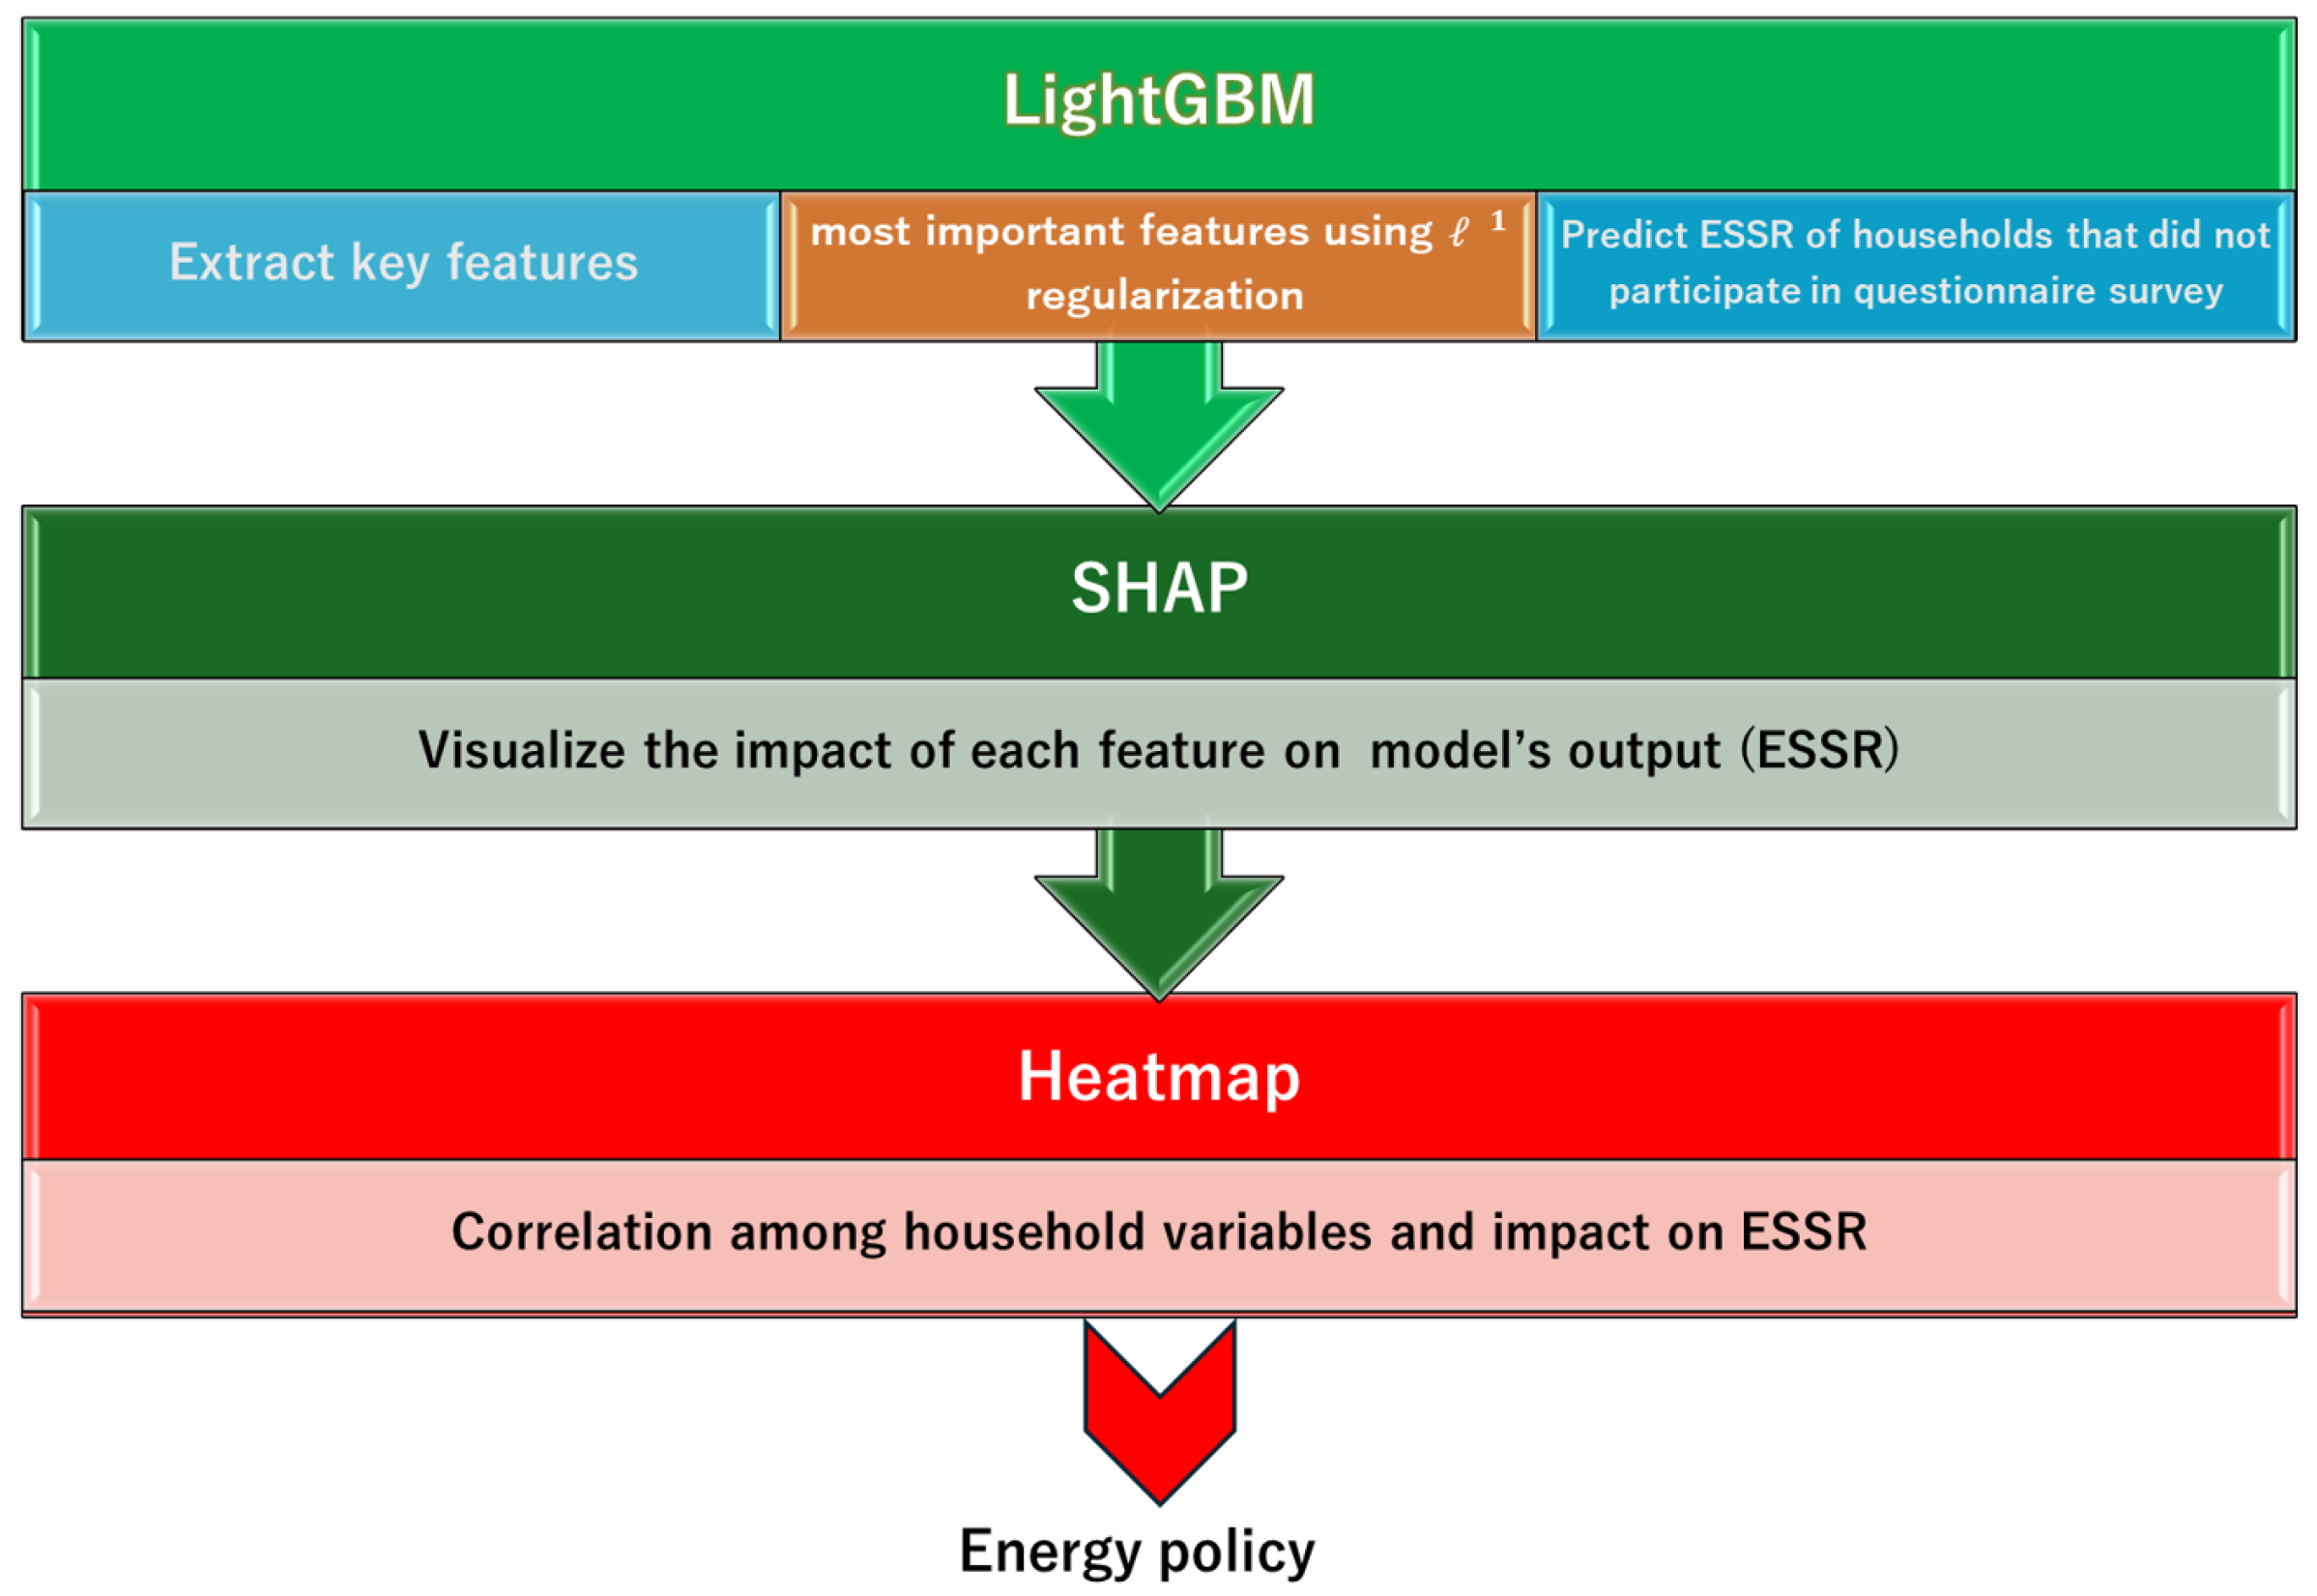
- LightGBM-Based Prediction Model: We use LightGBM to identify key features that affect the electricity self-sufficiency rate of households. We used regularization to discard the less important features (although these discarded features cannot be completely ignored). Furthermore, this model can forecast the electricity self-sufficiency rate of households omitted from the questionnaire survey while pinpointing the predominant factors influencing electricity self-sufficiency.
- SHAP-based Feature Analysis: This study utilized the LightGBM-based SHAP summary plot to highlight important household features in order of rank of feature importance from top to bottom.
- Understanding the Correlation of Various Household Variables in Questionnaire Survey Data and Their Impact on the ESSR: We analyzed the questionnaire survey data using a correlation-matrix-based heatmap to understand the relationships among different variables and their impact on the ESSR.
2. Materials and Methods
2.1. Data Collection and Description
2.2. Questionnaire Survey
2.3. Data Pre-Processing
2.4. Electricity Self-Sufficiency Rate
- Renewable Energy Sources: The use of solar panels, fuel cells, inverters, or other renewable energy installations that can generate electricity or heat for the household.
- Energy Storage Systems: The presence of batteries or other storage systems that can store energy produced during peak production periods for use during periods when production is low.
- Energy Efficiency Measures: The implementation of energy-saving practices and technologies, such as high-efficiency appliances, LED lighting, proper insulation, and smart thermostats.
- Geographical Location: The availability and effectiveness of renewable energy sources vary by location. For example, solar power is more effective in regions with abundant sunlight.
- Electricity Produced by Household (Wh): The amount of electricity generated by the household’s renewable energy sources, measured in watt-hours (Wh).
- Total Electricity Consumption of Household (Wh): The total amount of electricity consumed by the household from all sources, including both self-generated electricity and any additional electricity drawn from the grid or other external sources, measured in watt-hours (Wh).
2.5. Data Analysis Techniques
2.5.1. LightGBM ( Light Gradient Boosting Machine)
- Gradient-Based One-Side Sampling (GOSS): LightGBM retains instances with large gradients while randomly sampling instances with smaller gradients. This approach reduces the number of data points processed and accelerates computation without significantly compromising accuracy.
- Exclusive Feature Bundling (EFB): LightGBM combines mutually exclusive features that rarely have non-zero values simultaneously, decreasing the total number of features and enhancing training efficiency.
- Histogram-based Decision Tree Learning: LightGBM employs a histogram-based technique to determine optimal split points by converting continuous feature values into discrete bins. This method simplifies the learning process and accelerates training.
- Leaf-wise Tree Growth: In contrast to traditional level-wise tree growth methods, such as those used by XGBoost, LightGBM adopts a leaf-wise strategy. It selects the leaf with the highest delta loss for expansion, resulting in deeper trees and improved accuracy.
- is the loss function;
- is the prediction for instance i;
- is the regularization term for the k-th tree ;
- n is the no. of instances;
- N is the no. of trees.
- and are the sums of the gradients for the left and right splits, respectively;
- and are the sums of the second-order gradients (Hessians) for the left and right splits, respectively;
- is the regularization parameter;
- is the regularization term for the number of leaves.
- Input variables—Survey responses (option number 1–5 for each survey question);
- Output variable—Electricity self-sufficiency rate;
- Evaluation function—Mean absolute error (MAE).
2.5.2. Feature Analysis Based on SHAP (SHapley Additive exPlanations)
- is the SHAP value for feature i;
- S is a subset of features excluding i;
- N is the set of all features;
- is the value function for the subset S;
2.5.3. Correlation-Matrix-Based Heatmap
Correlation Coefficient:
- and are individual sample points;
- and are the means of x and y, respectively;
- n is the number of data points.
Correlation Matrix:
2.5.4. Mean Absolute Error (MAE)
- n denotes the total number of observations;
- represents the actual value for the i-th observation;
- denotes the predicted value for the i-th observation;
- indicates the absolute error for the i-th observation.
2.5.5. Confusion Matrix
- Accuracy: The ratio of correctly predicted instances to the total instances. It is given by
- Precision: The ratio of correctly predicted positive observations to the total number of predicted positive observations. It is given by
- Recall (Sensitivity or True Positive Rate): The ratio of correctly predicted positive observations to all observations in the actual positive class. It is given by
- F1 Score: The harmonic mean of precision and recall. It is given by
- True Positives (TP): Model correctly predicts the positive class.
- True Negatives (TN): Model correctly predicts the negative class.
- False Positives (FP): Model incorrectly predicts the positive class when it is actual negative. This is also known as a Type I error.
- False Negatives (FN): Model incorrectly predicts the negative class when it is actual positive. This is also known as a Type II error.
3. Results and Discussion
3.1. Electricity Self-Sufficiency Rate (ESSR)
3.2. LightGBM (Gradient Boosting Machine)-Based Analysis
- Explanatory variables—Questionnaire survey data;
- Target variables—Electricity self-sufficiency rate (ESSR);
- Evaluation method—Mean absolute error (MAE), 0.23.
- MAE of housing type (Q2);
- Average monthly electricity bill (Q16);
- Type of floor heating (Q10);
- Average monthly gas bill (Q17);
- Electricity tariff plan (Q3);
- Electrical capacity (Q4);
- Number of TVs (Q12)
- Cooking equipment (Q11);
- Number of washing and drying machines (Q12);
- The frequency of viewing HEMSs (home energy management systems) (Q20).
- MAE of housing type (Q2);
- average monthly electricity bill (Q16);
- type of floor heating (Q10).
3.2.1. Housing Type (Q2)
- Incentivizing Solar Panel Installation: For detached houses, especially one-story and two-story homes, government subsidies or incentives for installing solar panels should be provided. Solar panels significantly enhance the ESSR by generating renewable energy at home.
- Retrofitting Housing Complexes: Governments should encourage retrofitting existing housing complexes with energy-efficient technologies and renewable energy systems. Collective solar panel installations or centralized battery storage could be explored for large complexes.
- Customized Energy Efficiency Programs: Governments should develop targeted energy efficiency programs based on housing type—for example, insulation and smart energy systems for older detached houses or energy-efficient communal heating for housing complexes.
3.2.2. Average Monthly Electricity Bill (Q16)
- Tiered Pricing and Rebates: Governments should implement a tiered electricity pricing system where households with lower energy consumption receive rebates or lower rates. This could incentivize energy-saving behavior and improve the ESSR by reducing reliance on non-renewable energy sources.
- Energy Efficiency Audits: Governments should offer free or subsidized energy-efficiency audits to households with high electricity bills. These audits can help to identify inefficiencies in energy usage and suggest improvements, such as better insulation, energy-efficient appliances, or behavioral changes.
- Promotion of Energy-Efficient Appliances: Governments should encourage the adoption of energy-efficient appliances through rebates, discounts, or tax incentives. Households with lower energy consumption will rely more on self-generated renewable energy, thus improving their ESSR.
3.2.3. Floor Heating (Q10)
- Encourage Renewable Energy Pairing: For homes with electric floor heating, governments should promote the pairing of such systems with renewable energy sources, such as solar panels, to ensure that the heating system’s energy demand is met sustainably.
- Subsidies for Efficient Heating Systems: Governments should provide subsidies for switching from electric to more energy-efficient heating systems, such as gas-powered hot-water floor heating or other renewable heating solutions like heat pumps.
- Education on Energy Management: Governments should educate homeowners on managing their heating systems more efficiently, such as using programmable thermostats or zone heating to reduce unnecessary energy consumption.
3.2.4. Formulating Policies to Improve the ESSR (Based on above Mentioned 3 Most Significant Features
- Targeted Incentives Based on Housing Type: Recognizing that the type of housing plays a pivotal role in the ESSR, policies should focus on providing tailored incentives for different housing types. For example, promoting solar panels for detached houses and communal energy solutions for complexes can improve the overall ESSR.
- Energy Consumption Management: By addressing households with higher electricity bills through tiered pricing, energy audits, and the promotion of energy-efficient appliances, we can encourage energy conservation and reduce dependency on non-renewable energy, thus improving the ESSR.
- Heating Systems Optimization: Since floor heating has a significant impact on energy consumption, especially in homes with electric systems, policies should encourage the use of renewable energy and more efficient heating solutions. This will help to mitigate the negative impact on the ESSR and promote sustainable energy use.
3.2.5. Statistical Relationship between ESSR and above Mentioned 3 Most Significant Features
- Option 1 (No floor heating): The ESSR distribution is relatively narrow, indicating that most households without floor heating have a lower and more consistent electricity self-sufficiency rate. The median ESSR is low.
- Option 2 (Electric floor heating): The distribution is slightly wider than Option 1, showing some variability in the ESSR, but still with a lower median ESSR. This suggests that electric floor heating, likely due to its higher energy demand, is associated with a lower ESSR.
- Option 3 (Gas hot-water floor heating): The distribution is narrow again with a slightly higher median ESSR compared to Options 1 and 2. This type of heating seems to offer a more efficient use of energy, contributing to a moderate ESSR.
- Option 4 (Other hot-water floor heating): This option shows the widest distribution with a higher median ESSR. This indicates that households with other types of hot-water floor heating (such as OM solar) tend to have a higher self-sufficiency rate, likely because these systems are more efficient or are paired with renewable energy sources.
3.3. SHAP (SHapley Additive exPlanations)-Based Analysis
- Explanatory variables—Questionnaire data;
- Target variable—Electricity self-sufficiency rate (ESSR).
- Housing type (Q2);
- Average monthly electricity bill (Q16);
- Type of floor heating (Q10);
- Cooking equipment (Q11);
- Electric capacity (Q4);
- Number of washing and drying machines (Q12);
- Average monthly gas bill (Q17);
- Electricity tariff (fee) plan (Q3);
- Number of TVs (Q12);
- The frequency of viewing HEMSs (Home Energy Management Systems) (Q20).
- Housing type (Q2);
- Average monthly electricity bill (Q16);
- Type of floor heating (Q10).
- Housing Type (Q2):
- –
- Red points (higher values): Larger or detached houses are associated with a higher electricity self-sufficiency rate. These homes are more likely to accommodate renewable energy installations such as solar panels and fuel cells.
- –
- Blue points (lower values): Smaller or less independent housing types, such as apartments, generally show lower levels of electricity self-sufficiency.
- Average Monthly Electricity Bill (Q16):
- –
- Blue points (lower values): Represent lower electricity bills, indicating reduced energy consumption and a positive contribution to the electricity self-sufficiency rate.
- –
- Red points (higher values): Reflect higher electricity bills, which correspond to increased energy usage that negatively impacts self-sufficiency.
- Floor Heating (Q10):
- –
- Red points (higher values): Indicate the presence of electric floor heating systems, which generally increase electricity consumption and reduce self-sufficiency.
- –
- Blue points (lower values): Suggest the absence of floor heating or the use of non-electric systems, which are less likely to impact electricity consumption significantly and contribute positively to self-sufficiency.
- Cooking Equipment (Q11):
- –
- Blue points (lower values): Represent non-electric cooking systems, such as gas stoves, which consume less electricity and thus enhance self-sufficiency.
- –
- Red points (higher values): Indicate the use of electric cooking equipment, which increases electricity usage and reduces self-sufficiency.
- Electric Capacity (Q4):
- –
- Blue points (lower values): Indicate a lower contracted electric capacity, such as 30A, suggesting reduced potential energy usage and a positive impact on self-sufficiency.
- –
- Red points (higher values): Suggest higher electric capacity, implying greater potential electricity usage which could decrease self-sufficiency.
- Identifying Key Factors: The SHAP plot reveals which household characteristics most strongly influence electricity self-sufficiency. This insight can guide policymakers to focus on areas such as promoting renewable energy systems in specific housing types.
- Customizing Interventions: Policies can be tailored to address the significant features identified by the SHAP plot. For instance, households with higher electricity bills could be incentivized to adopt solar panels, or those using electric heating might be encouraged to transition to more energy-efficient systems.
- Educational Programs: The SHAP plot highlights the importance of environmental awareness and education. Policymakers could develop initiatives to increase homeowner knowledge about energy management and the benefits of systems like home energy management systems (HEMSs).
- Infrastructure Development: Factors such as total floor area and the number of electrical appliances suggest a need for infrastructure that supports energy-efficient technologies. This could involve developing resources and systems to facilitate the adoption of such technologies.
- The SHAP plot provides valuable insights into the factors driving electricity self-sufficiency in households. Utilizing these insights allows policymakers to make informed, data-driven decisions aimed at promoting renewable energy adoption and enhancing energy efficiency.
- Promote Detached and Independent Housing:
- –
- Governments should encourage the development of larger, independent housing types, such as detached houses, which have shown a positive impact on self-sufficiency. Policies could include incentives for integrating renewable energy systems like solar panels.
- Subsidize Energy-Efficient Appliances and Systems:
- –
- Governments should promote the adoption of energy-efficient or non-electric alternatives, such as gas heating systems or solar water heaters, to counteract the negative impacts of electric floor heating and cooking equipment on self-sufficiency.
- –
- Governments should also encourage households to opt for lower contracted electric capacities to help manage energy consumption and enhance self-sufficiency.
- Energy Consumption Awareness and Reduction:
- –
- Since lower energy bills correlate with higher self-sufficiency, educational campaigns focusing on energy-saving practices and the benefits of energy-efficient appliances could help to reduce household consumption.
- Support for Renewable Energy Installations:
- –
- Governments should incentivize the installation of renewable energy systems, such as solar panels, particularly in housing types with the necessary space and capacity for these installations.
- Tailored Programs for Specific Housing Types:
- –
- Policies should be customized to address the unique needs and potentials of different housing types. For example, governments should offer different incentives for energy upgrades in apartment complexes compared to detached houses.
3.4. Correlation-Heatmap-Based Analysis
- Identifying Key Relationships: The correlation matrix allows policymakers to observe the relationships between different variables, such as energy consumption, generation, pricing, and socio-demographic factors. Strong positive or negative correlations can indicate which factors most influence the ESSR.
- Targeting Energy-Efficiency Programs: By understanding which variables are strongly correlated with a high ESSR, policymakers can design targeted interventions to improve energy efficiency. For instance, if the matrix shows a strong correlation between the ESSR and specific types of appliances, energy-efficiency programs could focus on upgrading those appliances.
- Enhancing Energy Self-Sufficiency: The matrix can highlight the factors that contribute to or detract from household electricity self-sufficiency. This insight can guide policies that incentivize the adoption of renewable energy sources like solar panels or home battery storage systems, which are critical for increasing self-sufficiency.
- Policy Evaluation and Adjustment: Over time, as policies are implemented, the correlation matrix can be used to assess the impact of these policies by comparing changes in correlations before and after implementation, helping to refine and improve energy policies continuously.
3.4.1. ESSR Is Negatively Correlated with Housing Type (Q2)
- Housing Type (Q2): The survey’s housing type question (Q2) categorizes households into different types, such as apartments and detached houses. The type of housing plays a crucial role in various aspects of energy consumption and the ability to achieve self-sufficiency. Factors such as the availability of space for installing solar panels, the quality of insulation, and the overall energy needs of the household are directly influenced by the type of housing.
- Negative Correlation: When two variables are negatively correlated, it means that as one variable increases, the other tends to decrease. In this context, a negative correlation between the electricity self-sufficiency rate and housing type (Q2) implies that certain housing types are associated with lower electricity self-sufficiency.
- Implications of this Negative Correlation—Apartments versus Detached Houses: Apartments or smaller housing units generally have less roof space available for the installation of solar panels, which limits their potential for energy self-sufficiency. In contrast, detached houses usually offer more space, making it easier to install larger or multiple solar panels, thus enhancing the household’s ability to generate its own electricity.
- Energy Demand and self-sufficiency: Different housing types come with varying energy demands and levels of efficiency. For instance, larger homes tend to have higher energy requirements but also offer more opportunities to utilize renewable energy sources. On the other hand, smaller or more densely situated homes may not only have reduced energy demands but also less capacity for generating their own electricity, which can result in lower self-sufficiency rates.
- Policy implication: The observed negative correlation between the electricity self-sufficiency rate and housing type indicates that the type of dwelling significantly influences a household’s ability to achieve energy self-sufficiency. Policymakers should take these differences into account when developing energy policies or programs. Tailored incentives for renewable energy installations could be particularly beneficial in housing types that typically show lower self-sufficiency rates.
3.4.2. ESSR Is Negatively Correlated with Fee Plan (Q3)
- Fee Plan (Q3): The fee plan question (Q3) in the survey refers to the type of electricity pricing or payment plan that households are enrolled in. This could include fixed-rate plans, time-of-use pricing, or other types of billing structures. Different fee plans might incentivize or de-incentivize certain behaviors related to energy use and the adoption of renewable energy sources such as solar panels and fuel cells.
- Implications of the Negative Correlation-Fixed-Rate Plans: Households on a fixed-rate plan may have less motivation to manage their electricity usage carefully since their costs do not vary with consumption. This could lead to a lower ESSR if these households are less likely to invest in renewable energy systems that would enhance self-sufficiency.
- Time-of-Use (TOU) Plans: Conversely, TOU plans, which charge different rates at different times of day, might encourage more strategic use of electricity but could also be associated with lower self-sufficiency if households on these plans do not invest in storage solutions or renewable energy systems that align with their usage patterns.
- Incentives for Renewable Energy: Some fee plans may not provide sufficient incentives for households to invest in renewable energy systems (e.g., solar panels) that would improve their self-sufficiency. For example, if a plan offers very low rates, the financial return on investing in self-generation might be less attractive, leading to a lower ESSR.
- Policy Implications: The negative correlation suggests that households on certain fee plans are less likely to achieve high levels of electricity self-sufficiency, possibly due to the structure of the fee plan not encouraging or supporting investments in renewable energy or efficient energy use. The negative correlation between the ESSR and fee plan (Q3) indicates that the type of electricity pricing plan that a household is enrolled on can significantly impact its energy self-sufficiency. Households on plans that do not incentivize or support self-generation and efficient energy use may have a lower ESSR. This insight could be valuable for utility companies and policymakers aiming to design fee structures that better encourage the adoption of renewable energy technologies and improve overall energy self-sufficiency.
3.4.3. ESSR Is Positively Correlated with Floor Heating Type (Q10)
- Floor Heating (Q10): In this survey, Q10 asks respondents whether their household is equipped with a floor heating system or not, and what type of floor system they are using.
- Integration with Renewable Energy: Most households with floor heating systems use renewable-energy-based floor heating systems, such as solar panels and fuel cells. It is well known to households that floor heating is typically a consistent and significant energy draw, and it makes sense for households to seek self-sufficiency through renewable energy sources to offset the cost, thus increasing their ESSR.
- Potential for Energy Storage: Households that utilize floor heating may also invest in energy storage solutions to balance the load during non-peak production times. During the day, when solar panels produce excess energy, this energy can be stored and later used for heating the home during the evening or at night. This practice can further enhance the ESSR.
- Household Investment in Energy Systems: The presence of floor heating systems may indicate a household’s overall investment in modern, efficient energy systems. Such investments often go hand in hand with a focus on sustainability and self-sufficiency, which contributes to a higher ESSR.
- Energy Use and Behavioral Patterns: The correlation might also reflect the fact that households with floor heating are more conscious of their energy use and are therefore more proactive in adopting technologies that support self-sufficiency, like solar panels and energy storage systems.
- Policy Implications: The positive correlation between floor heating (Q10) and the ESSR indicates that households equipped with floor heating systems tend to have a higher electricity self-sufficiency rate. This is because most of the households use solar power and fuel cell-operated floor heating systems, and the likelihood is that these households are more invested in achieving energy self-sufficiency. This insight can be valuable for policymakers and energy planners when designing programs to enhance household energy efficiency and self-sufficiency, particularly in promoting the integration of efficient heating systems with renewable energy sources.
3.4.4. Correlation among Household Variable
3.5. Confusion Matrix
4. Policy Implications
4.1. Promotion of Renewable Energy and Storage Systems
- Incentivization of renewable technologies: Policies should focus on providing financial incentives such as subsidies, tax breaks, and low-interest loans to encourage the installation of renewable energy systems such as solar panels and fuel cells. This can enhance the electricity self-sufficiency of households and reduce the dependency on the grid.
- Energy storage solutions: Policies should promote the development and adoption of energy storage systems, allowing households to store excess energy generated during peak production times and use it during periods of low production.
4.2. Regulatory Framework Adjustments
- Flexible tariffs and net metering: Introducing flexible tariffs that reflect energy demand and supply variations and enhancing net metering policies can encourage households to produce their own electricity and feed excess power back into the grid.
- Support for microgrids: Developing regulatory frameworks that support microgrids can enhance electricity self-sufficiency in localized areas, especially in remote or underserved regions.
4.3. Public Engagement and Education
- Awareness campaigns: Governments should run campaigns to educate the public about the benefits of energy self-sufficiency and renewable energy technologies. This includes information on available technologies, financial benefits, and the environmental impact.
- Community participation: Engaging communities in energy projects can lead to greater acceptance and success of renewable energy initiatives. Local governments should involve communities in co-designing policies and projects that address local needs and capacities.
4.4. Financial Mechanisms
- Green financing options: Providing green financing options, such as low-interest loans and grants for renewable energy systems, can make it easier for households to transition to self-sufficient energy solutions.
- Carbon pricing and financial penalties: Implementing carbon pricing can make renewable energy more competitive compared to fossil fuels, encouraging the adoption of cleaner energy solutions. Financial penalties for excessive carbon emissions can further support this transition.
4.5. Equity and Inclusivity
- Support for vulnerable populations: Policies should address financial barriers faced by low-income households in adopting renewable energy technologies. Targeted subsidies, grants, and educational programs can ensure that all segments of the population benefit from energy self-sufficiency.
- Regional policy adaptation: Policies should be adaptable to regional contexts, considering varying energy needs and resources. For instance, areas with abundant sunlight should focus on solar energy, while those with wind resources might prioritize wind energy.
4.6. Urban Planning and Building Standards
- Energy-efficient building codes: Updating building codes to require higher energy efficiency standards in new constructions can significantly reduce energy demand. Retrofitting existing buildings with energy-efficient technologies should also be encouraged through policy measures.
- Integration of renewable energy in urban planning: Urban planning should incorporate renewable energy considerations, such as the placement of solar panels on rooftops and the inclusion of green spaces that support energy-efficient designs.
4.7. Monitoring and Evaluation
- Data-driven policymaking: Continuous monitoring of energy self-sufficiency rates and the effectiveness of implemented policies is crucial. Policies should be adaptable based on data and feedback to ensure that they remain effective and relevant.
5. Conclusions
6. Future Directions and Challenges
6.1. Future Directions
6.1.1. Expansion to Different Geographic Contexts
- Application in diverse regions: Future studies could apply the machine learning-based models and frameworks proposed in this work to energy data collected from various geographic regions, particularly in areas with different levels of access to renewable energy resources. This approach would help us to assess the generalizability of the models and allow for their adaptation to local conditions. The energy policies discussed in this work can also be implemented in these diverse regions. After gathering feedback from data over time, these policies can be adjusted accordingly to better meet regional needs and improve effectiveness.
6.1.2. Policy and Economic Impacts
- Impact of policy changes on adoption rates: Future work could include scenario analysis to predict how changes in government policies (e.g., subsidies, tariffs) might impact the adoption rates of renewable energy technologies and subsequent electricity self-sufficiency rate.
- Economic viability studies: Expanding the analysis to include detailed economic assessments, such as cost–benefit analyses and return on investment calculations for households and governments, would provide a more comprehensive understanding of the financial implications of self-sufficiency initiatives.
6.1.3. Longitudinal Studies
- Long-term impact analysis: Conducting longitudinal studies to track the long-term impact of adopting renewable energy on household self-sufficiency, grid stability, and overall energy costs could provide valuable insights for both policymakers and researchers.
- Behavioral studies: Future research could investigate how consumer behavior changes over time with increased awareness and accessibility to renewable energy technologies and the subsequent effects on energy consumption patterns.
6.2. Challenges
6.2.1. Trade-Off between Accuracy and Interpretability
- While more complex models can offer better predictive accuracy, they often do so at the expense of interpretability. This is a limitation for policymakers and stakeholders who need to understand the model’s decision-making process and should focus on developing models that balance these two aspects.
6.2.2. Applicability across Different Contexts
- For the full generalization of energy policies across different geographic or socioeconomic contexts, future research should focus on testing and validating models in diverse settings to ensure their robustness.
6.2.3. Policy Uncertainty Due to Economic Constraints
- The impact of potential changes in government policies, such as subsidy removal or changes in energy pricing, introduces uncertainty in long-term planning. This limitation underscores the need for robust scenario planning in future work.
6.2.4. Economic Barriers
- The economic feasibility of large-scale renewable energy adoption, especially in lower-income regions, remains a significant limitation. Future research should focus on developing cost-effective solutions that are accessible to a broader population.
6.2.5. Energy Storage Constraints
- Current limitations in energy storage technology restrict the full potential of renewable energy to achieve self-sufficiency. This is a significant technological barrier that needs to be addressed by policymakers.
6.2.6. Grid Integration Challenges
- The integration of renewable energy into existing grid infrastructures presents technical challenges, such as managing energy variability and ensuring grid stability. These limitations need to be carefully considered by energy stakeholders and governments at the macro level.
6.2.7. Grid Modernization and Energy Infrastructure
- Development of smart grids: Modernizing the grid to support decentralized energy production is crucial. Implementing smart grids can help in managing energy flows more efficiently, especially with the integration of renewable energy sources that have variable outputs.
- Energy storage solutions: Policies should promote the development and adoption of energy storage systems, allowing households to store excess energy generated during peak production times and use it during periods of low production.
Supplementary Materials
Author Contributions
Funding
Data Availability Statement
Acknowledgments
Conflicts of Interest
Abbreviations
| SHAP | SHapley Additive exPlanations |
| HEMS | Home energy management system |
| nZEHs | Net-zero-energy houses |
| LightGBM | Light gradient boosting machine |
| ESSR | Electricity self-sufficiency rate |
| MAE | Mean absolute error |
| RESs | Renewable energy sources |
| ANN | Artificial neural network |
| FFNN | Feed-forward neural network |
References
- Zhang, X.; Zhang, H.; Yuan, J. Economic growth, energy consumption, and carbon emission nexus: Fresh evidence from developing countries. Environ. Sci. Pollut. Res. 2019, 26, 26367–26380. [Google Scholar] [CrossRef] [PubMed]
- Chanthakett, A.; Arif, M.T.; Khan, M.M.K.; Subhani, M. Hydrogen production from municipal solid waste using gasification method. In Hydrogen Energy Conversion and Management; Elsevier: Amsterdam, The Netherlands, 2024; pp. 103–131. [Google Scholar] [CrossRef]
- Singh, N.K.; Fukushima, T.; Nagahara, M. Gradient Boosting Approach to Predict Energy-Saving Awareness of Households in Kitakyushu. Energies 2023, 16, 5998. [Google Scholar] [CrossRef]
- High Efficiency Plants and Building Integrated Renewable Energy Systems. In Handbook of Energy Efficiency in Buildings; Elsevier: Amsterdam, The Netherlands, 2019; pp. 441–595. [CrossRef]
- Naterer, G.F.; Dincer, I.; Zamfirescu, C. Hydrogen Production from Nuclear Energy; Springer London: London, UK, 2013. [Google Scholar] [CrossRef]
- Yoro, K.O.; Daramola, M.O. CO2 emission sources, greenhouse gases, and the global warming effect. In Advances in Carbon Capture; Elsevier: Amsterdam, The Netherlands, 2020; pp. 3–28. [Google Scholar] [CrossRef]
- Carnerero, A.D.; Tanaka, T.; Li, M.; Hatanaka, T.; Wasa, Y.; Hirata, K.; Ushifusa, Y.; Ida, T. Net-Zero Energy House-oriented Linear Programming for the Sizing Problem of Photovoltaic Panels and Batteries. IEEE Access 2024, 12, 80429–80441. [Google Scholar] [CrossRef]
- Tian, J.; Yu, L.; Xue, R.; Zhuang, S.; Shan, Y. Global low-carbon energy transition in the post-COVID-19 era. Appl. Energy 2022, 307, 118205. [Google Scholar] [CrossRef]
- Singh, N.K.; Fukushima, T.; Nagahara, M. Gradient Boosting Approach to Predict Zero Carbon Achievement of Households in Kitakyushu. In Proceedings of the 2023 9th International Conference on Control, Decision and Information Technologies (CoDIT), Rome, Italy, 3–6 July 2023. [Google Scholar] [CrossRef]
- Santamouris, M.; Cartalis, C.; Synnefa, A.; Kolokotsa, D. On the impact of urban heat island and global warming on the power demand and electricity consumption of buildings—A review. Energy Build. 2015, 98, 119–124. [Google Scholar] [CrossRef]
- Dong, K.; Hochman, G.; Timilsina, G.R. Do drivers of CO2 emission growth alter overtime and by the stage of economic development? Energy Policy 2020, 140, 111420. [Google Scholar] [CrossRef]
- Schleussner, C.-F.; Rogelj, J.; Schaeffer, M.; Lissner, T.; Licker, R.; Fischer, E.M.; Knutti, R.; Levermann, A.; Frieler, K.; Hare, W. Science and policy characteristics of the Paris Agreement temperature goal. Nat. Clim. Chang. 2016, 6, 827–835. [Google Scholar] [CrossRef]
- Moodley, P.; Trois, C. Lignocellulosic biorefineries: The path forward. In Sustainable Biofuels; Elsevier: Amsterdam, The Netherlands, 2021; pp. 21–42. [Google Scholar] [CrossRef]
- Guzović, Z.; Duić, N.; Piacentino, A.; Markovska, N.; Mathiesen, B.V.; Lund, H. Paving the way for the Paris Agreement: Contributions of SDEWES science. Energy 2022, 263, 125617. [Google Scholar] [CrossRef]
- Ashouri, M.; Haghighat, F.; Fung, B.C.M.; Lazrak, A.; Yoshino, H. Development of building energy saving advisory: A data mining approach. Energy Build. 2018, 172, 139–151. [Google Scholar] [CrossRef]
- Nejat, P.; Jomehzadeh, F.; Taheri, M.M.; Gohari, M.; Abd Majid, M.Z. A global review of energy consumption, CO2 emissions and policy in the residential sector (with an overview of the top ten CO2 emitting countries). Renew. Sustain. Energy Rev. 2015, 43, 843–862. [Google Scholar] [CrossRef]
- Ramirez Camargo, L.; Nitsch, F.; Gruber, K.; Dorner, W. Electricity self-sufficiency of single-family houses in Germany and the Czech Republic. Appl. Energy 2018, 228, 902–915. [Google Scholar] [CrossRef]
- Li, S.-Y.; Han, J.-Y. The impact of shadow covering on the rooftop solar photovoltaic system for evaluating self-sufficiency rate in the concept of nearly zero energy building. Sustain. Cities Soc. 2022, 80, 103821. [Google Scholar] [CrossRef]
- Harke, F.; Otto, P. Solar Self-Sufficient Households as a Driving Factor for Sustainability Transformation. Sustainability 2023, 15, 2734. [Google Scholar] [CrossRef]
- Colmenar-Santos, A.; Campíñez-Romero, S.; Pérez-Molina, C.; Castro-Gil, M. Profitability analysis of grid-connected photovoltaic facilities for household electricity self-sufficiency. Energy Policy 2012, 51, 749–764. [Google Scholar] [CrossRef]
- Bruni, G.; Cordiner, S.; Mulone, V. Domestic distributed power generation: Effect of sizing and energy management strategy on the environmental efficiency of a photovoltaic-battery-fuel cell system. Energy 2014, 77, 133–143. [Google Scholar] [CrossRef]
- Ozcan, M. The role of renewables in increasing Turkey’s self-sufficiency in electrical energy. Renew. Sustain. Energy Rev. 2018, 82, 2629–2639. [Google Scholar] [CrossRef]
- Beckel, C.; Sadamori, L.; Staake, T.; Santini, S. Revealing household characteristics from smart meter data. Energy 2014, 78, 397–410. [Google Scholar] [CrossRef]
- Edwards, R.E.; New, J.; Parker, L.E. Predicting future hourly residential electrical consumption: A machine learning case study. Energy Build. 2012, 49, 591–603. [Google Scholar] [CrossRef]
- Thakur, A.; Shukla, K.A.; Choudhary, A.; Atrey, J. Predictive Analysis of Energy Consumption and Electricity Demand Using Machine Learning Techniques. In Proceedings of the 2023 International Conference on Smart Systems for Applications in Electrical Sciences (ICSSES), Tumakuru, India, 7–8 July 2023; pp. 1–6. [Google Scholar]
- Chou, J.-S.; Tran, D.-S. Forecasting energy consumption time series using machine learning techniques based on usage patterns of residential householders. Energy 2018, 165, 709–726. [Google Scholar] [CrossRef]
- Shang, Y.; Li, S. FedPT-V2G: Security enhanced federated transformer learning for real-time V2G dispatch with non-IID data. Appl. Energy 2024, 358, 122626. [Google Scholar] [CrossRef]
- Tan, M.; Hu, C.; Chen, J.; Wang, L.; Li, Z. Multi-node load forecasting based on multi-task learning with modal feature extraction. Eng. Appl. Artif. Intell. 2022, 112, 104856. [Google Scholar] [CrossRef]
- Zhu, N.; Wang, Y.; Yuan, K.; Yan, J.; Li, Y.; Zhang, K. GGNet: A novel graph structure for power forecasting in renewable power plants considering temporal lead-lag correlations. Appl. Energy 2024, 364, 123194. [Google Scholar] [CrossRef]
- Wang, B.; Wang, Y.; Qin, K.; Xia, Q. Detecting transportation modes based on LightGBM classifier from GPS trajectory data. In Proceedings of the 2018 26th International Conference on Geoinformatics, Kunming, China, 28–30 June 2018; pp. 1–7. [Google Scholar]
- Ke, G.; Meng, Q.; Finley, T.; Wang, T.; Chen, W.; Ma, W.; Ye, Q.; Liu, T. Lightgbm: A highly efficient gradient boosting decision tree. In Proceedings of the Advances in Neural Information Processing Systems, Long Beach, CA, USA, 4–9 December 2017. [Google Scholar]
- Wang, Y.; Wang, T. Application of Improved LightGBM Model in Blood Glucose Prediction. Appl. Sci. 2020, 10, 3227. [Google Scholar] [CrossRef]
- Nagahara, M. Sparsity Methods for Systems and Control; Now Publishers: Norwell, MA, USA, 2020. [Google Scholar]
- Nohara, Y.; Matsumoto, K.; Soejima, H.; Nakashima, N. Explanation of machine learning models using shapley additive explanation and application for real data in hospital. Comput. Methods Programs Biomed. 2022, 214, 106584. [Google Scholar] [CrossRef]


| Variables | Energy Type | Unit |
|---|---|---|
| Electrical energy generated from solar panels | Watt-hour | |
| Electrical energy generated from fuel cells | Watt-hour | |
| Total electrical energy consumption | Watt-hour |
| Predicted Positive | Predicted Negative | |
|---|---|---|
| Actual Positive | True Positive (TP) | False Negative (FN) |
| Actual Negative | False Positive (FP) | True Negative (TN) |
| Precision | Recall | F1-Score | Support | |
|---|---|---|---|---|
| 0 | 0.89 | 0.74 | 0.81 | 57 |
| 1 | 0.90 | 0.97 | 0.93 | 144 |
| Accuracy | 0.90 | 201 | ||
| Macro Avg | 0.90 | 0.85 | 0.87 | 201 |
| Weighted Avg | 0.90 | 0.90 | 0.90 | 201 |
Disclaimer/Publisher’s Note: The statements, opinions and data contained in all publications are solely those of the individual author(s) and contributor(s) and not of MDPI and/or the editor(s). MDPI and/or the editor(s) disclaim responsibility for any injury to people or property resulting from any ideas, methods, instructions or products referred to in the content. |
© 2024 by the authors. Licensee MDPI, Basel, Switzerland. This article is an open access article distributed under the terms and conditions of the Creative Commons Attribution (CC BY) license (https://creativecommons.org/licenses/by/4.0/).
Share and Cite
Singh, N.K.; Nagahara, M. LightGBM-, SHAP-, and Correlation-Matrix-Heatmap-Based Approaches for Analyzing Household Energy Data: Towards Electricity Self-Sufficient Houses. Energies 2024, 17, 4518. https://doi.org/10.3390/en17174518
Singh NK, Nagahara M. LightGBM-, SHAP-, and Correlation-Matrix-Heatmap-Based Approaches for Analyzing Household Energy Data: Towards Electricity Self-Sufficient Houses. Energies. 2024; 17(17):4518. https://doi.org/10.3390/en17174518
Chicago/Turabian StyleSingh, Nitin Kumar, and Masaaki Nagahara. 2024. "LightGBM-, SHAP-, and Correlation-Matrix-Heatmap-Based Approaches for Analyzing Household Energy Data: Towards Electricity Self-Sufficient Houses" Energies 17, no. 17: 4518. https://doi.org/10.3390/en17174518
APA StyleSingh, N. K., & Nagahara, M. (2024). LightGBM-, SHAP-, and Correlation-Matrix-Heatmap-Based Approaches for Analyzing Household Energy Data: Towards Electricity Self-Sufficient Houses. Energies, 17(17), 4518. https://doi.org/10.3390/en17174518