
Research on Wind Turbine Fault Detection Based on CNN-LSTM


Abstract
1. Introduction
2. Related Research
2.1. Research on Sensor-Based Fault Detection Methods
2.2. Research on Fault Detection Methods Based on Feature Extraction
2.3. Research on Neural Network-Based Fault Detection Methods
3. Methodology
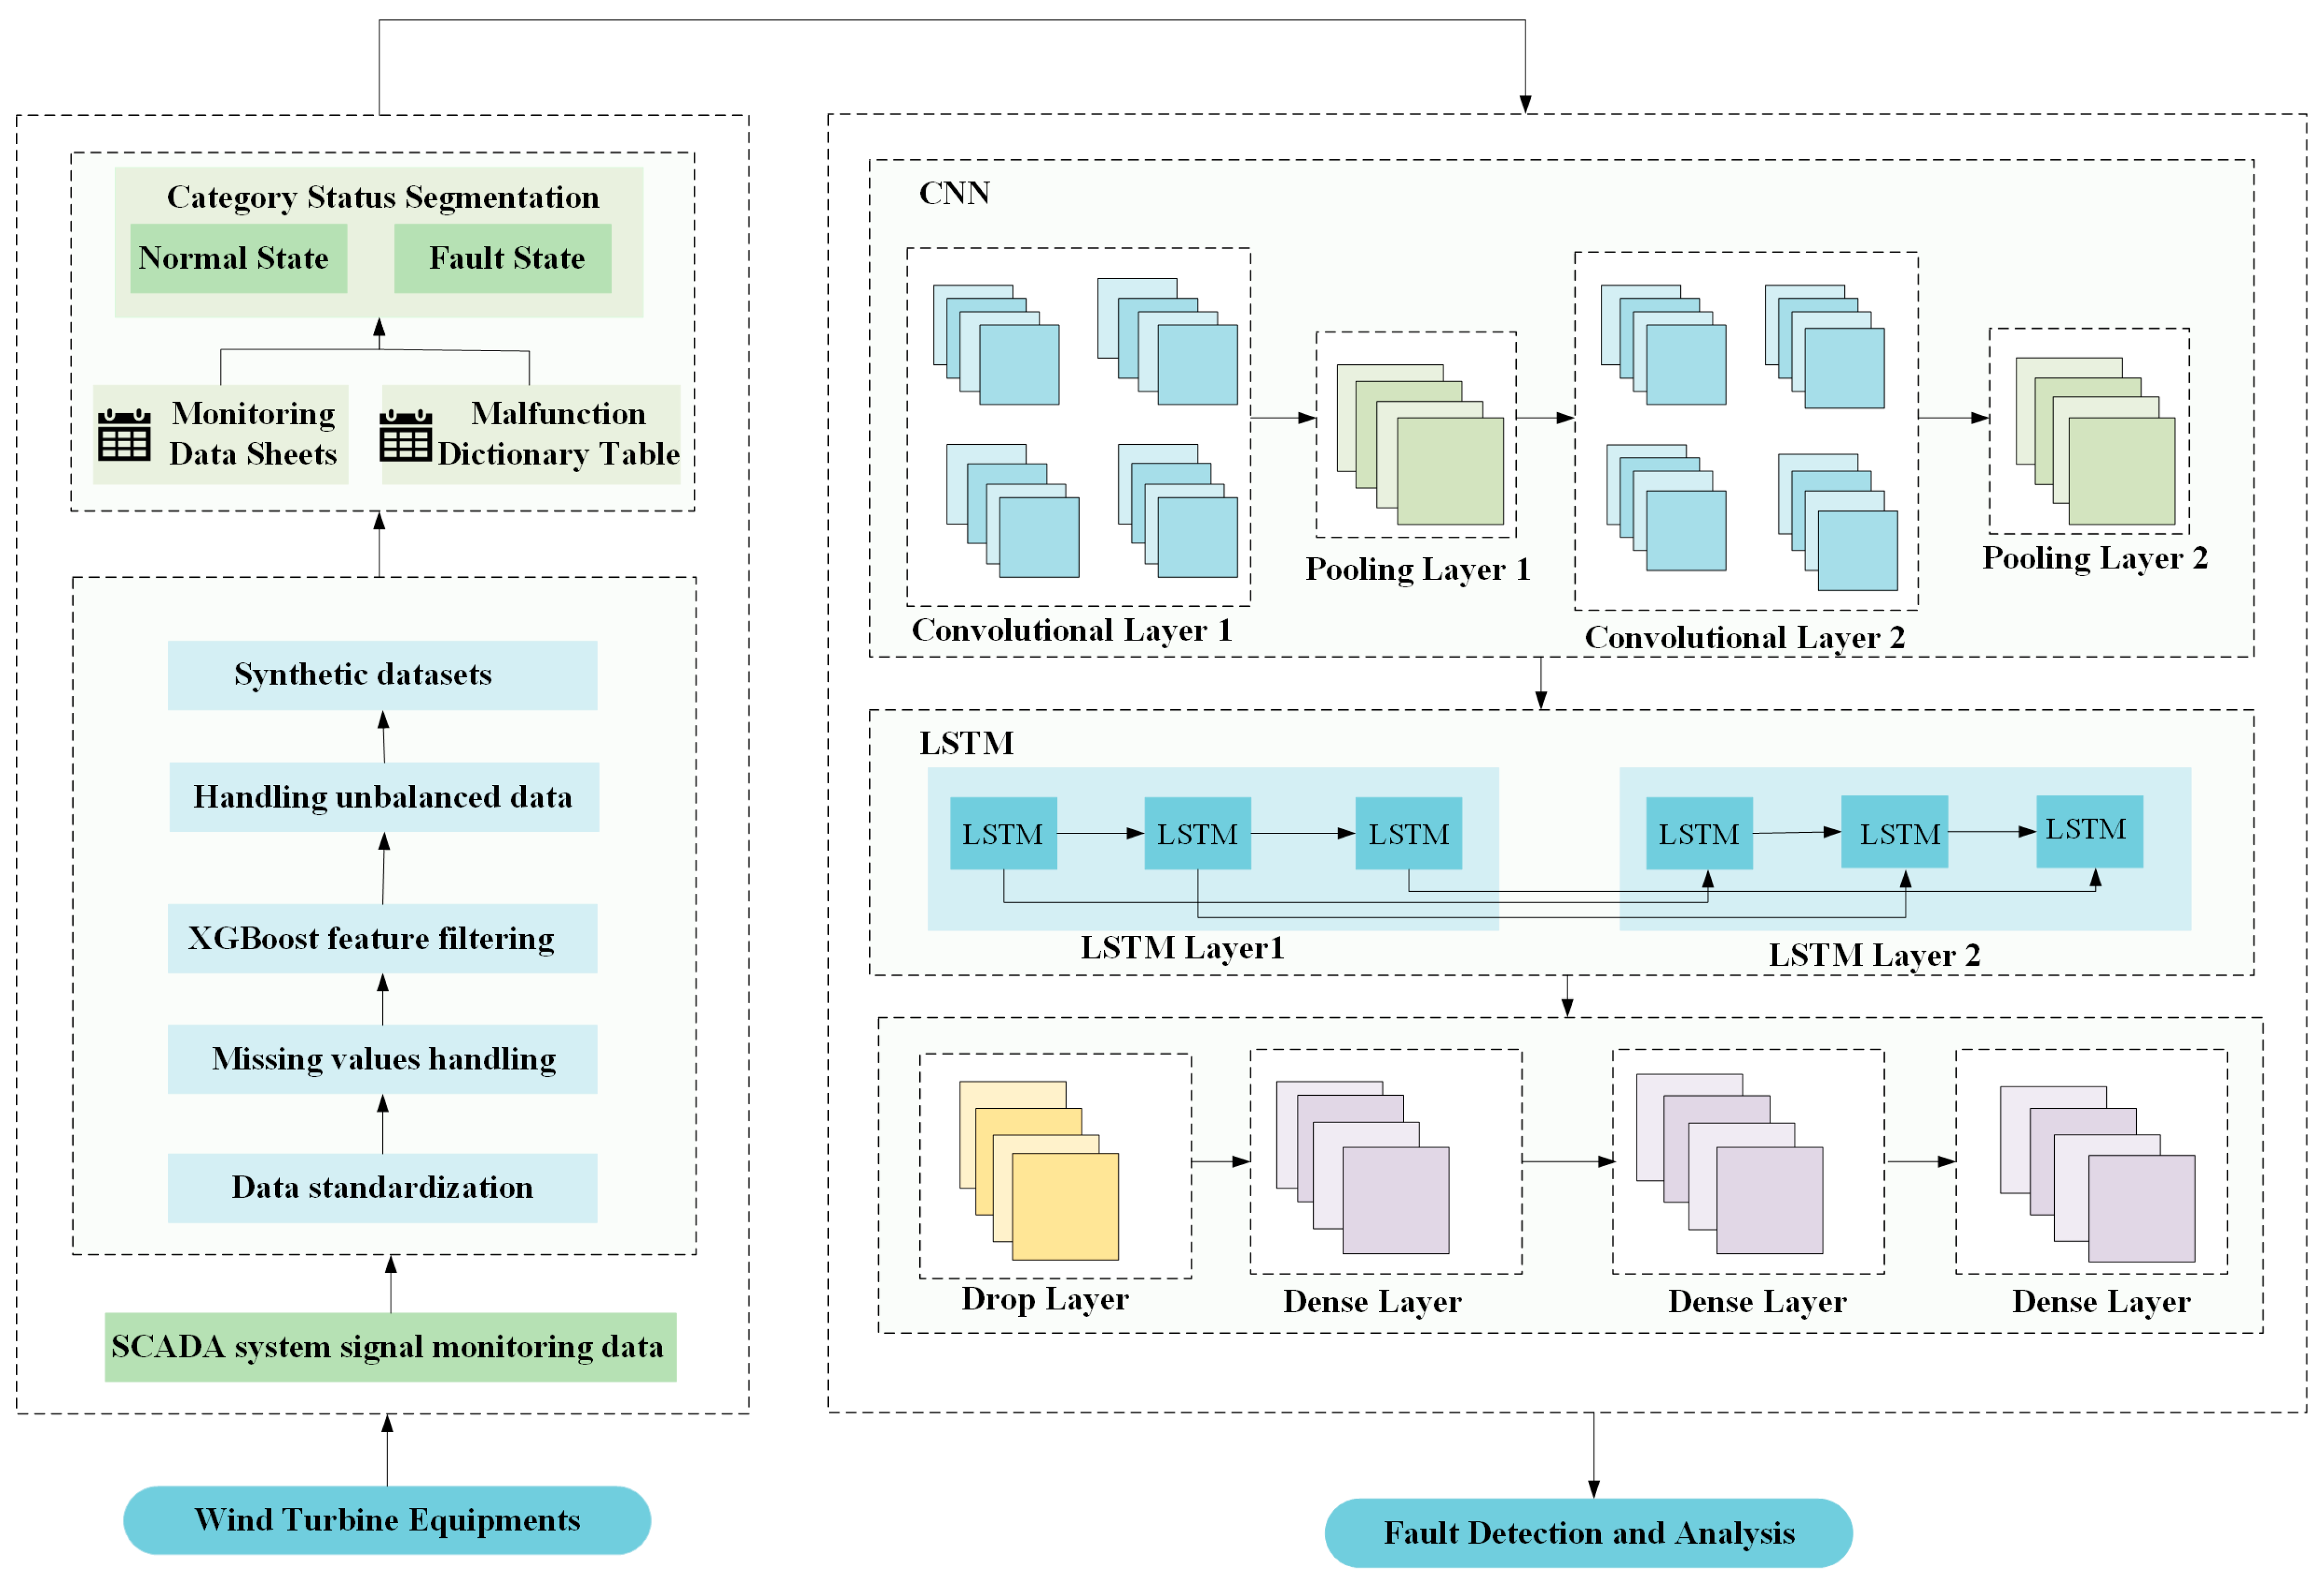
3.1. Flowchart of Fault Detection Method
3.2. Data Processing
3.2.1. Datasets
3.2.2. Fault Type Selection
- Yaw system faults: Common yaw system faults include different types of yaw position sensor faults, yaw position faults, yaw speed faults, and so on [49]. In the process of following the wind, due to the inability to determine the wind direction and strength of the natural wind, the yaw system needs to change constantly according to the actual situation, which makes the gears subject to alternating loads, resulting in long-term and sustained damage to the gears, affecting the wind generator cabin to accurately determine the wind direction and making it difficult for SCADA system to quickly detect and alarm.
- Electrical system faults: The faults that often occur in the electrical system are low insulation resistance, winding short circuits, and brush slip ring failure [43]. Low insulation resistance is usually caused by the heat, sand, and dust generated by friction during the high-speed operation of bearings; winding short-circuit faults are mainly caused by friction and collision between the outside world and the internal winding of the motor.
- Pitch system faults: Whenever the wind speed rises or falls rapidly, the pitch will be severely tested. The pitch system mainly includes faults such as the high temperature of the pitch motor and the high current of the pitch motor [50]. The excessive temperature of the pitch motor will damage the rotor and bearings of the pitch machine, and the operation overload will even cause the line aging and short circuit; the excessive current of the pitch motor will cause the internal line damage and aging, and the current information will be misreported after the failure of the current transformer, and the power of the pitch will be missing.
- Gearbox faults: Wind turbine failure in the gearbox damage in the unit components is the highest, and gearbox disassembly and installation are more complex, with the failure of the entire wind turbine and maintenance difficulties. According to the morphology of gear damage and damage process or mechanism, the form of failure is usually divided into four categories: tooth fracture, tooth fatigue, tooth wear or scratches, and plastic deformation [42].
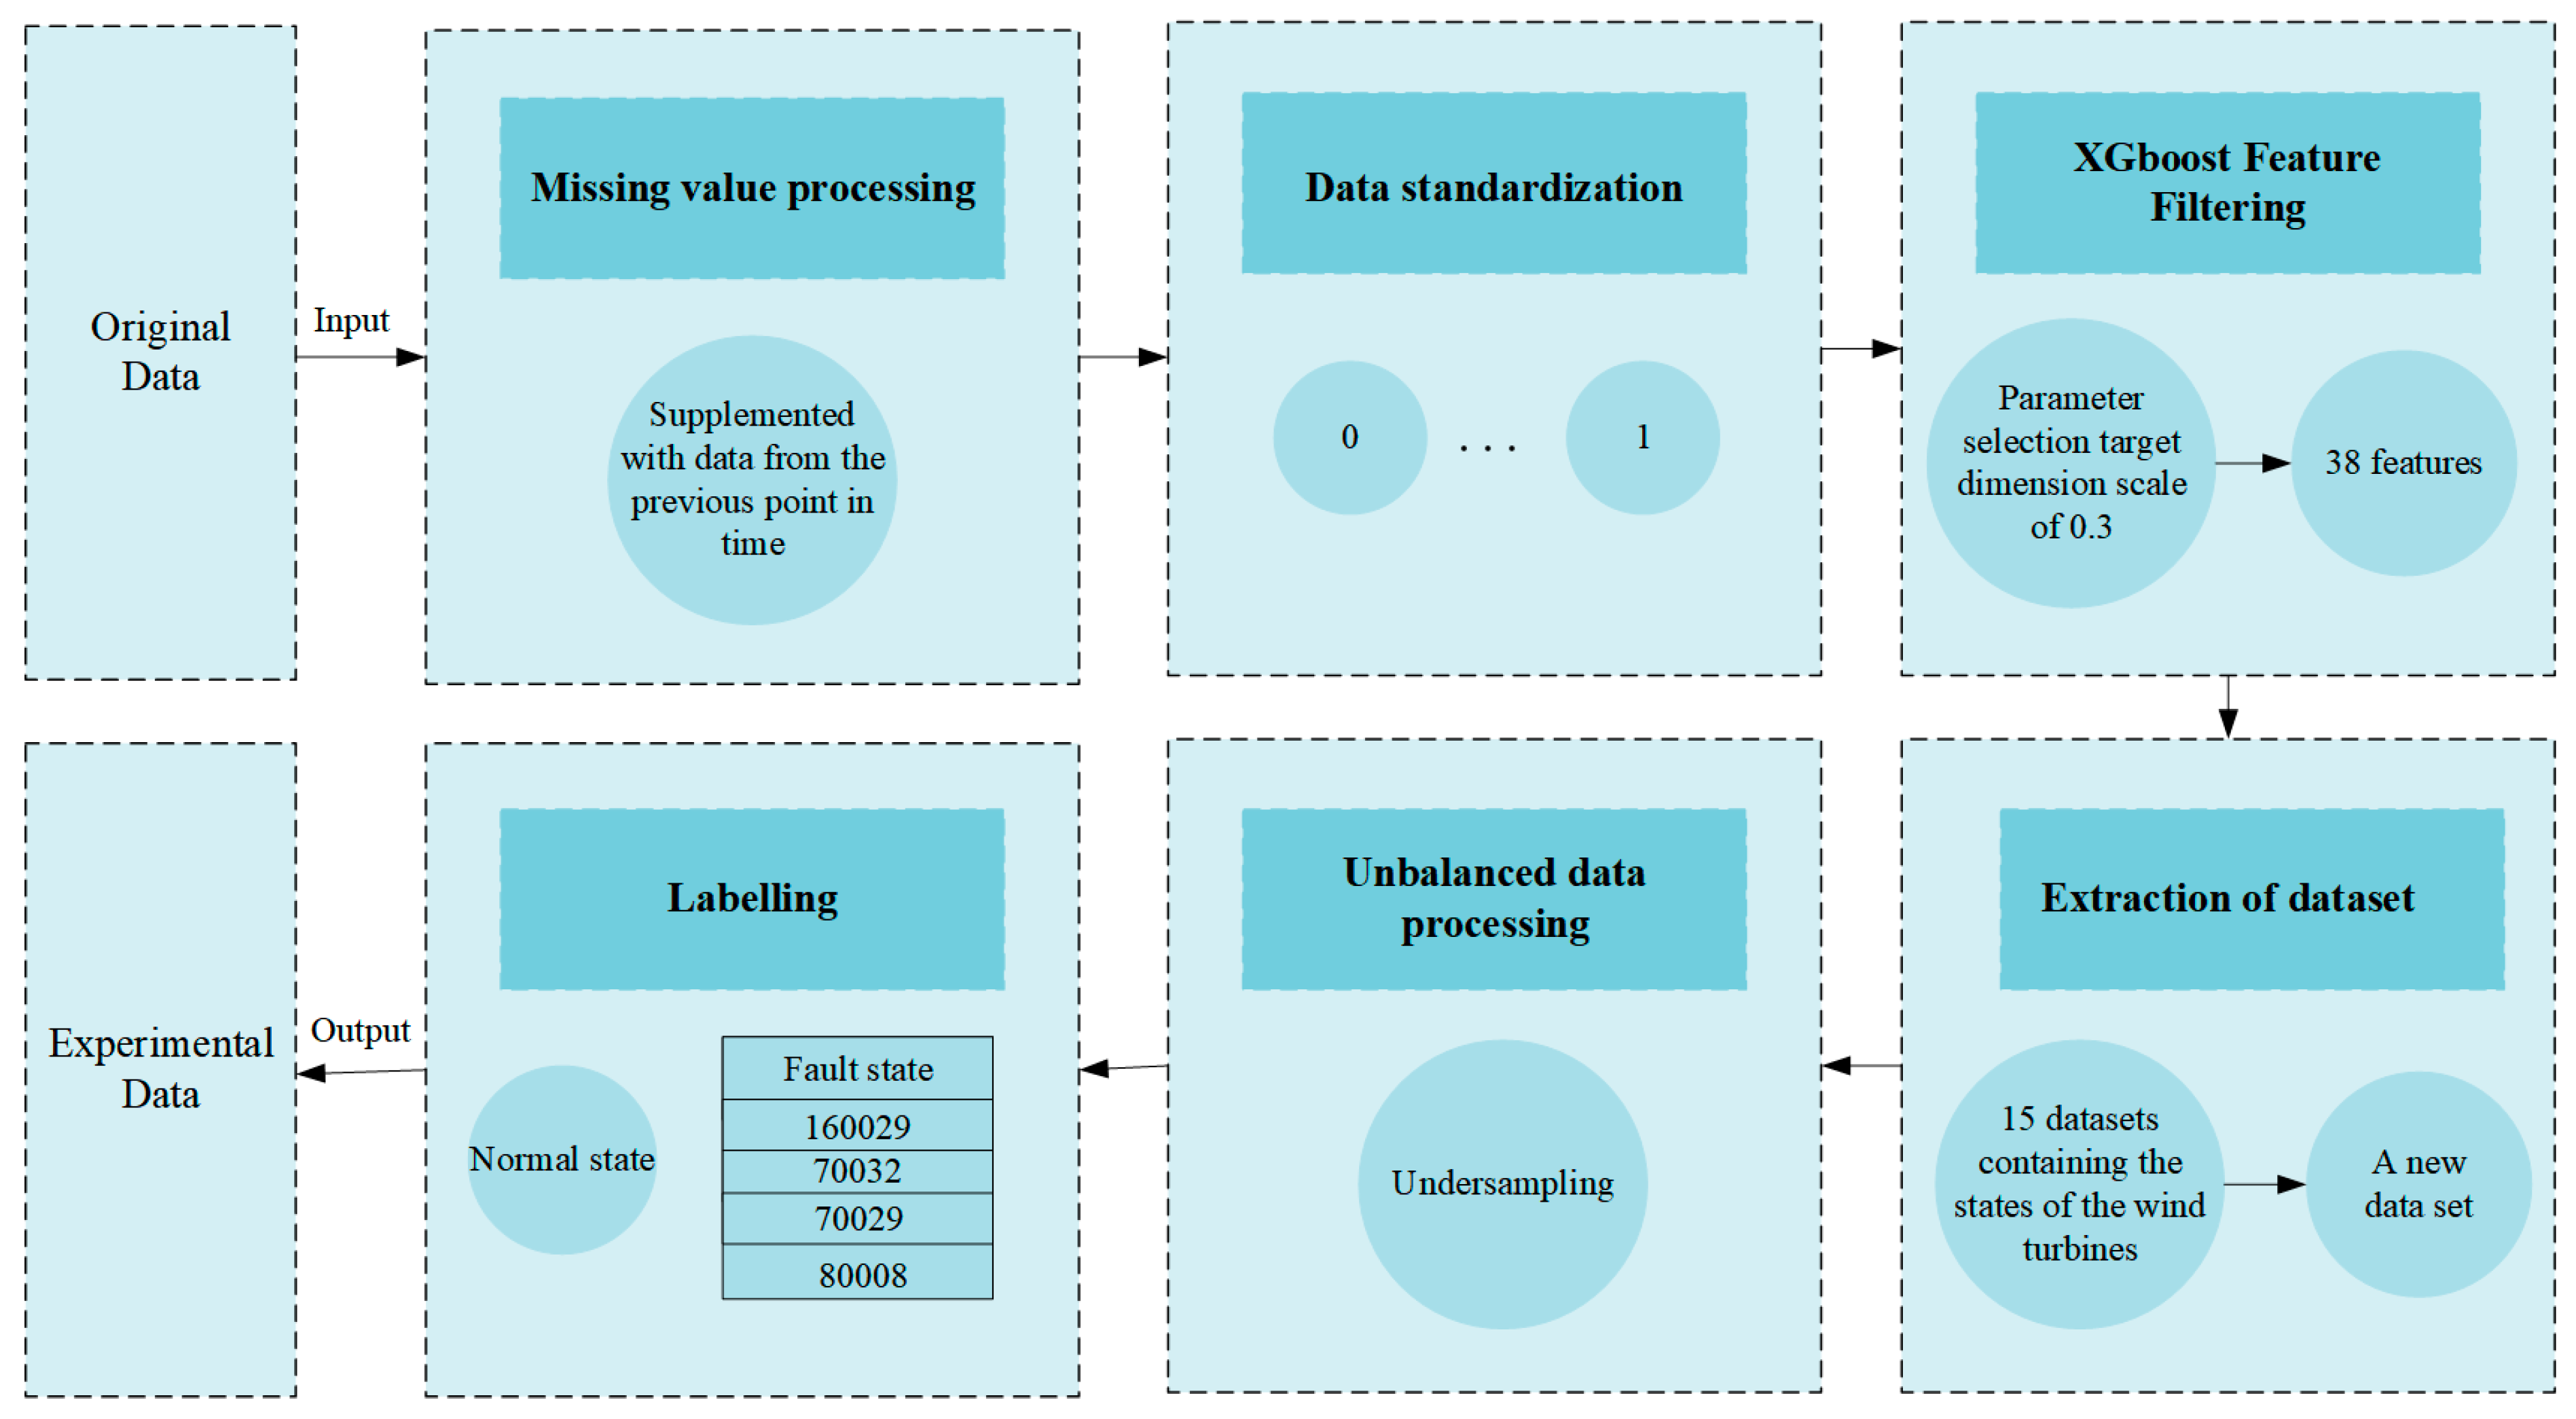
3.2.3. Data Preprocessing
- Missing value processing: for the occasional missing parameters caused by equipment and transmission factors, use the data of the previous moment to fill in the missing values.
- Data normalization: using normalization methods to deal with different dimensions of the experimental data, ensure that the data distribution is between 0 and 1.
- XGboost feature filtering: using the XGboost algorithm to select the top 30% of the original features in descending order of relevance to downscale the number of features.
- Extraction of dataset: the condition monitoring data from 15 wind turbines of the same model are processed according to steps 1, 2, and 3, and then fused into a complete dataset.
- Unbalanced data processing: since the normal operation samples are much more than the fault samples, the under-sampling method is used to reduce the normal samples to balance the number of samples of various types in the dataset.
- Labeling: the textual descriptions of the operating states in the samples are transformed into the form of numerical labels, which are used to train the model.
3.3. Wind Turbine Fault Detection Based on CNN-LSTM
3.3.1. Model Selection
- Aiming at the existence of a local correlation between some parameter variables of wind motor, the convolutional neural network is used to achieve the aggregation of local features to carry out multi-fault detection;
- For the global correlation between some parameter variables of the wind turbine, the full connection method is used to achieve the aggregation of global features to carry out multi-fault detection.
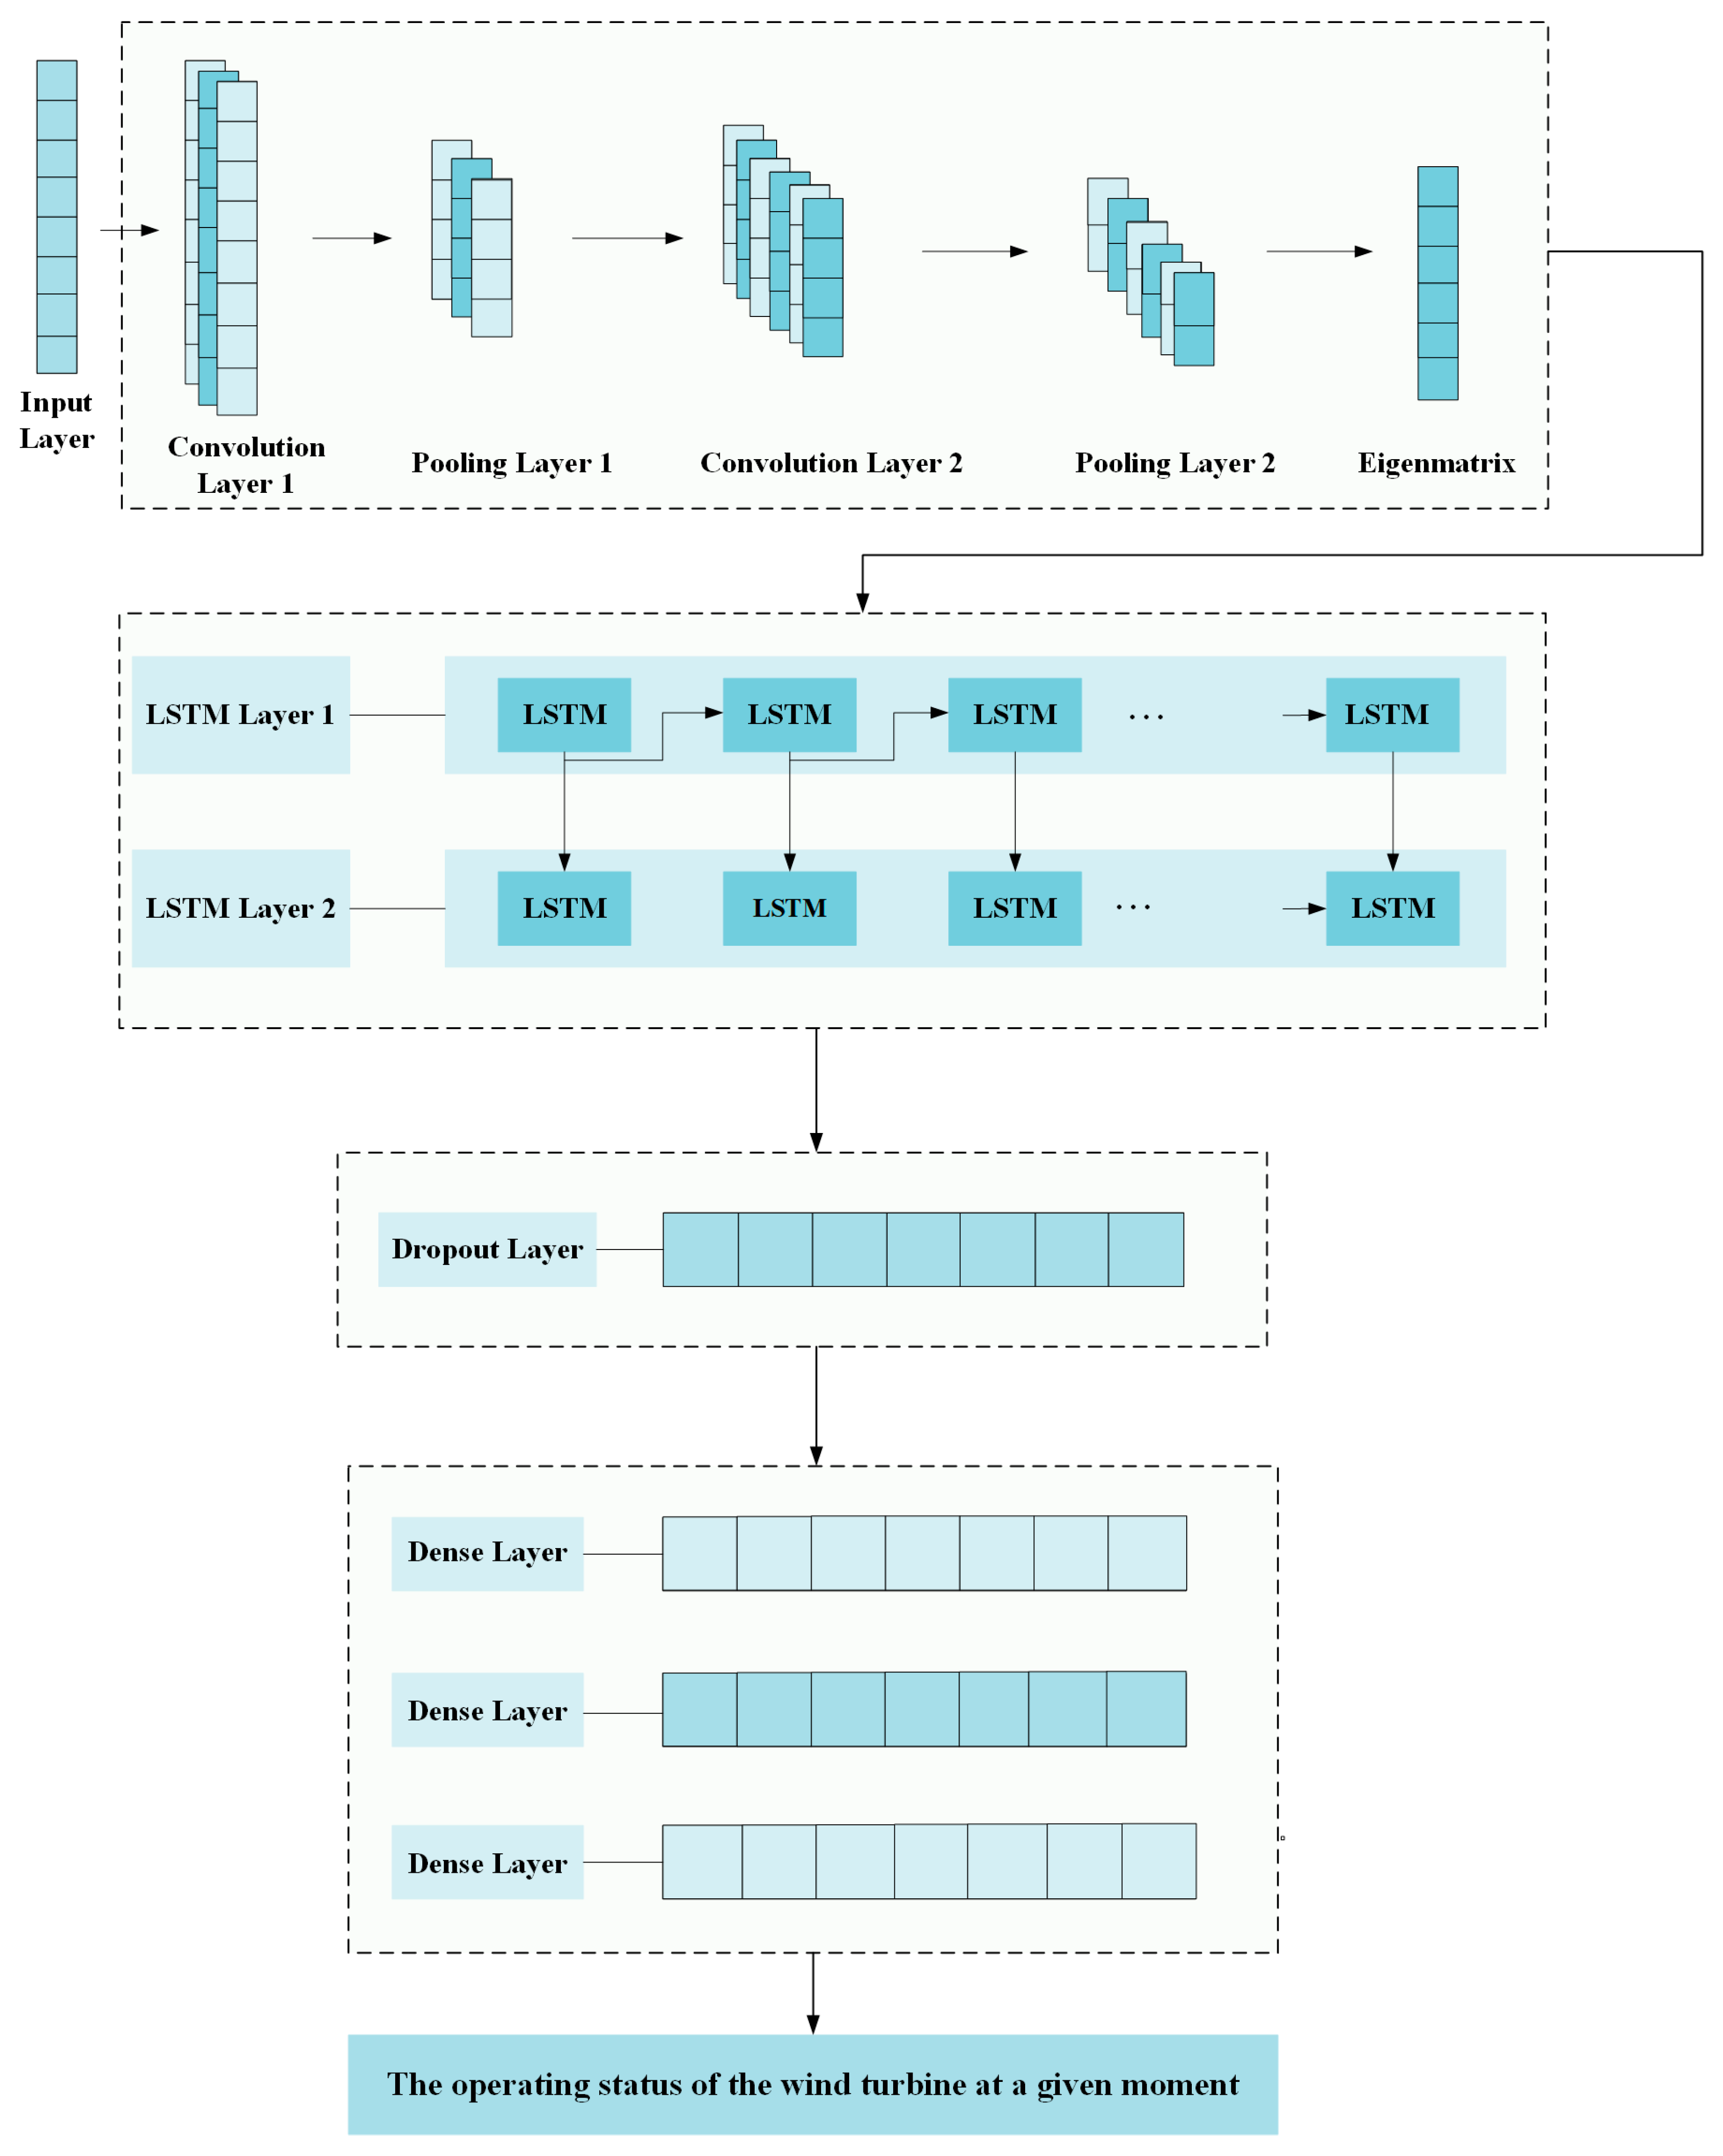
3.3.2. The Structure of CNN-LSTM Model
- (1)
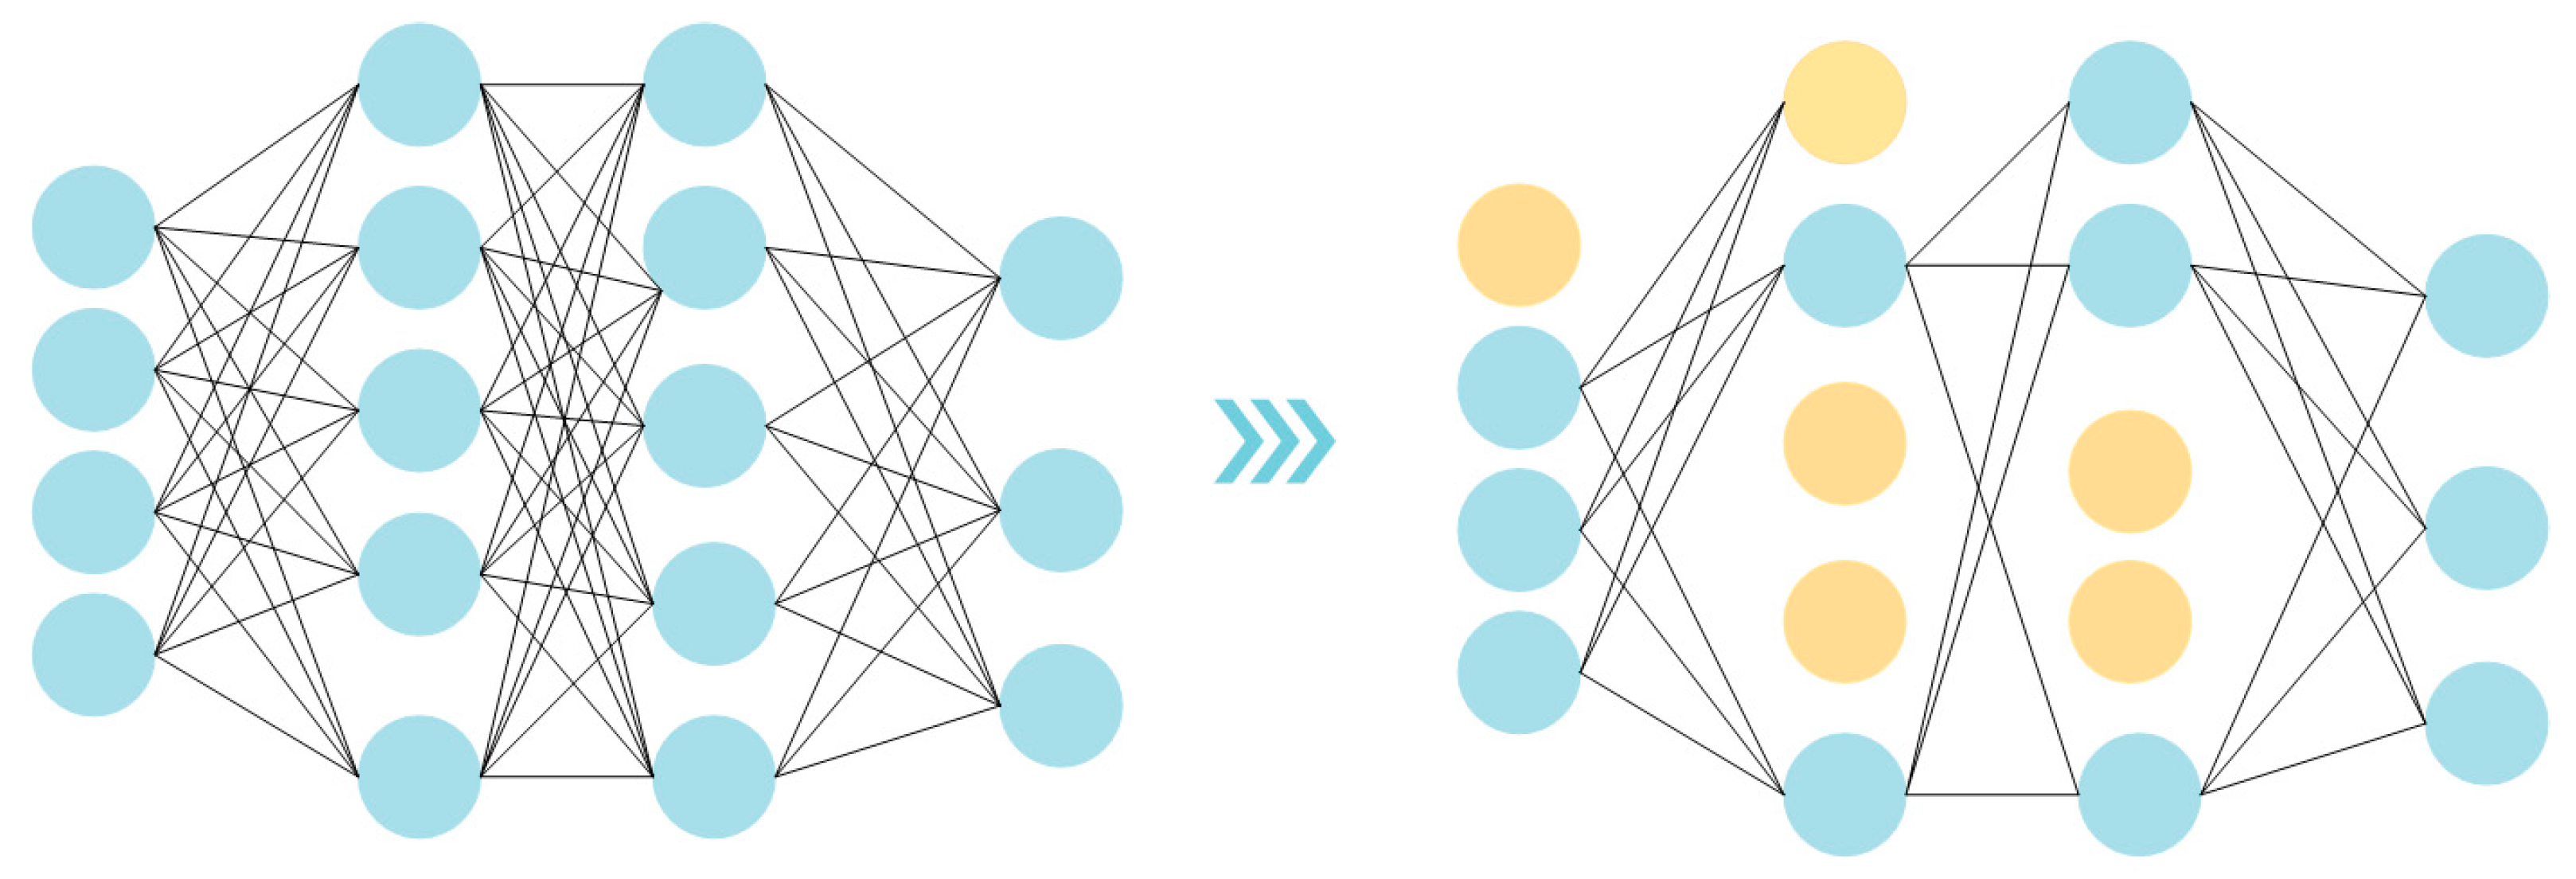
- Selection of Dropout layer
- (2)
- Activation function selection
3.3.3. Training of CNN-LSTM Fault Detection Models
- Conv1D_1: The first convolutional layer uses 32 filters of 3 × 3 size, each of which learns one feature independently and performs feature mapping via the SeLU activation function.
- MaxPooling1D: The pooling kernels of the two pooling layers are set to 2 and 3 from front to back, respectively.
- Conv1D_2: The second convolutional layer receives the pooling output of the first layer, uses 64 filters for feature extraction, and sets the SeLU activation function for it.
- LSTM: The second layer pooling result is taken as input, the first LSTM layer is set to 100 neurons, and the second LSTM layer is set to 80 neurons, both using the SeLU function as activation function.
- Dropout layer: In this study, the dropout layer is set to randomly inhibit neurons with an inactivation rate of 50% to reduce the sensitivity to slight fluctuations in the data and to enhance the stability and accuracy of time series data processing.
- Dense fully connected layer: There are three dense layers. The first layer is set with 50 neurons. The second layer is set with 10 neurons, and the third layer adopts the Softmax activation function for fault detection and outputting results.
- batch_sizes, epochs setting values: set batch_sizes to 600 and epochs to 500.
4. Results and Discussion
4.1. Experimental Evaluation Indicators
- (1)
- Accuracy
- (2)
- Precision
- (3)
- Recall
- (4)
- F1 value
4.2. Experimental Results
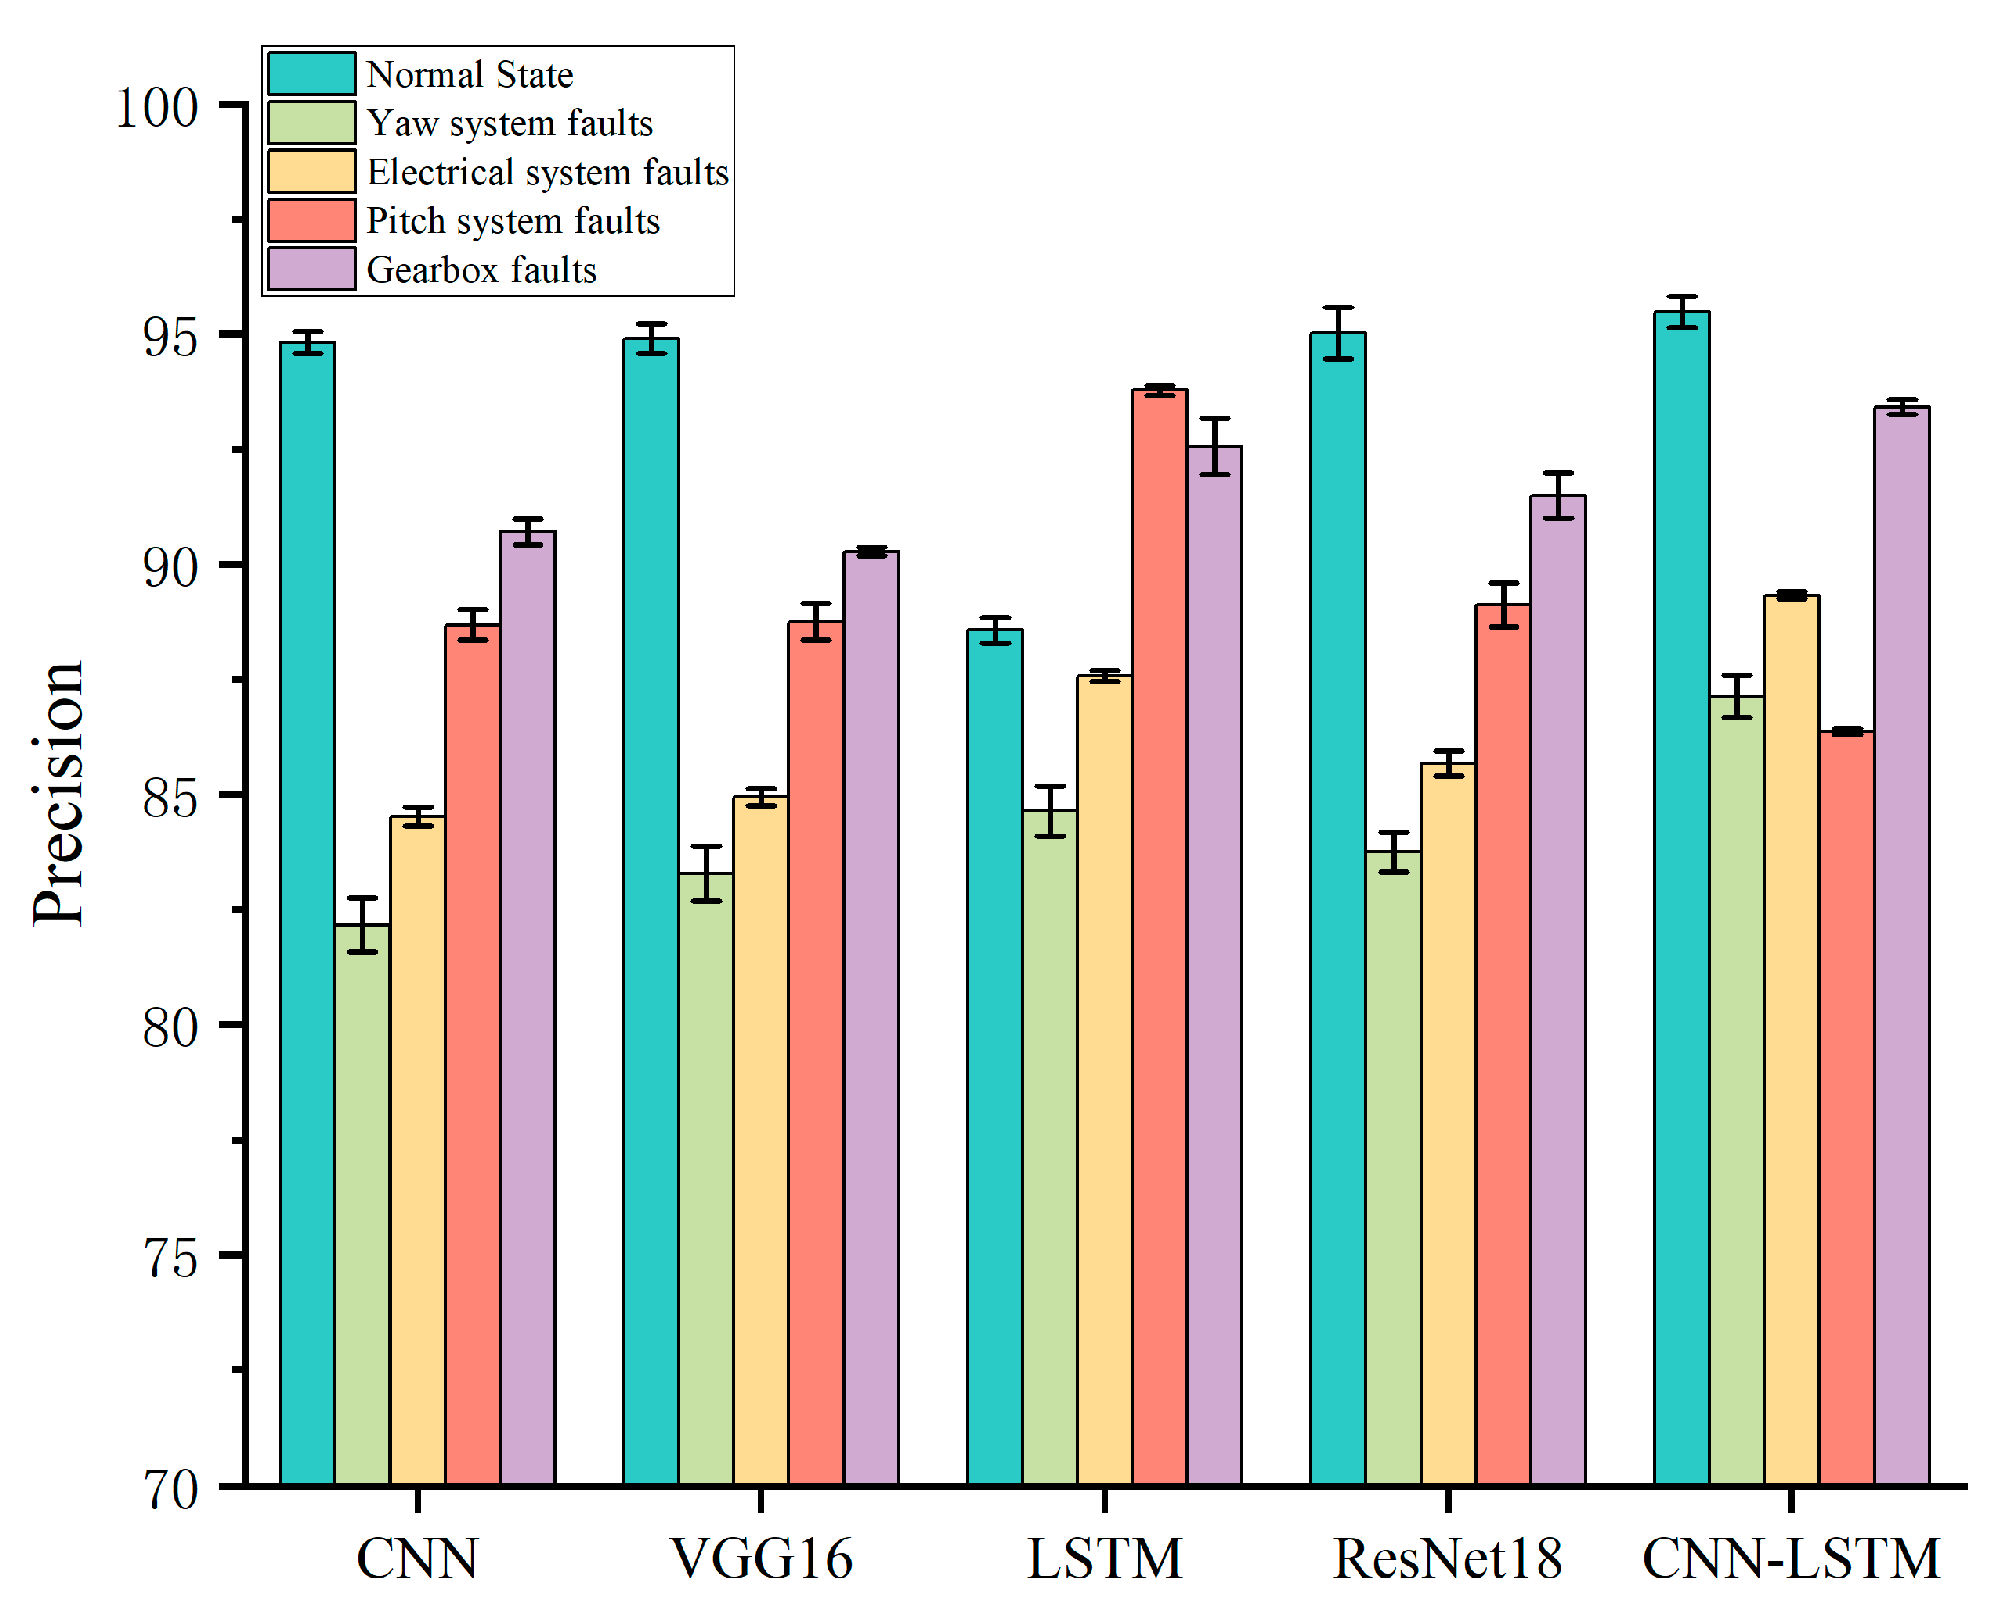
- Comprehensively comparing the precision rate, recall rate, and F1 value indexes of various types of models, the CNN model is the most ineffective;
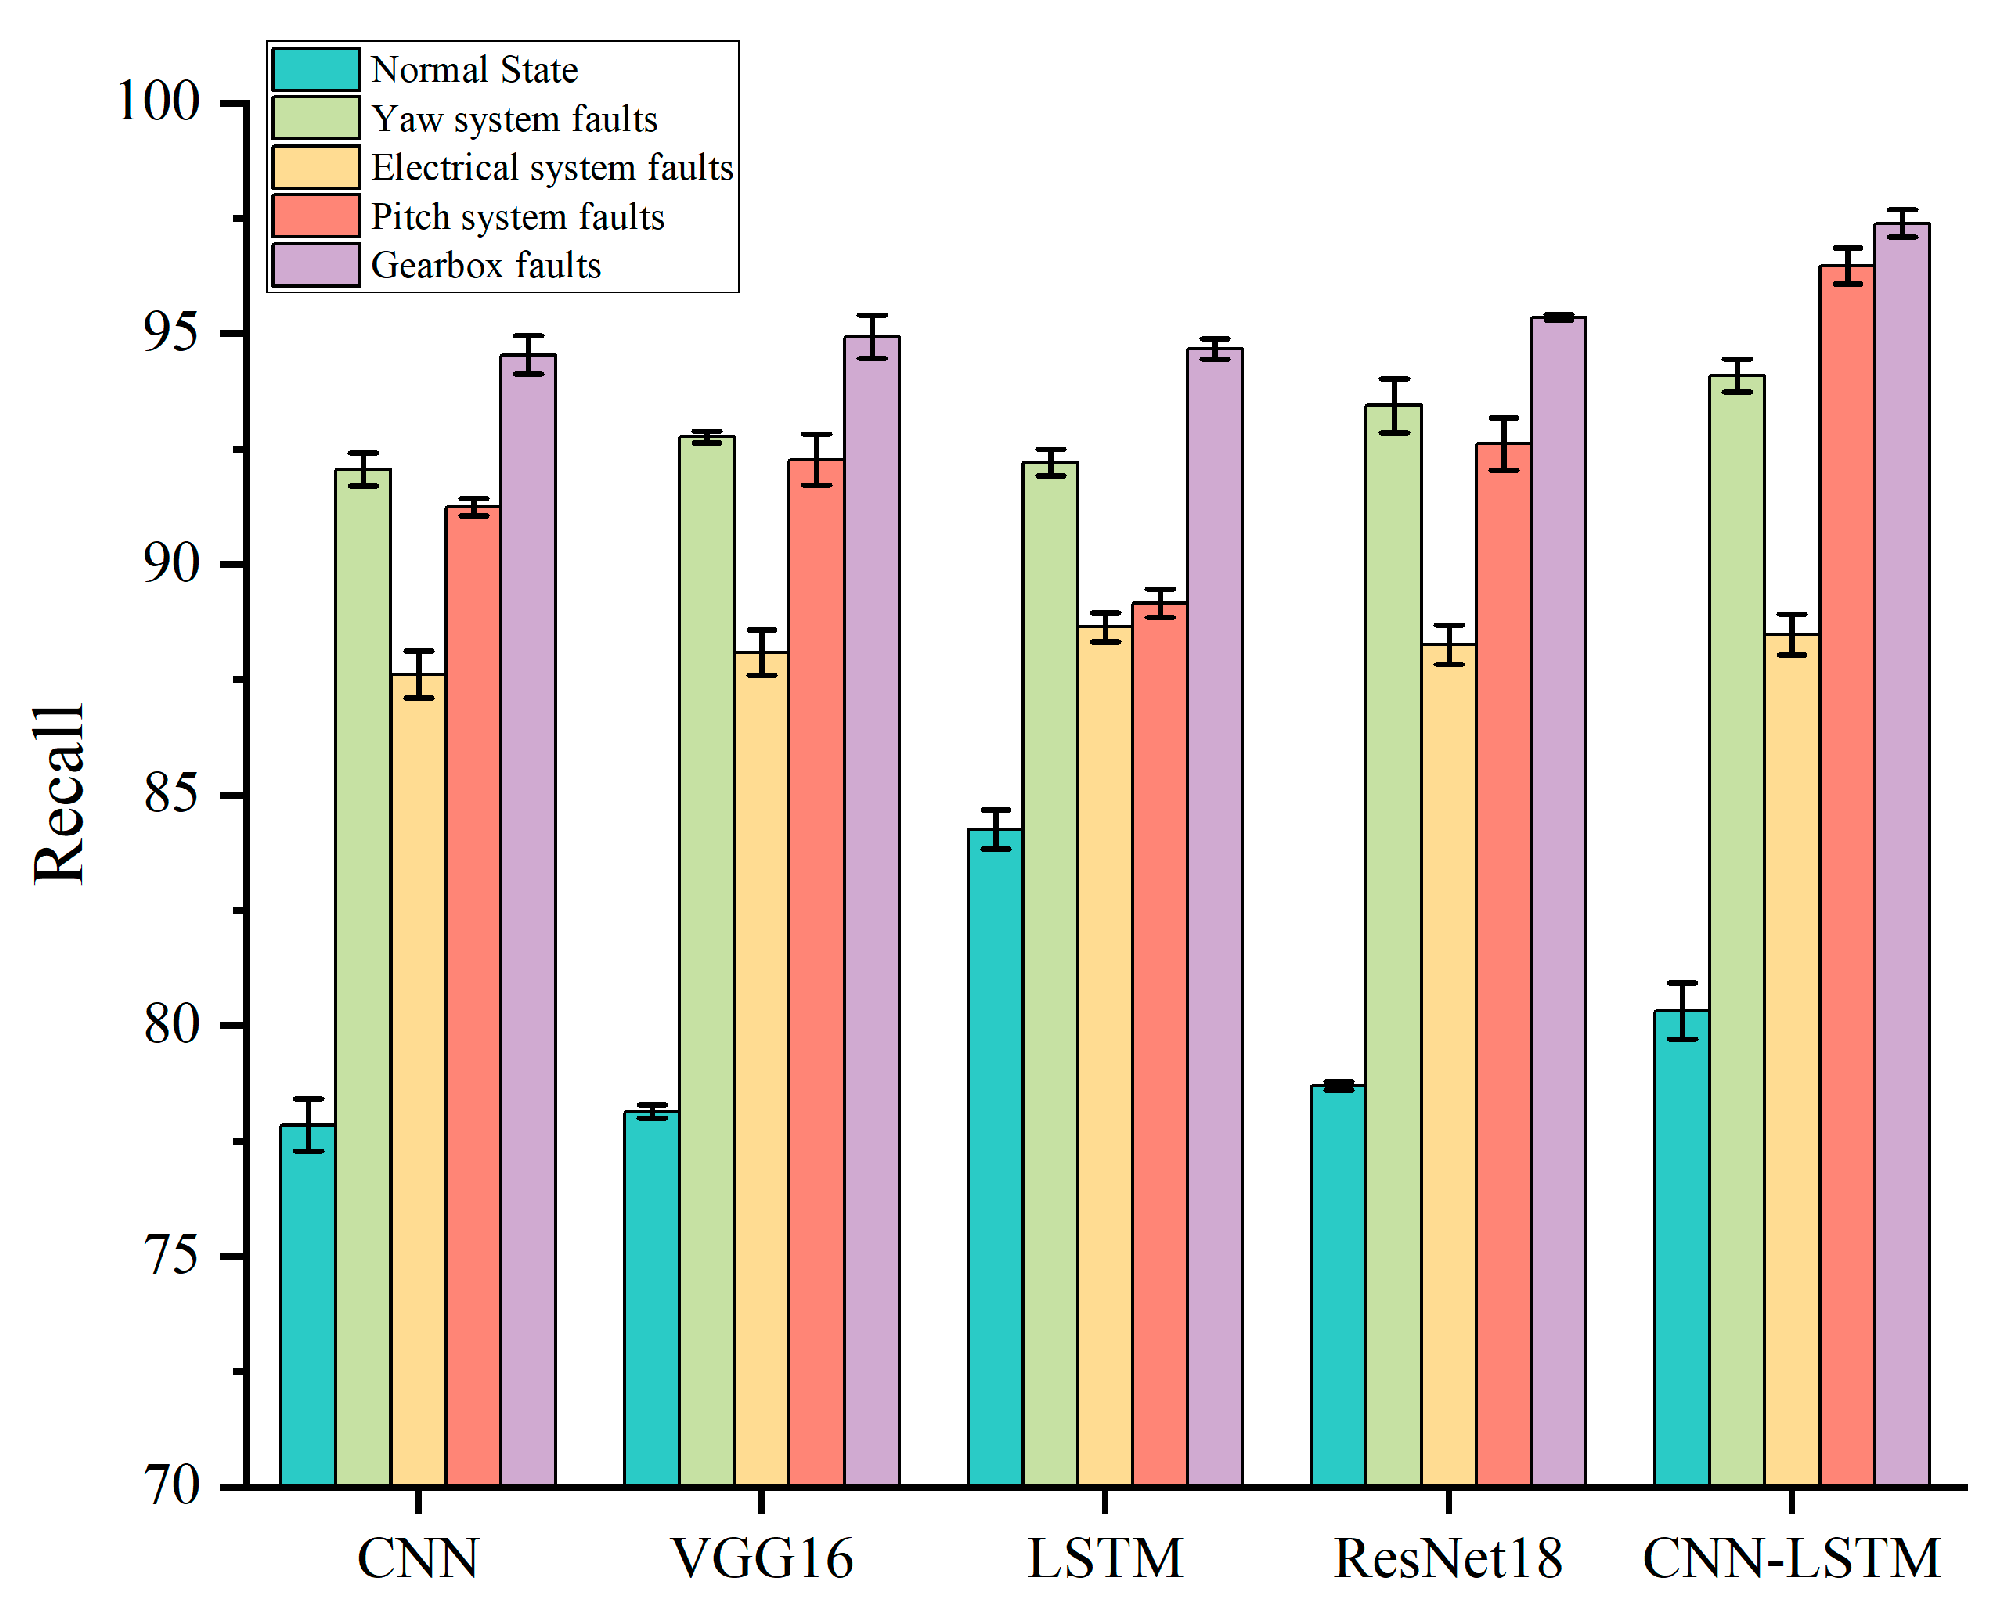
- In terms of effective discovery of common faults, our model achieves optimal results for yaw system faults, pitch system faults, and gearbox faults, and LSTM is only slightly better than our model in the case of power system faults. The higher recall rate for the three types of faults, namely yaw system faults, pitch system faults, and gearbox faults, indicates that our model is more sensitive to the diagnostic discovery of faults, which is crucial for the early discovery and diagnosis of faults, which is essential for avoiding the deeper development of the fault characteristics, or even causing the end of the life of the wind turbine.
- In terms of the accuracy index, LSTM is better than our model only in the case of recognizing and detecting pitch system faults, and our model achieves the optimal value in all other cases.
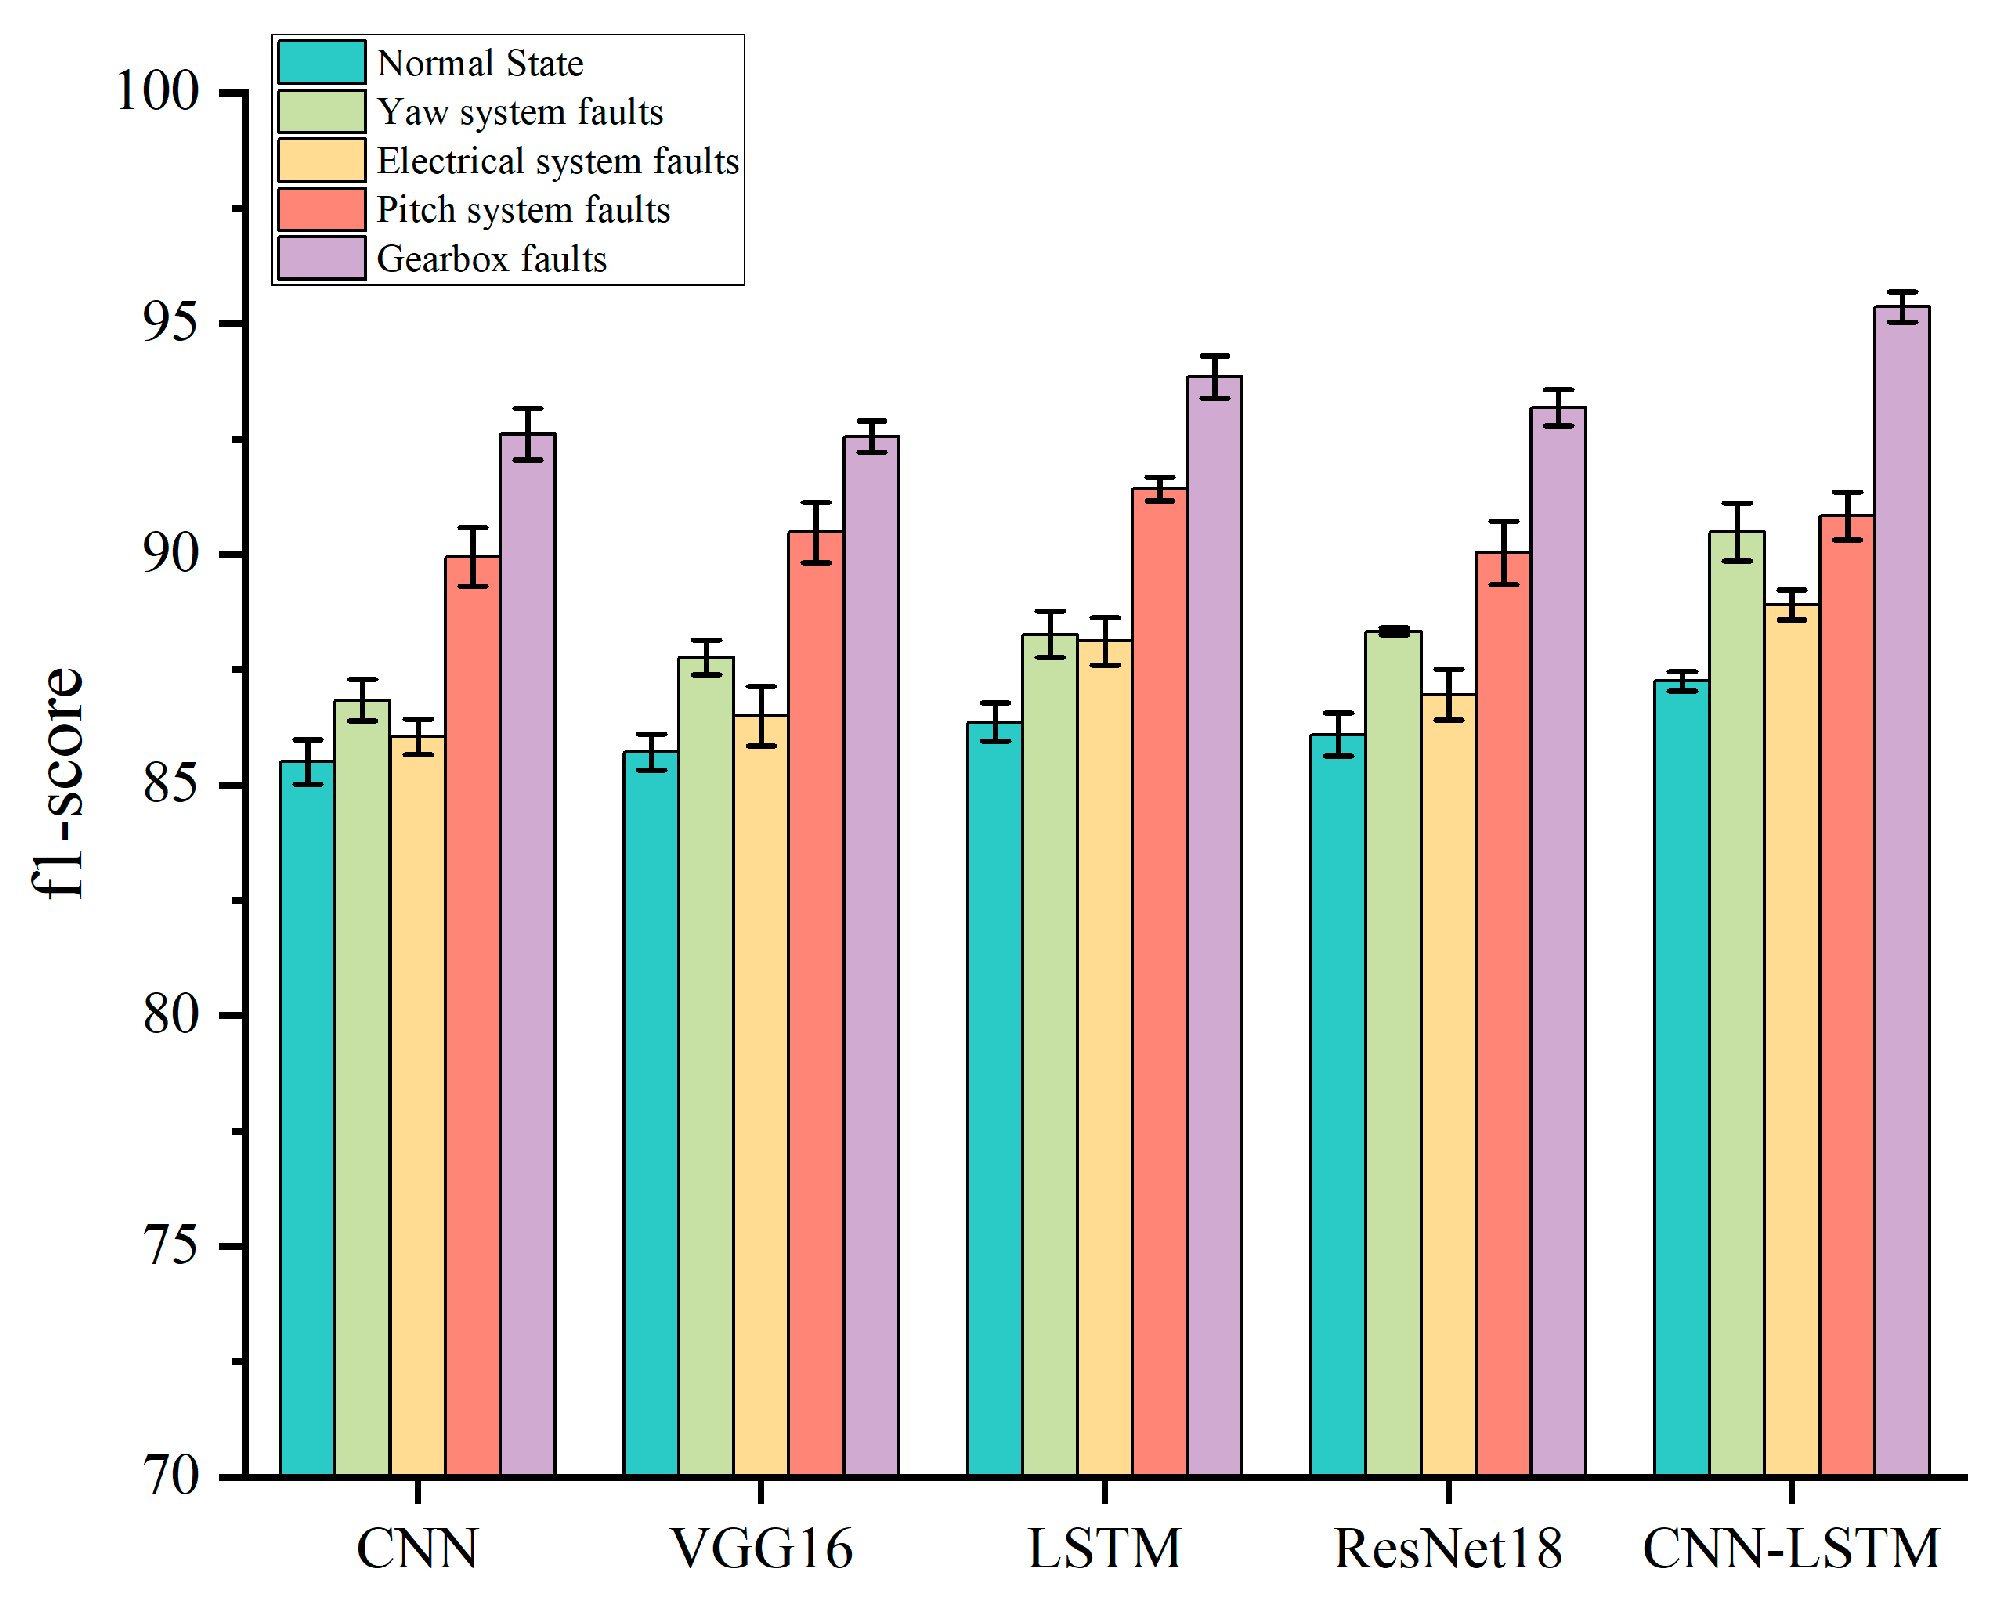
- In terms of F1 value, LSTM is better than our model only in the case of detecting the pitch system faults, but the effect of our model is also better, with only 0.48% difference from the LSTM model, and our model is better than the other models for the rest of the cases.
4.3. Discussion of the Results
4.3.1. Performance Analysis of Fault Detection Models Based on Precision Rate
4.3.2. Performance Analysis of Fault Detection Models Based on Recall Rate
4.3.3. Performance Analysis of Fault Detection Models Based on F1 Value
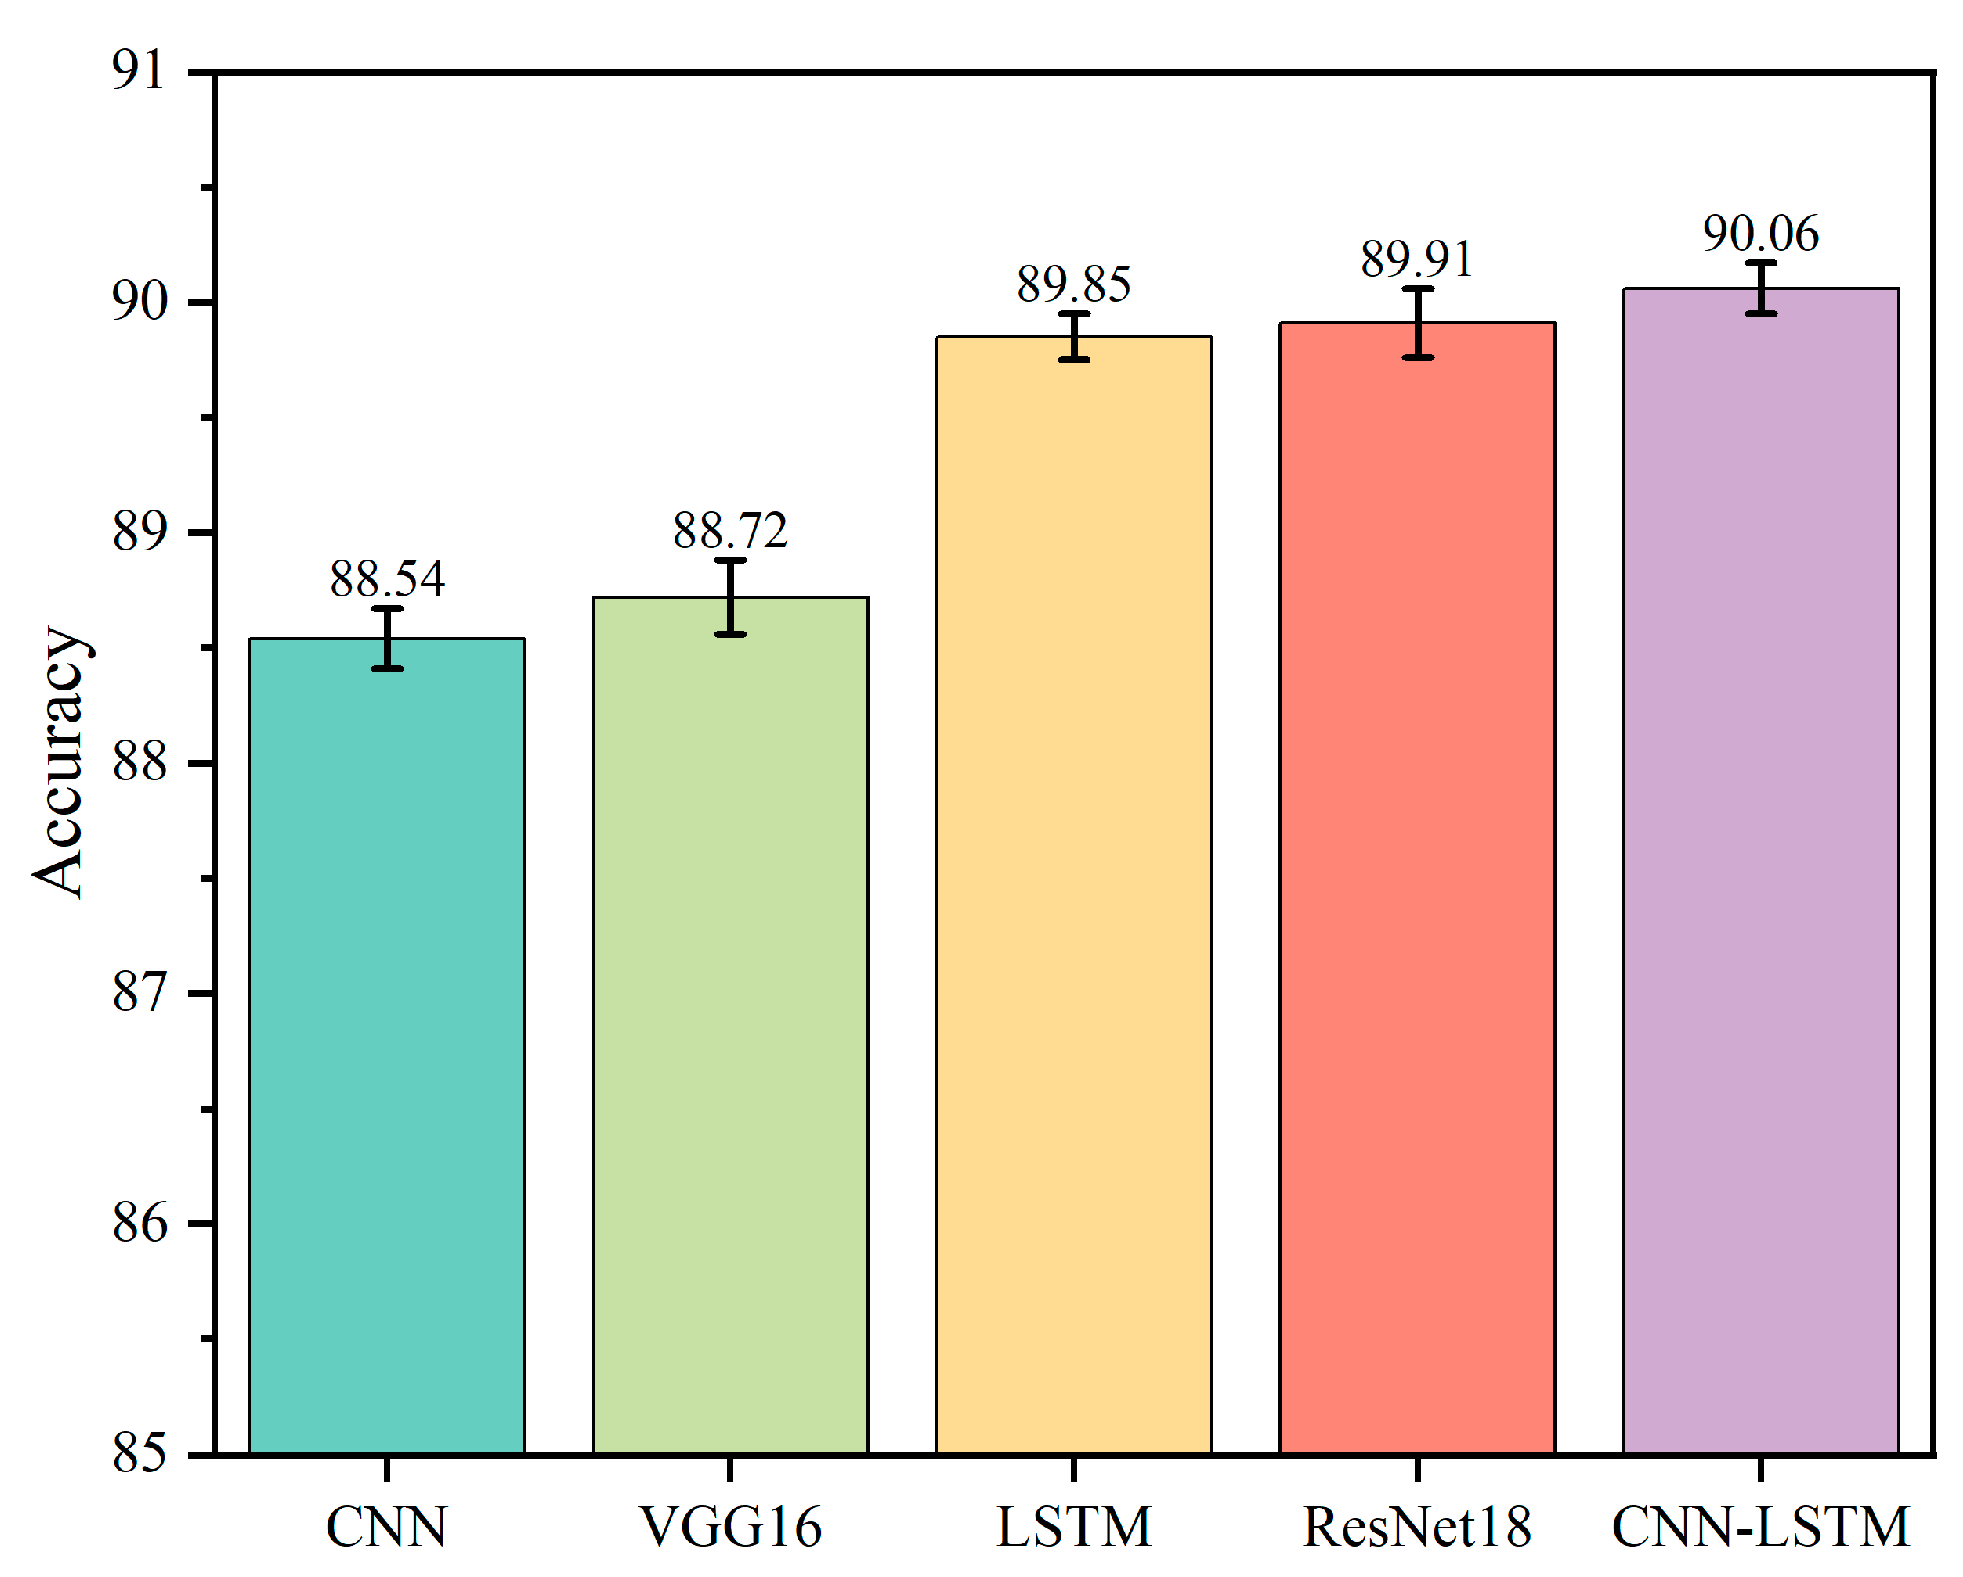
4.3.4. Performance Analysis of Fault Detection Models Based on Accuracy Rate
5. Conclusions
- As far as the methodology is concerned, most of the previous researches focus on the identification and monitoring of a certain type of faults or the improvement in the design of a certain part of the structure of the wind turbine to extend the service life of the wind turbine. For example, Aloui R et al. [55] conducted a life cycle assessment (LCA) of the rotating part of the wind turbine to monitor the operating status to extend the service life of the operating system; Ding et al. [56] proposed a combined model for transformer state prediction to identify faults through the continuous monitoring of the transformer of the power system; and Qin et al. [57] proposed a new pitch controller strategy based on a back-propagation neural network and optimal control theory to solve the rotor speed problem to ensure the stable operation of the wind turbine. Controller strategy is used to solve the rotor speed problem to ensure the stable operation of wind motors. Our model breaks the limitation of monitoring a certain wind turbine parts and simultaneously monitors four parts, pitch system, yaw system, electrical system, and gearbox, to monitor the operation status in real time, prolong the usage time of the four systems, reduce the non-essential downtime, and prolong the service life of the wind turbine.
- In terms of accuracy, the CNN-LSTM wind turbine fault detection model achieves an accuracy of 90.06%, which is the most effective compared to other models;
- In terms of effective discovery of wind turbine faults, our model achieves 94.09%, 96.48%, and 97.39% recall for the identification and detection of yaw system faults, pitch system faults, and gearbox faults, respectively;
- Considering the overall situation of misdetection and omission detection, in terms of the performance of F1 value, although the LSTM model is the most effective in identifying and detecting the pitch system faults, the gap between this model and our model is smaller and more effective, and it reaches more than 90%; in addition, our model outperforms the other four types of comparative models in various state scenarios.
- Noise interference is crucial to the effectiveness of wind turbine fault detection. The current novel fault diagnosis network based on a refined prototype and correlation weighting Manhattan distance (RPCMN) [58] and anti-noise uncertainty perception metric network [59] is effective in solving the noise problem. In the future, we will explore its application in wind turbine fault detection, which is expected to achieve better results.
- CNN-LSTM extracts the global features of wind turbine fault monitoring data with excellent effect, but without feature dimensionality reduction, the computational cost is high. Currently, there are studies based on the neural transformer model [60], through the time domain and frequency domain to provide a more comprehensive feature representation to improve the recognition of faults at the same time to build a multi-head spatiotemporal spiking self-attention (MHSSSA) mechanism to reduce the computational cost. Reducing the computational cost is a need for the development of the fault detection field, and its future application in wind turbine multi-fault classification is expected to sustain the use of wind turbines, extend the service life of wind turbines, and better serve the wind power market.
Author Contributions
Funding
Data Availability Statement
Acknowledgments
Conflicts of Interest
Abbreviations
| CNN | Convolutional Neural Network |
| LLSTM | Long Short-Term Memory |
| CNN-LSTM | Convolutional Neural Network Long Short-Term Memory |
| kW | Kilowatt |
| FFT | Fast Fourier Transform |
| ESRIR | Enhanced Sparse Representation-based Intelligent Recognition |
| SSAE | Stacked Sparse Auto-encoder |
| CDBN | Convolutional Deep Belief Network |
| SCADA | Supervisory Control And Data Acquisition |
| ReLU | Scaled Exponential Linear Unit |
| SELU | Scaled Exponential Linear Unit |
| RPCMN | Refined Prototype and Correlation Weighting Manhattan Distance |
| MHSSSA | Multi-head Spatiotemporal Spiking Self-attention |
| LCA | Life Cycle Assessment |
References
- Strong 2023 Offshore Wind Growth as Industry Sets Course for Record-Breaking Decade. Available online: https://gwec.net/strong-2023-offshore-wind-growth-as-industry-sets-course-for-record-breaking-decade/ (accessed on 3 May 2024).
- Zhu, R.; Wang, Y.; Xiang, Y.; Sun, C.; Chang, R.; Hu, G.; Gao, Z. Study on climate characteristics and development potential of wind energy resources in China. Acta Energiae Solaris Sin. 2021, 42, 409–418. [Google Scholar]
- Zhang, M.; Cong, N.; Song, Y.; Xia, Q. Cost analysis of onshore wind power in China based on learning curve. Energy 2024, 291, 130459. [Google Scholar] [CrossRef]
- Saci, A.; Nadour, M.; Cherroun, L.; Hafaifa, A.; Kouzou, A.; Rodriguez, J.; Abdelrahem, M. Condition Monitoring Using Digital Fault-Detection Approach for Pitch System in Wind Turbines. Energies 2024, 17, 4016. [Google Scholar] [CrossRef]
- Bangalore, P.; Letzgus, S.; Karlsson, D.; Patriksson, M. An artificial neural network-based condition monitoring method for wind turbines, with application to the monitoring of the gearbox. Wind. Energy 2017, 20, 1421–1438. [Google Scholar] [CrossRef]
- Schlechtingen, M.; Santos, I.F. Comparative analysis of neural network and regression based condition monitoring approaches for wind turbine fault detection. Mech. Syst. Signal Process. 2011, 25, 1849–1875. [Google Scholar] [CrossRef]
- Kusiak, A.; Verma, A. Analyzing bearing faults in wind turbines: A data-mining approach. Renew. Energy 2012, 48, 110–116. [Google Scholar] [CrossRef]
- Malik, H.; Mishra, S. Application of probabilistic neural network in fault diagnosis of wind turbine using FAST, TurbSim and Simulink. Procedia Comput. Sci. 2015, 58, 186–193. [Google Scholar] [CrossRef]
- Ibrahim, R.K.; Tautz-Weinert, J.; Watson, S.J. Neural networks for wind turbine fault detection via current signature analysis. In Presented at the Wind Europe Summit 2016; Loughborough Publications: Loughborough, UK, 2016; Available online: https://dspace.lboro.ac.uk/2134/23014 (accessed on 4 May 2024).
- Kusiak, A.; Verma, A. A Data-driven approach for monitoring blade pitch faults in wind turbines. IEEE Trans. Sustain. Energy 2011, 2, 87–96. [Google Scholar] [CrossRef]
- Zaher, A.; McArthur, S.; Infield, D.; Patel, Y. Online wind turbine fault detection through automated SCADA data analysis. Wind. Energy 2013, 12, 574–593. [Google Scholar] [CrossRef]
- Azizi, A.; Nourisola, H.; Shoja-Majidabad, S. Fault tolerant control of wind turbines with an adaptive output feedback sliding mode controller. Renew. Energy 2019, 135, 55–65. [Google Scholar] [CrossRef]
- Colombo, L.; Corradini, M.; Ippoliti, G.; Orlando, G. Pitch angle control of a wind turbine operating above the rated wind speed: A sliding mode control approach. ISA Trans. 2019, 96, 95–102. [Google Scholar] [CrossRef]
- Stetco, A.; Dinmohammadi, F.; Zhao, X.; Robu, V.; Flynn, D.; Barnes, M.; Keane, J.; Nenadic, G. Machine learning methods for wind turbine condition monitoring: A review. Renew. Energy 2019, 133, 620–635. [Google Scholar] [CrossRef]
- Kong, Y.; Qin, Z.; Wang, T.; Han, Q.; Chu, F. An enhanced sparse representation-based intelligent recognition method for planet bearing fault diagnosis in wind turbines. Renew. Energy 2021, 173, 987–1004. [Google Scholar] [CrossRef]
- Chang, C.C.W.; Ding, T.J.; Han, W.; Chai, C.C.; Bhuiyan, M.A.; Choon-Yian, H.; Song, T.C. Recent advancements in condition monitoring systems for wind turbines: A review. Energy Rep. 2023, 9, 22–27. [Google Scholar] [CrossRef]
- Jin, X.; Xu, Z.; Qiao, W. Condition Monitoring of Wind Turbine Generators Using SCADA Data Analysis. IEEE Trans. Sustain. Energy 2021, 12, 202–210. [Google Scholar] [CrossRef]
- Ke, Y.; Song, E.Z.; Yao, C.; Dong, Q. A review: Ship diesel engine prognostics and health management technology. J. Harbin Eng. Univ. 2020, 41, 125–131. [Google Scholar]
- Gangsar, P.; Tiwari, R. Signal Based Condition Monitoring Techniques for Fault Detection and Diagnosis of Induction Motors: A State-of-the-Art Review. Mech. Syst. Signal Process. 2020, 144, 106908. [Google Scholar] [CrossRef]
- Guerrero, J.M.; Castilla, A.E.; Fernandez, J.A.S.; Platero, C.A. Transformer Oil Diagnosis Based on Capacitive Sensor Frequency Response Analysis. IEEE Access 2021, 9, 7576–7585. [Google Scholar] [CrossRef]
- Rastegaev, I.; Merson, D.; Rastegaeva, I.; Vinogradov, A. A Time-Frequency Based Approach for Acoustic Emission Assessment of Sliding Wear. Lubricants 2020, 8, 52. [Google Scholar] [CrossRef]
- Qian, G.C.; Yu, H.; Zou, D.X.; Xu, X.W.; Liu, G.Q. Vibration Detection Method of Transformer Winding Looseness Based on Entropy Weight Correlation Theory. South. Power Syst. Technol. 2016, 10, 45–51+78. [Google Scholar]
- Yu, C.; Ning, Y.; Qin, Y.; Su, W.; Zhao, X. Multi-Label Fault Diagnosis of Rolling Bearing Based on Meta-Learning. Neural Comput. Appl. 2021, 33, 5393–5407. [Google Scholar] [CrossRef]
- Fu, Q.; Wang, H. A Novel Deep Learning System with Data Augmentation for Machine Fault Diagnosis from Vibration Signals. Appl. Sci. 2020, 10, 5765. [Google Scholar] [CrossRef]
- Li, H.; Xiao, D. Survey on data driven fault diagnosis methods. Control Decis. 2011, 26, 1–9+16. [Google Scholar]
- Zhang, J.; Yang, L.; Zheng, Z. Comparison and application of time-domain analysis method and frequency-domain analysis method for comfortability analysis. Build. Struct. 2019, 49, 43–48. [Google Scholar]
- Hirao, Y.; Takeuchi, Y.; Imai, M.; Yu, J. Deformable Part Model Based Arrhythmia Detection Using Time Domain Features. IEICE Trans. Fundam. Electron. Commun. Comput. Sci. 2017, 100, 2221–2229. [Google Scholar] [CrossRef]
- Mehrjou, M.R.; Mariun, N.; Misron, N.; Radzi, M.A.M. Analysis of Statistical Features Based on Start-Up Current Envelope for Broken Rotor Bar Fault Detection in Line Start Permanent Magnet Synchronous Motor. Electr. Eng. 2017, 99, 187–201. [Google Scholar] [CrossRef]
- Kang, M.; Kim, J.; Wills, L.M.; Kim, J.-M. Time-Varying and Multiresolution Envelope Analysis and Discriminative Feature Analysis for Bearing Fault Diagnosis. IEEE Trans. Ind. Electron. 2015, 62, 7749–7761. [Google Scholar] [CrossRef]
- Wang, Z.; Du, W.; Wang, X. Fault diagnosis of milling machine based on frequency-domain analysis of vibration signal. Manuf. Technol. Mach. Tool 2018, 3, 114–121. [Google Scholar]
- Hamilton, A.J.S. Uncorrelated Modes of the Non-Linear Power Spectrum. Mon. Not. R. Astron. Soc. 2000, 312, 257–284. [Google Scholar] [CrossRef]
- Li, S.; Hou, Y.; Li, X. Review on Time-Frequency-Domain Analysis Methods for Vibration Faults of Rolling Bearings. J. Chongqing Univ. Technol. 2021, 35, 85–93. [Google Scholar]
- de Bessa, I.V.; Palhares, R.M.; D’Angelo, M.F.; Chaves Filho, J.E. Data-Driven Fault Detection and Isolation Scheme for a Wind Turbine Benchmark. Renew. Energy 2016, 87, 634–645. [Google Scholar] [CrossRef]
- Sharma, R.R.; Pachori, R.B. Time–frequency representation using IEVDHM–HT with application to classification of epileptic EEG signals. IET Sci. Meas. Technol. 2018, 12, 72–82. [Google Scholar] [CrossRef]
- Huang, L.W.; Jiang, B.T.; Lv, S.; Liu, Y.; Li, D. Survey on Deep Learning Based Recommender Systems. Chin. J. Comput. 2018, 41, 1619–1647. [Google Scholar]
- Kong, X.; Zheng, F.; Zhijun, E.; Cao, J.; Wang, X. Short-Term Load Forecasting based on Deep Belief Network. Autom. Electr. Power Syst. 2018, 42, 133–139. [Google Scholar]
- Li, X.; Ye, M.; Li, T. Review of object detection based on convolutional neural networks. Appl. Res. Comput. 2017, 34, 2881–2886+2891. [Google Scholar]
- Zhang, C.; He, Y.; Du, B.; Zhang, F.; Jiang, S. Intelligent fault diagnosis method of power transformer using deep learning. Chin. J. Electron. Meas. Instrum. 2020, 34, 81–89. [Google Scholar]
- Yang, L.; Wu, Y.; Wang, J. Research on recurrent neural networks. J. Comput. Appl. 2018, 38, 1–6+26. [Google Scholar]
- Zhao, Z.; Li, L.; Li, Q. Multi-task deep Learning method for bearing fault diagnosis. J. Electron. Meas. Instrum. 2021, 35, 108–115. [Google Scholar]
- Zhang, H.; Wang, K.; Wang, F. Advances and Perspectives on Applications of Deep Learning in Visual Object Detection. Acta Autom. Sin. 2017, 43, 1289–1305. [Google Scholar]
- Dai, L.; Zhang, S.; Huang, Z. Deep Learning for Speech Recognition: Review of State-of-the-Arts Technologies and Prospects. J. Data Acquis. Process. 2017, 32, 221–231. [Google Scholar]
- Liu, H.; Li, L.; Ma, J. Rolling Bearing Fault Diagnosis Based on STFT-Deep Learning and Sound Signals. Shock. Vib. 2016, 2016, 6127479. [Google Scholar] [CrossRef]
- Hu, Z.X.; Wang, Y.; Ge, M.F.; Liu, J. Data-driven fault diagnosis method based on compressed sensing and improved multiscale network. IEEE Trans. Ind. Electron. 2019, 67, 3216–3228. [Google Scholar] [CrossRef]
- Lei, J.; Liu, C.; Jiang, D. Fault diagnosis of wind turbine based on Long Short-term memory networks. Renew. Energy 2019, 133, 422–432. [Google Scholar] [CrossRef]
- Shao, H.; Jiang, H.; Zhang, H.; Duan, W.; Liang, T.; Wu, S. Rolling bearing fault feature learning using improved convolutional deep belief network with compressed sensing. Mech. Syst. Signal Process. 2018, 100, 743–765. [Google Scholar] [CrossRef]
- López, E.; Valle, C.; Allende, H.; Gil, E.; Madsen, H. Wind Power Forecasting Based on Echo State Networks and Long Short-Term Memory. Energies 2018, 11, 526. [Google Scholar] [CrossRef]
- Chi, N. Studies on the Stability Issues about Large Scale Wind Farm Grid Integration; China Electric Power Research Institute: Beijing, China, 2006. [Google Scholar]
- Wen, L.; Li, X.; Gao, L.; Zhang, Y. A new convolutional neural network-based data-drive-n fault diagnosis method. IEEE Trans. Ind. Electron. 2017, 65, 5990–5998. [Google Scholar] [CrossRef]
- Wang, S.; Wang, K.; Zhou, L.; Yang, Z.; Wang, Y.; Chen, T.; Zhao, S. Fault diagnosis of pitch system of wind turbine based on standardized stacked autoencoder network. Acta Energiae Solaris Sin. 2022, 43, 394–401. [Google Scholar]
- Lu, J.; Zhang, Q.; Yang, Z.; Tu, M.; Lu, J.; Chen, H. Short-Term Load Forecasting Method Based on CNN-LSTM Hybrid Neural Network Model. Autom. Electr. Power Syst. 2019, 43, 131–137. [Google Scholar]
- Jia, Q.; Yang, Q.; Yang, Y. Fusion strategy for single phase to ground fault detection implemented through fault measures and evidence theory. Proc. CSEE 2003, 23, 9–14. [Google Scholar]
- Li, M.; Ning, D.; Guo, J. Attention Mechanism-Based CNN-LSTM Model and Its Application. Comput. Eng. Appl. 2019, 55, 20–27. [Google Scholar]
- Srivastava, N.; Hinton, G.; Krizhevsky, A.; Sutskever, I.; Salakhutdinov, R. Dropout: A simple way to prevent neural networks from overfitting. J. Mach. Learn. Res. 2014, 15, 1929–1958. [Google Scholar]
- Aloui, R.; Gaha, R.; Lafarge, B.; Celik, B.; Verdari, C. Life Cycle Assessment of Piezoelectric Devices Implemented in Wind Turbine Condition Monitoring Systems. Energies 2024, 17, 3928. [Google Scholar] [CrossRef]
- Ding, C.; Chen, W.; Yu, D.; Yan, Y. Research on Transformer Condition Prediction Based on Gas Prediction and Fault Diagnosis. Energies 2024, 17, 4082. [Google Scholar] [CrossRef]
- Qin, S.; Cao, Z.; Wang, F.; Ngu, S.S.; Kho, L.C.; Cai, H. Design of Optimal Pitch Controller for Wind Turbines Based on Back-Propagation Neural Network. Energies 2024, 17, 4076. [Google Scholar] [CrossRef]
- Wang, C.; Yang, J.; Zhang, B. A fault diagnosis method using improved prototypical network and weighting similarity-Manhattan distance with insufficient noisy data. Measurement 2024, 226, 114171. [Google Scholar] [CrossRef]
- Wang, C.; Yang, J.; Jie, H.; Tian, B.; Zhao, Z.; Chang, Y. An uncertainty perception metric network for machinery fault diagnosis under limited noisy source domain and scarce noisy unknown domain. Adv. Eng. Inform. 2024, 62, 102682. [Google Scholar] [CrossRef]
- Wang, C.; Tian, B.; Yang, J.; Jie, H.; Chang, Y.; Zhao, Z. Neural-transformer: A brain-inspired lightweight mechanical fault diagnosis method under noise. Reliab. Eng. Syst. Saf. 2024, 251, 110409. [Google Scholar] [CrossRef]

| Fault Codes | System Failure Types | Specific Parts | Failure Forms | Cause of Fault |
|---|---|---|---|---|
| 70032 | Yaw system faults | Motors | Unit shutdown | Low wind speed [49] |
| 80008 | Electrical system faults | Controller | Unit shutdown | Large instantaneous speed increase [43] |
| 160029 | Pitch system faults | Bearing | Power too low | Excessive bearing fatigue [50] |
| 70029 | Gearbox faults | Converters | Overcurrent | Current sensing failure [42] |
| Experimental Parameters | Option 1 | Option 2 | Option 3 | Option 4 | |
|---|---|---|---|---|---|
| Convolution Layer_1 | Convolutional kernel | 32 | 64 | 32 | 32 |
| Convolution kernel size | 3 | 2 | 3 | 3 | |
| Activation function | SeLU | SeLU | SeLU | ReLU | |
| Pooling Layer_1 | Pooling kernel | 2 | 3 | 2 | 2 |
| Convolution kernel | 64 | \ | 64 | 64 | |
| Convolution Layer_2 | Convolution kernel size | 2 | \ | 2 | 2 |
| Activation function | SeLU | \ | SeLU | ReLU | |
| Pooling Layer_2 | Pooling kernel | 3 | \ | 3 | 3 |
| LSTM Layer_1 | Number of neurons | 100 | 100 | 40 | 100 |
| Activation function | SeLU | SeLU | SeLU | ReLU | |
| LSTM Layer_2 | Number of neurons | 80 | 80 | 20 | 80 |
| Activation function | SeLU | SeLU | SeLU | ReLU | |
| Dropout Layer | Inactivation rate | 0.5 | \ | 0.5 | 0.5 |
| Dense Layer_1 | Number of neurons | 50 | 50 | 10 | 50 |
| Activation function | SeLU | SeLU | SeLU | ReLU | |
| Dense Layer_2 | Number of neurons | 10 | 10 | \ | 10 |
| Activation function | SeLU | SeLU | \ | ReLU | |
| Output Layer | Number of neurons | 5 | 5 | 5 | 5 |
| Activation function | Softmax | Softmax | Softmax | Softmax |
| Option 1 | Option 2 | Option 3 | Option 4 | |
|---|---|---|---|---|
| Optimizer | Adam | Adam | Adam | Adam |
| Batch_sizes | 600 | 600 | 600 | 600 |
| Epochs | 500 | 500 | 500 | 500 |
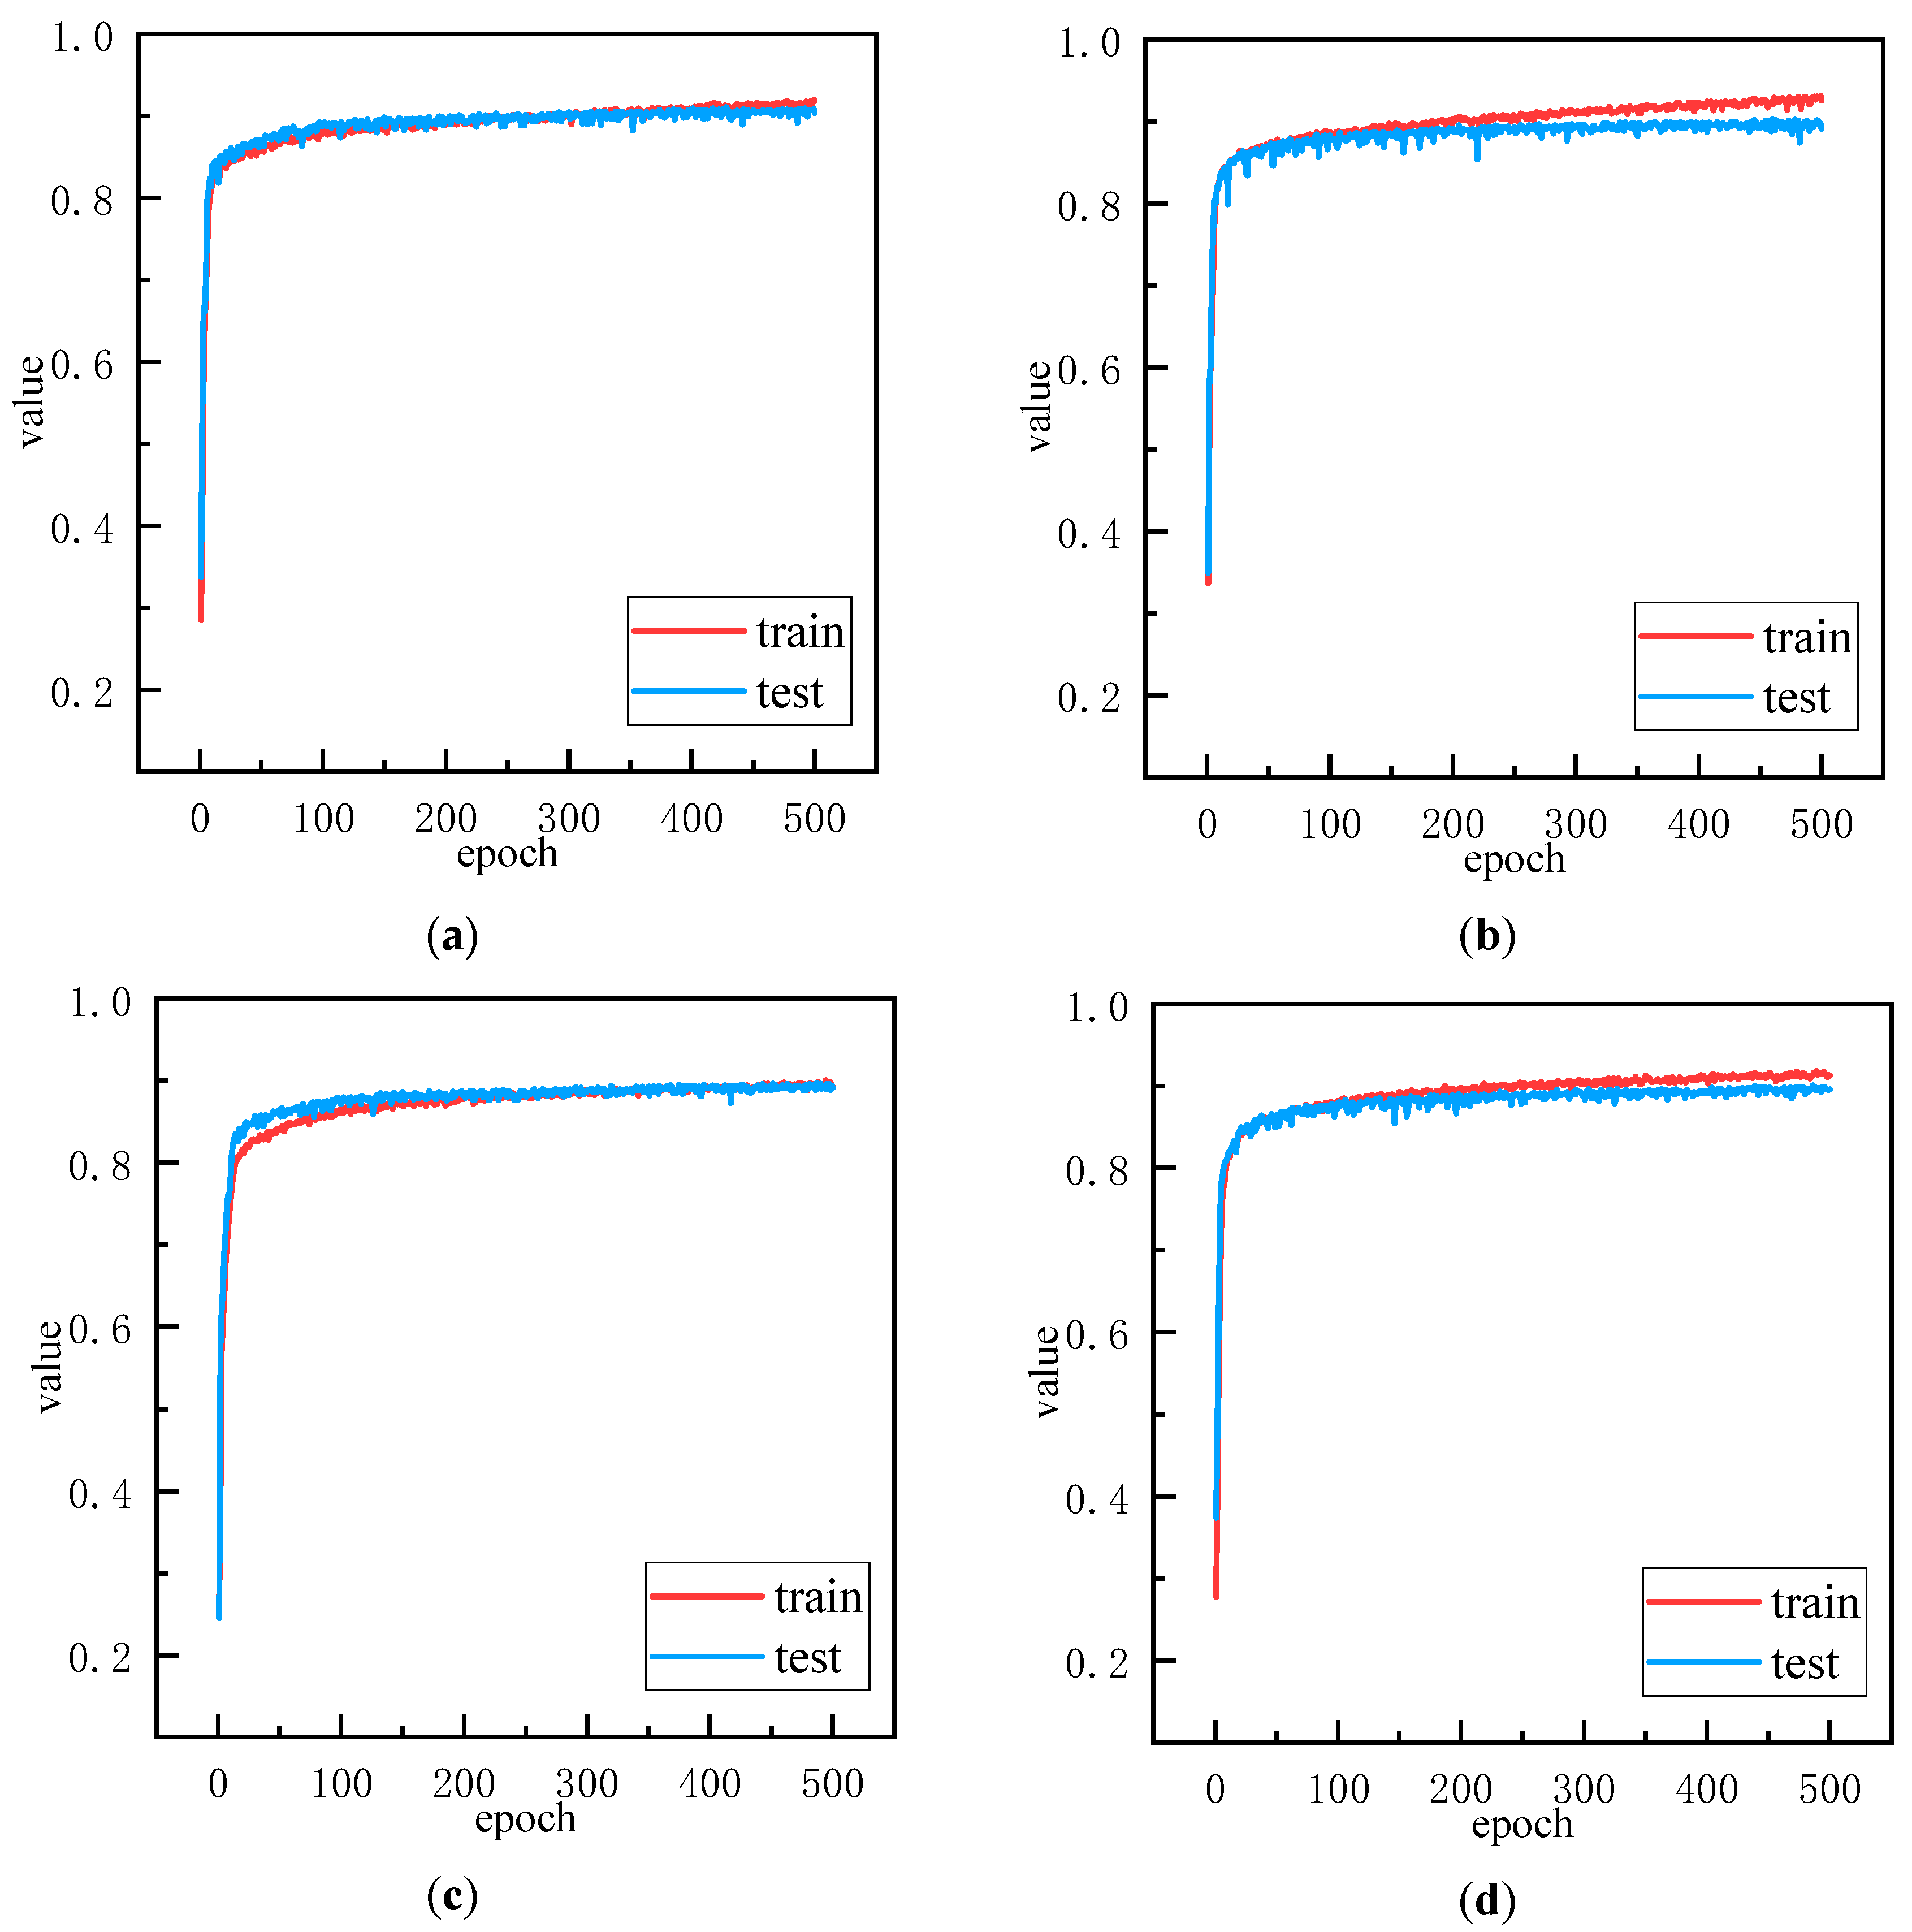
| Accuracy variation graph | Figure 5a | Figure 5b | Figure 5c | Figure 5d |
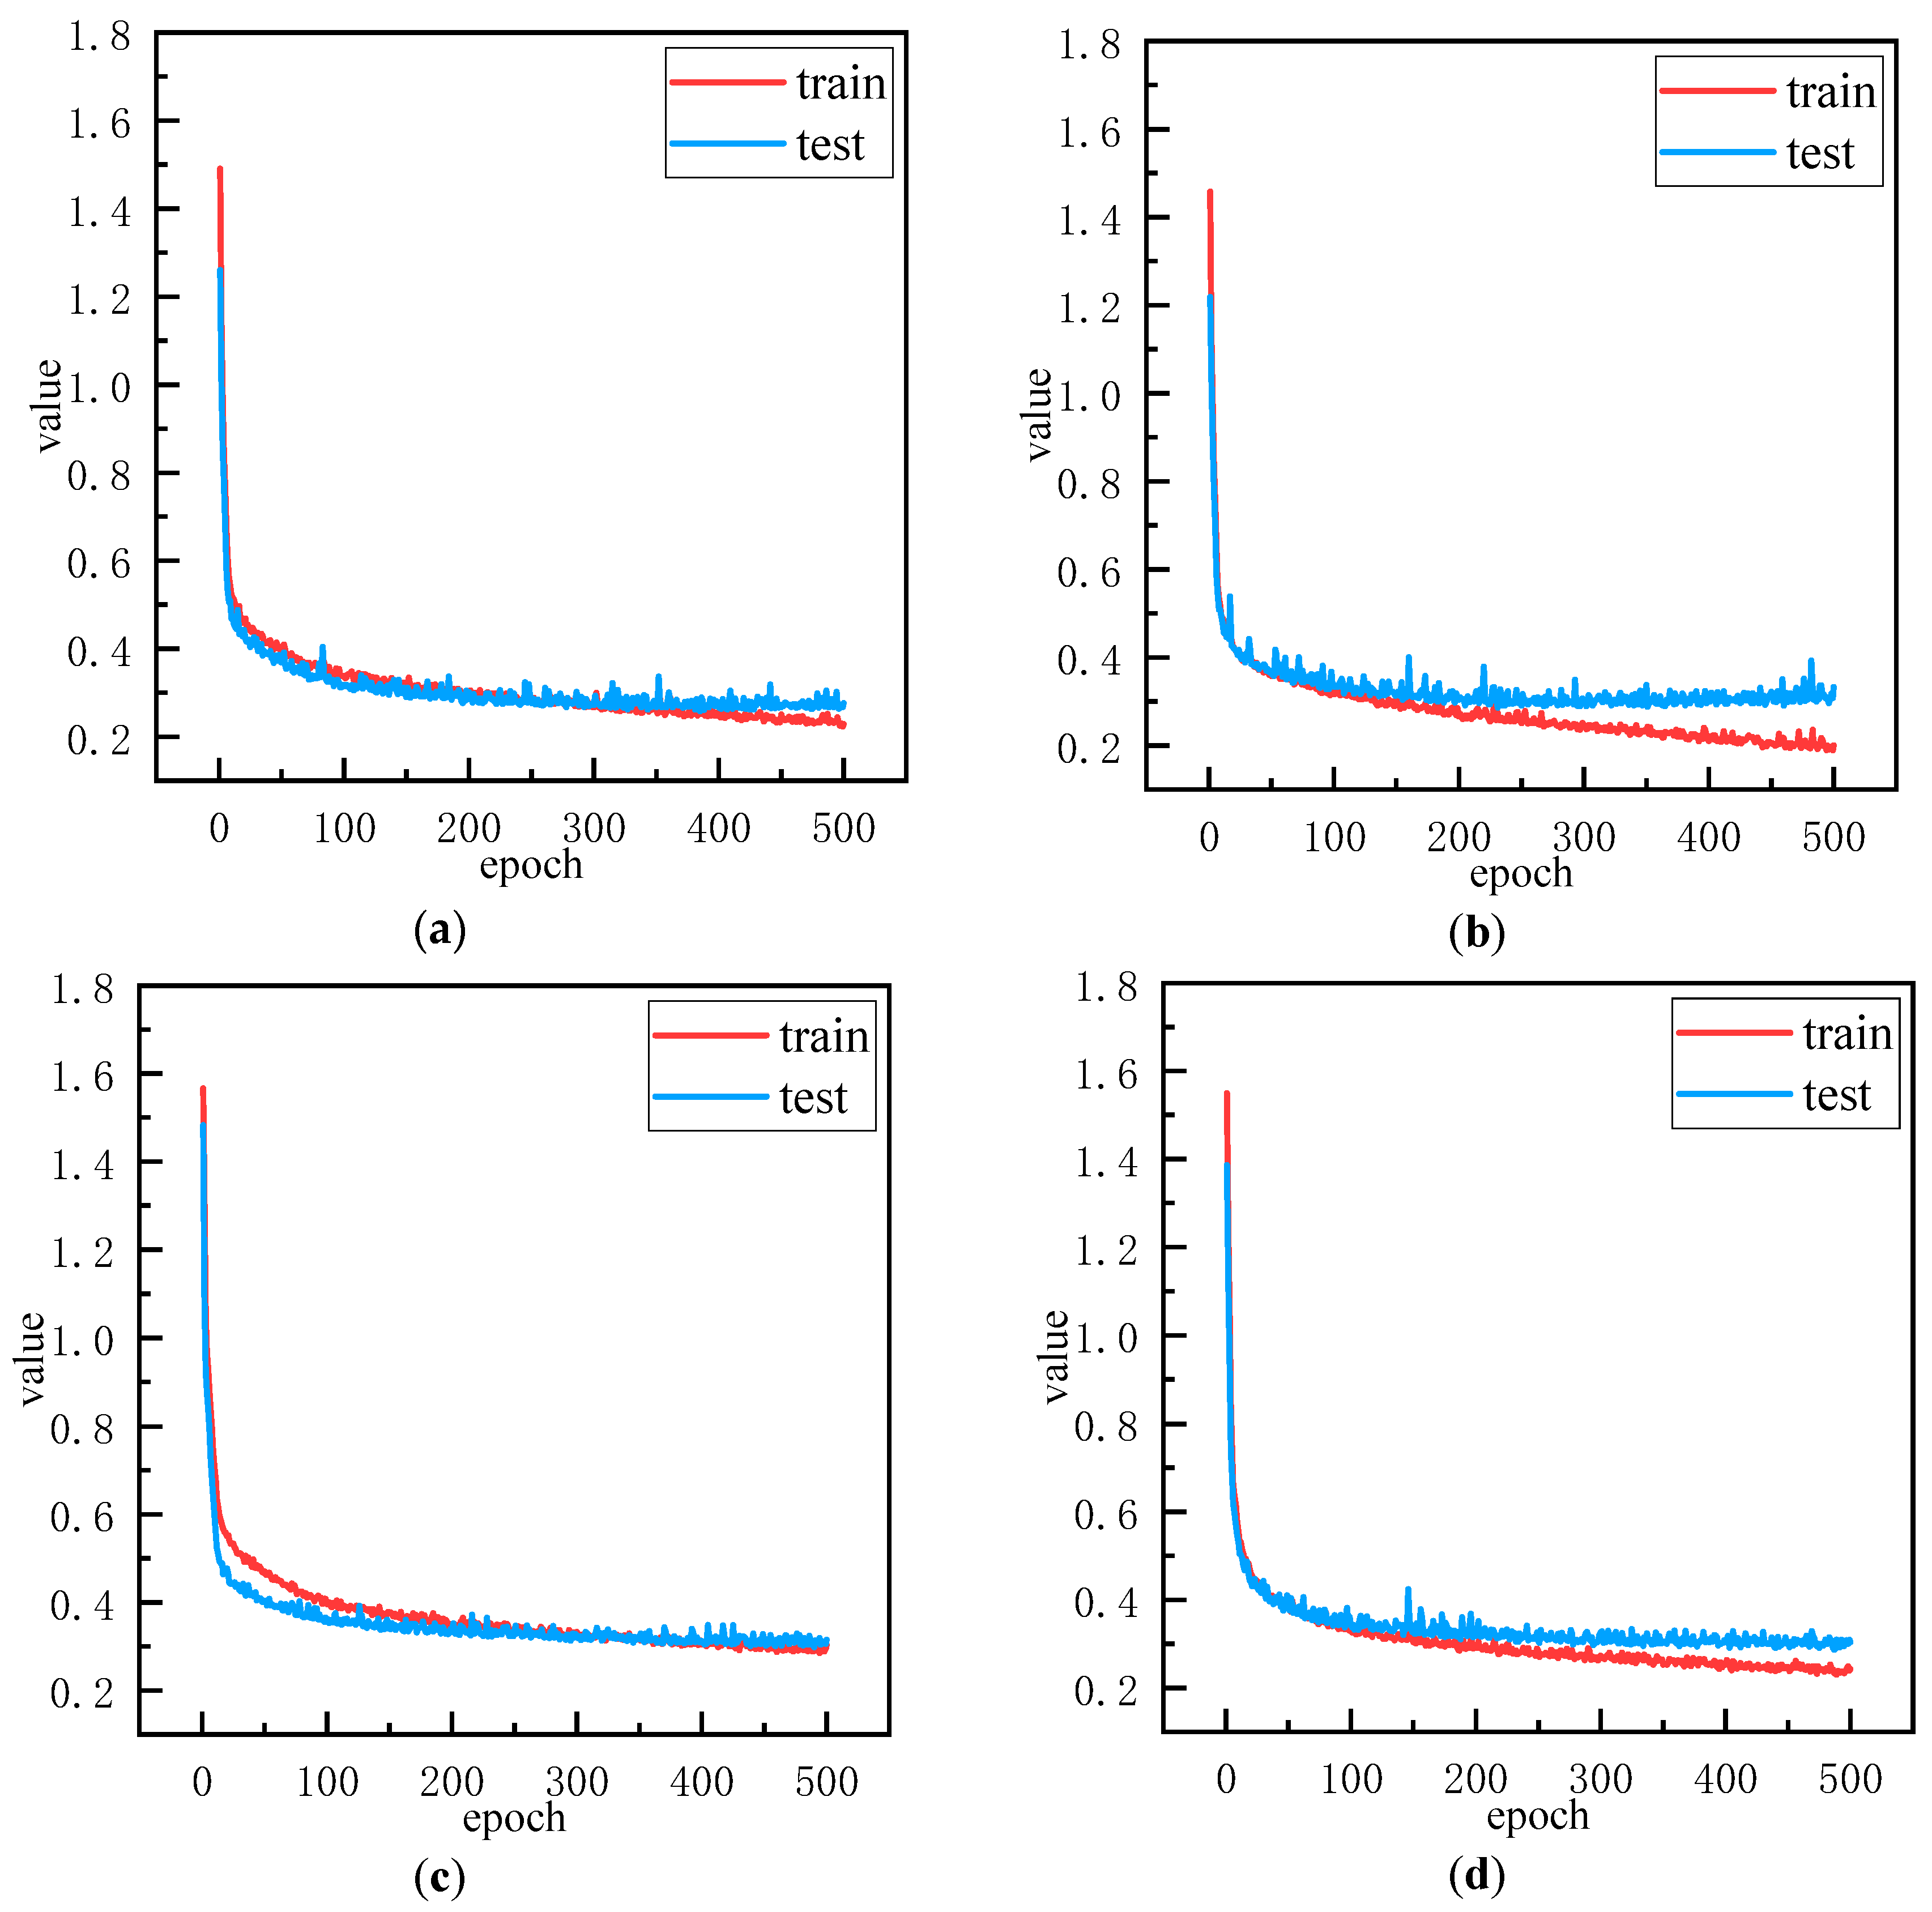
| Loss variation graph | Figure 6a | Figure 6b | Figure 6c | Figure 6d |
| State | Model | Precision | Recall | f1-Score |
|---|---|---|---|---|
| Normal state | CNN | 94.82 ± 0.23 | 77.84 ± 0.57 | 85.50 ± 0.48 |
| VGG16 | 94.91 ± 0.32 | 78.13 ± 0.14 | 85.71 ± 0.39 | |
| LSTM | 88.57 ± 0.28 | 84.25 ± 0.42 | 86.36 ± 0.41 | |
| ResNet18 | 95.03 ± 0.56 | 78.69 ± 0.09 | 86.09 ± 0.47 | |
| CNN-LSTM | 95.48 ± 0.34 | 80.32 ± 0.61 | 87.25 ± 0.21 | |
| Yaw system faults | CNN | 82.17 ± 0.58 | 92.05 ± 0.36 | 86.83 ± 0.45 |
| VGG16 | 83.28 ± 0.60 | 92.76 ± 0.13 | 87.76 ± 0.37 | |
| LSTM | 84.64 ± 0.54 | 92.21 ± 0.29 | 88.26 ± 0.50 | |
| ResNet18 | 83.75 ± 0.43 | 93.44 ± 0.59 | 88.33 ± 0.07 | |
| CNN-LSTM | 87.13 ± 0.46 | 94.09 ± 0.35 | 90.48 ± 0.63 | |
| Electrical system faults | CNN | 84.52 ± 0.20 | 87.61 ± 0.51 | 86.04 ± 0.38 |
| VGG16 | 84.94 ± 0.19 | 88.09 ± 0.49 | 86.49 ± 0.65 | |
| LSTM | 87.58 ± 0.12 | 88.64 ± 0.31 | 88.11 ± 0.52 | |
| ResNet18 | 85.67 ± 0.27 | 88.25 ± 0.42 | 86.95 ± 0.55 | |
| CNN-LSTM | 89.33 ± 0.08 | 88.48 ± 0.44 | 88.90 ± 0.32 | |
| Pitch system faults | CNN | 88.68 ± 0.33 | 91.24 ± 0.19 | 89.94 ± 0.64 |
| VGG16 | 88.75 ± 0.40 | 92.26 ± 0.55 | 90.47 ± 0.65 | |
| LSTM | 93.78 ± 0.11 | 89.15 ± 0.30 | 91.41 ± 0.25 | |
| ResNet18 | 89.12 ± 0.48 | 92.61 ± 0.57 | 90.03 ± 0.69 | |
| CNN-LSTM | 86.37 ± 0.06 | 96.46 ± 0.39 | 90.83 ± 0.52 | |
| Gearbox faults | CNN | 90.71 ± 0.28 | 94.54 ± 0.41 | 92.59 ± 0.56 |
| VGG16 | 90.28 ± 0.09 | 94.93 ± 0.47 | 92.55 ± 0.34 | |
| LSTM | 92.56 ± 0.61 | 94.67 ± 0.22 | 93.83 ± 0.46 | |
| ResNet18 | 91.49 ± 0.49 | 95.35 ± 0.06 | 93.17 ± 0.39 | |
| CNN-LSTM | 93.42 ± 0.16 | 97.39 ± 0.29 | 95.36 ± 0.33 |
Disclaimer/Publisher’s Note: The statements, opinions and data contained in all publications are solely those of the individual author(s) and contributor(s) and not of MDPI and/or the editor(s). MDPI and/or the editor(s) disclaim responsibility for any injury to people or property resulting from any ideas, methods, instructions or products referred to in the content. |
© 2024 by the authors. Licensee MDPI, Basel, Switzerland. This article is an open access article distributed under the terms and conditions of the Creative Commons Attribution (CC BY) license (https://creativecommons.org/licenses/by/4.0/).
Share and Cite
Qi, L.; Zhang, Q.; Xie, Y.; Zhang, J.; Ke, J. Research on Wind Turbine Fault Detection Based on CNN-LSTM. Energies 2024, 17, 4497. https://doi.org/10.3390/en17174497
Qi L, Zhang Q, Xie Y, Zhang J, Ke J. Research on Wind Turbine Fault Detection Based on CNN-LSTM. Energies. 2024; 17(17):4497. https://doi.org/10.3390/en17174497
Chicago/Turabian StyleQi, Lin, Qianqian Zhang, Yunjie Xie, Jian Zhang, and Jinran Ke. 2024. "Research on Wind Turbine Fault Detection Based on CNN-LSTM" Energies 17, no. 17: 4497. https://doi.org/10.3390/en17174497
APA StyleQi, L., Zhang, Q., Xie, Y., Zhang, J., & Ke, J. (2024). Research on Wind Turbine Fault Detection Based on CNN-LSTM. Energies, 17(17), 4497. https://doi.org/10.3390/en17174497