1. Introduction
With the rapid development of power systems as an important infrastructure, the economy and power quality of the power supply have been greatly improved. However, the increasing integration of renewable energy sources contributes to heightened randomness and complexity within the power system, posing significant challenges to its safe operation [
1]. The current distribution network faces many challenges, including the aging of traditional infrastructure, the difficulty of integrating renewable energy and distributed generation resources, the increasing complexity of demand side management, and the increasing demand for grid protection and automation [
2]. With the increasing demand for electricity and the acceleration of electrification, the reliability and resilience of distribution networks have been tested. In addition, power grid security and the ability to combat severe weather events have also become important issues. Enhancing the operational safety and disaster resilience of distribution networks is therefore crucial. Conducting effective vulnerability assessments and identifying vulnerable links for reinforcement are essential steps in achieving this goal [
3].
Currently, research on grid vulnerability predominantly focuses on transmission networks both domestically and internationally, with limited exploration into distribution networks. Existing studies primarily revolve around constructing vulnerability assessment systems, developing assessment methodologies, and exploring coupled system vulnerability assessments. Complex network theory serves as a foundational approach in deriving vulnerability assessment indices for distribution networks [
4,
5]. Notably, indices like electrical betweenness and enhanced line betweenness are commonly used indicators in vulnerability assessments [
6,
7]. Reference [
8] introduces metrics such as dielectric constant and power flow transfer entropy to evaluate distribution network state vulnerability, employing methods like the analytic hierarchy process (AHP) and entropy weight methods to derive comprehensive weight matrices for vulnerability indices. Reference [
9] redefines electrical betweenness metrics, considering the impact of bidirectional power flow following distributed energy integration, thereby proposing a method by which to evaluate vulnerable grid lines using complex network metrics. Additionally, references [
10,
11,
12] integrate probabilistic methods into power system analysis, enhancing understanding of system operation states through consideration of equipment failure rates and system state probabilities. Bayesian models and line betweenness metrics, as described in reference [
13], are utilized to assess grid line importance. Reference [
14] introduces complex network theory indices into energy storage planning for line vulnerability evaluation, pioneering new approaches for identifying vulnerable links. Reference [
15] explores grid vulnerability from an overload mechanism perspective, analyzing grid fault adjacency. With the rapid increase in the proportion of renewable energy, such as wind and light energy in the modern energy system, the impact of renewable energy source on the vulnerability of the distribution network cannot be ignored [
16]. Reference [
17] establishes models for integrated wind/PV/storage systems, using fault mode and Monte Carlo analyses to compute reliability under various scenarios. In reference [
18], the distribution network integrated with distributed energy and electric vehicles is studied, and the evaluation index and evaluation method based on the deep learning algorithm are proposed. Considering the influence of extreme weather on the distribution network, reference [
19] studied and summarized the general vulnerability assessment methods of distribution networks and the enhancement of power system resilience. In reference [
20], a voltage quality assessment method for distribution networks is proposed to stimulate the active/online management of voltage quality problems.
However, the current research on the vulnerability of distribution networks mainly focuses on local performance, and there is no in-depth evaluation of the effectiveness of the index system, nor does it combine the comprehensive evaluation with the local and overall network perspective. This limitation hampers efforts to capture distribution network dynamics fully and establish widely applicable evaluation standards [
21]. This paper addresses these gaps by comprehensively considering node operational status, voltage violations, transformer overloads, three-phase imbalances, and new energy integration impacts. These factors are quantified into corresponding indicators to establish a model for identifying vulnerable lines. Utilizing the principle of minimum discriminant information, comprehensive index weights [
22] are derived to facilitate distribution network line vulnerability assessments.
Through this study, we achieve the identification and comprehensive vulnerability assessment of vulnerable links within actual distribution networks. The contributions of this research are multifaceted.
First, we propose an improved semi-invariant probabilistic power flow calculation method to better assess distribution network risks under varying renewable energy source outputs and loads, enhancing power flow calculation efficiency and accuracy.
Second, we define identification indices for vulnerable links in distribution networks, including node and line vulnerability indices. The node vulnerability index utilizes the GWO-Elman model to predict load voltage data for the next period and establishes indices for transformer overloads, voltage violations, and three-phase imbalances to assess node vulnerability comprehensively. The line vulnerability index employs complex network theory, introducing improved branch degree and branch electrical transmission betweenness based on branch power supply matrices. Considerations of node degree and voltage stability further enhance comprehensive line vulnerability identification.
Finally, we establish an evaluation method for vulnerable links based on the principle of minimum discriminant information. This method integrates subjective weight vectors derived from the G1 order relation analysis method with objective weight vectors obtained through an enhanced entropy method. The combination of these weights using the principle of minimum discriminant information yields comprehensive weights used to assess distribution network line vulnerabilities.
The following is the structure of the remaining sections of the article.
Section 2 identifies the vulnerable links of the distribution network with renewable energy source by defining the indicators of vulnerable nodes and vulnerable lines. In
Section 3, the minimum discriminant information principle is used to combine the subjective and objective weights in order to obtain the comprehensive weight so as to realize the vulnerability assessment of the distribution network line. In
Section 4, the power distribution data of a line in Liaoning Province are used for simulation, which verifies that the evaluation method of vulnerable links is reasonable.
Section 5 provides the research conclusions and suggestions for future research.
3. Vulnerable Link Assessment Based on the Principle of Minimum Discriminant Information
Utilizing defined metrics for vulnerable nodes and lines, corresponding weights are assigned. Vulnerable links in the distribution network are identified using the minimum discriminant information principle. Commonly employed subjective and objective weighting methods include the analytic hierarchy process, fuzzy comprehensive evaluation method, G1 order relationship analysis method, and entropy weight method. Among these, the G1 order relationship analysis method stands out for its simplicity and intuitive nature, significantly reducing computational complexity and improving speed. Not requiring a judgment matrix eliminates the need for consistency testing and imposes no limits on the number of elements per level, ensuring the order of each element [
24]. The entropy weight method determines the index weights based on variation degrees of index values, mitigating human bias but potentially diverging from expected results, thus overlooking decision makers’ subjective intentions. Therefore, this study integrates the strengths and weaknesses of both methods, utilizing the G1 order relationship analysis method for subjective weighting and the entropy weight method for objective weighting, and ultimately applying the minimum discriminant information principle to compute comprehensive weights.
The vulnerability objective function, guided by the principle of minimum discriminant information, is formulated in Formula (16):
where
is the objective function to make the comprehensive weight
as close to the subjective and objective weight as possible;
is the comprehensive weight of the
index; and
is the subjective weight coefficient of the
index and the calculation formulae are as follows:
The values are 1, 1.2, 1.4, 1.6, and 1.8. The larger the value, the greater the importance of index than index .
is the objective weight coefficient of the
index, and the calculation formulae are as follows:
where
satisfies
;
is the number of indicators; and
is the entropy of the index and satisfies
.
The vulnerability objective function based on the Lagrange function is solved as follows. To determine the optimal solution for the problem at hand, we construct the Lagrangian function.
Let
,
, then
The comprehensive weight is obtained from Formula (25):
By substituting the indicators of vulnerable nodes and vulnerable lines, the comprehensive evaluation results of vulnerable links in the distribution network can be obtained.
where
is the comprehensive evaluation value of vulnerable links; and
is the value of each index, and
. The larger the value of
, the higher the vulnerability caused by the quality of the power supply.
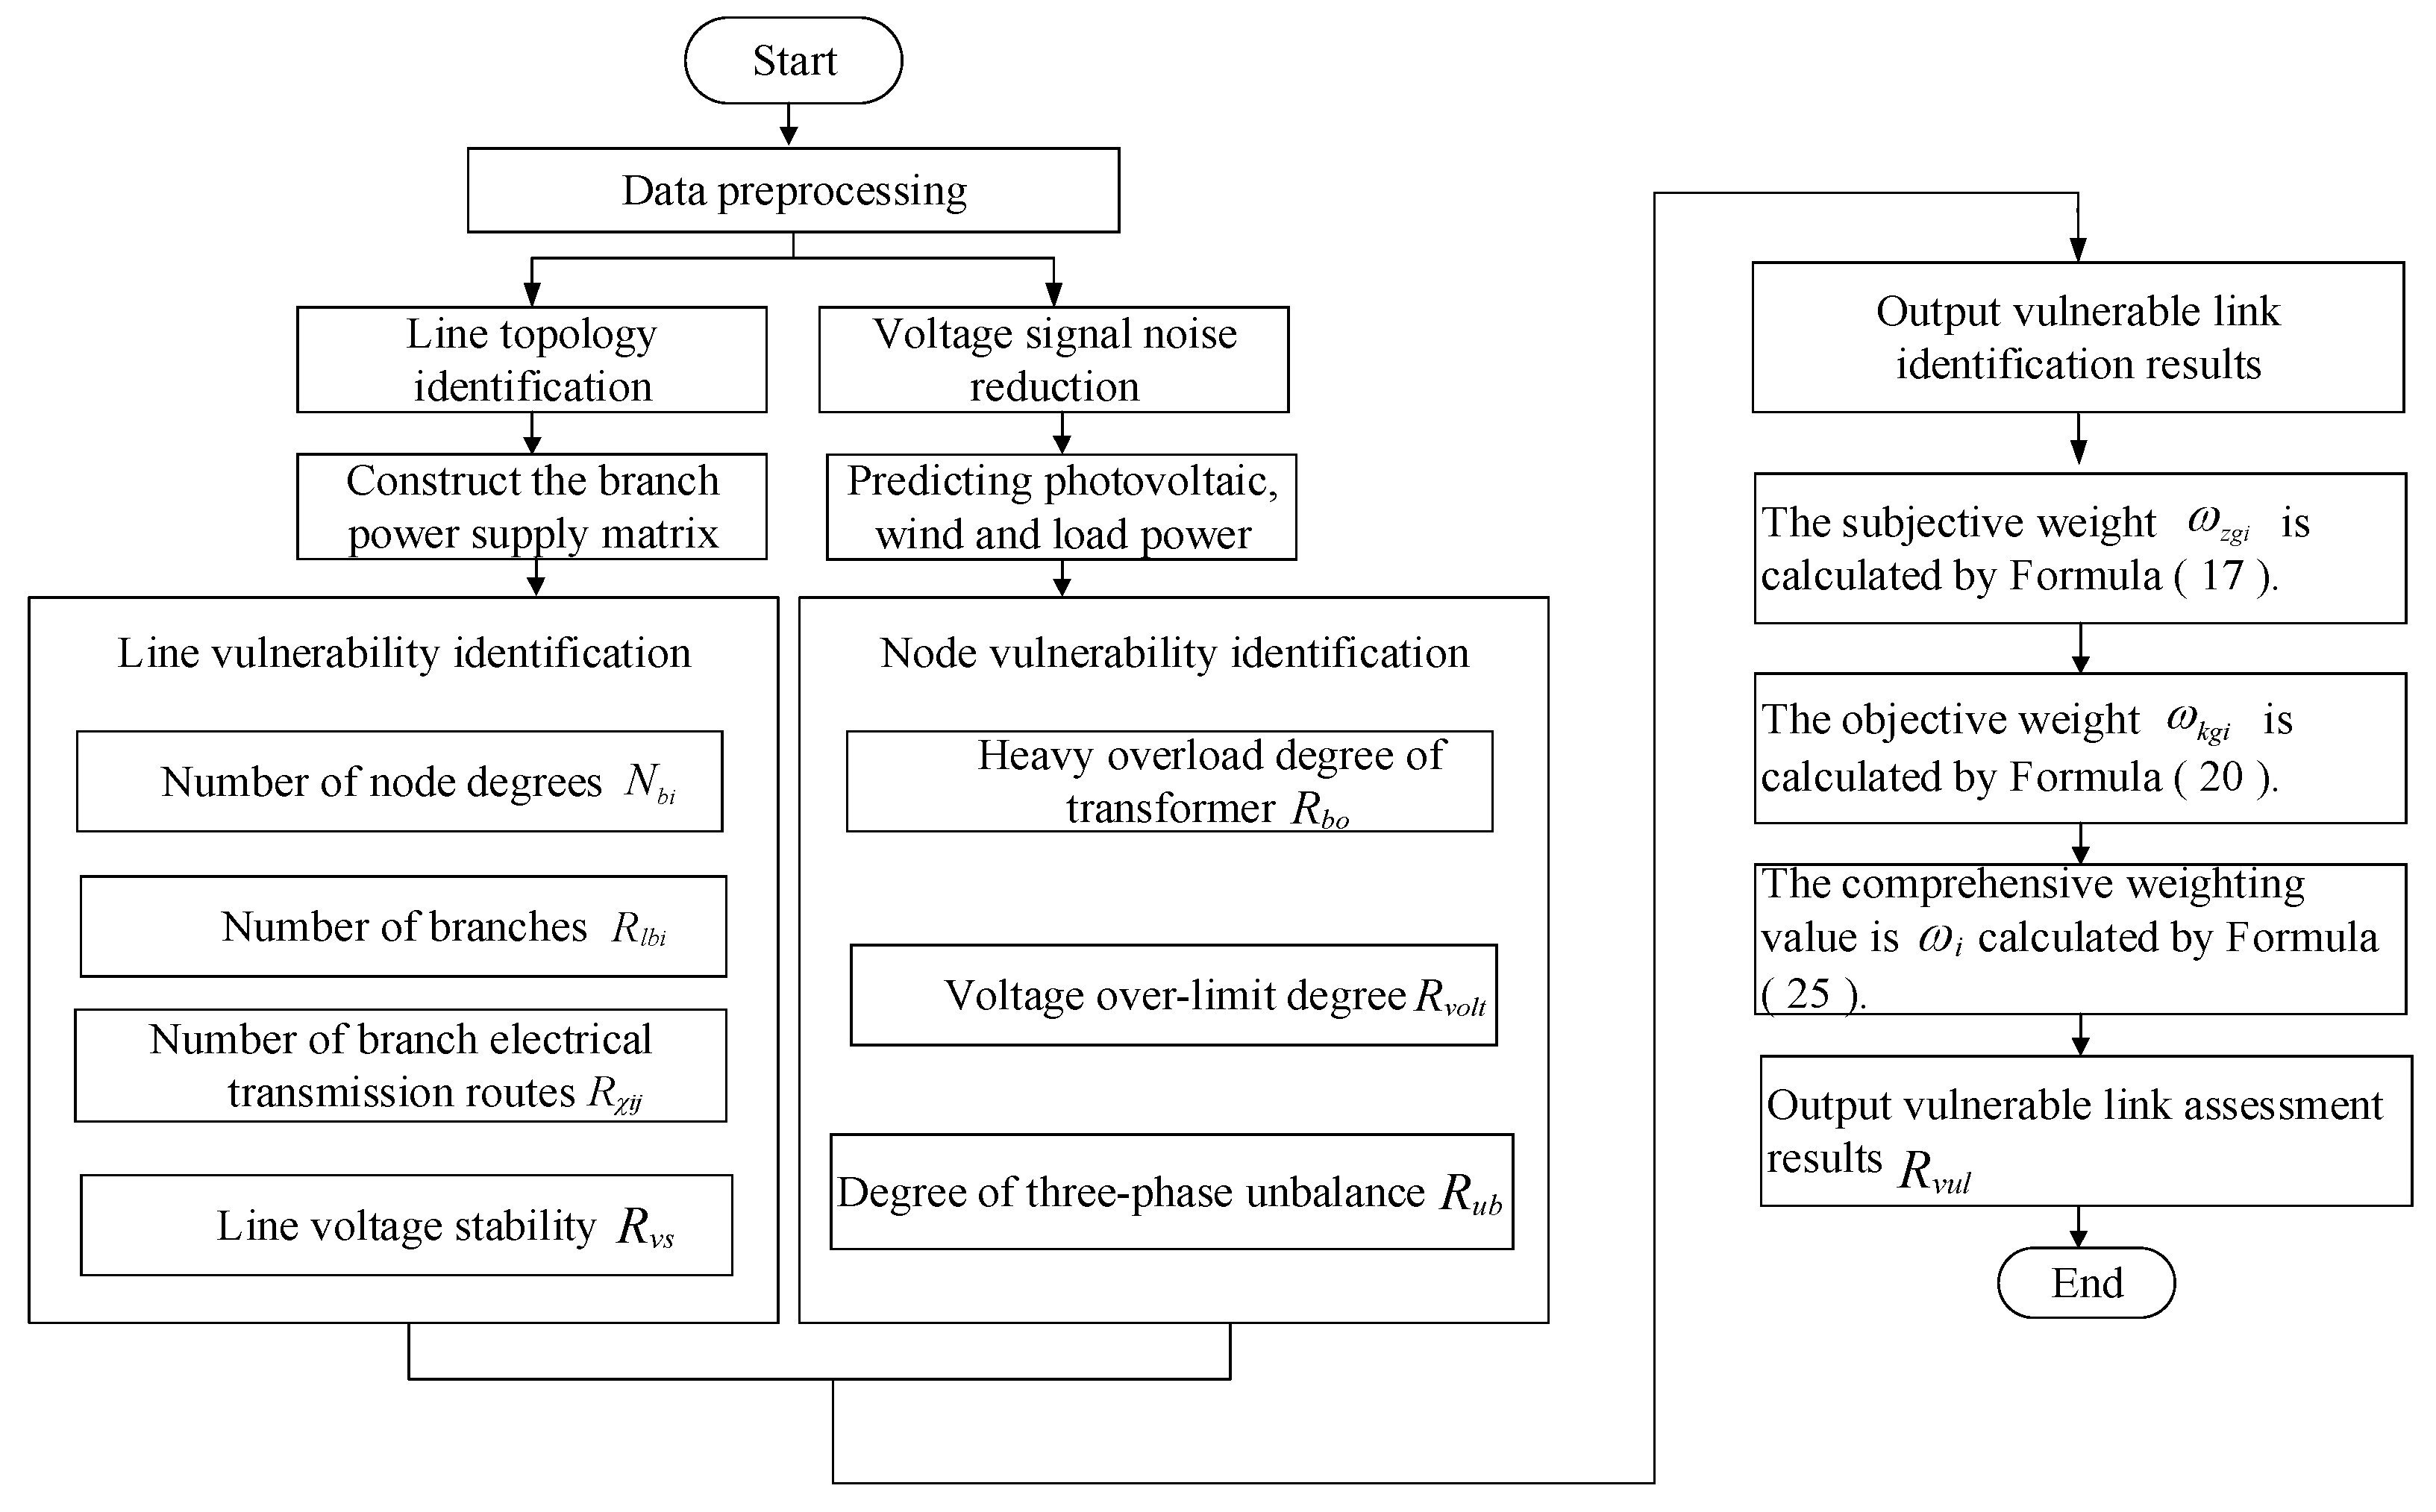
The identification and evaluation process of vulnerable links in the distribution network with renewable energy source is shown in
Figure 2.
First, before proceeding with data utilization, it is imperative to perform preprocessing to maximize data authenticity. Incomplete datasets are processed accordingly to ensure data integrity.
In the identification of vulnerable nodes, empirical mode decomposition is employed to denoise the voltage signal, thereby reducing noise interference and aligning predictions more closely with actual development trends. Subsequently, the grey wolf algorithm (GWO) optimizes the parameters of the Elman neural network, enabling the GWO-Elman model to forecast load voltage data [
25]. Additionally, an adaptive kernel density estimation method establishes a wind–solar output model. Finally, criteria such as transformer heavy overload, voltage limits exceeding, and three-phase voltage imbalance are defined to pinpoint vulnerable nodes.
In the identification of vulnerable lines, the relationship between nodes and branches in the directed graph is established by using the correlation matrix method of graph theory. Then, the branch power supply matrix is derived via matrix derivation. Second, the concept of degree and betweenness of a complex network is adopted to integrate electrical parameters into a complex network to better describe the correlation degree, power transmission, and voltage stability of branches in the distribution network. Then, all lines are analyzed and compared using vulnerable line identification, and then, vulnerable lines are sorted according to different vulnerabilities.
Finally, leveraging indicators from both vulnerable nodes and lines, the G1 sequence relation analysis method is applied to determine subjective weight values, while an enhanced entropy weight method calculates objective weight values. These are combined using the principle of minimum discriminant information to compute comprehensive weights, facilitating a thorough assessment of vulnerable links in the distribution network.
4. Example Analysis
This paper utilizes distribution and consumption data from a distribution network line located in Liaoning Province for the example analysis. The Maiwang line spans a total length of 13.097 km and encompasses 805 nodes, including 243 distribution transformers. The combined capacity of these transformers is 23.245 MVA, with the main transformer reaching a peak load rate of 51.5%. Nodes 182 and 386 serve as photovoltaic access points, while nodes 610 and 710 serve as wind power access points. The installed capacity of the photovoltaic power station is 500 KW, and the total area of the photovoltaic module is
. The Homer version 2.81 software is used to generate the light intensity sequence of China’s Liaoning region (118°53′ E, 38°43′ N). The shape parameters
and
of the Beta distribution and the photoelectric conversion efficiency
are calculated. The wind speed data are also taken from the Weibull distribution with the scale parameter of 7.39 and the shape parameter of 3 in Liaoning area. The cut-in wind speed is 3 m/s, the constant power wind speed is 10 m/s, the cut-out wind speed is 23 m/s, and the rated power of each wind turbine is 500 KW.
Figure 3 shows the local branch diagram of the 10 kV Maiwang line.
4.1. Calculation Results and Analysis of 10 kV Side Power Flow
Figure 4 illustrates the power flow calculations for the Maiwang line, different colored lines in the figure represent different moments. The figure indicates that in certain instances, the voltage level on the 10 kV side meets the specified requirements; while in most instances, it remains in a state close to the lower limit. The power supply capacity from some nodes to the end branch is insufficient. If the load rate is too large, the current in the line will be too large, so the line loss of the main line will rise sharply. The calculation result of the line loss of the Maiwang line based on the power correction module is shown in
Figure 5. The main line closer to the PowerPoint will lead to too large a line loss in the interval due to too large a current. On the contrary, the line diameter of the end node is too small, and the current is relatively small compared with the node close to the substation, so the loss is relatively small.
4.2. Identification and Analysis of Vulnerable Nodes
Figure 6 depicts the operational status of the system, with node data collected at 15-min intervals, totaling 96 data points daily.
Figure 7 presents voltage data for the subsequent moment, derived from processed data using GWO-Elman neural network predictions. Singular value decomposition is then applied to determine periodic singular values, followed by entropy theory to calculate singular value entropy. Evaluating the system’s operational state is based on maximum and minimum entropy values; lower entropy values indicate greater stability and less variation. As shown in
Figure 6, the degree values for each node hover around 0.7, indicating a state of stable operation. Vulnerable nodes are evaluated based on the operation status of the distribution network system.
The heavy overload degree of the transformer is obtained by the transformer heavy overload index
, that is, Formula (8).
Figure 8 shows the degree of heavy overload of the transformer at 18:00, which is also the moment when the number of heavy overloads is the largest throughout the day. The degree of heavy overload of the transformer is obtained by the load rate undertaken by the transformer.
From the three-phase imbalance index
, the three-phase imbalance degree of the node is obtained.
Figure 9 displays the degree of three-phase imbalance for nodes on the Maiwang line. The figure illustrates that the number of nodes experiencing significant three-phase imbalance is minimal, indicating minimal impact on the system.
From the voltage over-limit index
, the node voltage over-limit degree is obtained. In
Figure 10, the node voltage over-limit degree for the Maiwang line is depicted. It is observed that during daytime hours, there is a notable occurrence of nodes exceeding voltage limits, predominantly located at the line’s terminus. This is attributed to increased load rates during daytime hours, leading to compromised power quality at these end nodes. Therefore, it is imperative to implement appropriate measures to ensure uninterrupted electricity supply for end node users.
4.3. Identification and Analysis of Vulnerable Lines
The node degree is the number of edge paths connected by the node. The higher the number of edges, the more important the power supply role of the node in the network.
Figure 11 presents the evaluation results for node degrees along the Maiwang line. Nodes located on the main line exhibit higher importance, reflected in their higher node degrees. Similarly, branch line nodes, which also carry significant responsibilities, demonstrate higher node degrees compared to end nodes.
From the branch degree index
, the branch degree evaluation result is obtained.
Figure 12 displays the assessment outcomes regarding the branching degree of the Maiwang line. It is evident from the figure that branch 483 exhibits a higher degree, with a length measuring 1554 m and a conductor model of LGJ00035. In terms of electrical parameters, the branch conductor is characterized by excessive length and thinness, which adversely impacts the power supply to subsequent nodes, thereby justifying its higher branching degree.
From the transmission betweenness index
, the evaluation result of branch transmission betweenness is obtained.
Figure 13 shows the evaluation results of the transmission betweenness of the Maiwang line branch. The transmission betweenness of the main line and the branch line is relatively high because these lines are closely related to the nodes and other branches. The branch connected by the end node has a small number of connected nodes, so the transmission betweenness of such branches is small.
From the voltage stability index
, the evaluation results of branch voltage stability are obtained.
Figure 14 presents the assessment results regarding the voltage stability of branches on the Maiwang line. Specifically, branches 172 and 649 exhibit poor stability. Branch 172 is linked to a specialized distribution transformer serving the quarry, while branch 649 is connected to a specialized distribution transformer serving the Hexi farm. Both the quarry’s heavy equipment and the farm’s aquaculture equipment consume substantial electrical energy and are sensitive to the start–stop cycles of large loads in their respective environments, contributing to voltage instability along these branches. Additionally, the figure illustrates that voltage instability is prevalent at the line’s terminus, likely due to undersized wiring and some degree of line aging. When the load rate increases, the loss shows a nonlinear change, which leads to the instability of the line voltage. According to the actual field investigation, the users at the end of the line are in a low voltage state for a long time, which makes the household appliances unable to work normally or even operate, which is very inconvenient for production and life. However, the voltage stability of most branches of the line does not exceed 0.1, and the voltage is relatively stable under normal operation.
4.4. Vulnerable Link Assessment Results of the Distribution Network
In terms of subjective evaluation, the six groups of indicators are ranked based on frontline operators’ experience. The order of importance is as follows: branch voltage stability, node voltage over-limit degree, node transformer heavy overload degree, node three-phase imbalance, branch electrical transmission betweenness, and branch degree. For objective weighting, the improved entropy weight method is employed. This method determines index weights based on each index’s variation, thereby mitigating biases introduced by subjective human judgment. Hence, the objective weighting method selects the improved entropy weight method for comprehensive analysis and evaluation.
Table 1 presents the subjective weight values obtained through the G1 order relation method for each index, while
Table 2 shows the objective weight values derived from the improved entropy weight method.
By calculating the comprehensive weight based on the principle of minimum discriminant information and substituting each index of vulnerable nodes and vulnerable lines, the comprehensive evaluation results of vulnerable links in the distribution network can be obtained, as shown in
Figure 15. The diagram indicates the Maiwang line’s overall stable operation, with a few nodes exhibiting anomalies.
Table 3 details links identified with higher vulnerability.
4.5. Comparison of Evaluation Methods
The link with the comprehensive vulnerability ranking in the top 5 is selected and compared with the results of scheme 1 and scheme 2, as shown in
Table 4.
Scheme 1 is to use the general degree, betweenness, path length, aggregation coefficient, and cohesion index to evaluate the vulnerable links of the distribution network.
Scheme 2 is based on complex network theory and risk theory. The node and line vulnerability indices are proposed, and the analytic hierarchy process is used to sum the weights of each index to obtain the comprehensive vulnerability index and evaluate the vulnerable links.
Compared with scheme 1, the method in this paper identifies four vulnerable links, and the identification results are basically similar, but the ranking is slightly different. The reason is that there are differences in the indicators considered by the two evaluation methods. Link 14 is the vulnerable link identified in this paper rather than the vulnerable link identified in scheme 1, and link 285 is the vulnerable link identified in scheme 1 rather than the vulnerable link identified in this paper. Although the vulnerability of link 14 in node degree is lower than 285, the transmission betweenness and voltage stability of link 14 branch are higher than those of link 285. Therefore, considering the above factors, the vulnerability of link 14 is higher than that of link 285.
Compared with scheme 2, the method in this paper identifies four vulnerable links, and the identification results are basically similar, but the ranking is slightly different. The reason is that there are differences in the comprehensive weighting methods considered by the two evaluation methods. Link 49 is the vulnerable link identified in this paper rather than the vulnerable link identified in scheme 2, and link 483 is the vulnerable link identified in scheme 2 rather than the vulnerable link identified in this paper. Although the vulnerability of link 49 in branch degree evaluation is lower than that of link 483, the node degree evaluation and voltage stability of link 49 are higher than those of link 483. Therefore, considering the above factors, the vulnerability of link 49 is higher than that of link 483.
5. Conclusions
The research goal of this paper is to propose a method for evaluating the vulnerable links of the distribution network with renewable energy source, which can quantify the risk of the distribution network and then identify the vulnerable links of the distribution network in combination with the grid structure information of the distribution network. It is helpful to monitor and warn, in a timely manner, of the risk of the distribution network after the distributed power supply is connected to the grid and provide theoretical support for system planning and scheduling operation. In this paper, the combination of theoretical modeling and simulation analysis is used to evaluate the vulnerable links of the distribution network with renewable energy source and identify the vulnerable links. The main results are as follows:
When dealing with a distribution network with a high proportion of distributed energy, the traditional probabilistic power flow calculation method has problems such as low accuracy and long calculation time, which need to be improved and optimized. Therefore, considering the random output characteristics of renewable energy source and load, this paper proposes an improved semi-invariant probabilistic power flow calculation method, which improves the efficiency and accuracy of power flow calculation and can more accurately evaluate the safety and stability of power system.
The evaluation index system of vulnerable links in a distribution network with renewable energy source is established. The reliability indices of traditional distribution network at home and abroad are extracted. These indices reflect the power supply capacity of the distribution network for a long time and lack the investigation of node voltage and line power flow in the distribution network. With the access of a high proportion of renewable energy source, the identification of vulnerable links in a distribution network is more complicated. In view of the increasingly obvious phenomenon of voltage over-limit and power flow over-limit after the access of distributed generation to a distribution network, this paper defines the identification index of vulnerable links in a distribution network with renewable energy source, including vulnerable line node index and vulnerable line identification index, which improves the traditional reliability index system and considers it more comprehensively.
Aiming at the comprehensive evaluation of the vulnerable links of the distribution network, this paper uses the subjective and objective weighting method to analyze each index subjectively and objectively. Then, the comprehensive weighting method based on the minimum discriminant information theory is adopted to evaluate the vulnerable links of the distribution network comprehensively, which makes the evaluation results more reasonable. The distribution and utilization information of the Maiwang line is used for example analysis. From the simulation results, it can be seen that the overall operation of the Maiwang line is relatively stable, and the evaluation of vulnerable links is more reasonable. Some theoretical calculation methods and governance strategies have been applied in actual projects, and the feasibility of theoretical research has been further verified by actual results.
In addition, this paper does not consider the impact of electric vehicle clusters and network attacks on the vulnerability of distribution networks. With the rapid development and popularization of electric vehicles, the impact of electric vehicle access on the distribution network is becoming more and more obvious. In the future, large-scale electric vehicle access to the distribution network will be considered, the distribution of vehicle-network energy flow will be analyzed, and the vulnerability assessment of the distribution network will be carried out.


