Article

Thermodynamic Comparative Analysis of Cascade Refrigeration System Pairing R744 with R404A, R448A, and R449A with Internal Heat Exchanger: Part 1—Coefficient of Performance Characteristics

Department of Refrigeration and Air-Conditioning Engineering, College of Engineering, Pukyong National University, 45, Yongso-ro, Nam-gu, Busan 48513, Republic of Korea
*
Author to whom correspondence should be addressed.
Energies 2024, 17(17), 4481; https://doi.org/10.3390/en17174481
Submission received: 3 August 2024 / Revised: 27 August 2024 / Accepted: 4 September 2024 / Published: 6 September 2024
(This article belongs to the Section J: Thermal Management)

Abstract

:
The R744/R404A cascade refrigeration system (CRS) has been widely used in supermarkets and hypermarkets, but due to the refrigerant regulation of R404A, research on alternative refrigerants is necessary. In addition, although there have been quite a few studies on R448A and R449A, which are well-known alternatives to R404A, few studies have analyzed the performance coefficients of the three refrigerants, and the studies that have analyzed them are not based on enough variables. Therefore, we aimed to understand the performance characteristics of CRS combined with an internal heat exchanger (IHX) by applying R744 for the low-temperature cycle (LTC) and R404A, R448A, and R449A for the high-temperature cycle (HTC). The analysis method was to analyze the coefficient of performance (COP) and mass flow rate (MFR) of the three refrigerants according to the degree of subcooling (DSC) and degree of superheating (DSH), IHX efficiency, temperature difference in the cascade heat exchanger (CHX), condensation temperature (CT), evaporation temperature (ET), and cascade evaporation temperature (CET). The purpose of this study is to compare R448A and R449A, alternative refrigerants to R404A, in an R744/R404A CRS, with R404A to provide sufficient data for optimal CRS design. The comparison results are as follows: (1) Compared with R404A, the MFR of R448A and R449A are 67.27–77.6% and 70.05–80.80%, respectively, under the same conditions. Therefore, R448A and R449A are economically favorable because they have less refrigerant charge than R404A, and R448A is more favorable than R449A. (2) The R744/R448A CRS is stable and performs better than the R744/R449A CRS in places with large changes in the surrounding environment.

1. Introduction

In large supermarkets, R744 refrigerant has been mainly used on the low-temperature cycle (LTC) of the cascade refrigeration system (CRS), and R290, R717, and R404A refrigerant on the high-temperature cycle (HTC) [1]. In 1993, 220 large supermarkets in Norway reported that approximately 30% of the refrigerant leaked annually [2]. For these reasons, the R744/R404A CRS has been widely used as a refrigerant in refrigerators used by many citizens in large supermarkets due to problems such as flammability and toxicity [3]. However, with the adoption of EU Regulation No 517/2014, R404A will be banned in Europe from the most commonly used refrigeration applications due to its extremely high global warming potential (GWP) value (3943). Therefore, research is being conducted on R448A and R449A refrigerants as alternative refrigerants instead of R404A refrigerants, as follows.
Citarella et al. [4] proposed a thermo-economic analysis based on a calibrated model and real-world constraints to explore possible design options for a 2.5 kW commercial refrigeration unit for R404A, R290, R449A, R452A, R454C, and R455A with a low environmental impact. The results show that R449A performs better as a medium-term scenario refrigerant in the European market, while R454C may be suitable as a long-term replacement.
Alam and Jeong [5] noted that R448A, which has a GWP of 1390, and R449A, which has a GWP of 1282, are recommended for commercial refrigeration systems to replace R404A, which has a GWP of 3943, according to EU Regulation 517/2014. The thermodynamic properties of R448A and R449A, including the vapor pressure with critical point, saturation density, and vapor-liquid coexistence curves, were calculated over a temperature range of 233.15 K to 343.15 K by molecular dynamics simulations, and the calculated vapor pressures of R448A and R449A were found to be in close agreement with those of R404A.
Jörgen Rogstam et al. [6] evaluated the feasibility of replacing R404A with R449A in a realistic and unbiased manner. Two different supermarket stores (case study1-Large size fully indirect system and case study2-Small DX system) were selected for the evaluation, both of which are representative facilities facing future conversions.
Kedzierski and Kang [7] studied the horizontal convective boiling of R448A, R449A, and R452B in a microfin tube, and Lillo et al. [8] analyzed the experimental thermal and hydraulic characteristics of R448A and compared it with R404A during flow boiling. And Kim and Kim [9] studied the evaporative heat transfer of low GWP alternative refrigerants (R448A, R449A, R455A, and R454C) for R404A in microfin tubes.
Lee et al. [10] studied the condensation heat transfer and pressure drop of low GWP R-404A replacement refrigerants (R448A, R449A, R455A, and R454C) in 5.6 mm inner diameter horizontal smooth tubes; Jacob et al. [11] compared the condensation heat transfer and pressure drop of R404A with its low global warming potential replacement candidates R448A and R452A.
Ghanbarpour et al. [12] conducted ANN modeling to analyze the replacement of R404A with R449A, a low-GWP alternative, in indirect supermarket refrigeration systems. Makhnatch et al. [13] proposed retrofitting an existing R404A indirect supermarket refrigeration system with the lower GWP alternative R449A, with only minor modifications. They demonstrated that with minor expansion unit adjustments and a 4% increase in refrigerant charge, R449A can be used in this refrigeration system designed for R404A due to its suitable thermodynamic properties and allowable maximum discharge temperature.
Mota-Babiloni et al. [14] proposed a semi-empirical analysis based on field test measurements performed on R404A MT and LT supermarket refrigeration systems with subcoolers. The goal is to predict the energy, environmental, and economic effects of a system redesign using the R449A advanced vapor compression configuration and determine key factors affecting feasibility. Giménez-Prades et al. [15] evaluated the use of R449A subcooling in commercial refrigeration systems and proposed an environmentally friendly alternative refrigerant. First, we semi-empirically analyze the effect of integrated supercooling.
Mota-Babiloni et al. [16] experimentally compared R404A with R448A, a non-flammable alternative with a GWP of 1390. Laboratory tests were intended to simulate typical freezing and storage temperatures and various condensation conditions. The cooling capacity of R448A was slightly lower than that of R404A, but the energy consumption of R448A was much lower. R448A COP was higher than that obtained using R404A. Therefore, it can be concluded that R448A can be an energy-efficient alternative to R404A by reducing GWP by 70%.
As seen above, among recent studies, there have been quite a few individual studies on R448A and R449A, which are well-known as alternative refrigerants due to the regulation of R404A refrigerants, but there are few studies that have compared and analyzed the COP of all three refrigerants. And even the few papers that have been conducted are not based on sufficient parameters. Additionally, there is no comparative study applying R404A, R448A, and R449A to the HTC of CRS. Therefore, we aim to provide optimal design data for CRS by applying R744 to LTC and R404A, R448A, and R449A to HTC by analyzing the power consumption of the compressor (PCC), COP, mass flow rate (MFR), MFR ratio with respect to changes in the condensation temperature (CT), evaporation temperature (ET), cascade evaporation temperature (CET), degree of superheating (DSH), degree of subcooling (DSC), internal heat exchanger (IHX) efficiency, and temperature difference in the cascade heat exchanger (CHX) of HTC and LTC that affect CRS, which is widely used in hypermarkets and supermarkets.

2. Mathematical Model

2.1. System Description

Figure 1 is a schematic diagram of a system for comparative analysis of the characteristics of CRS with IHX applying R744 to LTC and R404A, R448A, and R449A to HTC. The refrigeration cycle using R744 is divided into a supercritical and subcritical cycle. When a condenser (in the supercritical cycle, it is called a gas cooler rather than a condenser) is used for hot water and heating, it is driven by the supercritical cycle, and when an evaporator is used for cooling, it is driven by the subcritical cycle. Therefore, in this study, the LTC of a CRS to be used at low temperatures in large marts and supermarkets is driven by a subcritical cycle. R404A of a R744/R404A CRS, which is widely used in large supermarkets, etc., is regulated and restricted because it is a refrigerant with a high GWP index (GWP 1500 or more). Accordingly, we would like to compare the application of R448A and R449A, which are well-known as alternative refrigerants for R404A, with the R744/R404A CRS using the existing R404A.
We want to explore how and how much evaporation capacity (EC) and cascade evaporation capacity (CEC), and the PCC, COP, MFR, and MFR ratio of high- and low-temperature cycles differ for a wide range of conditions (DSH ( T S U H , H T C ) and DSC ( T S U C , H T C ) of HTC, IHX efficiency ( η I H X , H T C ), DSH ( T S U H , L T C ) of LTC, the temperature difference between CHX ( T C A S ), CT ( T C ), CET ( T C A S , E ), and ET ( T E )) that affect the performance of the CRS. In CRS, the DSC of the LTC was not set as a variable in the CRS because it is determined by the efficiency and temperature difference in the CHX.
In addition, when applying IHX to the R744 refrigeration cycle, the efficiency is good when operating as a supercritical cycle [17,18], but the efficiency deteriorates when operating as a subcritical cycle [18,19]. Therefore, when applying R744 to the LTC of CRS, the COP decreases as the efficiency or capacity of the IHX increases because it operates in a subcritical cycle, so we omitted the analysis according to the efficiency of the IHX in the LTC.
For refrigerators used in supermarkets and hypermarkets, the low temperature is determined by the object to be stored, and the freezing capacity is an important factor. Therefore, in this study, R404A, R448A, and R449A refrigerants are applied at the same evaporation temperature, and the EC is fixed at 50 kW to compare them with each other.

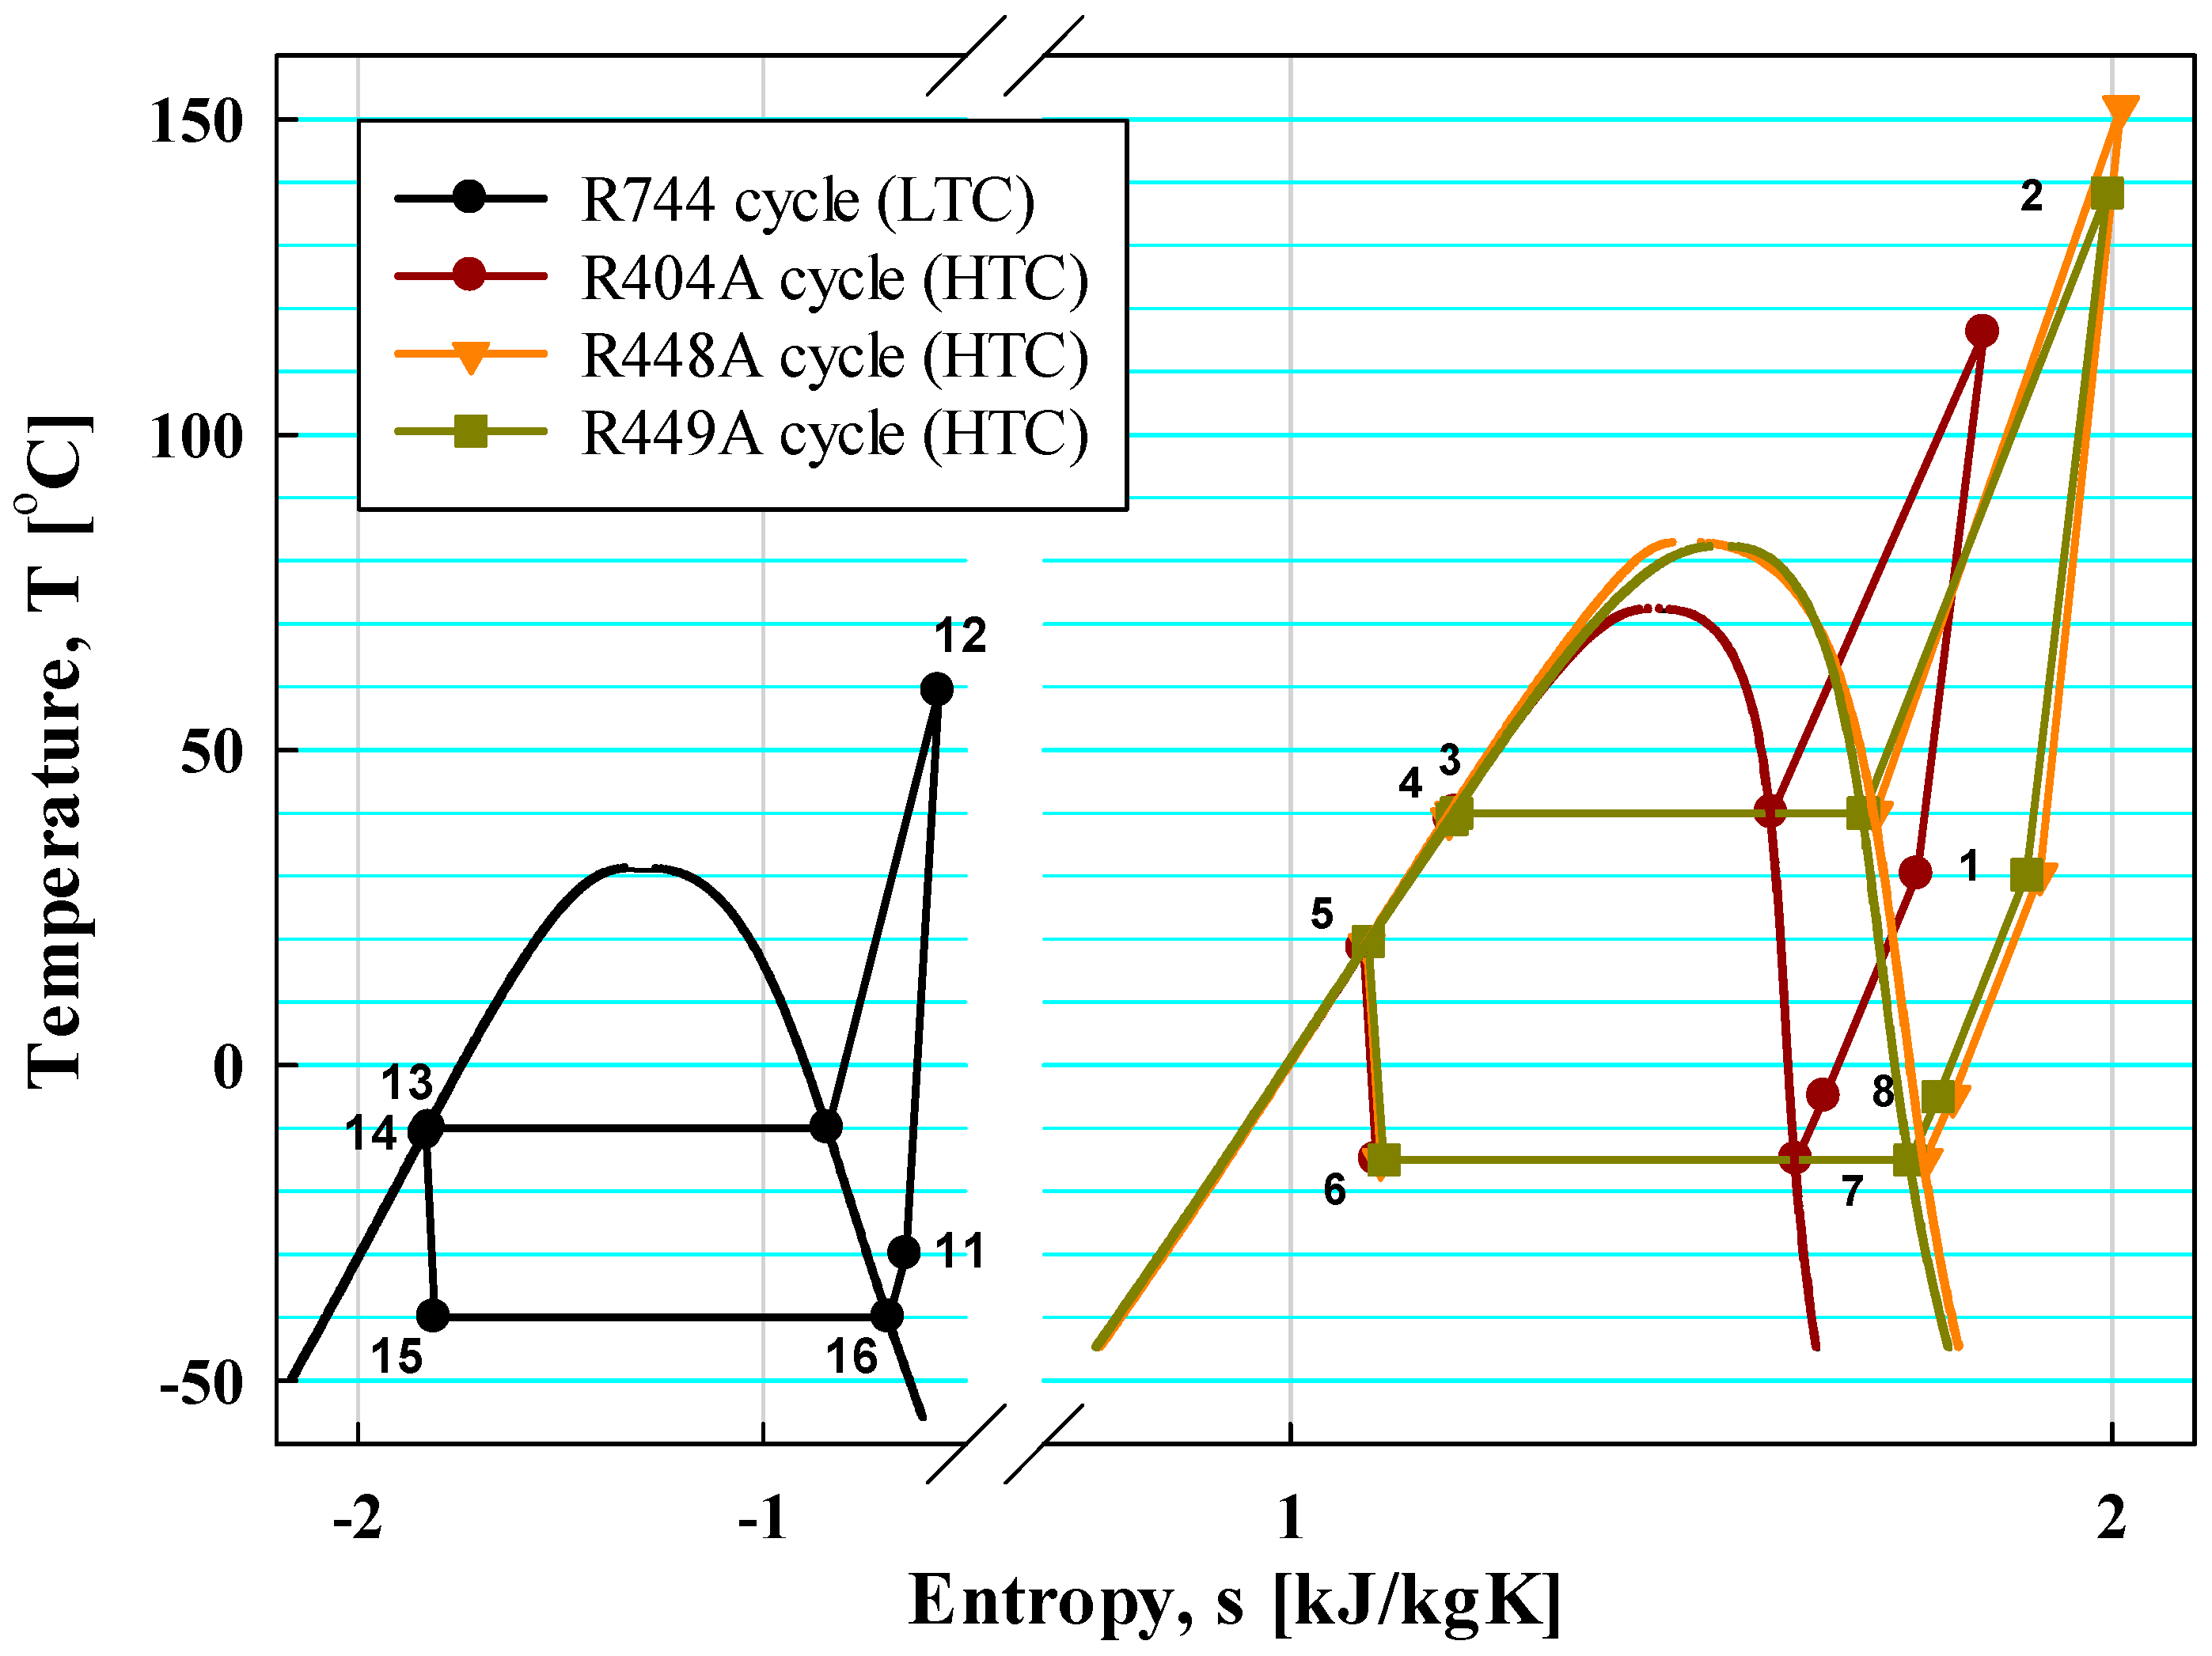
2.2. Thermodynamic Analysis

The thermophysical properties, such as pressures, temperatures, specific enthalpies and entropies, and the performance analysis of the refrigerants used in this paper were calculated by an Engineering Equation Solver (EES) software (version Professional V10.561). The performance analysis of the cascade refrigeration system attached to the IHX was performed based on the following general assumptions:
  • Negligible pressure drop and heat loss in the tube and heat exchangers (evaporator, condenser, cascade heat exchanger, and internal heat exchanger) of both cycles;
  • Isenthalpic process with adiabatic expansion in expansion valves of both cycles;
  • Negligible changes in kinetic and potential energy;
  • Operating under steady-state conditions of all system components.

2.2.1. Compressor Modeling and Validation

In this study, the efficiency of the compressor is not used as an arbitrary value to obtain a value similar to the actual experimental value, rather than a simple analysis, but the formula in Table 1 [14] obtained by experiment using a commercial compressor (high-temperature side: Bitzer 6FE-50Y [Bitzer, Sindelfingen, Germany], low-temperature side: Bitzer 4ESL-9K-40S [Bitzer, Sindelfingen, Germany]) is applied. Among the medium-temperature level (MT) and low-temperature level (LT) circuits categorized in Table 2, the MT circuit suitable for HTC of the CRS applied in this study was applied [20].
The electromechanical efficiency of the compressor was considered to be 0.94 as in reference [14,15,20].
As shown in Table 3, the compression efficiency of R448A is different from that of R404A, and the main characteristics and composition of R448A are almost similar to R449A, so the compression efficiency formula of R448A was applied identically to that of R449A.

2.2.2. Performance Analysis of CRS

The formulas required for the CRS analysis are summarized in Table 4. The total heat capacity ( Q C A S ) of HTC and LTC in CHX can be expressed by the following formula.
Q C A S = Q C A S , E = Q C A S , C
Q C A S = m ˙ H T C ( h 8 h 6 ) = m ˙ L T C ( h 12 h 14 )
where Q C A S , C is the heat capacity of the LTC condenser, and Q C A S , E is the heat capacity of the HTC evaporator.
The COP of HTC ( C O P H T C ) and COP of LTC ( C O P L T C ) in the CRS and the overall COP of the system ( C O P S Y S ) are calculated using Formulas (3), (4), and (5) [29,30,31], respectively.
C O P H T C = Q C A S , E W C O M , H T C
C O P L T C = Q E W C O M , L T C
C O P S Y S = Q E W C O M , H T C + W C O M , L T C
The MFR ratio ( m ˙ R A T I O ) of the CRS was calculated using the formula below.
m ˙ R A T I O = m ˙ H T C m ˙ L T C

2.2.3. Analysis Conditions

The analysis range of various variables ( T C , T C A S , E , T E , T S U H , H T C , T S U C , H T C , η I H X , H T C , T C A S , T S U H , L T C ) used in this study is shown in Table 5.
Figure 2 and Figure 3 are the P-h and T-s diagrams when CT is 40 °C, CET is −15 °C, the temperature difference in CHX is 5 °C, ET is −40 °C, DSH of HTC and LTC is 10 °C, DSC is 1 °C, and IHX efficiency of HTC is 0.8.

3. Analysis Results and Discussions

This paper analyzed the COP and MFR of the IHX-mounted CRS with R744 as the low-temperature refrigerant and R404A, R448A, and R449A as the high-temperature refrigerant to provide data for designing the CRS. Therefore, the COP and MFR of HTC, LTC, and CRS, as well as the MFR ratio, EC, CEC, and PCC of HTC and LTC, under a wide range of variables affecting CRS was analyzed.

3.1. Effect of DSC and DSH

3.1.1. Effect of DSC in the HTC

Under the standard conditions in Table 5 and the same EC ( Q E = 50 kW, T E = −40 °C, T C A S , E = −15 °C, T C = 40 °C, T S U H , H T C = 10 °C, T S U H , L T C = 10 °C, T S U C , L T C = 1 °C, T C A S = 5 °C, η I H X , H T C = η I H X , L T C = 0), the COP and MFR of HTC and LTC changes were analyzed as the T S U C , H T C increases.
As shown in Figure 4, there is no change in the COP and MFR of LTC as the T S U C , H T C increases by 2 °C from 1 °C to 9 °C, and when R404A, R448A, and R449A are applied to HTC, the COP of HTC increases by 2.92–3.09%, 2.08–2.14%, and 2.29–2.35%, respectively. Also, C O P S Y S increased. In Figure 5, as T S U C , H T C increased, W C O M , S Y S decreased by 1.74–2.19%, 1.31–1.52%, and 1.42–1.69% for R404A, R448A, and R449A applied to HTC, respectively ( W C O M , L T C remained unchanged at 12.9 kW, W C O M , H T C decreased by 2.39–3.00%, 1.80–2.09%, and 1.94–2.31% for R404A, R448A, and R449A, respectively). Therefore, as W C O M , H T C decreases, the C O P H T C and C O P S Y S increased. Furthermore, the MFRs of R448A and R449A are 73.28–75.69% and 76.56–78.51%, respectively, compared to the MFR of R404A, and as T S U C , H T C increases, m ˙ L T C is constant and m ˙ H T C decreases by 2.40–3.00%, 1.79–2.12%, and 1.94–2.30%, respectively. So, the m ˙ R A T I O also decreases by 2.39–2.99%, 1.82–2.09%, and 1.91–2.33%, respectively.
The reason for showing these results is the same as in Jeon’s [32] paper, which shows that T E , T C A S , C , T S U H , L T C , T S U C , L T C , Q E , and W C O M , L T C of the LTC are constant even if T S U C , H T C increases, so there is no change in C O P L T C . Whereas, as T S U C , H T C increases, the inlet enthalpy (IE) and outlet enthalpy (OE) of the HTC compressor (h1, h2) and OE of the cascade evaporator (CE) (h8) and Q C A S , E remain unchanged, but the OE of the condenser (or IE of CE) (h4 (or h6)) decreases by 3.2–3.3 kJ/kg, 3.1–3.2 kJ/kg, and 3.2–3.3 kJ/kg for R404A, R448A, and R449A, respectively. That is, the IE and OE of the evaporator, the OE of the CE, the IE and OE of the compressor in the HTC and LTC, the m ˙ L T C , and CEC were constant, but only the IE of the CE decreased. Therefore, m ˙ H T C decreases, and therefore, W C O M , H T C also decreases, and C O P H T C and C O P S Y S increase.
Under standard conditions and comparing the three refrigerants with increasing T S U C , H T C , R404A has the largest increase in C O P H T C and C O P S Y S , while R448A has the smallest increase. And in the order of higher C O P S Y S , when T S U C , H T C is less than about 2.4 °C, R448A has the largest increase, while above about 2.4 °C, R404A has the highest increase and R449A has the lowest increase. In terms of MFR, as T S U C , H T C increases, the MFR of all three refrigerants decrease; R404A had the largest decrement, while R448A had the smallest decrement. Also, R404A had the largest MFR and R448A had the smallest value.

3.1.2. Effect of DSH in the HTC

Under constant EC (50 kW) and standard conditions, the COP and MFR of HTC and LTC were analyzed to see how they change with increasing T S U H , H T C .
As can be seen in Figure 6 and Figure 7, T S U H , H T C increases by 5 °C from 0 °C to 20 °C; using formulas (3)–(5), it was found that C O P L T C is constant at 3.875, and the values of C O P H T C increase by 1.19–1.24%, 0.22–0.33%, and 0.39–0.51% for R404A, R448A, and R449A, respectively, so that C O P S Y S increased by 0.87%, 0.19%, and 0.29–0.39%, respectively. Also, the W C O M , S Y S decreased by 0.83–0.87%, 0.17–0.23%, and 0.27–0.35%, respectively ( W C O M , L T C remained unchanged at 12.9 kW, W C O M , H T C decreased by 1.13–1.18%, 0.23–0.32%, and 0.37–0.48%, respectively). Thus, the C O P L T C is constant at 3.875, but as W C O M , H T C decreases, C O P H T C and C O P S Y S increase.
The reason for this result is that, in the formula in Table 4, as T S U H , H T C increases, Q E and W C O M , L T C remain constant, and the IE and OE of the HTC compressor both increase, but the IE (h1) increases by 4.5–4.6 kJ/kg, 4.3–4.4 kJ/kg, and 4.2–4.4 kJ/kg, respectively, whereas the OE (h2) increases by 6.2–6.4 kJ/kg, 6.4–6.6 kJ/kg, and 6.3–6.5 kJ/kg, respectively, while the difference (h2–h1) in the IE and OE in the compressor increased by 1.7–1.9 kJ/kg, 2.1–2.2 kJ/kg, and 1.9–2.3 kJ/kg, respectively. Also, the IEs of the CE (h6) were constant at 258.4 kJ/kg, 256.8 kJ/kg, and 258.5 kJ/kg, respectively, but the OEs (h8) increased by 4.5–4.6 kJ/kg, 4.3–4.4 kJ/kg, and 4.2–4.4 kJ/kg, respectively. Therefore, both the difference in the IE and OE in the CE and the difference in the IE and OE in the HTC compressor increase, but the rate of increase in the difference at the IE and OE in the CE (h8–h6) is greater than that of the compressor (h2–h1), thus C O P H T C and C O P S Y S are judged to increase.
Furthermore, the MFRs of R448A and R449A are 67.14–73.18%, 70.14–75.91%, respectively, compared to the MFR of R404A; with the increase in T S U H , H T C , the MFRs of R404A, R448A, and R449A of HTC decreased by 3.38–4.38%, 2.51–3.04%, and 2.63–3.13%, respectively, using Formula (6), and m ˙ L T C was kept constant at 0.1844 kg/s. Therefore, m ˙ R A T I O s are decreased by 3.38–4.38%, 2.53–3.03%, and 2.66–3.12%, respectively. The parameter m ˙ H T C decreases because m ˙ L T C (0.1844 kg/s) and Q C A S , E (62.9 kW), and the IE of the CE (h6: 258.4 kJ/kg, 256.8 kJ/kg, 258.5 kJ/kg, respectively) do not change, but the OE of the CE (h8) increases by 4.5–4.6 kJ/kg, 4.3–4.4 kJ/kg, and 4.2–4.4 kJ/kg, respectively, due to the energy balance in CHX, so m ˙ H T C is judged to decrease. Therefore, when T S U H , H T C increases, C O P S Y S increases, and m ˙ R A T I O decreases.
The comparison of the three refrigerants with increasing T S U H , H T C under standard conditions shows that the COP increase is the largest for R404A and the smallest for R448A. And in the order of C O P H T C and C O P S Y S , the R448A has the largest increase when T S U H , H T C is less than about 13.5 °C, while R404A has the highest increase when T S U H , H T C is more than about 13.5 °C; R404A has the lowest increase when T S U H , H T C is less than about 2 °C, and R449A has the lowest increase when T S U H , H T C is more than about 2 °C. As T S U H , H T C increases, the MFR decreases for all three, with the largest decrease for R404A and the smallest assumed decrease for R448A. R404A had the largest MFR and R448A had the smallest.

3.1.3. Effect of DSH in the LTC

The analysis was conducted to find out how the COP and MFR of HTC and LTC change with increasing T S U H , L T C under constant EC (50 kW) and standard conditions.
As shown in Figure 8, as T S U H , L T C increases by 5 °C from 0 °C to 20 °C, C O P H T C remains unchanged at 1.814, 1.825, and 1.791 for HTC with R404A, R448A, and R449A, respectively, but C O P L T C decreases by 0.96–1.33%, and C O P S Y S decreases by 0.38–0.57%, 0.47–0.56%, and 0.38–0.57%, respectively. And as shown in Figure 9, as T S U H , L T C increases by 5 °C, the W C O M , S Y S increases by 0.45–0.55%, 0.45–0.56%, and 0.44–0.55%, respectively ( W C O M , H T C increases by 0.23–0.26%, 0.23–0.26%, and 0.23–0.26%, respectively, and W C O M , L T C increases by 1.03–1.35%, respectively). Also, Q E is constant, while W C O M , H T C and W C O M , L T C decrease as C O P L T C and C O P S Y S increase.
The reason for these results is that C O P L T C decreases with the increase in T S U H , L T C , and C O P H T C does not change because DSH and DSC, as well as CET and CT, are constant, and C O P S Y S decreases slightly. This is because, as T S U H , L T C increases, the IE of the compressor in LTC (h11) increases by 4.82–5.11 kJ/kg, while the OE (h12) increases by 6.84–7.28 kJ/kg from the formula in Table 4, so the difference in the IE and OE in the compressor (h12–h11) increases by 2.02–2.17 kJ/kg. Here, despite the decrease in m ˙ L T C by 1.62–1.93%, W C O M , L T C increases due to the large increase in the difference in the IE and OE in the LTC compressor, and W C O M , H T C also increases due to the increase in m ˙ H T C , although the difference in the IE and OE in the HTC compressor is constant.
In addition, the MFRs of R448A and R449A are 67.25–73.66% and 69.75–76.96%, respectively, compared to the MFR of R404A, and as T S U H , L T C increases, m ˙ H T C increases by 0.23–0.28%, 0.21–0.26%, and 0.23–0.25% with R404A, R448A, and R449A, respectively, and m ˙ L T C decreases by 1.62–1.93%. Therefore, the m ˙ R A T I O increases by 2.09–2.23%, 2.09–2.22%, and 2.08–2.21%, respectively. These results show that Q E is constant at 50 kW, but as T S U H , L T C increases, the IE of the evaporator (h15) is constant, but the OE (h11) increases by 4.82–5.11 kJ/kg, and thus the difference in the IE and OE in the evaporator (h11–h15) increases, so m ˙ L T C decreases due to the energy balance in the evaporator, and Q C A S , C increases as T S U H , L T C and W C O M , L T C increase, and m ˙ H T C increases due to energy balance as T C A S , E and T S U H , H T C are constant in CHX. Therefore, it can be concluded that as T S U H , L T C increases, C O P L T C and C O P S Y S decrease and m ˙ R A T I O increases.
Under standard conditions, the comparison of the three refrigerants with increasing T S U H , L T C showed that C O P L T C decreased equally in terms of COP, and C O P S Y S decreased slightly by 0.38–0.57%, 0.47–0.56%, and 0.38–0.57% with R404A, R448A, and R449A, respectively. And the order of C O P S Y S was R448A with the highest and R449A with the lowest. In terms of MFR, all three increased very slightly with the increase in T S U C , H T C , so the percentage increase is not meaningful. R404A had the largest MFR and R448A had the smallest.

3.2. Effect of CT and ET

3.2.1. Effect of CT

Under constant EC (50 kW) and standard conditions, the COP and MFR of HTC and LTC were analyzed to find out how they change as T C increases.
As shown in Figure 10, as T C increases by 5 °C from 30 °C to 50 °C, C O P L T C and m ˙ L T C remained constant at 3.875 and 0.1844 kg/s, respectively, while C O P L T C decreased by 10.18–11.63%, 9.3–9.83%, and 9.46–10.13%, respectively, and C O P S Y S decreased by 7.19–10.24%, 6.93–7.95%, and 7.15–8.11%, respectively. The reason for these results is that as T C increases, W C O M , H T C increases, as shown in Figure 11, C O P H T C decreases, and C O P L T C remains unchanged because the IE and OE of the evaporator and condenser are constant in LTC. In addition, the MFRs of R448A and R449A are 56.86–84.08% and 58.98–87.84% of R404A, respectively, and m ˙ H T C increases by 6.75–11.92%, 4.89–7.39%, and 5.33–8.26% with R404A, R448A, and R449A, respectively, as the T C increases, while m ˙ L T C remains unchanged. m ˙ R A T I O increases by 6.76–11.91%, 4.89–7.39%, and 5.33–8.29%, respectively. Furthermore, as T C increases by 5 °C, W C O M , S Y S increases by 7.73–20.5%, 7.44–14.29%, and 7.71–14.89%, respectively ( W C O M , L T C remains constant at 12.9 kW, and W C O M , H T C increases by 11.35–30.12%, 10.88–20.91%, and 11.24–21.70%, respectively).
The reason for these results is that as T C increases, m ˙ L T C and the IE and OE of the evaporator and condenser do not change, so EC, W C O M , L T C , and C O P L T C also do not change. On the other hand, with the increase in T C , the IE of the HTC compressor (h1) remains unchanged, and the OE (h2) increases by 2.3–6.4 kJ/kg, 4.1–7 kJ/kg, and 4–6.7 kJ/kg with R404A, R448A, and R449A, respectively, so that the difference in the IE and OE in the compressor (h2–h1) increases significantly, and the MFR increases, which is considered to be a significant increase in W C O M , H T C , and accordingly C O P H T C and C O P S Y S decrease. These trends were similar to Altinkaynak [33] and Mota-Babiloni et al. [14]. Also, the reason for the increase in m ˙ R A T I O as T C increases is that, as T C increases, the CEC and the OE of the CE (HTC evaporator) (h8) are constant at 62.9 kW, 367 kJ/kg, respectively, but the IE of the CE (h6) increases by 7.9–8.7 kJ/kg, 7.6–8.3 kJ/kg, and 8–8.6 kJ/kg, respectively, which decreases the difference in IE and OE in the CE, causing m ˙ H T C to increase. Therefore, it can be concluded that as T C increases, C O P H T C and C O P S Y S decrease and m ˙ R A T I O increases.
The comparison of the three refrigerants with increasing CT under standard conditions shows that R404A has the largest C O P S Y S decrease and R448A has the smallest decrease. In the order of increasing C O P H T C and C O P S Y S , R404A is the highest and R449A is the lowest at condensing temperatures below 38 °C, R448A is the highest and R449A is the lowest at condensing temperatures above 38 °C and below 43 °C, but above 43 °C, R448A is the highest and R404A is the lowest. In terms of MFR, the MFR of all three increased with increasing T S U C , H T C , with the largest increase for R404A and the smallest increase for R448A. The largest MFR was for R404A and the smallest was for R448A.

3.2.2. Effect of ET

Under constant EC (50 kW) and standard conditions, the COP and MFR of HTC and LTC were analyzed as T E increases.
As shown in Figure 12, as T E increases by 5 °C from −50 °C to −30 °C, C O P L T C increases by 25.16–65.02%, and C O P H T C remains unchanged at 1.814, 1.825, and 1.791 with R404A, R448A, and R449A, respectively. Correspondingly, C O P S Y S increased by 12–13.23%, 12.02–13.29%, and 11.96–13.1%, respectively. The reason for these results is that C O P L T C increases because W C O M , L T C decreases as T E increases, and C O P H T C does not change because T E and T C are constant in LTC, as shown in Figure 13. In addition, the MFRs of R448A and R449A are 65.57–73.73% and 68.5–76.48% of R404A, respectively, and m ˙ H T C decreases by 3.51–5.81%, 3.52–5.8%, and 3.51–5.79%, respectively, as T E increases, and m ˙ L T C decreases slightly by 0.43–0.64%. Therefore, m ˙ R A T I O decreases by 3.23–5.19%, 3.23–5.19%, and 3.24–5.2%, respectively. And as T E increases by 5 °C, W C O M , S Y S decreases by 6.48–10.72%, 6.49–10.73%, and 6.46–10.68%, respectively ( W C O M , L T C decreases by 12.16–20.11%, 12.16–20.11%, and 12.16–20.11%, respectively, and W C O M , H T C decreases by 3.51–5.81%, 3.51–5.79%, and 3.52–5.81%, respectively).
The reason for these results is that as T E increases, the IE and OE in the compressor and expansion valve of the HTC, CE, and condenser are the same, so there is no change in COP. In LTC, as T E increases, the OE of the condenser (h14) (or IE of evaporator (h15)) does not change, but the OE of the evaporator (h11) (or IE of compressor) is the same and increases slightly by 1.09–1.79 kJ/kg, but the OE of compressor (h12) also decreases significantly by 12.19–19.48 kJ/kg, so the enthalpy difference (h12–h11) decreases by 13.28–21.27 kJ/kg, and the difference in the IE and OE in the evaporator (h11–h15) increases by 1.09 to 1.79 kJ/kg. Accordingly, C O P L T C and C O P S Y S are determined to increase. This trend is similar to the results of Altinkaynak [33]. In addition, as T E increases, m ˙ H T C decreases, m ˙ L T C decreases slightly, and m ˙ R A T I O decreases. The reason is that the EC of LTC is fixed at 50 kW, while W C O M , L T C decreases, which leads to a decrease in CEC by 3.51–5.8%. Here, the IE and OE of the CE, compressor, condenser, and expansion valve of the HTC do not change, but only the CEC decreases, so m ˙ H T C decreases by 3.51–5.8% in proportion to the decrease in CEC. Therefore, it can be judged that m ˙ R A T I O also decreases. Therefore, it can be concluded that as T E increases, C O P L T C and C O P S Y S increase and m ˙ R A T I O decreases.
Under standard conditions, the comparison of the three refrigerants with increasing T E shows that the C O P S Y S increases by 12–13.23%, 12.02–13.29%, and 11.96–13.1%, respectively, with little difference in the increase rate. And in the order of C O P S Y S , R448A is the highest and R449A is the lowest. In terms of MFR, all three decrease with the increase in T E , with a very small decrease of 3.51–5.81%, 3.52–5.8%, and 3.51–5.79%, respectively, which is also considered to be almost insignificant. R404A had the largest MFR and R448A the smallest.

3.3. Effect of CET and Temperature Difference in CHX

3.3.1. Effect of CET

Under constant EC (50 kW) and standard conditions, the COP and MFR of HTC and LTC were analyzed as T C A S , E increases.
As shown in Figure 14, C O P L T C decreased by 8.89–23.62%, C O P H T C increased by 14–30.51%, 15.86–23.64%, and 15.74–22.55%, respectively, as T C A S , E increased by 5 °C from −25 °C to −5 °C. Correspondingly, C O P S Y S increased and decreased by 2.92–15.07%, 1.69–9.66%, and 1.49–8.94%, respectively.
When analyzing the reason why C O P S Y S increases and then decreases, as T C A S , E increases, C O P L T C decreases while C O P H T C increases. The reason for the decrease in C O P L T C is that due to the increase in T C A S , E (CT of LTC), the enthalpy difference between the inlet and outlet of the evaporator (h11–h15) decreases by 10.8–11.8 kJ/kg and the enthalpy difference in the LTC compressor inlet and outlet (h12–h11) decreases by 11.93–13.87 kJ/kg. And the reason why C O P H T C increases is that, due to the increase in CET, the enthalpy difference between the inlet and outlet of the CE (h8–h6) increases by 2.9–3 kJ/kg, 2.9–3.2 kJ/kg, and 2.8–3.1 kJ/kg, respectively, and the enthalpy difference between the inlet and outlet of HTC compressor (h2–h1) decreases by 3–18.1 kJ/kg, 5.4–19.1 kJ/kg, and 5.3–17.6 kJ/kg, respectively. Here, C O P S Y S takes the form of a parabola that increases and then decreases depending on the decrease in C O P L T C and the increase in C O P H T C , and the optimal T C A S , E (approximately −15.6 °C, −15.9 °C, −16 °C, respectively), which has an inflection point at this time, is generated. This means that T C A S , E , which has the maximum C O P S Y S ( C O P M A X , S Y S ) depending on the combination of refrigerant on the HTC and LTC of the CRS, varies depending on the characteristics of the refrigerant.
These results have a similar trend with Nicola et al. [34], Dopazo et al. [27], Getu and Bansal [28], Yun and Cho [35], Yilmaz et al. [36], Parmar and Kapadia [37], Messineo and Panno [38], Parekh and Tailor [39], Dokandari et al. [40].
In addition, the MFRs of R448A and R449A are 64.4–75.3% and 66.8–78.7% of R404A, respectively, and as T C A S , E increases by 5 °C, m ˙ H T C increases by 1.15–2.86%, 1.87–3.63%, and 1.90–3.60%, respectively, and m ˙ L T C increases by 3.81–5.39%, but the increment rate of m ˙ H T C is smaller than that of m ˙ L T C , so m ˙ R A T I O in CRS decreases by 1.82–2.57%, 1.26–1.93%, and 1.28–1.88%, respectively.
Figure 15 shows that as T C A S , E increases by 5 °C, W C O M , S Y S of CRS decreases by 2.31–13.1%, 1.35–8.83%, and 1.23–8.23%, respectively, and then increases by 2.17–4.77%, 2.07–4.14%, and 2.04–4.04%, respectively, approximately −16 °C ( W C O M , H T C decreases by 1.82–20.21%, 3.07–15.74%, and 3.14–14.99%, respectively, while W C O M , L T C increased by 30.95–45.66%), and the EC remained unchanged at 50 kW. In other words, W C O M , H T C decreases significantly until T C A S , E reaches −15.6 °C, −15.9 °C, and −16 °C, respectively, and W C O M , L T C increases linearly. W C O M , S Y S of the CRS, the sum of the two compressors decreases as T C A S , E increases and then increases from about −16 °C; C O P S Y S increases and then decreases to the optimum T C A S , E .
Under standard conditions, the comparison of the three refrigerants with increasing T C A S , E shows that R404A has the largest C O P S Y S increase and decrease, and R448A has the smallest change. In order of increasing C O P S Y S , R448A has the highest C O P S Y S , R449A has the lowest near-optimum T C A S , E , and R404A has the lowest in other areas. In terms of MFR, all three increase with increasing T C A S , E , with R404A having the largest MFR and R448A the smallest.

3.3.2. Effect of Temperature Difference in CHX

Under constant EC (50 kW) and standard conditions, the COP and MFR of HTC and LTC were analyzed as T C A S increases.
As shown in Figure 16, as T C A S increased by 2 °C from 1 °C to 9 °C, C O P H T C remained constant at 1.814, 1.825, and 1.791, and C O P L T C decreased by 6.18–9.03, respectively, when R404A, R448A, and R449A were applied to HTC, and C O P S Y S decreased by 3.34–3.54%, 3.4–3.61%, 3.36–3.57%, respectively. In addition, the MFR of R448A and R449A is 65.04–75.91% and 67.47–79.31% of R404A, respectively, and when R404A, R448A, and R449A are applied to the HTC of CRS, m ˙ H T C increases by 1.75–2.06%, 1.76–2.05%, and 1.75–2.06%, respectively, m ˙ L T C increases by 1.63–1.85%, respectively, and m ˙ R A T I O increases by 0.13–0.19%, 0.13–0.17%, and 0.17%, respectively, as T C A S increases. Furthermore, Figure 17 shows that as T C A S increases by 2 °C, W C O M , S Y S of CRS increases by 3.76–4.37%, 3.75–4.37%, and 3.74–4.33% for HTC with R404A, R448A, and R449A, respectively ( W C O M , L T C increases by 9.98–11.57%, and W C O M , H T C increases by 1.76–2.06%, 1.74–2.04%, and 1.77–2.04% for R404A, R448A, and R449A, respectively). Here, the CRS EC is fixed at 50 kW, and C O P L T C decreases with the increase in W C O M , L T C , which leads to the increase in CEC. Also, DSH, DSC, ET, and CT in HTC are constant, and only m ˙ H T C increases with the increase in CEC without any change in the inlet and outlet enthalpy values of the evaporator, compressor, and condenser, and C O P H T C is constant. Therefore, C O P S Y S also decreases.
The reason for showing these results is that as T C A S increases, there is no change in C O P H T C and only m ˙ H T C increases because ET, CT, DSH, and DSC in HTC are constant, which is the same as the results in Jeon’s [32] paper. On the other hand, as T C A S increases, the enthalpy at the evaporator outlet and compressor inlet in LTC (h11) remain unchanged, while the enthalpy at the compressor outlet (h12) increases by 4.92–5.21 kJ/kg, resulting in the enthalpy difference at the compressor inlet and outlet (h12–h11) also increasing by 4.92–5.21 kJ/kg. In addition, the enthalpies of the cascade condenser outlet and evaporator inlet of the LTC (h14, h15) increased by 4.5–4.6 kJ/kg, so that the enthalpy difference in the evaporator inlet and outlet (h11–h15) decreased by 4.5–4.6 kJ/kg. Since the enthalpy and EC at the outlet of the evaporator do not change, but only the enthalpy value at the inlet increases, it is determined that m ˙ L T C increases by the rate of increase in the enthalpy at the inlet of the evaporator, and m ˙ H T C increases by the rate of increase in the CEC, resulting in an increase in W C O M , H T C , and C O P L T C and C O P S Y S decrease by the energy balance of the evaporator, as shown in the formula in Table 4. Therefore, it can be concluded that as T C A S increases, C O P L T C and C O P S Y S decrease and m ˙ R A T I O increases.
The comparison of the three refrigerants with increasing T C A S under standard conditions shows that the C O P S Y S reductions are so small (3.34–3.54%, 3.4–3.61%, and 3.36–3.57%) that it is not meaningful to compare them. And in order of C O P S Y S , R448A is the highest and R449A is the lowest. In terms of MFR, all three increase with the increase in T C A S , 1.75–2.06%, 1.76–2.05%, and 1.75–2.06%, respectively, and the difference is very small, with R404A having the largest MFR and R448A having the smallest.

3.4. Effect of IHX Efficiency of the HTC

Under constant EC (50 kW) and standard conditions, the COP and MFR of HTC and LTC were analyzed as η I H X , H T C increases.
As shown in Figure 18, as η I H X , H T C increases by 0.2 from 0.2 to 0.8 in CRS, C O P L T C and m ˙ L T C do not change, C O P H T C increases by 2.05–2.11%, 0.55–0.65%, and 0.89–1.05%, respectively, and C O P S Y S increases by 1.41–1.5%, 0.38–0.47%, and 0.67–0.76%, respectively. In addition, the MFRs of R448A and R449A are 78.65–89.22% and 82.18–92.71% of R404A, respectively, and as η I H X , H T C increases in CRS, m ˙ H T C decreases by 5.06–6.43%, 3.86–4.63%, and 4.11–4.89%, respectively, and m ˙ L T C remains unchanged. m ˙ R A T I O decreases by 5.06–6.42%, 3.88–4.66%, and 4.12–4.86%, respectively.
Furthermore, Figure 19 shows that as η I H X , H T C of CRS increases, W C O M , S Y S of CRS decreases by 1.34–1.45%, 0.42–0.45%, 0.65–0.73%%, respectively ( W C O M , L T C remains unchanged at 12.9 kW, W C O M , H T C decreases by 1.86–2%, 0.58–0.61%, 0.89–1%, respectively), CEC is 62.9 kW, and EC is constant at 50 kW. Here, C O P H T C increased as W C O M , H T C decreased and C O P S Y S increased as C O P L T C remained constant.
The reason for these results is that, while the ET, DSH, DSC, and CT of the HTC are constant, the higher η I H X , H T C , the enthalpy of the CE outlet (h8) is constant, but the enthalpy of the CE inlet (h6) decreases by 8–8.1 kJ/kg, 7.5–7.6 kJ/kg, and 7.6–7.8 kJ/kg. And the enthalpy difference (h8–h6) at the inlet and outlet of the CE increases by 8–8.1 kJ/kg, 7.5–7.6 kJ/kg, 7.6–7.8 kJ/kg, respectively, and the enthalpies at the inlet and outlet of the HTC compressor (h1, h2) both increase, but the enthalpy at the inlet of the HTC compressor (h1) increases by 8–8.1 kJ/kg, 7.5–7.6 kJ/kg, and 7.6–7.8 kJ/kg, respectively, and the enthalpy at the outlet of the HTC compressor (h2) increases more significantly by 10.9–11 kJ/kg, 11–11.2 kJ/kg, and 11.1–11.2 kJ/kg, respectively, so that the enthalpy difference at the inlet and outlet of the HTC compressor (h2–h1) increases by 2.8–3 kJ/kg, 3.5–3.6 kJ/kg, and 3.3–3.5 kJ/kg, respectively, resulting in an increase in C O P H T C because the increase in the enthalpy difference at the inlet and outlet of the HTC compressor is smaller than the increase in the enthalpy difference at the inlet and outlet of the CE. This is due to the physical properties of the HTC refrigerant.
Also, as η I H X , H T C increases, the enthalpy difference at the inlet and outlet of the CE increases, but since the CEC is constant at 62.9 kW, m ˙ H T C decreases as the enthalpy difference at the inlet and outlet of the CE increases. And from another perspective, the cause of the increase in C O P H T C as η I H X , H T C increase is closely related to the effect of DSH and DSC in the HTC. The increase in DSH or DSC is the same reason why C O P H T C increases. Therefore, it can be concluded that the more efficient IHX is used in HTC, the more C O P H T C increases, so it is advantageous to apply efficient IHX in terms of COP. It can also be concluded that m ˙ R A T I O of CRS decreases as HTC uses more efficient IHXs.
The comparison of the three refrigerants with increasing η I H X , H T C under standard conditions shows that R404A has the largest increase in C O P H T C and C O P S Y S , while R448A has the smallest increase. And in order of increasing C O P S Y S , R404A has the highest and R449A the lowest. In terms of MFR, all three decreased with the increase in η I H X , H T C , with R404A having the largest decrease and R448A having the smallest assumed decrease. The largest MFR was for R404A and the smallest was for R448A.

4. Future Scope and Recommendations

This study analyzed R448A and R449A, which have a GWP of less than 1500, as alternative refrigerants to R404A using EES software. However, in the near future, there will come a situation where they will have to be replaced with refrigerants with lower GWPs. At that time, it is recommended to consider R454C and R455A instead of R448A and R449A. This study compared R448A and R449A with R404A, but the difference in change was small, less than about 2%. It would be great if it were verified through experiments, but it is thought that more thought is needed to overcome technical limitations, such as experimental errors, and obtain good results.

5. Conclusions

The refrigeration systems used in large marts and supermarkets, which are used by many people, must be harmless to the human body due to problems such as refrigerant leakage and must use safe refrigerants that are not explosive and flammable. For this reason, the R744/R404A CRS has been widely used, but its use is limited due to the high GWP of R404A. Therefore, in this study, we apply R448A and R449A, well-known as alternative refrigerants to R404A, and compare and analyze them with the R744/R404A CRS to propose an alternative system and provide optimal design data.
For this purpose, this paper examined how the COP, MFR, PCC, MFR ratio, CEC, etc. of HTC and LTC change when the important factors affecting the CRS (DSH, DSC, IHX efficiency, CT, CET, difference temperature in CHX, DSH, and ET of LTC) are varied widely under EC 50 kW and standard conditions. The main conclusions are summarized as follows.
  • To improve COP for R404A, R448A and R449A, it must increase subcooling degree of HTC, superheating of HTC, ET, CET, and IHX efficiencies of HTC, and reduce super-heating degree of LTC, CT, and temperature difference of CHX.
  • Through this study, it was confirmed that R448A and R449A can be replaced as replacement refrigerants for R404A without significant changes, simply by making appropriate changes to the refrigerant charging rate.
  • In order of greatest changing rate in terms of COP, for R404A, it is ET, CT, CET, the temperature difference in CHX, subcooling degree of HTC, IHX efficiency of HTC, superheating degree of HTC, and superheating degree of LTC. For R448A, it is ET, CT, CET, the temperature difference in CHX, subcooling degree of HTC, superheating degree of LTC, IHX efficiency of HTC, and superheating degree of HTC. And for R449A, it is ET, CT, CET, the temperature difference in CHX, subcooling degree of HTC, IHX efficiency of HTC, superheating degree of LTC, and superheating degree of HTC. Therefore, priorities one to five are the same regardless of the refrigerant and are in order of caution when designing a refrigeration system. In addition, it is considered to be less than 1.5% in the sixth rank and below, so it is not something that requires much attention.
  • In order of greatest change rate in terms of MFR, for R404A, it is CT, IHX efficiency of HTC, ET, superheating degree of HTC, subcooling degree of HTC, CET, temperature difference in CHX, and superheating degree of LTC; for R448A and R449A, it is CT, ET, IHX efficiency of HTC, superheating degree of HTC, CET, subcooling degree of HTC, temperature difference in CHX, and superheating degree of LTC. In order to minimize the refrigerant charging rate from both environmental and economic perspectives, you should consider them in order of priority.
  • The order of greatest influence on reducing the system PCC is CT, ET, CET, temperature difference in CHX, and subcooling degree of HTC from first to fifth place, regardless of the type of refrigerant, and the change was minimal at less than 1.45% for the sixth place and below. Therefore, if you want to reduce the system PCC in terms of energy saving, you should consider them in order from first to fifth place
  • In this study, when the ratios of R448A and R449A compared to R404A were calculated as the arithmetic mean according to the changes in the eight parameters, the system COP was 99.30–102.07% and 98.22–100.66%, respectively, the system PCC was 98.08–100.71% and 99.40–101.81%, respectively, and the MFR was 72.60–74.96% and 75.96–78.03%, respectively. As can be seen from the research results, the system COP and system PCC are less than about 2% of R404A, so it is judged that there is no problem in using them as a replacement for R404A. In addition, since R448A and R449A are more economical and environmentally friendly than R404A in terms of MFR, their replacement is recommended.
  • Also, in the case of the change rates of R448A and R449A compared to R404A, the system COP changed by 69.22–76.38% and 73.34–79.15%, respectively, the system PCC changed by 68.61–74.84% and 72.57–79.24%, respectively, and the MFR changed by 86.36–94.43% and 88.69–97.89%, respectively. Through this, it is judged that the system applying R448A and R449A will operate more stably than the system applying R404A because there is a low change in the system depending on the external load or environment. In addition, since R448A is more stable than R449A, the R744/R448A CRS is recommended.
  • When applying IHX with 80% efficiency to HTC, the COP according to the three refrigerants increased by 0.063, 0.017, and 0.029 from 1.051, 1.056, and 1.041, respectively. In other words, applying IHX with 80% efficiency helps improve the COP, but R448A and R449A only increase by 26.98% and 46.03%, respectively, compared to R404A, so the increase rate is quite low. Therefore, if you want to apply IHX to a system that uses R448A and R449A, you should take this into consideration.

Author Contributions

Conceptualization, J.-H.L.; methodology, J.-H.L.; software, M.-J.J.; validation, J.-H.L. and M.-J.J.; formal analysis, M.-J.J.; investigation, J.-H.L.; resources, J.-H.L.; data curation, M.-J.J.; writing-original draft preparation, M.-J.J.; writing-review and editing, J.-H.L.; visualization, M.-J.J. All authors have read and agreed to the published version of the manuscript.

Funding

This research received no external funding.

Data Availability Statement

The original contributions presented in the study are included in the article, further inquiries can be directed to the corresponding author.

Conflicts of Interest

The author declares no conflicts of interest.

Nomenclature

Abbreviations
CECascade evaporator
CECCascade evaporation capacity
CETCascade evaporation temperature
CTCondensation temperature
CRCompression ratio
CHXCascade heat exchanger
COPCoefficient of performance
CRSCascade refrigeration system
DSCDegree of subcooling
DSHDegree of superheating
ECEvaporation capacity
EESEngineering equation solver
ETEvaporation temperature
GWPGlobal warming potential
HTCHigh-temperature cycle
IEInlet enthalpy
IHXInternal heat exchanger
LTLow-temperature level
LTCLow-temperature cycle
MFRMass flow rate
MTMedium-temperature level
OEOutlet enthalpy
PCCPower consumption of compressor
Symbols
hEnthalpykJ/kg
m ˙ Mass flow ratekg/s
QHeat capacitykW
TTemperature°C
WPower consumptionkW
Greek Symbols
Difference
η Efficiency
Subscripts
CCondensation, Condenser
CASCascade heat exchanger
COMCompression
EEvaporation, Evaporator
HTCHigh-temperature cycle
IHXInternal heat exchanger
ISOIsentropic
LTCLow-temperature cycle
RATIORatio
R404AR404A refrigerant
R448AR448A refrigerant
R449AR449A refrigerant
R744R744 cycle
SUCDegree of subcooling
SUHDegree of superheating
SYSTotal system
VOLVolumetric
MAXMaximum

References

  1. Sawalha, S. Using CO2 in supermarket refrigeration. Am. Soc. Heat. Refrig. Air-Cond. Eng. 2005, 47, 26–30. [Google Scholar]
  2. Veiby, O.J. Internal Records, Documentation in the ICA Supermarket Chain in Norway 2003, Oslo, Norway, 2003.
  3. Queiroz, M.V.A.; Panato, V.H.; Antunes, A.H.P.; Parise, J.A.R.; Filho, E.P.B. Experimental comparison of a cascade refrigeration system operating with R744/R134a and R744/R404A. In Proceedings of the International Refrigeration and Air-Conditioning Conference, West Lafayette, IN, USA, 11–14 July 2016; pp. 1–10. Available online: http://docs.lib.purdue.edu/iracc/1785 (accessed on 3 September 2024).
  4. Citarella, B.; Viscito, L.; Mochizuki, K.; Mauro, A.W. Multi-Criteria (thermo-economic) optimization and environmental analysis of a food refrigeration system working with low environmental impact refrigerants. Energy Convers. Manag. 2022, 253, 115152. [Google Scholar] [CrossRef]
  5. Alam, M.S.; Jeong, J.H. Calculation of the thermodynamic properties of R448A and R449A in a saturation temperature range of 233.15 K to 343.15 K using molecular dynamics simulations. Int. Commun. Heat Mass Transf. 2020, 116, 104717. [Google Scholar] [CrossRef]
  6. Rogstam, J.; Bolteau, S.; Makhnatch, P.; Khodabandeh, R. Evaluation of a Potential R404A Replacement—Field Test with R449A, Project (Systemlösningar Med Naturliga Köldmedier i Serverhallar/Datacenters), Kylbranschens Samarbetsstiftelse, Stockholm, Sverige, 28 November 2016. Available online: https://www.kys.se/wp-content/uploads/F%C3%A4ltm%C3%A4tning-R449A-28NOV16.pdf (accessed on 3 September 2024).
  7. Kedzierski, M.A.; Kang, D. Horizontal convective boiling of R448A, R449A, and R452B within a micro-fin tube. Sci. Technol. Built Environ. 2016, 22, 1090–1103. [Google Scholar] [CrossRef] [PubMed]
  8. Lillo, G.; Mastrullo, R.; Mauro, A.W.; Pelella, F.; Viscito, L. Experimental thermal and hydraulic characterization of R448A and comparison with R404A during flow boiling. Appl. Therm. Eng. 2019, 161, 114146. [Google Scholar] [CrossRef]
  9. Kim, C.H.; Kim, N.H. Evaporation heat transfer of the low GWP alternative refrigerants (R-448A, R-449A, R-455A, R-454C) for R-404A in a microfin tube. Int. J. Refrig. 2021, 128, 118–128. [Google Scholar] [CrossRef]
  10. Lee, B.M.; Gook, H.H.; Lee, S.B.; Lee, Y.W.; Park, D.H.; Kim, N.H. Condensation heat transfer and pressure drop of low GWP R-404A alternative refrigerants (R-448A, R-449A, R-455A, R-454C) in a 5.6 mm inner diameter horizontal smooth tube. Int. J. Refrig. 2021, 128, 71–82. [Google Scholar] [CrossRef]
  11. Jacob, T.A.; Matty, E.P.; Fronk, B.M. Comparison of R404A condensation heat transfer and pressure drop with low global warming potential replacement candidates R448A and R452A. Int. J. Refrig. 2020, 116, 9–22. [Google Scholar] [CrossRef]
  12. Ghanbarpour, M.; Mota-Babiloni, A.; Makhnatch, P.; Badran, B.E.; Rogstam, J.; Khodabandeh, R. ANN Modeling to analyze the R404A replacement with the low GWP alternative R449A in an indirect supermarket refrigeration system. Appl. Sci. 2021, 11, 11333. [Google Scholar] [CrossRef]
  13. Makhnatch, P.; Mota-Babiloni, A.; Rogstam, J.; Khodabandeh, R. Retrofit of lower GWP alternative R449A into an existing R404A indirect supermarket refrigeration system. Int. J. Refrig. 2017, 76, 184–192. [Google Scholar] [CrossRef]
  14. Mota-Babiloni, A.; Gimenez-Prades, P.; Makhnatch, P.; Rogstam, J.; Fernandez-Moreno, A.; Navarro-Esbri, J. Semi-Empirical analysis of HFC supermarket refrigeration retrofit with advanced configurations from energy, environmental, and economic perspectives. Int. J. Refrig. 2022, 137, 257–271. [Google Scholar] [CrossRef]
  15. Giménez-Prades, P.; Navarro-Esbrí, J.; Udroiu, C.M.; Mota-Babiloni, A. Influence of subcooling in R-449A supermarket refrigeration system and screening of refrigerant mixtures for its energetic and environmental improvement. Appl. Therm. Eng. 2024, 236, 121787. [Google Scholar] [CrossRef]
  16. Mota-Babiloni, A.; Navarro-Esbrí, J.; Peris, B.; Molés, F.; Verdú, G. Experimental evaluation of R448A as R404A lower-GWP alternative in refrigeration systems. Energy Convers. Manag. 2015, 105, 756–762. [Google Scholar] [CrossRef]
  17. Kim, S.G.; Kim, Y.J.; Lee, G.; Kim, M.S. The performance of a transcritical CO2 cycle with an internal heat exchanger for hot water heating. Int. J. Refrig. 2005, 28, 1064–1072. [Google Scholar] [CrossRef]
  18. Zhang, F.Z.; Jiang, P.X.; Lin, Y.S.; Zhang, Y.W. Efficiencies of subcritical and transcritical CO2 inverse cycles with and without an internal heat exchanger. Appl. Therm. Eng. 2011, 31, 432–438. [Google Scholar] [CrossRef]
  19. Llopis, R.; Sanz-Kock, C.; Cabello, R.; Sánchez, D.; Nebot-Andrés, L.; Catalán-Gil, J. Effects caused by the internal heat exchanger at the low temperature cycle in a cascade refrigeration plant. Appl. Therm. Eng. 2016, 103, 1077–1086. [Google Scholar] [CrossRef]
  20. Diario Oficial de la Unión Europea. REGLAMENTO (UE) 2019/1781 DE LA COMISIÓN de 1 de octubre de 2019. Diario Oficial De La Unión Europea, 25 October 2019.
  21. Calm, J.M.; Hourahan, G.C. Physical, safety, and environmental data for current and alternative refrigerants. In Proceedings of the 23rd International Congress of Refrigeration, Prague, Czech Republic, 21–26 August 2011; Available online: http://www.hourahan.com/wp/wp-content/uploads/2010/08/2011-Physical-Safety-and-Environmental-Data2.pdf (accessed on 3 September 2024).
  22. Australian-Government. Global Warming Potential Values of Hydrofluorocarbon Refrigerants; Department of Climate Change, Energy, the Environment and Water, Refrigeration and air conditioning; 2021. Available online: https://www.dcceew.gov.au/environment/protection/ozone/rac/global-warming-potential-values-hfc-refrigerants#daff-page-main (accessed on 3 September 2024).
  23. Lemmon, E.W.; Huber, M.L.; McLinden, M.O. NIST Standard Reference Database 23: Reference Fluid Thermodynamic and Transport Properties-REFPROP; version 9.0; National Institute of Standards and Technology: Boulder, CO, USA, 2010. Available online: https://pages.nist.gov/REFPROP-docs/ (accessed on 3 September 2024).
  24. Wikipedia. List of Refrigerants. Available online: https://en.wikipedia.org/wiki/List_of_refrigerants (accessed on 3 September 2024).
  25. Euro Refrigerant—Refrigerant Gas and Tools. Available online: https://www.eurorefrigerant.com (accessed on 3 September 2024).
  26. Refrigerantionline. Available online: https://refrigerantionline.com/en/ (accessed on 3 September 2024).
  27. Dopazo, J.A.; Fernandez-Seara, J.; Sieres, J.; Uhia, F.J. Theoretical analysis of a CO2-NH3 cascade refrigeration system for cooling applications at low temperatures. Appl. Therm. Eng. 2009, 29, 1577–1583. [Google Scholar] [CrossRef]
  28. Getu, H.M.; Bansal, P.K. Thermodynamic analysis of an R744-R717 cascade refrigeration system. Int. J. Refrig. 2008, 31, 45–54. [Google Scholar] [CrossRef]
  29. Bai, T.; Yu, J.; Yan, G. Advanced exergy analysis on a modified auto-cascade freezer cycle with an ejector. Energy 2016, 113, 385–398. [Google Scholar] [CrossRef]
  30. Sun, Z.; Liang, Y.; Liu, S.; Ji, W.; Zang, R.; Liang, R.; Guo, Z. Comparative analysis of thermodynamic performance of a cascade refrigeration system for refrigerant couples R41/R404A and R23/R404A. Appl. Energy 2016, 184, 19–25. [Google Scholar] [CrossRef]
  31. Morosuk, T.; Tsatsaronis, G. Advanced exergetic evaluation of refrigeration machines using different working fluids. Energy 2009, 34, 2248–2258. [Google Scholar] [CrossRef]
  32. Jeon, M.-J. Experimental Analysis of the R744/R404A Cascade Refrigeration System with Internal Heat Exchanger. Part 1: Coefficient of Performance Characteristics. Energies 2021, 14, 6003. [Google Scholar] [CrossRef]
  33. Altinkaynak, M. Exergetic performance analysis of low GWP alternative refrigerants for R404A in a refrigeration system. Int. J. Low-Carbon Technol. 2021, 16, 842–850. [Google Scholar] [CrossRef]
  34. Nicola, G.D.; Giuliani, G.; Polonara, F.; Stryjek, R. Blends of carbon dioxide and HFCs as a working fluids for the low-temperature circuit in cascade refrigerating systems. Int. J. Refrig. 2005, 28, 130–140. [Google Scholar] [CrossRef]
  35. Yun, R.; Cho, Y. Evaluation of the performance for the CO2-NH3 cascade system and the two stage CO2 systems. In Proceedings of the 2010 SAREK Summer Annual Conference, Pyeongchang, Republic of Korea, 23–25 June 2010; pp. 824–829. [Google Scholar]
  36. Yılmaz, D.; Sınar, Ü.; Özyurt, A.; Yılmaz, B.; Mancuhan, E. Ultra Düşük Sıcaklıklarda Çalışan İki Kademeli Bir Soğutma Sisteminde Aşırı Soğutma ve Isıtmanın Performansa Etkilerinin Sayısal İncelenmesi. Afyon Kocatepe Univ. J. Sci. Eng. 2017, 17, 1172–1180. [Google Scholar]
  37. Parmar, G.G.; Kapadia, R.G. Thermodynamic Analysis of Cascade Refrigeration System using a Natural Refrigerants for Supermarket Application. Int. J. Innov. Res. Sci. Eng. Technol. 2015, 4, 1839–1846. [Google Scholar]
  38. Messineo, A.; Panno, D. Performance evaluation of cascade refrigeration systems using different refrigerants. Int. J. Air-Cond. Refrig. 2012, 20, 1250010. [Google Scholar] [CrossRef]
  39. Parekh, A.D.; Tailor, P.R. Thermodynamic analysis of cascade refrigeration, system using R12-R13, 290-R23 and R404A-R23, World Academy of Science. Eng. Technol. Int. J. Mech. Mechatron. Eng. 2014, 8, 1351–1356. [Google Scholar]
  40. Dokandari, D.A.; Hagh, A.S.; Mahmoudi, S.M.S. Thermodynamic investigation and optimization of novel ejector-expansion CO2/NH3 cascade refrigeration cycles (novel CO2/NH3 cycle). Int. J. Refrig. 2014, 46, 26–36. [Google Scholar] [CrossRef]
Figure 1. Schematic diagram of a CRS using R744 in the LTC with IHX.
Energies 17 04481 g001
Figure 2. P-h diagram of a CRS pairing R744 with R404A, R448A and R449A with IHX.
Energies 17 04481 g002
Figure 3. T-s diagram of a CRS pairing R744 with R404A, R448A and R449A with IHX.
Energies 17 04481 g003
Figure 4. COP, MFR, and MFR ratio with respect to DSC in the HTC.
Energies 17 04481 g004
Figure 5. Energy of EC and PCC with respect to DSC of the HTC.
Energies 17 04481 g005
Figure 6. COP, MFR, and MFR ratio with respect to DSH in the HTC.
Energies 17 04481 g006
Figure 7. Energy of EC and PCC with respect to DSH in the HTC.
Energies 17 04481 g007
Figure 8. COP, MFR, and MFR ratio with respect to DSH in the LTC.
Energies 17 04481 g008
Figure 9. Energy of EC and PCC with respect to DSH in the LTC.
Energies 17 04481 g009
Figure 10. COP, MFR, and MFR ratio with respect to CT.
Energies 17 04481 g010
Figure 11. Energy of EC and PCC with respect to CT.
Energies 17 04481 g011
Figure 12. COP, MFR, and MFR ratio with respect to ET.
Energies 17 04481 g012
Figure 13. Energy of EC and PCC with respect to ET.
Energies 17 04481 g013
Figure 14. COP, MFR, and MFR ratio with respect to CET.
Energies 17 04481 g014
Figure 15. Energy of EC and PCC with respect to CET.
Energies 17 04481 g015
Figure 16. COP, MFR, and MFR ratio with respect to temperature difference in CHX.
Energies 17 04481 g016
Figure 17. Energy of EC and PCC with respect to temperature difference in CHX.
Energies 17 04481 g017
Figure 18. COP, MFR, and MFR ratio with respect to IHX efficiency in the HTC.
Energies 17 04481 g018
Figure 19. Energy of EC and PCC with respect to IHX efficiency in the HTC.
Energies 17 04481 g019
Table 1. Summary of polynomial formulas describing compressor efficiencies [14].
SystemR404AR449A
MT η VOL = −0.0379CR + 0.9944 η VOL = −0.0412CR + 0.9865
η ISO = −0.0213CR2 + 0.2293CR + 0.0045 η ISO = −0.0079CR2 + 0.105CR + 0.2718
LT η VOL = −0.0271CR + 0.9835 η VOL = −0.0313CR + 0.9741
η ISO = −0.0002CR2 + 0.0124CR + 0.4965 η ISO = −0.0011CR2 + 0.0353CR + 0.419
η ISO,R744 = −0.0046CR2 − 0.0073CR + 0.7253
Table 2. Operating conditions according to actual supermarket operation [14].
ParametersMT CircuitLT Circuit
Middle evaporating temperature [°C]−20 and −10−40 and −30
Middle condensing temperature [°C]25 and 4020 and 40
Total superheating degree [K]710
Condenser subcooling degree [K]00
Subcooler subcooling degree [K]2 SCD = f ( Q ˙ S C )
Table 3. The main characteristics of the tested refrigerants [21,22,23,24,25,26].
RefrigerantR404AR448AR449A
Molar mass (kg/kmol) 97.686.387.2
Boiling point (°C)−46.2−46.0−46.0
Critical temperature (°C)7283.781.5
Critical pressure (kPa)373046604450
ODP000
GWP (100 yr)370013871397
Safety classA1A1A1
Cp (kJ/kg∙°C)1.541.561.55
k (W/mK)0.0670.0880.080
Cost (€/kg) [27,28] Β38.929.930.9
Chemical formulaR125/143a/134aR32/R125/R134a/R1234yf/R1234zeR32/R125/R134a/R1234yf
(44%/52%/4%)(26%/26%/21%/20%/7%)(24.3%/24.7%/25.7%/25.3%)
Table 4. Balance formula for each component of CRS.
CycleComponentEnergyMass
HTC
(R404A/R448A/R449A)
Compressor (1→2) W C O M , H T C = m ˙ H T C ( h 2 h 1 ) m ˙ H T C = m ˙ 1 = m ˙ 2
= m ˙ 3 = m ˙ 4
= m ˙ 5 = m ˙ 6
= m ˙ 7 = m ˙ 8
Condenser (2→4) Q C = m ˙ H T C ( h 2 h 4 )
DSC (3→4) T S U C , H T C
IHX (4→5 and 8→1) Q I H X , H T C = m ˙ H T C h 4 h 5 = m ˙ H T C h 1 h 8
Expansion valve (5→6) h 5 = h 6
Cascade evaporator (6→8) Q C A S , E = m ˙ H T C ( h 8 h 6 )
DSH (7→8) T S U H , H T C
Low
Temperature
cycle
(R744)
Compressor (11→12) W C O M , L T C = m ˙ L T C ( h 12 h 11 ) m ˙ L T C = m ˙ 11 = m ˙ 12
= m ˙ 13 = m ˙ 14
= m ˙ 15 = m ˙ 16
Cascade condenser (12→14) Q C A S , C = m ˙ L T C ( h 12 h 14 )
DSC (13→14) T S U C , L T C
Expansion valve (14→15) h 14 = h 15
Evaporator (15→11) Q E = m ˙ L T C ( h 15 h 11 )
DSH (16→11) T S U H , L T C
Table 5. Analysis conditions of CRS with IHX using R744 in the LTC.
CycleParameterRangeUnit
HTC
(R404A/R448A/R449A)
T C 30, 35, 40 *, 45, 50°C
η I H X , H T C 0 *, 0.2, 0.4, 0.6, 0.8-.
T S U C , H T C 1 *, 3, 5, 5, 7, 9°C
T S U H , H T C 0, 5, 10 *, 15, 20°C
T C A S , E −25, −20, −15 *, −10, −5°C
T C A S 1, 3, 5 *, 7, 9°C
LTC
(R744)
T E −50, −45, −40 *, −35, −30°C
η I H X , L T C 0 *-.
T S U C , L T C 1 *°C
T S U H , L T C 0, 5, 10 *, 15, 20°C
*: Standard conditions.
Disclaimer/Publisher’s Note: The statements, opinions and data contained in all publications are solely those of the individual author(s) and contributor(s) and not of MDPI and/or the editor(s). MDPI and/or the editor(s) disclaim responsibility for any injury to people or property resulting from any ideas, methods, instructions or products referred to in the content.

