Article

A Comparison of the Life-Cycle Impacts of the Concentrating Solar Power with the Product Environmental Footprint and ReCiPe Methods

Department of Engineering, University of Palermo, Viale delle Scienze, Edifico 9, 90128 Palermo, Italy
*
Authors to whom correspondence should be addressed.
Energies 2024, 17(17), 4461; https://doi.org/10.3390/en17174461
Submission received: 15 August 2024 / Revised: 28 August 2024 / Accepted: 4 September 2024 / Published: 5 September 2024
(This article belongs to the Collection Featured Papers in Solar Energy and Photovoltaic Systems Section)

Abstract

:
Concentrating solar power (CSP) technologies have the potential to reduce the carbon emissions in the economy and energy sector. The growing significance of solar energy sources in addressing climate change highlights the necessity for thorough assessments of their environmental impacts. This paper explores two different life-cycle impact assessment methods, ReCiPe and Product Environmental Footprint, using CSP plants with various receiver systems and heat-transfer fluids as a case study. In terms of the overall life-cycle impact, solar towers are shown to have advantages over parabolic troughs. Most of the life-cycle impacts of solar towers are lower than those of parabolic troughs, ranging from 8% to 112%, except for human toxicity and land use impacts. However, there is not much difference between the studied heat-transfer fluids, with the variance of most impacts being less than around 1%. The single-score results indicates that the ReCiPe method assigns significance to human health impacts, while the product environmental footprint method gives equal attention to all aspects. Meanwhile the comparison of components’ contributions quantified by the two methods shows the same results for more than half of the impact categories.

1. Introduction

The worldwide cumulative installed capacity of concentrating solar power (CSP) increased by a factor of five between 2010 and 2019, reaching around 6.3 GW [1]. The global market for CSP saw little growth in 2016 and 2017, with annual additions of around 100 MW each year. After that, there was significant growth in the industry in 2018 and 2019 [1]. During this period, there was a growing proliferation of projects, extending from the old market players such as Spain and the United States to new market players such as South Africa, India, Morocco and China [1,2]. The levelized cost of CSP is still a concern over other renewable energy technologies; however, this cost is expected to drop as more research is put into this technology and more projects are deployed at a larger scale [2].
The CSP technologies provide a route towards a more robust and sustainable energy future by using solar energy to produce clean, renewable electricity [3]. These technologies are expected to contribute to the decarbonization of the economy and the energy sector, as well as contributing to sustainable production and consumption. Utility-scale power plants stand to benefit more from CSP, due to their built-in thermal energy storage capabilities, higher overall thermal-to-electric conversion rate and the ability to dispatch electricity on demand [4]. CPS can be used alongside other types of power generation to provide consistency, and its scalability means it is well-suited for utility-scale power plants [4]. Thermal energy storage plants would embrace CSP as a promising, new way of generating electricity. The reversible carbonation/calcination of calcium oxide makes this technology possible, allowing the application in various fields such as energy engineering and environmental science [4].
The technologies for solar energy storage are diverse, such as liquid medium (e.g., water, molten salt), solid medium (e.g., rock, concreate), phase-change materials for solar thermal storage [5,6,7], and batteries for solar power storage [8]. The recent advancements in solar energy research and development combined energy harvesting and storage in one system, for example, photogalvanic cells or dye-sensitized solar modules [9,10]. Among these systems, the most common ones being applied for CSP technologies are molten salts, for example, solar salts, Hitec salts, and others, thanks to their advantage in for use in high-temperature operating conditions [11].
This paper’s justification is the increasing significance of renewable energy sources like CSP in addressing climate change and lowering the negative effects of electricity production on the environment. As CSP technologies continue to gain importance as a clean and sustainable energy option, it becomes necessary to evaluate their environmental performance comprehensively. Life cycle assessment (LCA) comprehensively quantifies and assesses the environmental impacts of a product or service, from the raw material extraction, to making the product or providing the service, till the end of its life, which avoids the neglection of impacts or transfers the impacts from one stage during the life cycle to another stage [12]. LCA is a method that offers details of the production process and environmental impact, as defined by UNEP [13]. It is commonly used to compare the overall environmental effect of a product or service with that of an alternative. As a result, it can be applicable to holistically assessing the environmental performance of CSP.
The life-cycle impacts of CSP technologies have been studied extensively, covering both the CSP alone and the combination of CSP with other energy generation technologies. There are several life-cycle impact assessment (LCIA) methods being applied in for solar energy technologies, for example, the combination of different methods such as those of the International Panel of Climate Change (IPCC), ReCiPe and others in the International Energy Agency’s (IEA) methodology guidelines for LCA of solar photovoltaics (PV) [14]. Recently, the newly developed method of the product environmental footprint (PEF) of the European Commission (EC) has been proposed for use in the EU context [15]. Consequently, this paper contributes to the existing knowledge on the life-cycle impact of CSP by conducting a study on CSP technologies in Italy, applying two LCIA methods of ReCiPe (well developed) and PEF (newly developed). Specifically, the paper will provide important insights into the life cycle environmental consequences of CSP deployment, comparing these impacts quantified by two different methods and identifying the important environmental hotspots and possible areas for improvement of the technologies.

2. Materials and Methods
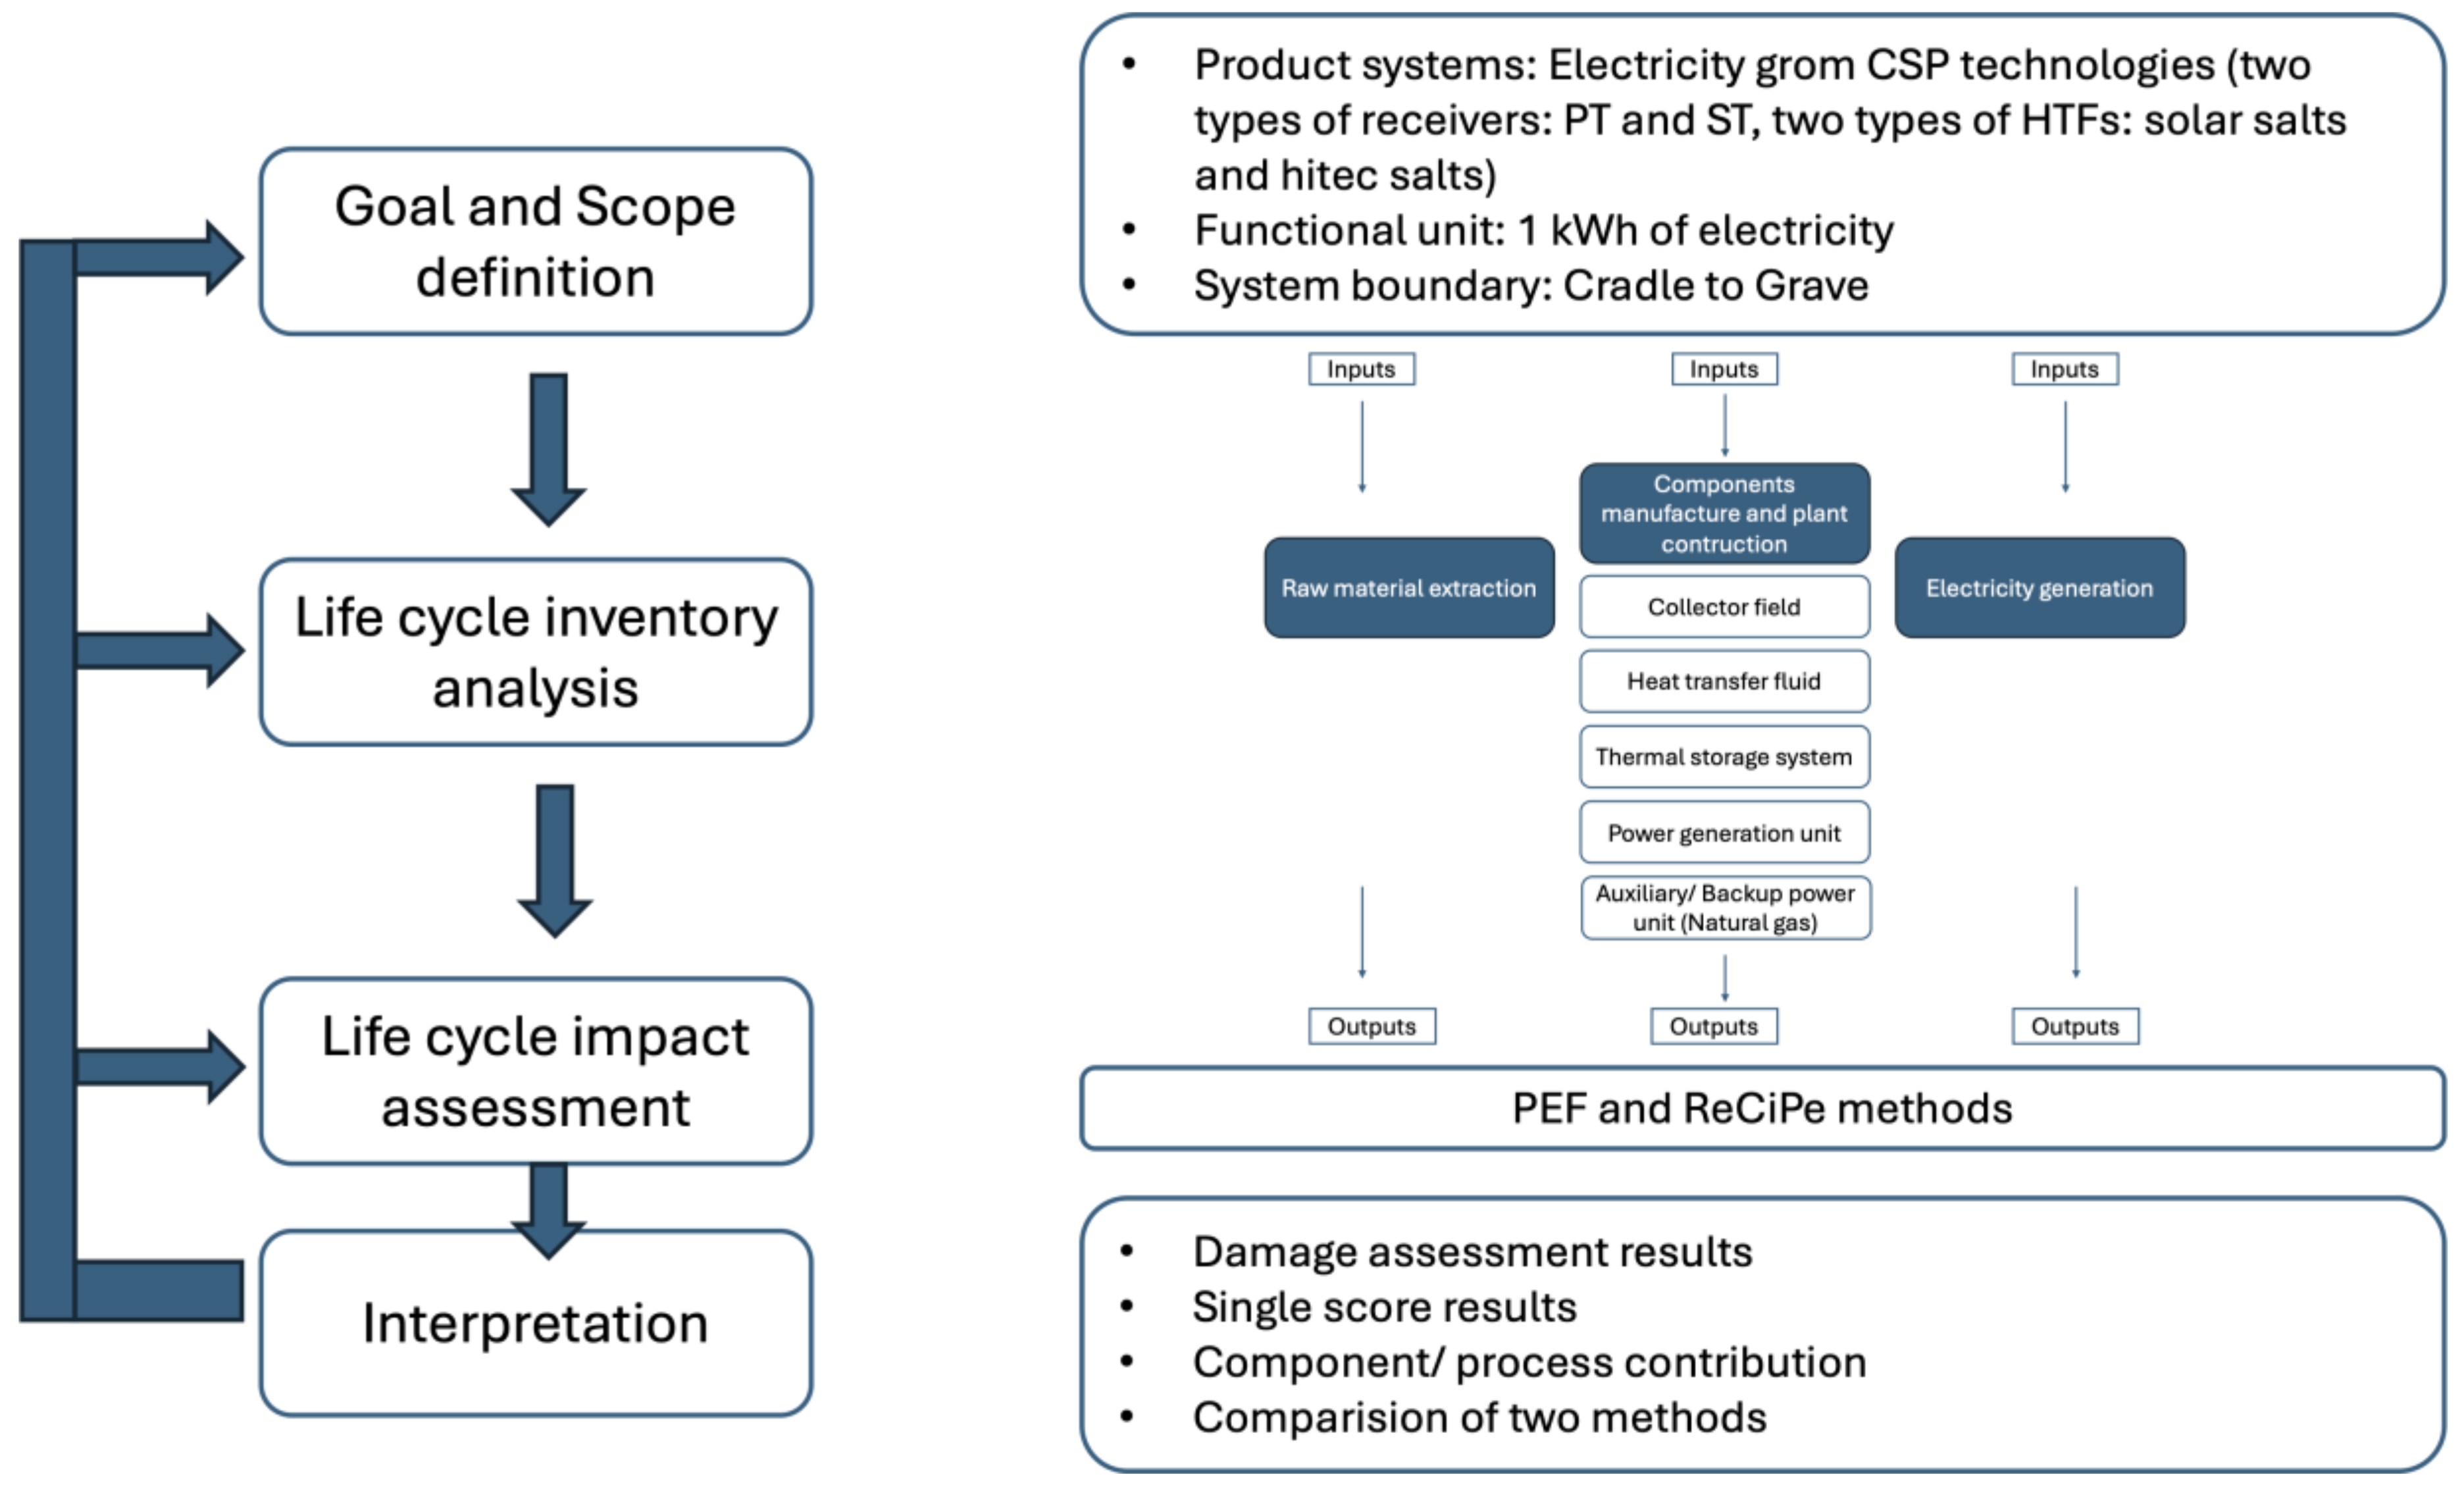
LCA involves the process of compiling and evaluating the inputs, outputs, and potential environmental impacts of a product system throughout its entire life cycle [16]. The generic LCA technique takes into account all inputs, such as materials and energy, for manufacturing the product or providing the service, and all outputs to the environment during the corresponding production processes. This analysis extends to further ‘up’ the supply chains of the different materials, energy, waste and emissions in the intermediate product, ultimately tracing these back to the environmental inputs and outputs. The environmental inputs are derived from energy sources, such as solar, biomass, and fossil fuels, rather than being solely limited to raw materials, while the environmental outputs cover all emissions to air, water and land [12].
Several methods exist for carrying out an LCA: process-based [14,17,18], input–output based LCAs [19] and the hybrid method [20,21]. Throughout its lifetime, the process-based approach examines a product or service’s inputs (energy and raw materials) and outputs (emissions and waste), in turn. This method is formalized in ISO 14040:2006 [16] and ISO 14044:2006 [22], and is recommended for conducting an LCA on energy products in general [15] and solar energy in particular [14]. The study is an attributional, process-based LCA, which will be conducted in four steps of Goal and scope definition, Life cycle inventory analysis, Life-cycle impact assessment, and Interpretation, as in the guidance in the ISO 14040 [16] and ISO 14044 [22] on LCA. Moreover, the study refers to the guidance of the International Energy Agency (IEA) on conducting LCA on PV systems [14] and the product environmental footprint (PEF) of the EC on developing the environmental footprint of energy products [15]. Figure 1 illustrates the application of ISO LCA standards, IEA guidance and PEF guidance in the case study.

2.1. Goal and Scope

According to ISO 14040 and ISO 14044, several elements of goal and scope need to be clarified [16,22]. Meanwhile, the IEA and PEF guidelines [14,15] do not require an LCA study to report all the elements as do those of ISO 14040 [16] and ISO 14044 [22]. Instead, the most important elements of ISO 14040 [16] and ISO 14044 [22] are recommended, such as reasons and expected application, product system, functional unit, reference flow, system boundary, allocation, impact categories, data requirements, assumptions and limitations [14,15].
Goal of the study:
The study aims to further develop CSP technologies with consideration of their life cycle environmental impacts, and the eco-design of the technologies. In order to achieve this aim, several activities have been conducted, including the following: (1) quantifying and evaluating the life-cycle impacts of the CSP technologies, (2) identifying the stages and components contributing the most to the environmental footprint, and (3) comparing the environmental impacts and hotspots obtained by two LCIA methods.
Scope of the study:
Product systems include the electricity generated by CSP plants with a thermal energy storage system (TES). Two types of CSP receivers including parabolic trough (PT) and solar tower (ST), and two types of heat-transfer fluids (HTFs) such as solar salt (SS) and Hitec salt (HS) are considered.
Both the guidance of the IEA and the PEF recommend using the functional unit of kWh, so the functional unit of 1 kWh of electricity is selected.
The system boundaries are cradle to grave, covering the raw material extraction, component manufacture, plant construction and power generation. The decommission of CSP plants are included in the assessment, but there is no scenario for recycling of components in CSP plants. This is a limitation to the study, as the exclusion of the recycling scenario may underestimate some life cycle environmental benefits to the ecosystem and human health arising from this end-of-life stage.
The reference flows of electricity generated by the CSP plant are 20 MW for the solar tower CSP plant and 50 MW for the parabolic trough CSP plant.
It is assumed that the plants are installed in Italy.

2.2. Technology Description

CSP systems function by focusing the sun’s beams via mirrors to generate heat. The majority of contemporary systems use a fluid to transmit heat from the sun’s energy. Electricity is generated via a steam cycle, where the heat is used to produce steam, similar to how it is carried out in traditional thermal power plants. Contemporary CSP facilities often use thermal storage systems to store and reuse the HTFs for power production. A two-tank molten-salt storage system is commonly used; however, there are several designs available [23].
Parabolic trough (PT) collectors are the most often-used linear concentrating systems, being applied in 72% to 80% of the existing CSP plants [24,25]. These systems consist of interconnected parabolic trough-shaped mirrors arranged in loops. The parabolic trough mirrors, often referred to as collectors, focus solar energy onto a heat-reception tube, also known as an absorber. This component is designed to maximise thermal efficiency, and is positioned precisely in the focal line of the collector. These devices facilitate the movement of heat via a heat exchange system, in order to create superheated steam.
The solar tower (ST) is the second most popular CSP technology [24,25], and includes a tower with a central receiver on the top of the tower. This tower is surrounded by a heliostats system, being made up of flat or slightly curved mirrors. The solar tracking system is normally integrated into the heliostats system, to focus the sunlight onto the central receiver. The central receiver transfers the heat from the solar radiation by using the heat-transfer fluid, which is the same for all concentrating solar technologies [24].
The existing HTFs are diverse, such as air and other gases, water or steam, thermal oils, organic fluids, molten salts, and liquid metal [11]. Air and other gases are uncommon in large CSP plants, while other HTFs are applied in several commercial CSP plants. Among these HTFs, molten salts are the HTFs with most potential, and are commonly used in modern CSP plants, with the nitrate salts of sodium nitrate NaNO3 and potassium nitrate KNO3 (solar salts) or NaNO3, KNO3 and calcium nitrate Ca(NO3)2 (Hitec salts) [11].
The life-cycle impacts of CSP systems are calculated for electricity generated from CSP plants, based on both the parabolic trough (PT) and solar tower (ST). These plants are equipped with a TES using molten salts as heat-transfer fluids (HTFs). Two types of HTFs are studied. The first one is solar salt with 60% of sodium nitrate and 40% of potassium nitrate (weight %—w%). The second one is Hitec salt with 15% of sodium nitrate, 43% of potassium nitrate and 42% of calcium nitrate (w%). These two types of receivers and HTFs make up four combinations of CSP technologies, namely parabolic trough Hitec salt (PTHS), parabolic trough solar salt (PTSS), solar tower Hitec salt (STHS), and solar tower solar salt (STSS).

2.3. Life Cycle Inventory Data

Data for the CSP are calculated based on the CSP technologies installed in Palermo, Italy. Data for background processes are taken from the Ecoinvent database, with the cut-off-by-unit allocation method. The background processes that are not included in the Ecoinvent database, specifically the manufacturing processes of two HTFs, namely SS and HS, will be modelled based on their stoichiometric approach.

2.4. Life-Cycle Impact Assessment Methods

The LCIA phase, which is a crucial part of LCA, uses a variety of approaches to measure and describe these environmental consequences. In this paper, two LCIA methods are used, including PEF and ReCiPe Mid-point H. Both these methods cover common environmental impact categories such as global warming potential (GWP), acidification potential (AP), eutrophication potential (EP), ozone depletion potential (ODP), photochemical ozone formation (PCOF), ionising radiation (IR), human toxicity (HT) cancer and non-cancer, ecotoxicity (ET), resource use (RU) (fossil, mineral and metal), water use (WU) and land use (LU). However, the specific impacts and their units of measure are different for the two LCIA methods, as presented in Table 1. Among the impact categories, some impacts can be relatively comparable, such as climate change, ozone depletion, freshwater eutrophication, and water use.
ReCiPe is a reliable LCIA method for assessing environmental impacts at both midpoint and endpoint levels [27,28]. Greenhouse gas emissions, acidification, and eutrophication are examples of midpoint indicators that reflect particular environmental stresses; endpoint indicators capture the global implications for ecosystems, resources, and human health. ReCiPe endpoint combines several midpoint indicators into a single result, due to its extensive range of weighting criteria for each effect category. This makes it simpler to compare various items or systems and gives information on how well they perform environmentally.
As an alternative, the EC came up with PEF, PEF Categories Rules (PEFCR), Organization Environmental Footprint (OEF) and OEF Sector Rules (OEFSR). OEF and OEFSR focus on the sector, while PEF and PEFCR are product-oriented. PEF is an LCA-based method to evaluate products’ environmental impact across the supply chain and covering different life cycle stages [15]. There are four steps in conducting a PEF, in line with the ISO structure, namely, (1) product (goal and scope), (2) collection of information, accounting for input and output flows (life cycle inventory analysis), (3) impact calculation (LCIA), and (4) interpretation, reporting, verification and validation (interpretation).
During the LCIA phase, PEF takes into account a wide variety of impact categories, similar to ReCiPe, as mentioned in Table 1. The steps of PEF’s LCIA phase, such as classification, characterisation, normalisation, weighting and aggregation, are similar to those of ISO’s LCA framework. According to ISO’s LCA framework, the two steps of normalization and weighting are optional; however, these two steps are compulsory for PEF. The normalization step quantifies the relative contributions of the product systems for the reference system for each impact category. The conversion of characterization results into normalization results follows Equation (1):
N o r m a l i z e d   r e s u l t s = C h a r a c t e r i s a t i o n   r e s u l t s / N o r m a l i z a t i o n   f a c t o r s
Weighting aims at quantifying the relative importance of the impact categories. The weighting step may include aggregation, to indicate the single-score result. The conversion of normalized results into single-score results is calculated following the Equation (2):
W e i g h t e d   s i n g l e   s c o r e = N o r m a l i z e d   r e s u l t s × W e i g h t i n g   f a c t o r s
The normalization and weighting factors are various, depending on the specific LCIA methods. For example, the normalization and weighting factors of PEF are presented in Table 2.
The PEFCR goes further into details, to provide specific rules per product categories; therefore, it is applicable across different industries to determine environmental performance of their product and service, and enables reliable comparison. By the end of the pilot phase, from 2013 to 2018, 19 PEFCRs were finalized, including batteries and accumulators, beer, dairy products, decorative paints, feed for food-producing animals, IT equipment, leather, pet food, pasta, thermal insulation, wine, packed water, hot- and cold-water piping systems, intermediate paper products, liquid laundry detergents, metal sheets, photovoltaic electricity generation, t-shirts, and uninterrupted power supplies [30,31]. Until now, there have been several updates from the pilot phase for batteries, PV, beer and petfood, as well as additions of new products such as cut flowers and potted plants, and synthetic turf [32]. Regarding the products for the energy sector, there is no guideline for concentrating solar energy technologies.
The advantages of ReCiPe and PEF are comparable, both offering a strong scientific foundation for environmental evaluation. ReCiPe provides a thorough method of impact assessment that addresses a variety of impact categories, both midpoint and endpoint, which are applicable at the global scale. Comparatively, PEF simplifies and standardizes environmental assessment, which makes it more user-friendly and improves stakeholder communication, and is recommended for application in the European context. Ultimately, ReCiPe and PEF are great resources for LCA evaluations and for measuring how well products and systems play their part in protecting the environment. These two methods will be applied in the case study of CSP to examine the obtained results with two methods, to further understand these LCIA methods with regard to their practical applications and the influence of selecting one method or another on the environmental performance of the same systems or technologies.

3. Results and Discussion

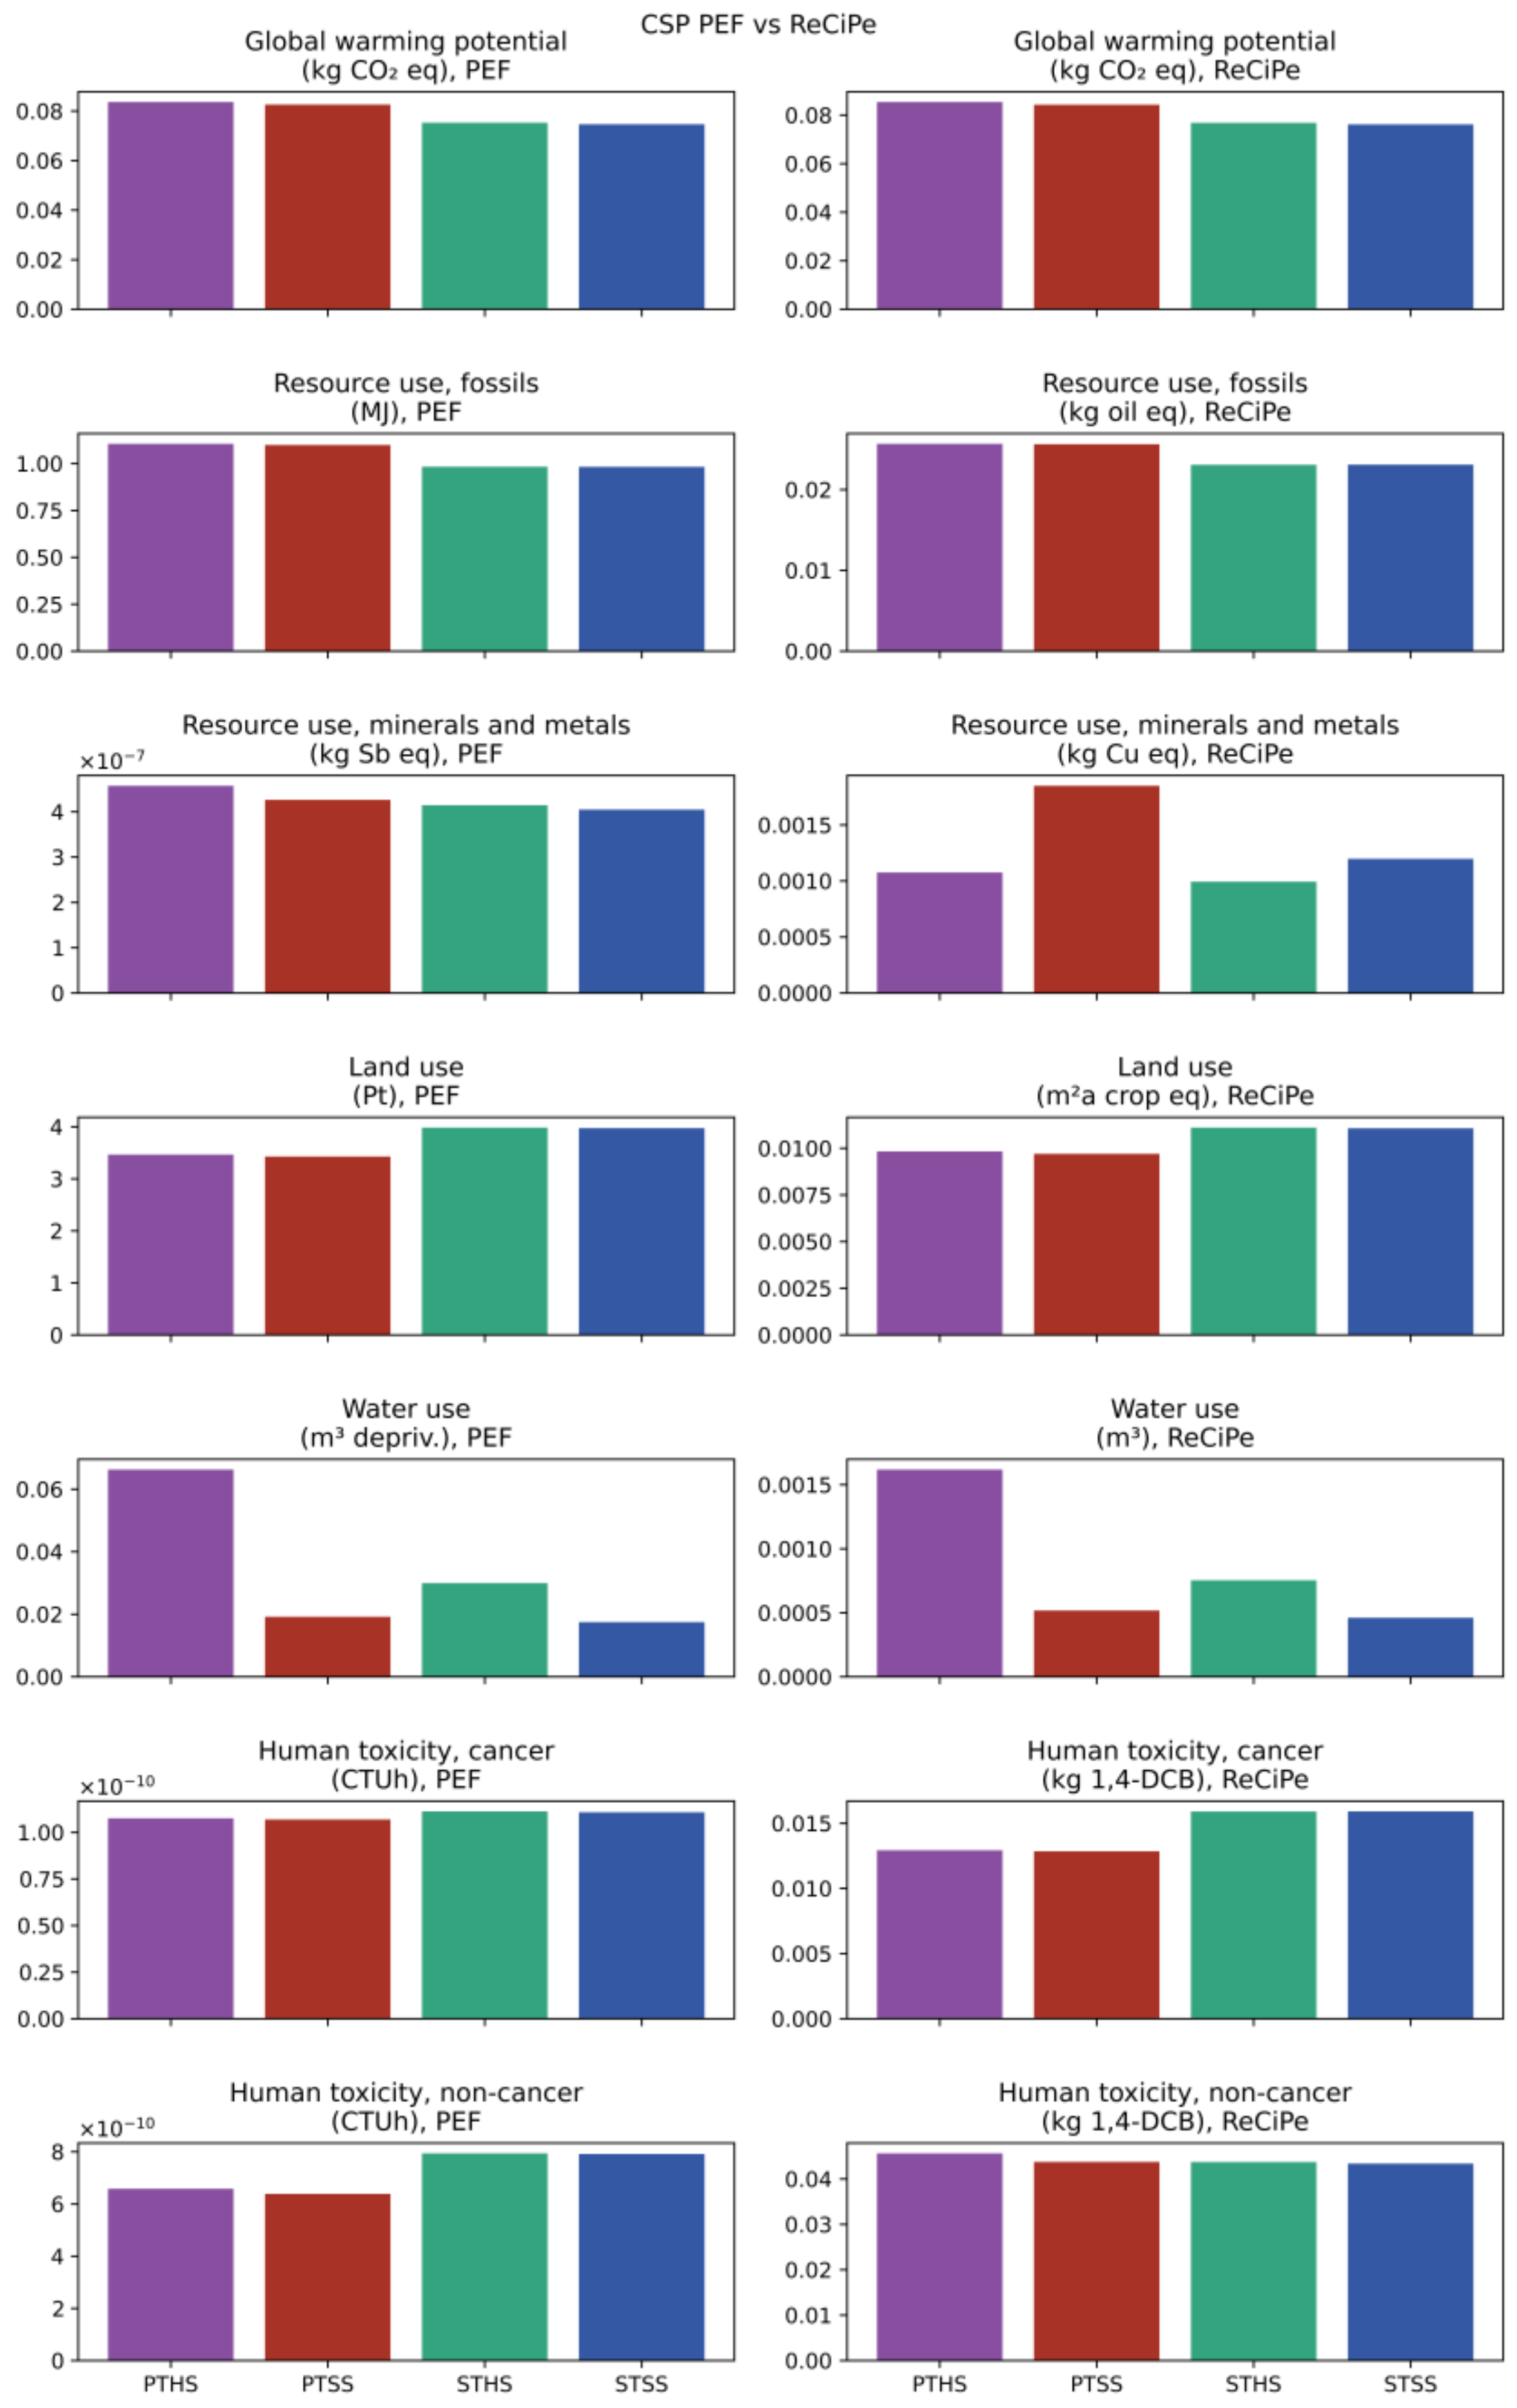
3.1. Life Cycle Environmental Impacts

The results per kWh of electricity were calculated, with the PEF LCIA method, from four CSP technologies for 16 impact categories. The life-cycle impact assessment results regarding 16 impact categories and comparisons among types of receivers and heat-transfer fluids are presented in Table 3. The green color indicates the low value, and the red color indicates the high value. Disregarding the HTFs, ST technologies have lower life cycle environmental impacts than PT technologies in 13 out of 16 impact categories. Meanwhile PT technologies are better than their counterparts in three impact categories, including HT, cancer, HT, non-cancer and LU. The highest difference lies in ET, freshwater, in which the average ET, freshwater of PT is 2.2 times higher than that of ST technologies. It is then followed by EP, marine and EU, terrestrial, with the difference of 1.12 times and 1.02 times, respectively. The difference between these two types of technologies for the remaining impact categories is less than 1 time.
Comparing HTFs, SS-based technologies are slightly better than their HS counterparts in 13 out 16 impact categories, while slightly worse in terms of EP, marine and PCOF. There is a considerable difference in WU between two types of HTFs, in which the average WU of HS-based technologies is 1.6 times higher than that of SS counterparts. In general, the differences between two types of CSPs by HTFs are insignificant for all impact categories, at around 1%, which are much lower than the differences for the corresponding impacts, when comparing the technologies by types of receivers.
The small difference between the impacts of SS-based and HS-based technologies originates from the trade-offs of environmental impacts of the HTFs and their efficiency. For example, the global warming potential of HS is about 25% higher than that of SS per kg of salt. However, HS works more efficiently than SS; therefore, the amount of HS needed per one functional unit (1 kWh of electricity) is smaller than the amount of SS. The higher global warming potential of HS is compensated by the smaller amount of this HTF. Consequently, the global warming potential of HS-based CSP plants is only 1% higher than that of SS-based CSP plants per kWh of electricity (Table 3).
The comparison of CSP technologies based on SS and HS implies that one material which has the better environmental profile does not ensure the delivery of better impacts when considered as part of the whole system/ module/ technology. Therefore, the selection of materials and their evaluations should be conducted per functional unit (which the system delivers). In such cases, the combined influence of the environmental impacts, the efficiency and other operational conditions will be taken into account.
The calculation with ReCiPe indicates different results for the majority of impact categories. These two methods apply different environmental mechanisms, with different units of measure for one common impact. For example, the ET impact is quantified in CTUe with PEF, while it is further divided into three impacts of ET, terrestrial, freshwater and marine, all quantified in kg 1,4-DCB in ReCiPe. Moreover, RU, fossils is measured in MJ with PEF, and in kg oil eq with ReCiPe. RU, mineral and metal is measured in kg Sb eq with PEF, and in kg Cu eq with ReCiPe.
The results of some main impacts, such as GWP, RU fossil, mineral and metal, LU, WU, HT, cancer and non-cancer of four technologies, calculated with PEF and ReCipe, are presented in Figure 2. The numeric number of all impact categories obtained with PEF and ReCiPe can be found in Table S1 of the Supplementary Information. Both methods share the same pattern in order of magnitude for most of the impact categories, including GWP, RU, fossils, LU, WU, and HT, cancer. Meanwhile, for RU, minerals and metals and HT, non-cancer, the two methods show different patterns. For example, RU, mineral and metal, which is calculated with PEF, ranges from 4.05 × 10⁻⁷ to 4.57 × 10⁻⁷ kg Sb eq per kWh, and the order of magnitude varies, with PTHS followed by PTSS and STHS, and finishing with STSS. Meanwhile, the order of magnitude obtained with ReCiPe for RU, minerals and metals is PTSS > STSS > PTHS > PTSS, with the range from 9.93 × 10⁻⁴ to 1.85 × 10⁻³ kg Cu eq per kWh.
Comparing the impact categories using the same units of measurement indicates a small difference between the two methods for GWP, but a relatively large difference for other impact categories, especially for PT technologies, as illustrated in Figure 3. Specifically, the difference in the GWPs obtained by these two methods are insignificant, at about 2% for all four technologies. Meanwhile, there is a large difference in the obtained results on ODP and water use of the two methods. The ozone depletion potential ranges from 2.68 × 10⁻⁹ to 3.80 × 10⁻⁹ kg CFC-11 eq per kWh of electricity generated from CSP plants, with the PEF method, and from 1.14 × 10⁻⁸ to 4.63 × 10⁻⁸ kg CFC-11 eq with the ReCiPe method. The ODPs obtained with ReCiPe are from 3-to-11 times higher than those obtained with PEF, for the same technologies. Moreover, the WU quantified with PEF is in the range of 1.75 × 10⁻² to 6.63 × 10⁻² m3 per kWh of electricity generated from CSP plants, while these numbers are considerably lower when quantified with ReCiPe, between 4.61 × 10⁻⁴ and 1.62 × 10⁻³ m3. The WU results of PEF are 36-to-40 times higher than those obtained with ReCiPe, depending on the specific technologies.

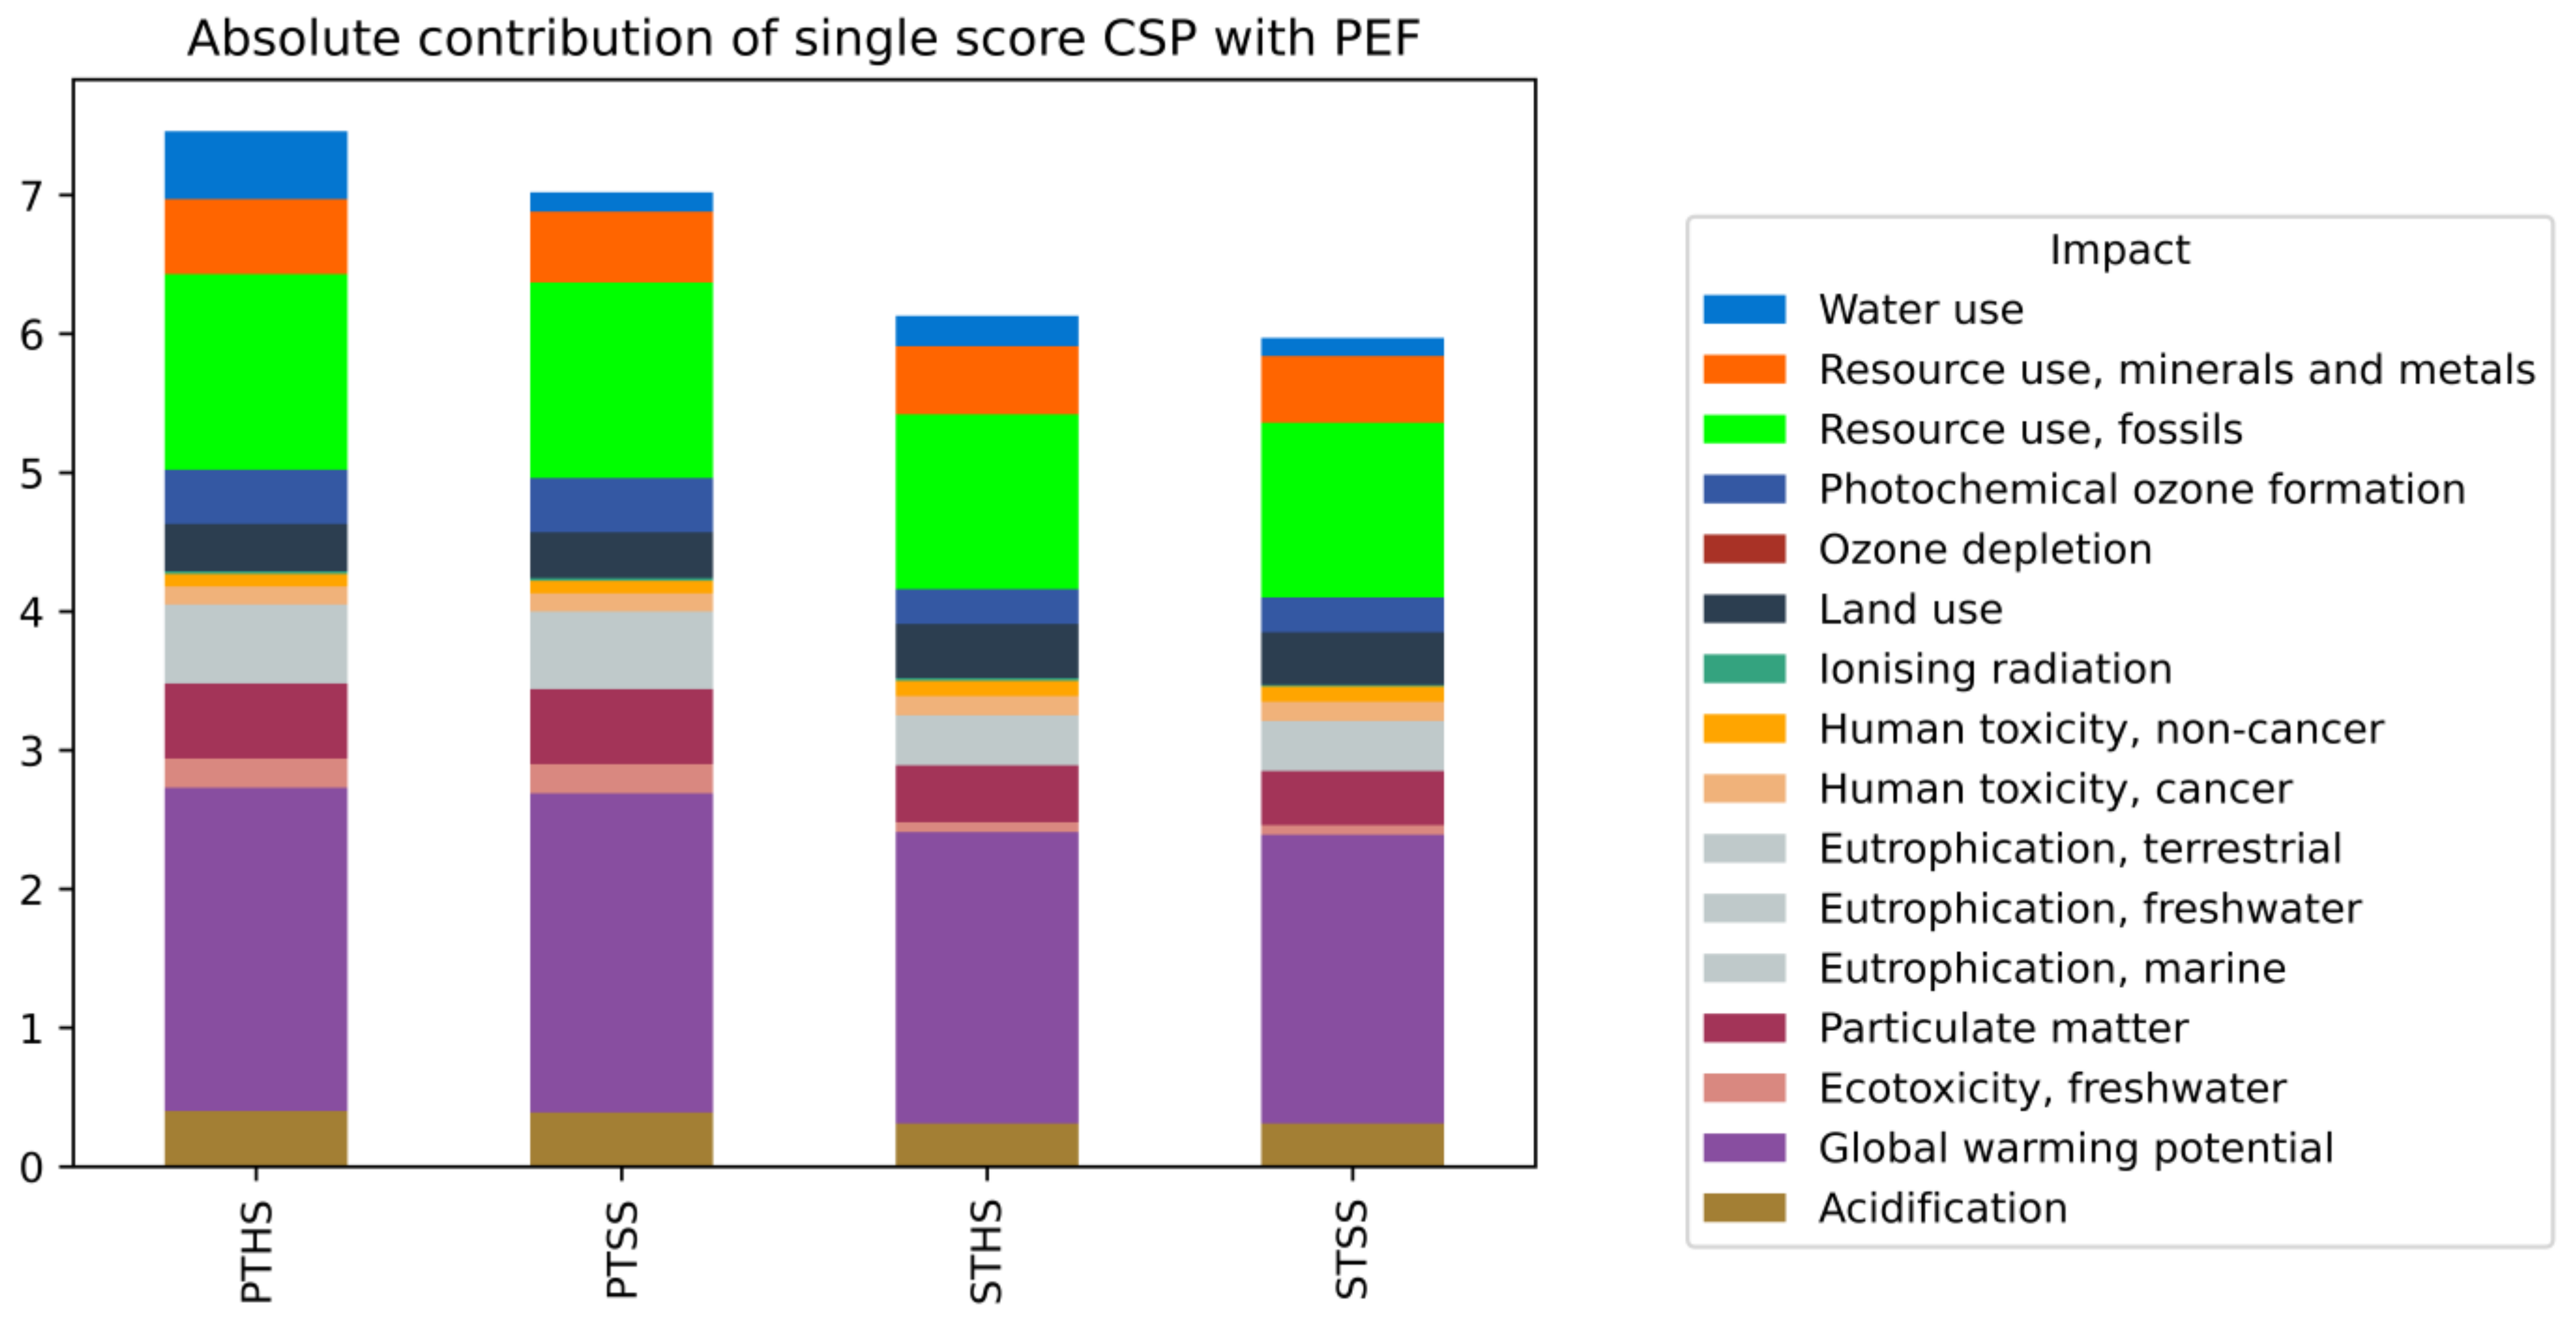
3.2. Single-Score Results

Moreover, the life-cycle impact results are quantified with respect to the endpoint value, which is called the single score (points per kWh). Figure 4 presents the absolute contribution of the impacts to the single-score results. Comparing the technologies, the life cycle single-score result is lowest in STSS CSP, at 5.97 points, meaning that the technology is the most environmentally friendly among the four technologies. In contrast, the highest single-score result comes from PTHS CSP, at 7.46 points. The single-score results of the PTSS and STHS plants are 7.02 points and 6.13 points, respectively.
Figure 5 presents the percentage contribution of impacts to the single-score results quantified with PEF and ReCiPe. It can be seen from Figure 5 that the two LCIA methods give different priority to each individual impact category. ReCiPe gives a higher weighting to the human health impact, while PEF gives relatively equal consideration to all the impacts. With PEF, around 30% of the total life-cycle impact (the single-score result) comes from climate change, and, correspondingly, the fossil resource use. These two impacts, presented in violet and green colors, respectively, appear to be the top-two adverse impacts among the sixteen impacts, as they are the top-two contributors to the single-score results for all four technologies. The contributions of other impacts, except for ET and HT, are fairly equal, and much lower than those of GWP and RU, fossils. The contributions of ET (in pink) and HT (in light and neutral-orange colors for cancer and non-cancer, respectively) are inconsiderable, compared to the remaining impact categories.
Meanwhile, with ReCiPe, the largest share of the total life-cycle impact (the normalization result) comes from the HT, cancer (in light-orange), followed by the ET (in pink). HT, cancer accounts from 73% to 77% of the total life-cycle impact, depending on specific CSP technologies, while the sum of ET, terrestrial, freshwater and marine accounts for 20% to 21% of the total life-cycle impact. The remaining impact categories account for an inconsiderable share of the total life-cycle impact.
The difference in priority of the two methods leads to variability in the contributions of impact categories to the environmental performance of the technologies. This variability may cause complexity in understanding and interpreting the results, identifying the environmental hotspots, and eco-designing the technologies. The two methods are developed for different regions and contexts; therefore, it is understandable that there will be certain variabilities. The application of the two LCIA methods will act as a sensitivity analysis to provide the decision makers and eco-designers with diverse information and data to support their decision and choice with respect to the most appropriate materials and technology.

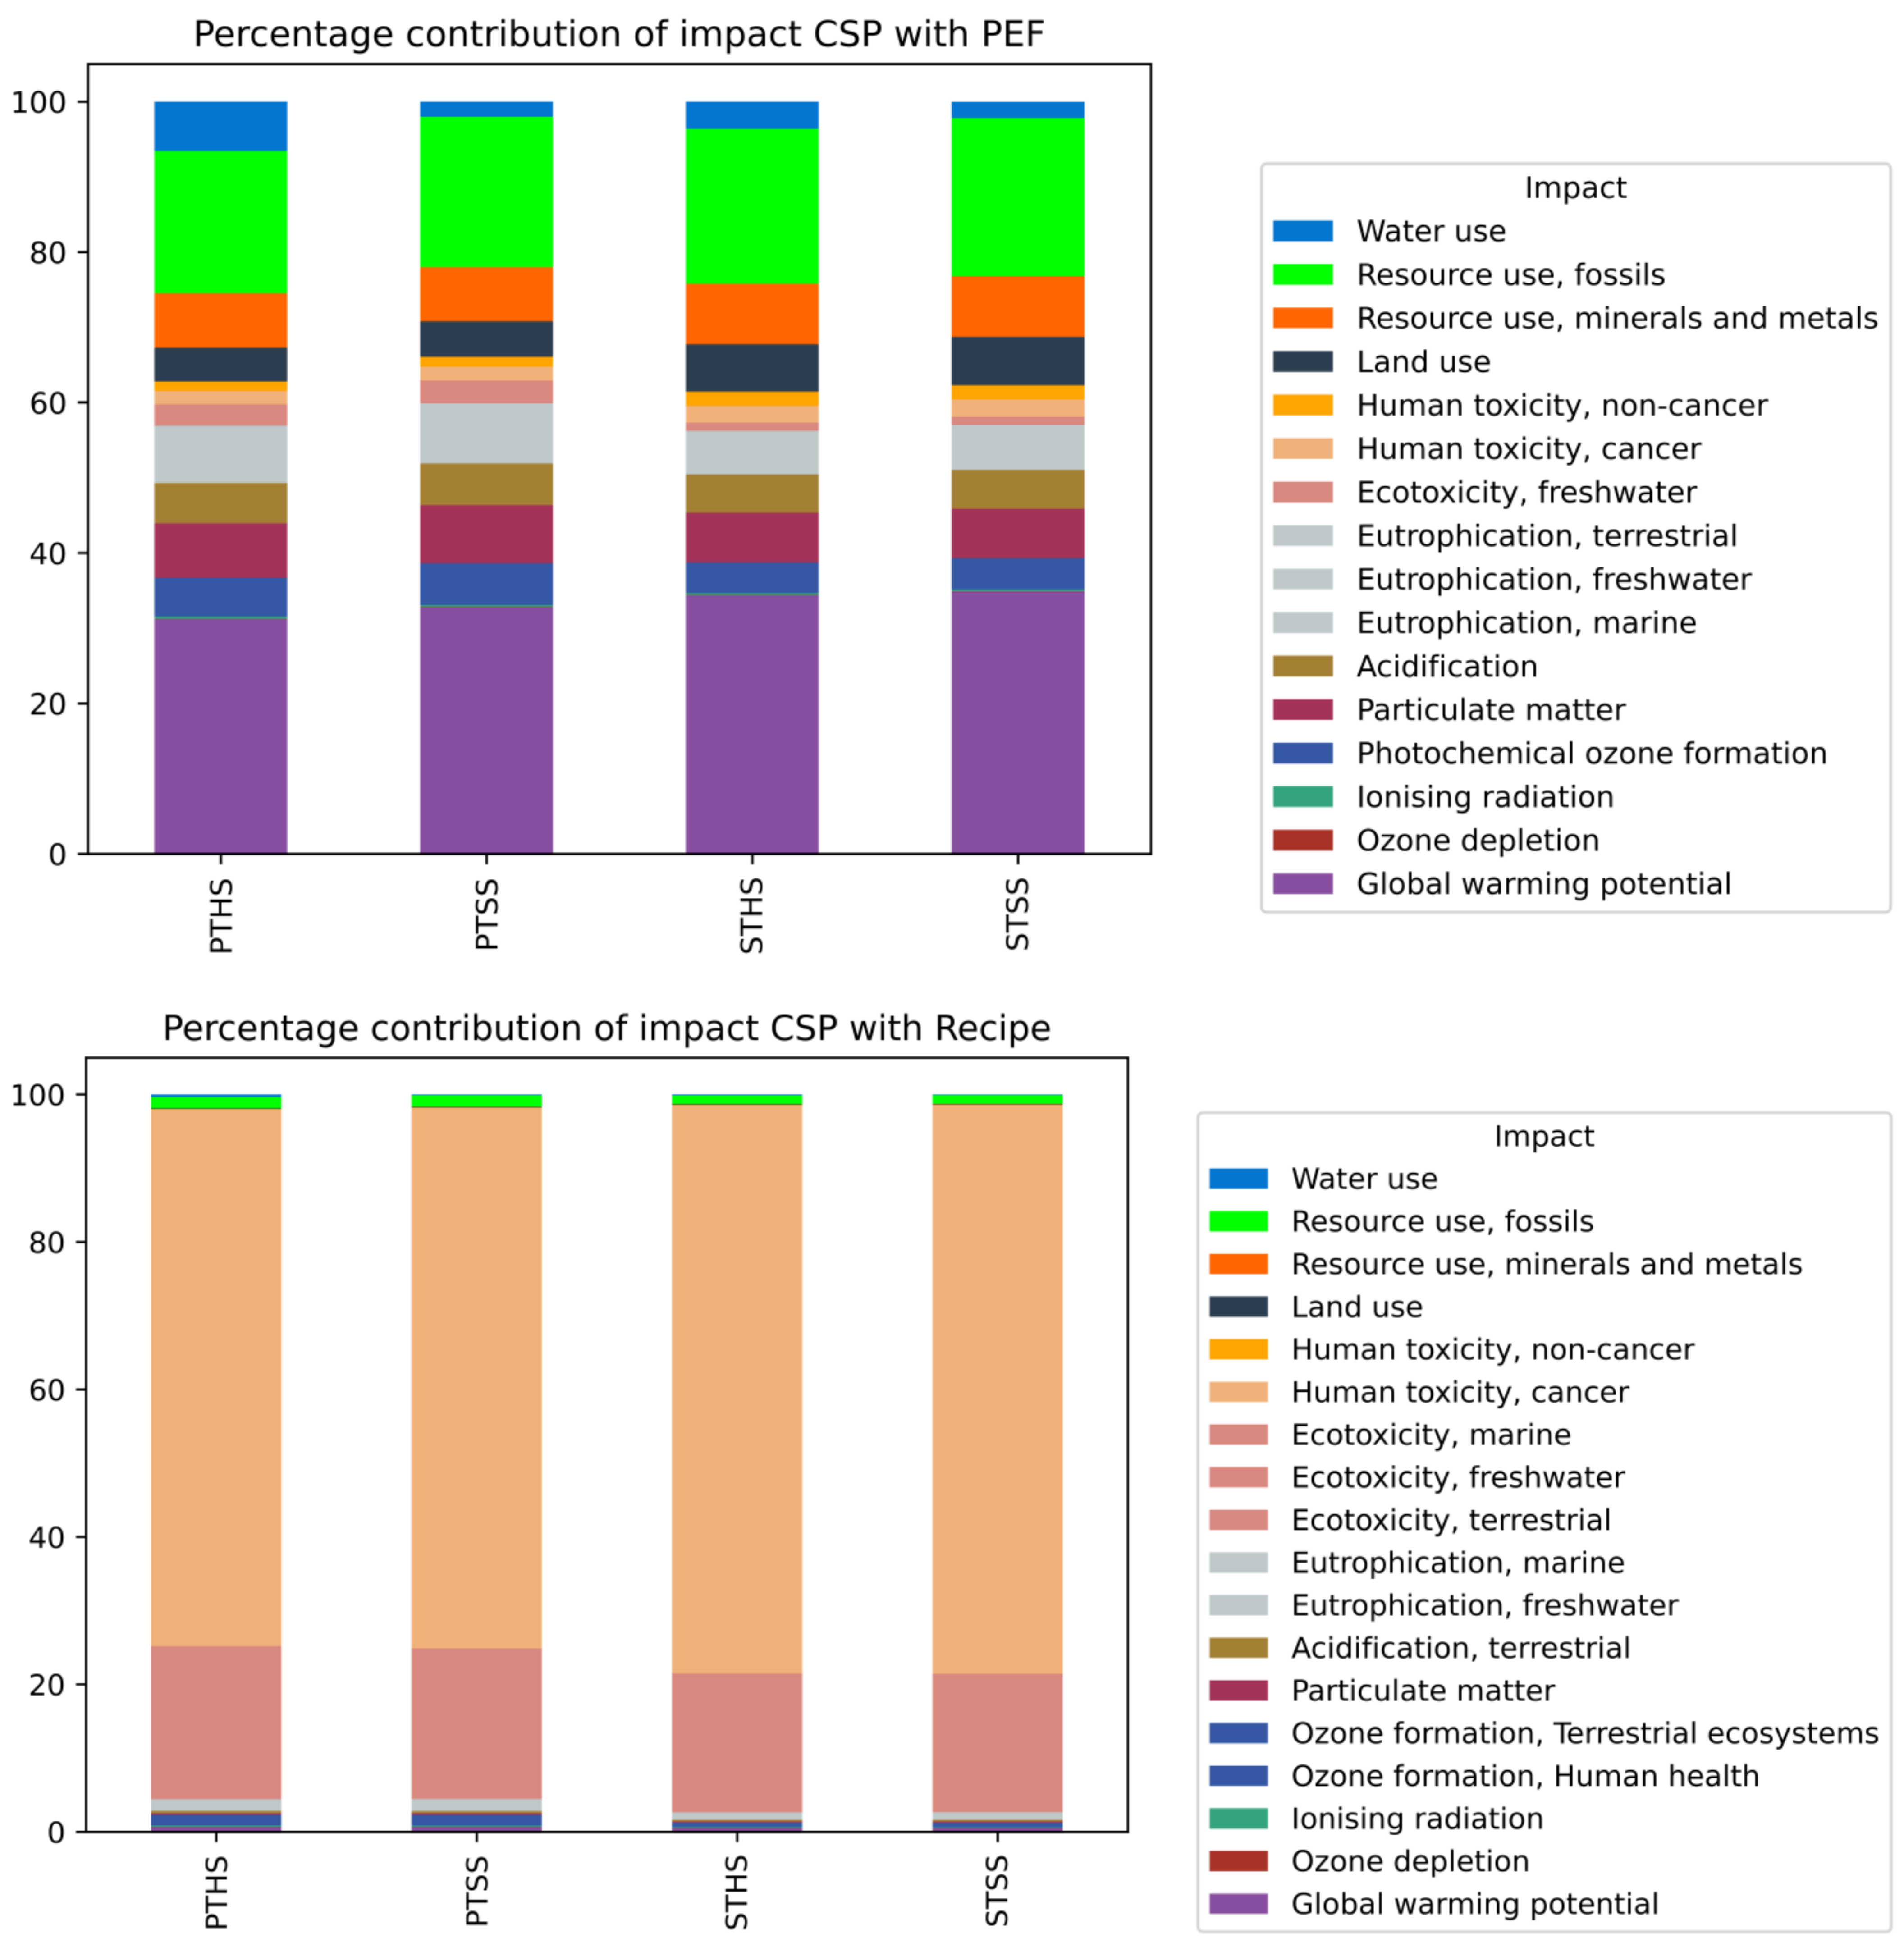
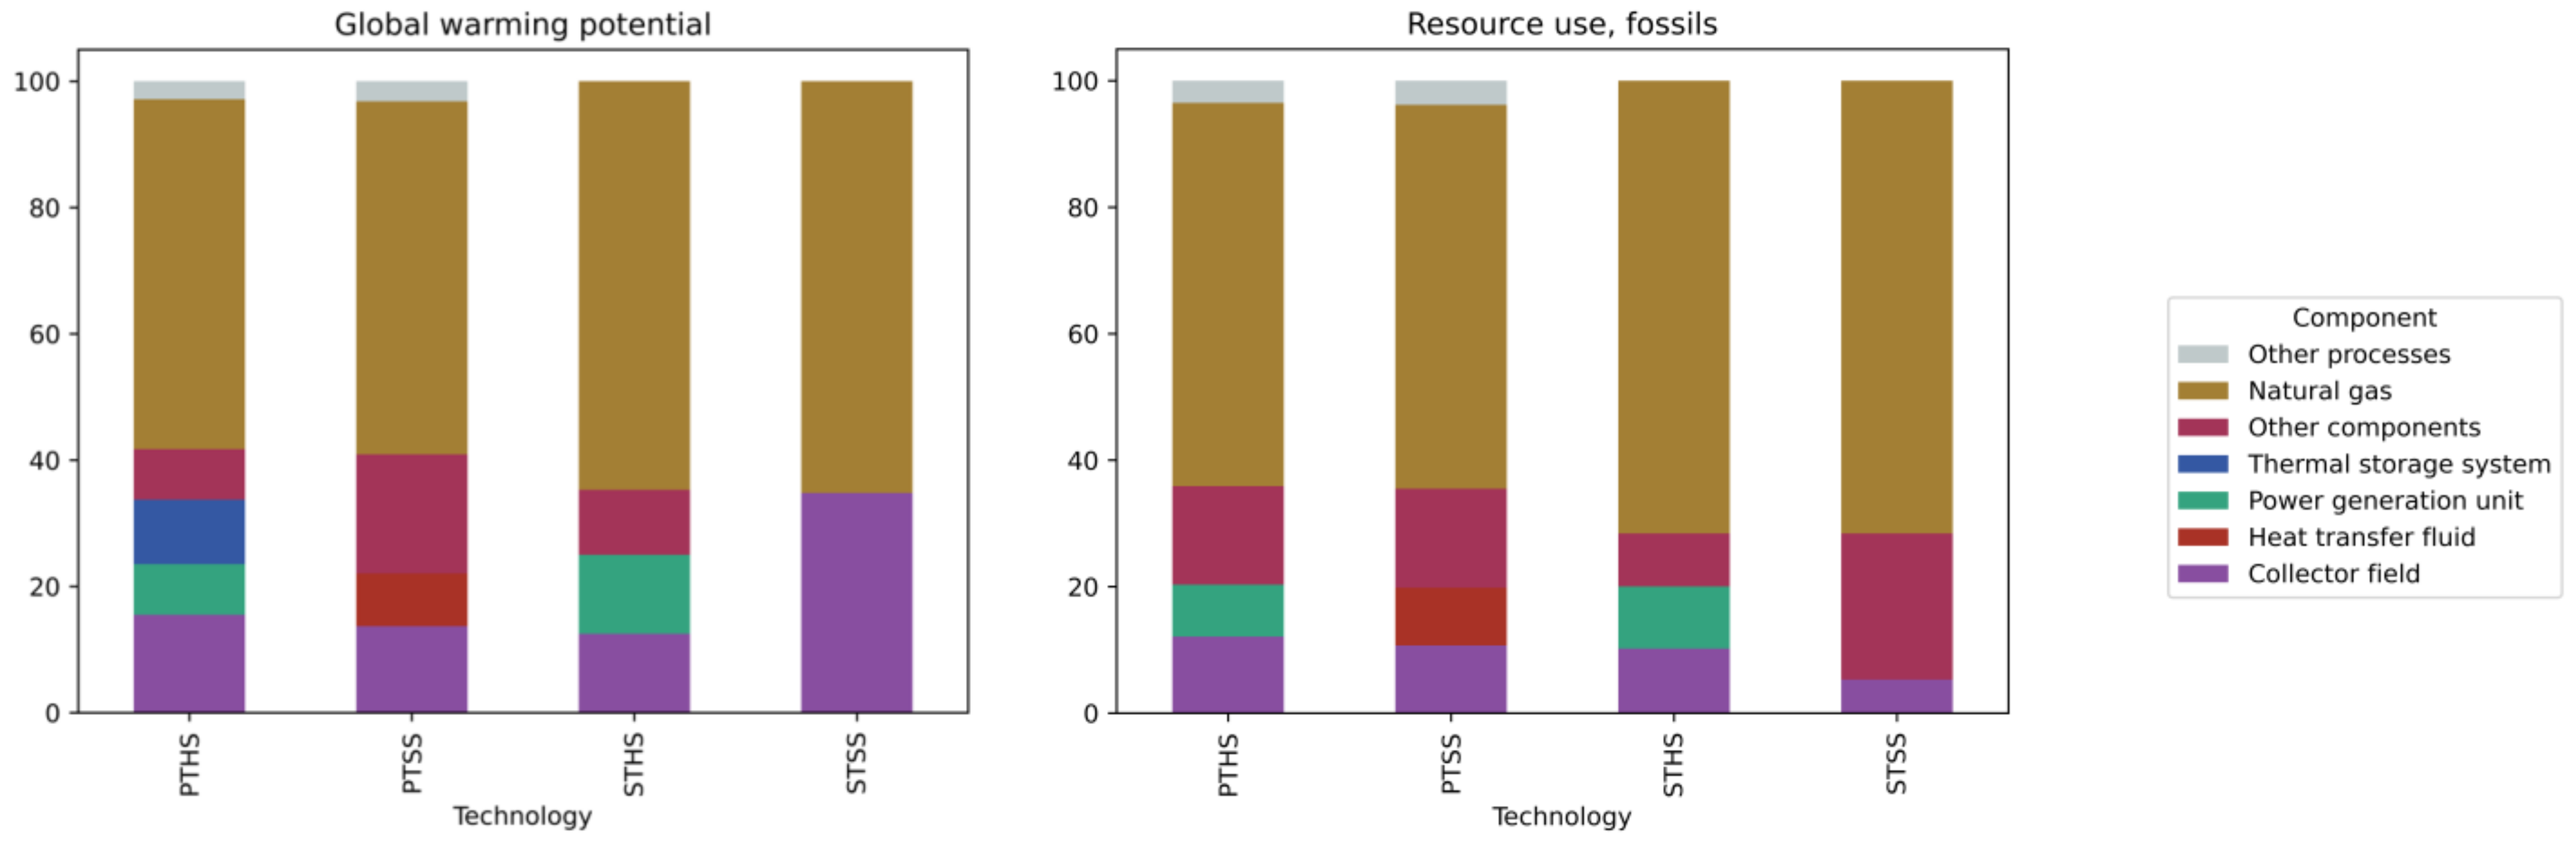
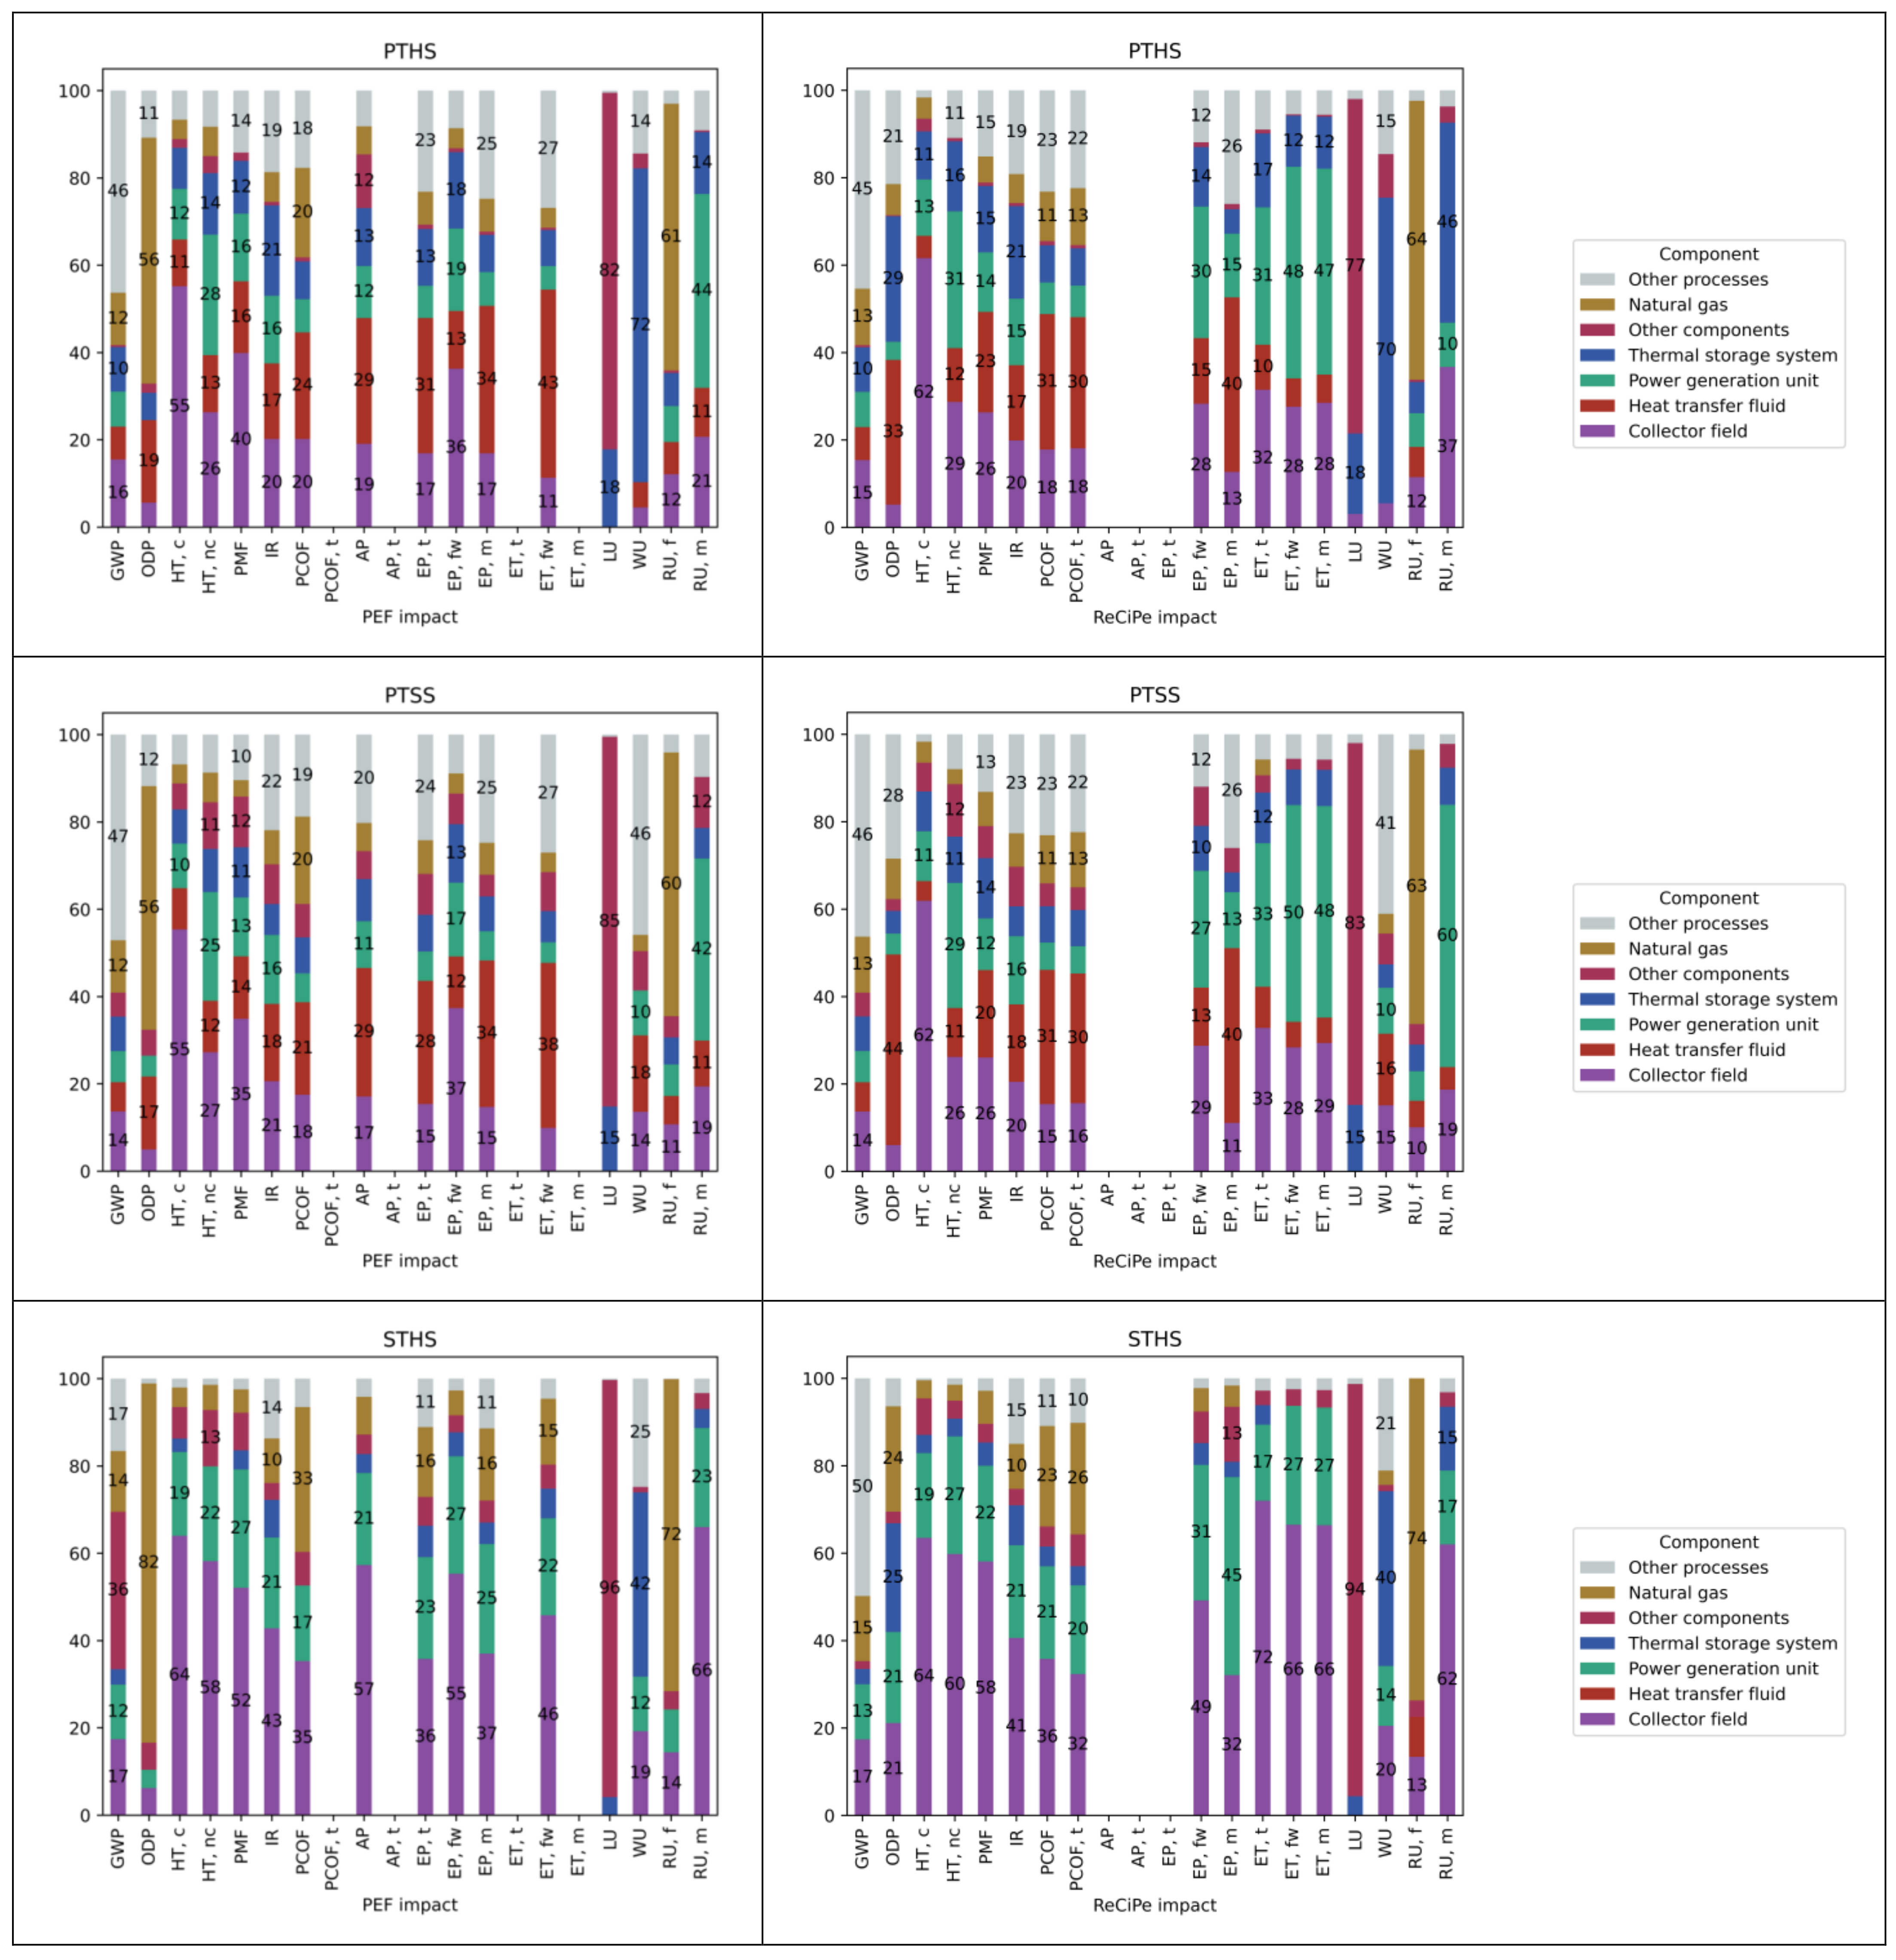
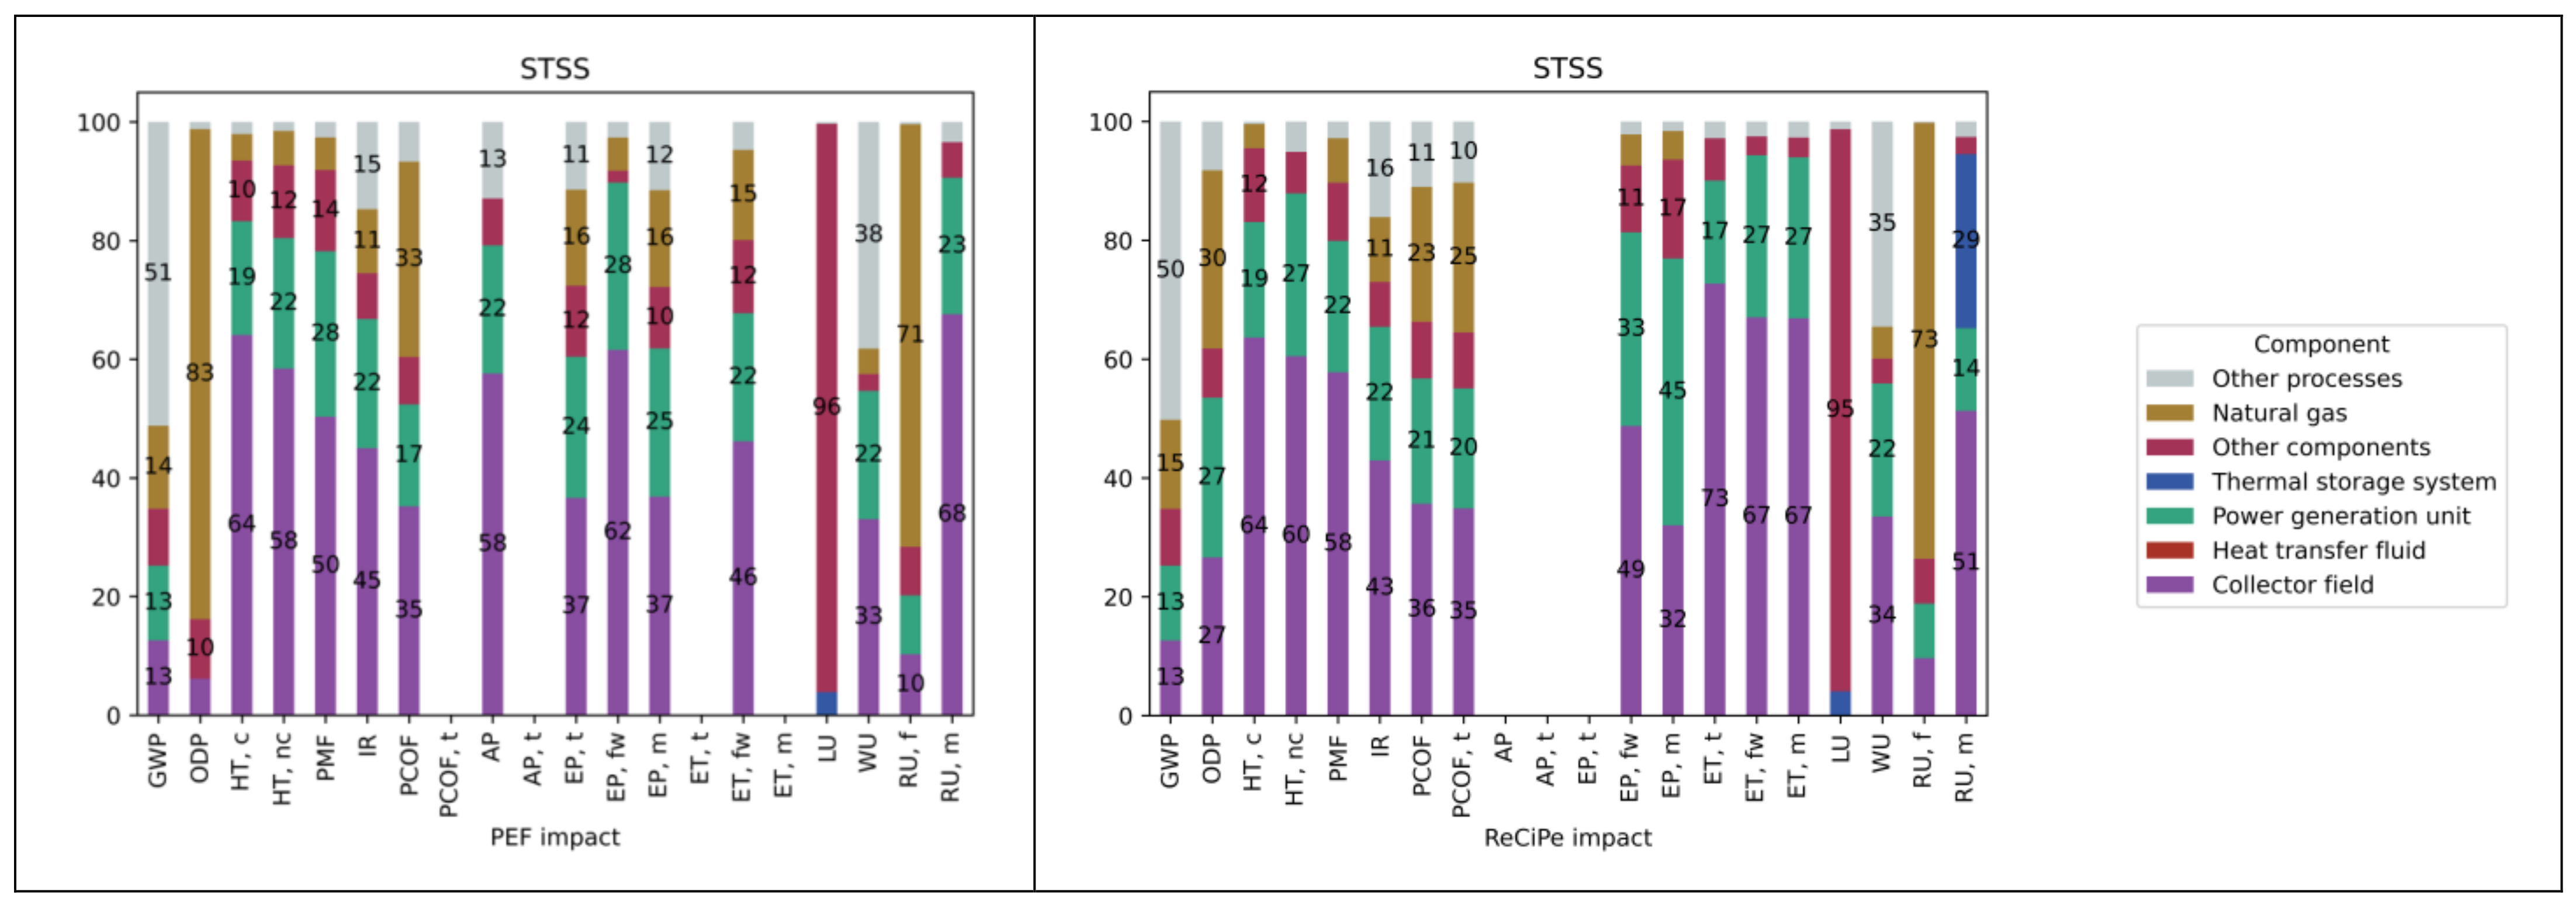
3.3. Contribution of Components to Individual Impacts

Considering the contributions of different components to the individual impacts, the hotspot lies in the natural gas consumption. This is confirmed for all four technologies and for the individual impacts of both GWP and RU, fossils. Figure 6 presents the contribution of different CSP components to GWP and RU, fossil impacts. As it can be seen from Figure 6, around 60% of both impacts comes from the use of natural gas for cogeneration and as an auxiliary fuel. The contribution of natural gas is slightly different among the technologies and impacts; its contribution to GWP is around 55.5% for PT technologies and 65% for ST technologies. Meanwhile, its contribution to RU, fossil fuel is slightly higher, compared to that of GWP, at around 60.6% for PT technologies and 71.6% for ST technologies.
The contributions of other components of CSP plants, such as the collector field, HTF, power-generation units, and TES, to the individual impacts are less than 15% each, except in the case of solar collectors of STSS. Moreover, the contributions of these components are different among technologies and impacts. Specifically, in term of GWP, the contribution of the solar collector is highest in STSS technology, accounting for 34.8%, which is followed by PTHS (15.5%) and PTSS (13.7%), and ends with STHS (12.5%). Regarding RU, fossils, the collector field contributes to 12.1% of the total impact of PTHS, and around 10.5% of PTSS and STHS. It only contributes to 5.3% of the total impact of RU, fossils in STSS technology.
Comparisons of hotspots obtained by PEF and ReCiPe are conducted on each individual impact category. It is expected that, although the unit and the absolute results are different for the two LCIA methods, the contributions of various components to each impact category should remain the same. However, the obtained results only partly prove this hypothesis, in which the hotspots are the same for some impacts, while totally different for some other impacts. With two different impact assessment methods, the same hotspots are obtained in terms of GWP, HT, cancer and non-cancer, IR, PCOF, AP, LU, WU, RU, and fossil, while different hotspots are obtained in five remaining impact categories, including ODP, PMF, EP, ET and RU, mineral and metal.
Figure 7 presents the contribution of components to life-cycle impact results of four CSP technologies, with the application of PEF and ReCiPe. In term of GWP, the collector field contributes 13–17%, which is followed by natural gas, at 13–15%. The range depends on specific technologies and LCIA methods. The specific contributions of components to GWP of each technology can be found in the Supplementary Information (Section S1).
For fossil resource use, the hotspots are the same with the application of ReCiPe and PEF, in which natural gas contributes from 60% to 64% for PT technologies and from 71% to 74% for ST technologies. The collector field is the second contributor, with the share from 9% to 13% with the ReCiPe method and from 10% to 14% with the PEF method. It is confirmed that the collector field and natural gas are the main contributors to the GWP and RU, fossils, of all four technologies, disregarding the applicable LCIA methods.
Regarding human toxicity, the hotspots lie in the collector field for both the cancer and non-cancer effect, and with the applications of both LCIA methods. Specifically, the collector field contributes from 62% to 64% of human toxicity, cancer with the ReCiPe method and from 55% to 64% with the PEF method for the same impact category. This range depends on technologies, with the lower end coming from PT technologies and the higher end coming from ST technologies. For human toxicity, non-cancer, the collector field contributes to about 26–29% with Recipe methods and 26–27% with the PEF method for PT technologies, and from 58% to 60% for ST technologies.
The identified hotspots are slightly different in cases where the two LCIA methods are applied, for RU, minerals and metals and ET, freshwater, for example. With PEF, most of the RU, minerals and metals originates from the collector field and power-generation unit. The collector field contributes from 19% to 68% of RU, minerals and metals. The power-generation unit contributes from 23% to 44%, depending on the specific technologies. Meanwhile, ReCiPe points out three hotspots, which are the collector field (accounting for 19% to 62%), the power-generation unit (accounting for 17% to 60%), and the thermal storage system (accounting for 29% to 46%). The specific contributions of components to RU, minerals and metals of each technology can be found in the Supplementary Information (Section S2).
Regarding the ecotoxicity, freshwater impact category, the identified hotspots of PT technologies are the power-generation unit (from 48% to 50%, depending on specific technologies) and the collector field (28%) with the ReCiPe method. However, with the PEF method, the identified hotspot is heat-transfer fluid, with contributions of up to 43% for PTHS and 38% for PTSS technologies. The same hotspots are identified for ST technologies, with different contributions for the two methods. The collector field has the largest share of these impacts, accounting for 46% to 67%, which is followed by the power-generation unit, accounting for 22% to 27%, depending on the LCIA method.

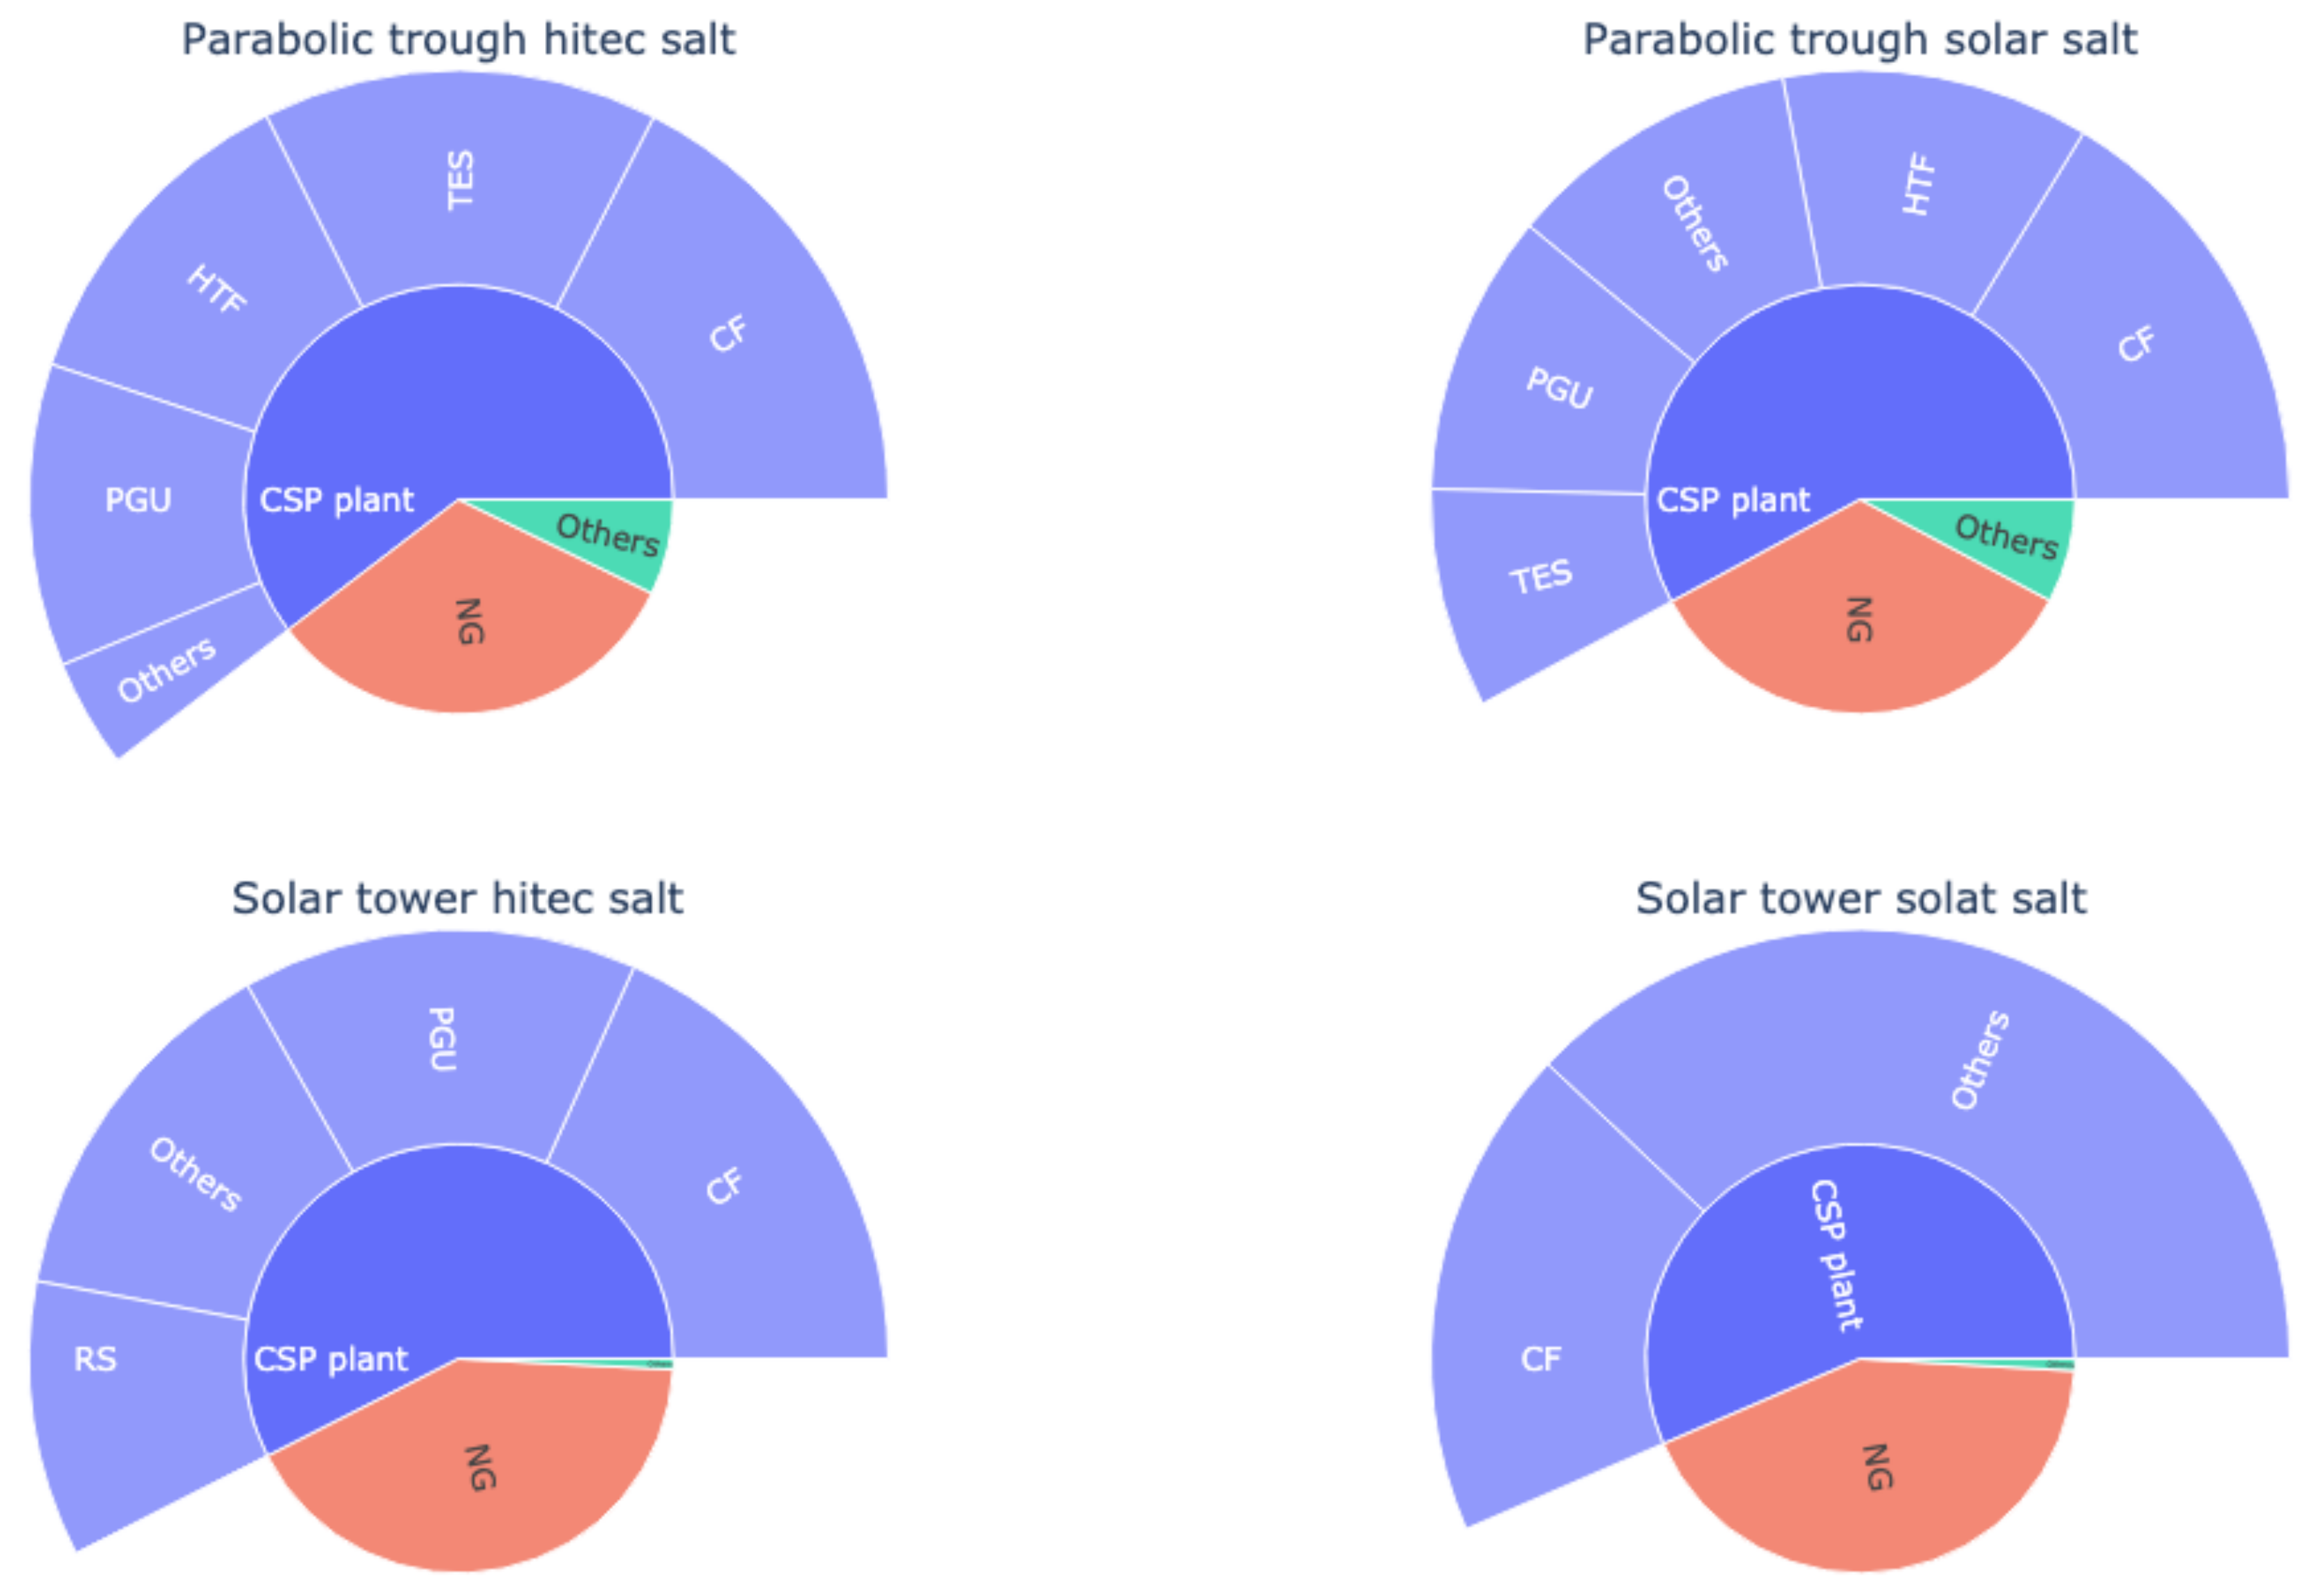
3.4. Contribution of Components to Single-Score Results

Regarding the contributions of different components to the single-score results, they are a bit different, with the largest contribution being from the solar-to-thermal components of CSP plants, at around 60%. The remaining 40% comes from the use of natural gas. Figure 8 presents the contribution of different CSP components to the single score in four CSP technologies. Specifically, the solar-to-thermal components of the PTHS CSP plant account for up to 60.4% of the total single-score results, which is then followed by those solar-to-thermal components of the PTSS CSP plant (57.9%) and the STHS CSP plant (57.5%). The solar-to-thermal components of the STSS CSP plant account for 56,5% of the total single score. Among the solar-to-thermal components, the solar collector appears to be the hotspot of all the CSP technologies, holding a share of 17.5% and 16.3% for PTHS and PTSS, respectively. Moreover, it accounts for 18.3% and 18.53% of STHS and STSS, respectively.
Natural gas, despite not being the largest shareholder of the total single-score result, plays a considerable role in the results for all four technologies. The contribution of natural gas is highest in the STSS CSP plant, at 42.6%, followed by the STHS CSP plant, at 41.7%. The contributions of natural gas to the single-score results of the PT CSP plants are 34.3% and 32.4% for SS and HS, respectively.
The significant contributions of natural gas to individual impacts of GWP and RU, fossils, as well as the single-score results, suggest several ways to reduce the life-cycle impacts of the CSP technologies, aiming at the eco-design of the technologies by reducing the amount of natural gas consumption. First, the CSP technologies can be utilized in ‘solar only’ mode, meaning that natural gas will be used for auxiliary purposes only. Currently, natural gas been used for both the cogeneration of electricity in a CSP plant, and for auxiliary purposes such as the start-up and the anti-freezing of the HTF, which cause a large impact originating from the use of natural gas. In cases where natural gas is used for auxiliary purposes only, the amount of natural gas consumed will significantly reduce, consequently reducing the life-cycle impacts from natural gas. Second, the use of natural gas can be substituted by other fuels with lower life-cycle impacts, such as biofuel. The lower environmental impacts of biofuel, compared to natural gas, as a renewable energy, will help to reduce the life-cycle impacts of the CSP plants.

4. Conclusions and Future Paths for Eco-Design Studies

This paper quantifies the life-cycle impacts of various CSP technologies, with the applications of two LCIA methods. Generally, ST technologies indicate a better environmental profile than their PT counterparts for most of the impact categories, including GWP, ET, PMF, AP, EP, IR, ODP, PCOF, RU and WU. PT technologies show a better environmental profile in terms of HT for both cancer and non-cancer and LU. The highest difference between PT and ST technologies lies in ET, at more than two times. Meanwhile, there is an insignificant difference between two types of HTFs, SS and HS; this is less than 1% for most of the impact categories.
The comparison of results obtained with the two LCIA methods showed that the ReCiPe method assigns significance to the influence on human health, while the PEF method gives more or less equal attention to all aspects. This affects the criticality of impact categories with regard to the total impact, in which HT, cancer accounts for up to 77% of total life-cycle impacts with ReCiPe. However, with PEF, the top contributors are GWP (35%) and RU, fossils (21%). Considering that ReCiPe is a globally scaled method, while PEF is regionally designed for EU countries, it is recommended that PEF should be applied in the EU context. It should be noted that the PEFCR is currently unavailable for concentrating energy technologies. Therefore, it is suggested that other methods such as ReCiPe can be used for supplementing the results obtained with PEF for technologies in which there is no existing and applicable PEFCR. Moreover, PEFCR for solar PV [33,34], IEA’s guidelines for LCA of solar PV [14] and IEA’s reports related to LCA of solar heating and cooling system [35] are good references for LCA of solar energy technologies.
Regardless of LCIA methods, the hotspots are the same for most impact categories, such as GWP, HT cancer and non-cancer, RU fossils, etc., which are the collector field and natural gas. Meanwhile, for some impacts such as RU minerals and metals and ET, freshwater, the identified hotspots are slightly different when the two LCIA methods are applied. For example, PEF points out that the collector field and power-generation units are the largest contributors to RU minerals and metals. Meanwhile, according to ReCiPe, apart from the collector field and power-generation unit, TES holds a large share of RU, minerals and metals, from 29% to 46%.
In cases where all the impact categories are aggregated into a single-score result, the identified hotspots are solar-to-thermal components (60%) and natural gas (40%). Among the solar-to-thermal components, the collector field, again, is the largest contributor, of 16% to 18%. This analysis points out that the eco-design of concentrating solar technologies should focus on the improvement of solar-to-thermal components and natural gas consumption. Regarding the solar-to-thermal components, the better environmental profile of the solar collector fields will enhance the environmental performance of the technologies in general. Improvements in other components such as the power-generation unit, TES, and HTF will reduce the individual life-cycle impacts. For example, to reduce water consumption, priority should be given to the power-generation unit. Moreover, the consumption of natural gas should be balanced between its role in improving the efficiency of the CSP plants and its negative impacts on the environmental performance of the plants. The use of renewable energy in the replacement of natural gas may be a future path for the eco-design of concentrating solar technologies.
It should be noted that the case study focused on Italy, with specific environmental conditions and energy infrastructure; therefore, the obtained results are not entirely applicable to any other countries. It is recommended that the LCA results should be quantified, based on specific contexts such as the technical characteristic of CSP plants, solar radiation of the locations, the energy and industrial conditions of background processes, etc. The comparative results obtained with the two LCIA methods, however, are good examples of supporting the selection of suitable LCIA methods in a European context and in the solar energy sectors.
The study was conducted on the most popular CSP technologies, based on PT and ST. The newly constructed, and the projected, commercial CSP plants tend to combine CSP and PV technologies [25]. The LCA of this hybrid technology should be further studied, to complete the picture on the life-cycle environmental impacts of CSP technologies.

Supplementary Materials

The following supporting information can be downloaded at: https://www.mdpi.com/article/10.3390/en17174461/s1, Table S1: LCA results obtained with PEF and ReCiPe.

Author Contributions

Conceptualization, M.C., L.Q.L. and S.L; methodology, L.Q.L.; software, L.Q.L.; validation, S.L.; resources, F.G and M.C.; data curation, L.Q.L.; writing—original draft preparation, all authors; writing—review and editing, all authors; visualization, L.Q.L.; supervision, M.C.; project administration, M.C and F.G.; funding acquisition, M.C. All authors have read and agreed to the published version of the manuscript.

Funding

This research was funded by European Union—NextGenerationEU: code PE0000021, CUP B73C22001280006, and the APC was waived by the Energies journal for Prof. Maurizio Cellura.

Data Availability Statement

The original contributions presented in the study are included in the Article/Supplementary Materials; further inquiries can be directed to the corresponding author/s.

Acknowledgments

This work has been developed in the framework of the project “Network 4 Energy Sustainable Transition—NEST”, code PE0000021, CUP B73C22001280006, Spoke 1, funded under the National Recovery and Resilience (NRRP), Mission 4, by the European Union—NextGenerationEU.

Conflicts of Interest

The authors declare no conflicts of interest. The funders had no role in the design of the study; in the collection, analyses, or interpretation of data; in the writing of the manuscript; or in the decision to publish the results.

Abbreviations

APAcidification potential
CSPConcentrating solar power
disease inc.Disease incidence
ECEuropean Commission
EP Eutrophication potential
ETEcotoxicity
GWGigawatt
GWPGlobal warming potential
HSHitec salt
HTHuman toxicity
HTFHeat-transfer fluid
IEAInternational Energy Agency
IPCCIntergovernmental Panel on Climate Change
IRIonising radiation
ISOInternational Organization for Standardization
kg CO2 eqKilogram carbon dioxide equivalent
kWhKilowatt hour
LCALife-cycle assessment
LCIALife-cycle impact assessment
LULand use
m3 depriv.Cubic meter-deprived
MJMegajoule
MWMegawatt
ODP Ozone depletion potential
OEFOrganization environmental footprint
OEFSROrganization environmental footprint sector rules
PCOF Photochemical ozone formation
PEFProduct environmental footprint
PEFCRProduct environmental footprint category rules
PTParabolic trough
PtPoint
PVPhotovoltaics
RU Resource use
SS Solar salt
ST Solar tower
TESThermal-energy storage system
UNEPUnited Nation Environment Program
WUWater use

References

  1. IRENA. Renewable Power Generation Costs in 2019; International Renewable Energy Agency (IRENA): Abu Dhabi, United Arab Emirates, 2020. [Google Scholar]
  2. Răboacă, M.S.; Badea, G.; Enache, A.; Filote, C.; Răsoi, G.; Rata, M.; Lavric, A.; Felseghi, R.-A. Concentrating Solar Power Technologies. Energies 2019, 12, 1048. [Google Scholar] [CrossRef]
  3. IEA. Renewables 2020—Analysis and Forecast to 2025; International Energy Agency: Paris, France, 2020. [Google Scholar]
  4. Ferruzzi, G.; Delcea, C.; Barberi, A.; Di Dio, V.; Di Somma, M.; Catrini, P.; Guarino, S.; Rossi, F.; Parisi, M.L.; Sinicropi, A.; et al. Concentrating Solar Power: The State of the Art, Research Gaps and Future Perspectives. Energies 2023, 16, 8082. [Google Scholar] [CrossRef]
  5. Chandrasekar, M.; Senthilkumar, T. Five Decades of Evolution of Solar Photovoltaic Thermal (PVT) Technology—A Critical Insight on Review Articles. J. Clean. Prod. 2021, 322, 128997. [Google Scholar] [CrossRef]
  6. Kumar, L.; Hasanuzzaman, M.; Rahim, N.A. Global Advancement of Solar Thermal Energy Technologies for Industrial Process Heat and Its Future Prospects: A Review. Energy Convers. Manag. 2019, 195, 885–908. [Google Scholar] [CrossRef]
  7. Wang, J.; Liu, X.; Xu, Q.; Luo, Q.; Xuan, Y. MXene Reconciles Concurrent Enhancement of Thermal Conductivity and Mechanical Robustness of SiC-Based Thermal Energy Storage Composites. DeCarbon 2023, 1, 100005. [Google Scholar] [CrossRef]
  8. Lamnatou, C.; Notton, C.; Chemisana, D.; Cristofari, C. Storage Systems for Building-Integrated Photovoltaic (BIPV) and Building-Integrated Photovoltaic/Thermal (BIPVT) Installations: Environmental Profile and Other Aspects. Sci. Total Environ. 2020, 699, 134269. [Google Scholar] [CrossRef] [PubMed]
  9. Koli, P.; Kumar, R.; Dayma, Y.; Dheerata; Jonwal, M. Graphite Counter Electrode Modified Tropaeolin-O Photo-sensitized Photogalvanic Cells for Solar Power and Storage. EcoEnergy 2024, 2, 278–298. [Google Scholar] [CrossRef]
  10. Speranza, R.; Zaccagnini, P.; Sacco, A.; Lamberti, A. High-Voltage Energy Harvesting and Storage System for Internet of Things Indoor Application. Sol. RRL 2022, 6, 2200245. [Google Scholar] [CrossRef]
  11. Vignarooban, K.; Xu, X.; Arvay, A.; Hsu, K.; Kannan, A.M. Heat Transfer Fluids for Concentrating Solar Power Systems—A Review. Appl. Energy 2015, 146, 383–396. [Google Scholar] [CrossRef]
  12. Horne, R. Life Cycle Assessment: Origins, Principles and Context. In Life Cycle Assessment—Principles, Practice and Prospects; CSIRO Publishing: Collingwood, VIC, Australia, 2009; pp. 1–8. [Google Scholar]
  13. Fava, J.A. Life Cycle Initiative: A Joint UNEP/SETAC Partnership to Advance the Life-Cycle Economy. Int. J. Life Cycle Assess. 2002, 7, 196–198. [Google Scholar] [CrossRef]
  14. Frischknecht, R.; Heath, G.; Raugei, M.; Sinha, P.; de Wild-Scholten, M. Methodology Guidelines on Life Cycle Assessment of Photovoltaic Electricity; International Energy Agency: Paris, France, 2016. [Google Scholar]
  15. European Commission. Understanding Product Environmental Footprint and Organisation Environmental Footprint Methods; Publications Office of the European Union: Luxembourg, 2021. [Google Scholar]
  16. ISO 14040:2006; ISO Environmental Management—Life Cycle Assessment—Principles and Framework. International Organization for Standardization: Geneva, Switzerland, 2006.
  17. Bjørn, A.; Owsianiak, M.; Molin, C.; Hauschild, M.Z. LCA History. In Life Cycle Assessment; Hauschild, M.Z., Rosenbaum, R.K., Hauschild, S.I.O., Eds.; Springer International Publishing: Berlin/Heidelberg, Germany, 2018. [Google Scholar]
  18. Luu, Q.L.; Van Doan, B.; Nguyen, N.Q.; Nguyen, N.H. Life Cycle Assessment (LCA) of an Integrated Solar PV and Wind Power System in Vietnam. J. Asian Energy Stud. 2020, 4, 36–47. [Google Scholar] [CrossRef]
  19. Leontief, W. Chapter 11: Environmental Repercussions and the Economic Structure: An Input-Output Approach. In Input-Output Economics; Oxford University Press: New York, NY, USA, 1986. [Google Scholar]
  20. Gibon, T.; Wood, R.; Arvesen, A.; Bergesen, J.D.; Suh, S.; Hertwich, E.G. A Methodology for Integrated, Multiregional Life Cycle Assessment Scenarios under Large-Scale Technological Change. Environ. Sci. Technol. 2015, 49, 11218–11226. [Google Scholar] [CrossRef] [PubMed]
  21. Luu, L.Q.; Gibon, T.; Cellura, M.; Sanseverino, E.R.; Longo, S. Integrated Hybrid Multi-Regional Input-Output for Assessing Life Cycle Air Emissions of the Italian Power System. Energy 2024, 290, 130109. [Google Scholar] [CrossRef]
  22. ISO 14044:2006; ISO Environmental Management—Life Cycle Assessment—Requirements and Guidelines. International Organization for Standardization: Geneva, Switzerland, 2006.
  23. Cellura, M.; Luu, L.Q.; Guarino, F.; Minestra, M. Life Cycle Greenhouse Gas Emissions and Relevant Impacts of Concentrating Solar Technologies. In Proceedings of the Networks, Markets and People Symposium 2024 (NMP2024), Reggio Calabria, Italy, 22–24 May 2024. [Google Scholar]
  24. Gobio-Thomas, L.B.; Darwish, M.; Stojceska, V. Environmental Impacts of Solar Thermal Power Plants Used in Industrial Supply Chains. Therm. Sci. Eng. Prog. 2023, 38, 101670. [Google Scholar] [CrossRef]
  25. NREL. SolarPACES—Concentrating Solar Power (CSP) Projects; National Renewable Energy Laboratory (NREL): Golden, CO, USA, 2022. [Google Scholar]
  26. EPLCA. Environmental Footprint (EF) Impact Assessment; European Platform on Life Cycle Assessment: Brussels, Belgium; Available online: https://eplca.jrc.ec.europa.eu/EFVersioning.html (accessed on 14 August 2024).
  27. Huijbregts, M.A.J.; Steinmann, Z.J.N.; Elshout, P.M.F.; Stam, G.; Verones, F.; Vieira, M.; Zijp, M.; Hollander, A.; van Zelm, R. ReCiPe2016: A Harmonised Life Cycle Impact Assessment Method at Midpoint and Endpoint Level. Int. J. Life Cycle Assess. 2017, 22, 138–147. [Google Scholar] [CrossRef]
  28. Huijbregts, M.A.J.; Steinmann, Z.J.N.; Elshout, P.M.F.; Stam, G.; Verones, F.; Vieira, M.D.M.; Hollander, A.; Zijp, M.; van Zelm, R. ReCiPe 2016 v1.1 A Harmonized Life Cycle Impact Assessment Method at Midpoint and Endpoint Level Report I: Characterization; RIVM: Bilthoven, The Netherlands, 2016; p. 201. [Google Scholar]
  29. Sala, S.; Cerutti, A.; Pant, R. Development of a Weighting Approach for Environmental Footprint; Publication Office of the European Union: Luxembourg, 2018; ISBN 978-92-79-68041-0. [Google Scholar]
  30. Vieira, M. The End of the PEF Pilot Phase and the Start of a Beautiful Friendship; Pre Sustainability 2018. Available online: https://pre-sustainability.com/articles/the-end-of-the-pef-pilot-phase-review-transition-phase/ (accessed on 14 August 2024).
  31. European Commission. Commission Recommendation of 16.12.2021 on the Use of the Environmental Footprint Methods to Measure and Communicate the Life Cycle Environmental Performance of Products and Organisations; European Commission: Brussels, Belgium, 2021. [Google Scholar]
  32. Cordella; Sala, S. The Environmental Footprint Methods: What, Why, How, Where; TAIEX-EIR Multi-country Flagship Workshop on best practices of use of Environmental Footprint methods on the EU market. Brussels, Belgium, 30 May 2024. Available online: https://webgate.ec.europa.eu/TMSWebRestrict/resources/js/app/#/library/detail/85542 (accessed on 14 August 2024).
  33. Polverini, D.; Espinosa, N.; Eynard, U.; Leccisi, E.; Ardente, F.; Mathieux, F. Assessing the Carbon Footprint of Photovoltaic Modules through the EU Ecodesign Directive. Sol. Energy 2023, 257, 1–9. [Google Scholar] [CrossRef]
  34. PEFCR PV Technical Secretariat Product Environmental Footprint Category Rules (PEFCR). Photovoltaic Modules Used in Photovoltaic Power Systems for Electricity Generation. 2019. Available online: https://ec.europa.eu/environment/eussd/smgp/pdf/PEFCR_PV_electricity_feb2020_2.pdf (accessed on 14 August 2024).
  35. Beccali, M.; Cellura, M.; Longo, S. LCA and Techno-Eco Comparison between Reference and New Systems; IEA Task 53 SHC; International Energy Agency: Paris, France, 2018. [Google Scholar]
Figure 1. LCA framework of CSP technologies.
Energies 17 04461 g001
Figure 2. Several life-cycle impacts of four CSP technologies.
Energies 17 04461 g002
Figure 3. Impact assessment results quantified with PEF and ReCiPe.
Energies 17 04461 g003
Figure 4. Contribution of impact categories to single-score results.
Energies 17 04461 g004
Figure 5. Comparing the single-score result.
Energies 17 04461 g005
Figure 6. Contribution of components to climate change and fossil fuel resource use.
Energies 17 04461 g006
Figure 7. Contribution of components to life-cycle impact results of four CSP technologies, with PEF and ReCiPe methods. Notes: GWP: Global warming potential; ODP: Ozone depletion potential; HT, c: Human toxicity, cancer; HT, nc: Human toxicity, non-cancer; PMF: Particulate matter formation; IR: Ionizing radiation; PCOF: Photochemical oxidant formation; PCPF, t: Photochemical oxidant formation, terrestrial; AP: Acidification potential; AP, t: Acidification potential, terrestrial; EP, t: Eutrophication potential, terrestrial; EP, fw: Eutrophication potential, freshwater; EP, m: Eutrophication potential, marine; ET, t: Ecotoxicity, terrestrial; ET, fw: Ecotoxicity, freshwater; ET, m: Ecotoxicity, marine; LU: Land use; WU: Water use; RU, f: Resource use, fossils; RU, m: Resource use, minerals and metal.
Energies 17 04461 g007aEnergies 17 04461 g007b
Figure 8. Contribution of components to the single-score results. Notes: CF: Collector field; HTF: Heat-transfer fluid; NG: Natural gas; PGU: Power-generation unit; RS: Receiver system; TES: Thermal-energy storage.
Energies 17 04461 g008
Table 1. Impact categories of PEF and ReCiPe method (authors’ compilation based on [15,26,27].
PEFReCiPe
Impact CategoryUnit of MeasureImpact CategoryUnit of Measure
Climate changekg CO2 eqClimate changekg CO2 eq
Ozone depletionkg CFC-11 eqOzone depletionkg CFC-11 eq
Human toxicity, cancerCTUhHuman toxicity, cancerkg 1,4 DCB
Human toxicity, non-cancerCTUhHuman toxicity, non-cancerkg 1,4 DCB
Particulate matterdisease incidenceFine-particulate matter formationkg PM2.5 eq
Ionizing radiation, human healthkBq U-235 eqIonizing radiationkBq Co-60 eq
Photochemical ozone formation, human healthkg NMVOC eqPhotochemical oxidant formation: human healthkg NOx eq
Photochemical oxidant formation, terrestrial ecosystemskg NOx eq
Acidificationmol H+ eqTerrestrial acidificationkg SO2 eq
Eutrophication, terrestrial mol N eq
Eutrophication, freshwaterkg P eqFreshwater eutrophicationkg P eq
Eutrophication, marinekg N eq
Terrestrial ecotoxicitykg 1,4 DCB eq
Ecotoxicity, freshwaterCTUeFreshwater ecotoxicitykg 1,4 DCB eq
Marine ecotoxicitykg 1,4 DCB eq
Land useptLand usem2 × yr annual cropland eq
Water usem3 world eqWater usem3 water eq consumed
Resource use, minerals and metalskg Sb eqMineral resource scarcitykg Cu eq
Resource use, fossilsMJFossil resource scarcitykg oil eq
Table 2. Normalization and weighting factors for Product Environmental Footprint [29].
Impact CategoryNormalization Factor (Unit of Measure per Person)Weighting Factor (%)
Climate change8.10 × 10321.06
Ozone depletion5.36 × 10−26.31
Human toxicity, cancer1.69 × 10−52.13
Human toxicity, non-cancer2.30 × 10−41.84
Particulate matter5.95 × 10−48.96
Ionizing radiation, human health4.22 × 1035.01
Photochemical ozone formation, human health4.06 × 1014.78
Acidification5.56 × 1016.2
Eutrophication, terrestrial1.77 × 1023.71
Eutrophication, freshwater1.61 × 1002.8
Eutrophication, marine1.95 × 1012.96
Ecotoxicity, freshwater4.27 × 1041.92
Land use8.19 × 1057.94
Water use1.15 × 1048.51
Resource use, minerals and metals6.36 × 10−27.55
Resource use, fossils6.50 × 1048.32
Table 3. Life-cycle impact assessment results of four CSP technologies, with PEF. Note: The green color indicates the low value, and the red color indicates the high value.
Impact CategoryUnitPTHSPTSSSTHSSTSSDifference between TechnologiesDifference between HTFs
Acidificationmol H+ eq3.58 × 10−43.50 × 10−42.77 × 10−42.76 × 10−428%1%
Global warming potentialkg CO2 eq8.36 × 10−28.26 × 10−27.53 × 10−27.46 × 10−211%1%
Ecotoxicity, freshwaterCTUe6.29 × 10−16.28 × 10−11.96 × 10−11.94 × 10−1222%0%
Particulate matter formationdisease inc.3.61 × 10−93.62 × 10−92.70 × 10−92.61 × 10−936%1%
Eutrophication, marinekg N eq9.24 × 10−59.31 × 10−54.37 × 10−54.40 × 10−5112%−1%
Eutrophication, freshwaterkg P eq1.28 × 10−51.25 × 10−51.07 × 10−51.09 × 10−517%0%
Eutrophication, terrestrialmol N eq9.97 × 10−49.61 × 10−44.89 × 10−44.79 × 10−4102%3%
Human toxicity, cancerCTUh1.08 × 10−101.07 × 10−101.11 × 10−101.11 × 10⁻¹⁰−3%0%
Human toxicity, non-cancerCTUh6.58 × 10−106.39 × 10−107.94 × 10−107.92 × 10⁻¹⁰−18%2%
Ionizing radiationkBq U-235 eq1.87 × 10−31.61 × 10−31.30 × 10−31.22 × 10−338%12%
Land usePt3.47 × 1003.43 × 1003.98 × 1003.97 × 100−13%1%
Ozone depletionkg CFC-11 eq3.80 × 10−93.76 × 10−92.69 × 10−92.68 × 10−941%1%
Photochemical oxidant formationkg NMVOC eq3.30 × 10−43.33 × 10−42.12 × 10−42.13 × 10−456%−1%
Resource use, fossilsMJ1.10 × 1001.10 × 1009.83 × 10−19.82 × 10−112%0%
Resource use, minerals and metalskg Sb eq4.57 × 10−74.26 × 10−74.14 × 10−74.05 × 10−78%5%
Water usem3 depriv.6.63 × 10−21.92 × 10−23.00 × 10−21.75 × 10−280%162%
Disclaimer/Publisher’s Note: The statements, opinions and data contained in all publications are solely those of the individual author(s) and contributor(s) and not of MDPI and/or the editor(s). MDPI and/or the editor(s) disclaim responsibility for any injury to people or property resulting from any ideas, methods, instructions or products referred to in the content.

