Article

Influence of Structural Parameters of Tesla Valve Flow Field on Performance of Fuel Cells

1
National Energy Key Laboratory for New Hydrogen-Ammonia Energy Technologies, Foshan Xianhu Laboratory, Foshan 528200, China
2
School of Automotive Engineering, Wuhan University of Technology, Wuhan 430070, China
*
Author to whom correspondence should be addressed.
Energies 2024, 17(17), 4442; https://doi.org/10.3390/en17174442
Submission received: 12 August 2024 / Revised: 23 August 2024 / Accepted: 29 August 2024 / Published: 4 September 2024
(This article belongs to the Section D: Energy Storage and Application)

Abstract

:
The optimization of flow channel structures significantly impacts the performance enhancement of proton exchange membrane fuel cells (PEMFCs). In this paper, the influences of the loop radius, inclination angle, and presence of the island in the Tesla valve flow field on the performance of a fuel cell were investigated numerically. The results indicated that increasing the inclination angle and curvature radius of the Tesla valve increased the voltage by 16.3% and 31.1%, respectively, compared to the parallel flow field at 0.8 A/cm2. Elevating the inclination angle amplified the resistance effect exerted by tributaries on the main stream, consequently fostering channel-to-membrane mass transfer. Increasing the curvature radius contributed to a heightened total oxygen concentration, but also led to water accumulation problems. The removal of islands increased the reactant contact area, but also created more dead zones, resulting in an observed improvement compared to the parallel flow field, but only marginal improvements over the basic Tesla flow field.

1. Introduction

As an efficient and environmentally friendly energy conversion device, fuel cells play a crucial role in sustainable energy systems. A reasonable flow channel design can promote the efficient distribution and transmission of hydrogen and oxygen, which can not only improve the utilization rate of reactants, but also reduce the energy loss and improve the power density and energy density of the system [1,2]. Therefore, the optimization of the fuel cell flow channel is of great significance in improving the power density and efficiency of fuel cells.
With the development of fuel cell flow field design, extensive research has been carried out [3,4,5]. The conventional parallel flow field (CPFF) and the conventional serpentine flow field (CSFF) are the cornerstones of flow field optimization. The flow channels of CPFF are arranged in parallel. Because the gas flow path is short, the hydrodynamic loss is small [6]. However, the gas distribution between each flow channel is uneven, resulting in a lower efficiency. The flow path arrangement of CSFF is a single or multiple flow path with multiple bends [7]. The gas flow path is long and has a high fluid shear force, which is conducive to the removal of water, but also causes a large pressure loss.
With the development of computational fluid dynamics (CFD), the fluid flow and heat transfer process in the flow channel have been simulated and analyzed more accurately, and more efficient flow channel structures have been designed. Liu et al. [8] proposed a novel method involving multiple levels of flow channel bifurcations to achieve a uniform distribution. This proposed flow distribution structure shows promise for enhancing the performance in fuel cells, reactors, and heat exchangers, particularly in laminar flow regimes. Singdeo et al. [9] introduced a novel flow field design for fuel cells, crucial for improving the reactant and product distribution on the electrode surface. They found that their proposed design demonstrated a superior current density uniformity, achieving a 27% increase in cell performance compared to CSFF. In more detail, the influences of the flow channel profile [10], channel aspect ratios [11], channel open porosity [12], and channel geometric dimension [13,14] have been investigated.
Further, a new research direction is focused on increasing the channel-to-membrane mass transfer, and many novel flow channels have been designed [15,16,17]. For example, the three-dimensional flow field represented by the Toyota Mirai has a current density 2.4 times that of other products [18]. Shen et al. [19] proposed an optimized three-dimensional (3D) flow field to enhance mass transfer and water removal capabilities. The results showed that the new flow field could enhance the capacity of mass transfer and drainage. Especially at a high current density, liquid water could be quickly separated from the reaction flow. However, the flow characteristics of 3D flow channels are more complex, and the interactions of fluid dynamics and other physical parameters require more computational resources, which increases the cost and complexity of simulations. As a result, they have been greatly hindered in commercial application.
Therefore, a simplified method is proposed to simplify the complexity of 3D flow channels. Adding a block or baffle can change the flow path and velocity direction of the fluid in the flow channel so that the two-dimensional flow channel adopts the local characteristics of the 3D flow channel [20,21,22]. Chen et al. [23] proposed orientated-type flow channels with streamline baffles containing porous blocks to mitigate the pumping power in proton exchange membrane fuel cells. Numerical simulations demonstrated an enhanced cell performance and liquid water distribution, with an increased water ejection in porous regions under inertial effects. Li et al. [24] investigated the impact of streamlined block modifications on the flow channel structure of proton exchange membrane fuel cells (PEMFCs), aiming to enhance their performance. The results showed that the optimized configuration with a 2 mm block spacing demonstrated a superior net power compared to basic straight and trapezoid channels, indicating an enhanced gas transfer capability and electrochemical reaction acceleration in the PEMFCs.
When developing new fuel cell flow plates, it is important to learn from the existing design concepts of a high efficiency and low resistance [25,26]. More efficient flow plates can be designed with improved gas distribution uniformity and water management by imitating the vascular structure of organisms or other biological fluid systems [27,28]. Bethapudi et al. [29] presented a novel lung-inspired cathode flow field for polymer electrolyte fuel cells, fabricated using low-cost printed circuit boards. A performance evaluation demonstrated a superior performance over conventional single-serpentine flow-fields, especially in low-relative-humidity air conditions, providing a more stable operation through uniform reactant distribution. Li et al. [30] explored the performance of bionic flow channels, inspired by the nautilus structure, in proton exchange membrane fuel cells. Their results showed that the nautilus bionic flow channel outperformed serpentine and honeycomb-like designs with a superior comprehensive performance, exhibiting a higher average molar oxygen concentration, better oxygen uniformity, and superior water removal capacity.
Specifically, the Tesla valve, devoid of moving components, relies solely on its spatial configuration to convert kinetic energy into pressure potential energy, rendering it a focal point of interest in the present investigation [31,32,33,34]. In the forward mode, the fluid is transferred directly to the outlet along the straight segment without passing through the loop. An enhanced fluid acceleration results from dynamic pressure buildup around the island structure. Conversely, during reverse flow, flow obstruction induces an increase in the pressure head, impeding the overall fluid progression. At present, the conversion of kinetic energy into pressure is observed. Gong et al. [35] investigated the impact of a Tesla valve flow field on the performance of PEMFCs, examining both forward and reverse flow characteristics through numerical simulation and experimental analysis. Their results showed significant differences in the velocity, pressure distribution, and oxygen mass fraction between forward and reverse flow in the multi-stage Tesla valve design. Guo et al. [36] explored the impact of symmetric Tesla valve and asymmetric Tesla valve configurations on PEMFC performance. Numerical analysis revealed that the reversed asymmetric Tesla valve exhibited a 10.08% increase in maximum power density compared to the conventional straight channel, which can be attributed to its more intense flow.
The current research mainly focuses on heat transfer and the “fluid diode” effect [37,38]. The Tesla valve structure helps to improve its heat transfer coefficient and critical heat flux [37], which helps to regulate the internal temperature of the fuel cell. The “fluid diode” effect leads to a sharp increase in pressure drop, which helps to accelerate mass transfer [38]. Utilizing the fundamental principles of Tesla valve structure design to optimize flow channels can significantly improve fuel cell performance and has been demonstrated in previous studies [35,36]. However, these studies mostly isolate the impact of single parameters on performance, lacking a systematic analysis of how different parameter combinations affect overall performance. The Tesla valve structure embodies a series of design parameters, and changes in these parameters significantly influence its flow field characteristics. This lack of a comprehensive analysis limits the optimized application of Tesla valves under complex fuel cell operating conditions. Hence, it is imperative to individually scrutinize the impact of each parameter to ascertain the optimal configuration for performance enhancement. Consequently, this knowledge gap has spurred the advancement of the present study.
In this paper, the influences of the loop radius, inclination angle, and existence of the island on the performance of the fuel cell are considered. A three-dimensional, two-phase, single-channel model is constructed for numerical calculation. Polarization curves are used to evaluate the performance of fuel cells. Pressure and velocity characteristics are extracted to describe the flow field characteristics in the channel. Reactant concentration distributions and standard deviations are used to evaluate the mass transfer effect.

2. Numerical Simulation

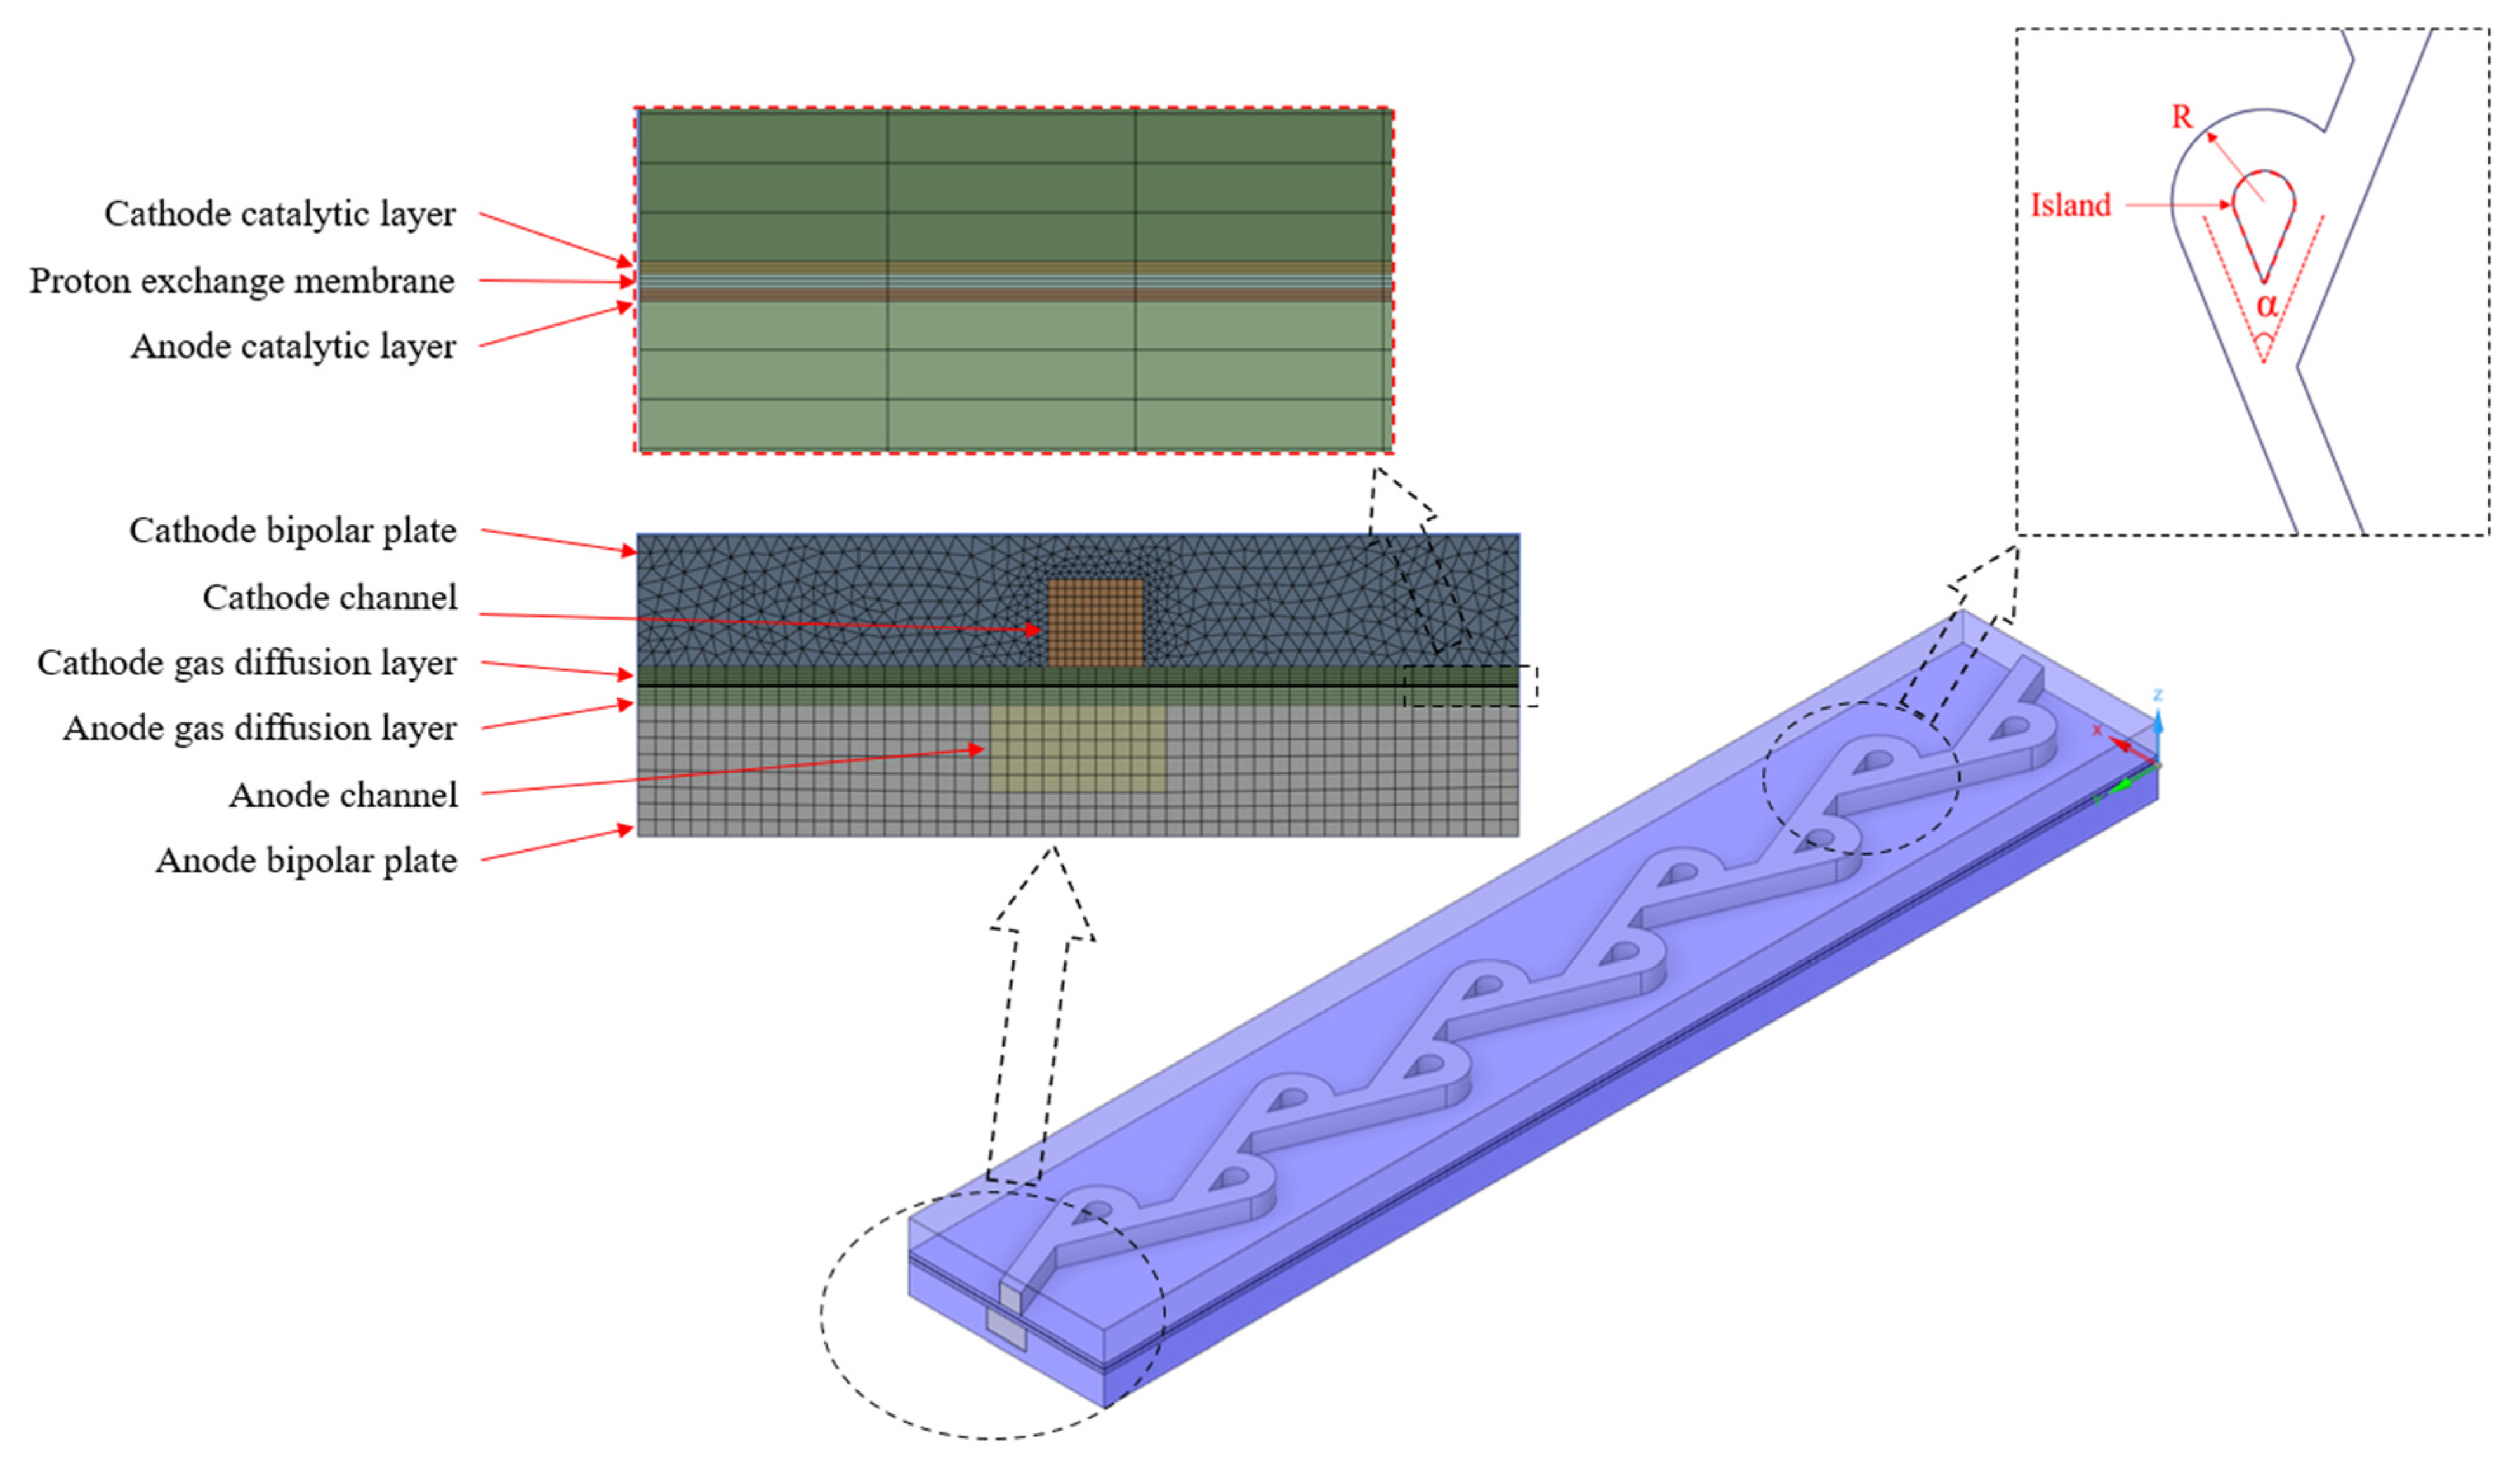
2.1. Computational Geometry and Grid

A comparation of the effect of cathode channels with a Tesla valve type and a straight type on PEMFC performance was investigated. The geometric models with a Tesla valve structure and the computational grids are shown in Figure 1. An active area of 5.4 cm2 of a PEMFC was used as the computational domain, including bipolar plates (BPs), channels, gas diffusion layers (GDLs), catalytic layers (CLs), and the membranes of both the anode side and cathode side. Specific geometric parameters are shown in Table 1. In order to simplify the calculation time and strengthen the calculation accuracy, the computational domain was a structured grid, except the cathode BP. Due to the intricate boundaries of the Tesla valve flow channel, grid refinement was implemented. The grid for the cathode BP was unstructured, as it shared boundary surfaces with the cathode channel.
In order to verify the effects of the geometric parameters of the Tesla valve structure on the fuel cell performance, different angles of inclination (α), radiuses of loop (R), and the presence of islands were studied. The positions to which the parameters refer can be found in Figure 1. Table 2 lists the relationships between the serial numbers and geometric parameters. The serial numbers of T1, T2, and T3 compared the effects of different inclination angles on the PEMFC performance. The serial numbers of T1, T4, and T5 focused on the effects of different loop radiuses. The areas of the channel with or without the island were calculated and are shown in Table 2, and the ratios of the channel area changes are shown in the last column. The area of the island was positively correlated with the loop radius. Therefore, the channel area could be increased more when the island was removed for the larger loop radius. The serial numbers of T1, T4, and T5 were used for investigating the effect of the existence of islands on the PEMFC performance. It can be seen that the channel area increased by 48% when the island was removed for T5.
The special structure of the Tesla valve causes the forward flow and reverse flow to have different flow field characteristics [36]. Therefore, different flow patterns were also studied. In general, the reverse flow mode has a higher pressure drop. The flow direction of tributaries is turned against the direction of the main flow when passing through the loop, which causes the kinetic energy to be converted into pressure, while in the forward flow mode, tributaries can promote the flow of the main stream. The tributary of the fluid passes through the island structure and converts the pressure into kinetic energy.
In the present work, the flow mode was added after the serial number in abbreviated form. For example, the forward flow for T1 was named T1_F, and the reverse flow for T2 was named T2_R. The channel without the island for T5_F was named T5_F_non.

2.2. Model Assumption and Numerical Approach

The operating conditions of the experiment are complex, and multi-physical parameters are coupled. In order to simplify the calculation model, the following assumptions are proposed.
  • The reactant gases are assumed to be ideal gases.
  • The fluid flow is assumed to be laminar.
  • The effects of gravity and contact resistance are ignored.
  • The Butler–Volmer equation is employed to solve the electrochemical reactions.
  • The temperature in the surface boundary is set as constant.
  • The materials of the GDL and CL are assumed to be homogeneous and isotropic.
The built-in PEMFC module of ANSYS Fluent 2023 R2 was applied to solve fuel cell problems, and the detailed governing equations are described below:
Mass conservation [39,40,41,42]:
ρ t + · ρ v = S i
where ρ is the average density, S i is the source term, and the subscript i represents different species.
The specific source term S i for flow is [39,40,41,42]:
S H 2 = M w , H 2 2 F R a n
S O 2 = M w , O 2 4 F R c a t
S H 2 O = M w , H 2 O 2 F R c a t
where M w is the molecular mass, R a n is the volumetric transfer current of the anode, and R c a t is the volumetric transfer current of the cathode.
Momentum conservation [39,40,41,42]:
t ρ v + · ρ v v = p + · τ ̿ + ρ g + F
where p is the pressure, ρ g is the gravitational body force, F is the external body force, and τ ̿ is the stress tensor.
τ ̿ = μ v + v T 2 3 · v I
where μ is molecular viscosity and I is the unit tensor.
Energy conservation [39,40,41,42]:
t ρ e + v 2 2 + ρ v h + v 2 2 = · k e f f T j h j J j + τ ̿ e f f · v + S h
where k e f f is the effective conductivity, J j is the diffusion flux of species, S h is the heat source, and h is the enthalpy.
Volumetric heat sources S h have different calculation equations in various zones [39,40,41,42]:
i s 2 / σ s o l S g l · L   ( in GDL )
R a n η a n T S a n / 2 F + i s 2 / σ s o l + i m 2 / σ m e m S d l + S g l · L   ( anode CL )
R c a t η c a t T S c a t / 2 F + i s 2 / σ s o l + i m 2 / σ m e m S d l + S g l · L   ( cathode CL )
i m 2 / σ m e m   ( membrane )
i s 2 / σ s o l   ( current collector )
Current conservation [39,40,41,42]:
a n o d e R a n d V = c a t h o d e R c a t d V
where R is the volumetric transfer current, which is calculated by the Butler–Volmer function:
R a n = ζ a n j a n r e f A A r e f γ a n e α a n F η a n / R T e α c a t F η a n / R T
R c a t = ζ c a t j c a t r e f C C r e f γ c a t e + α a n F η c a t / R T + e α c a t F η c a t / R T
where j r e f is the reference exchange current density per active surface area, ζ is the specific active surface area,   r e f is the reference local species concentration, γ is the concentration dependence, α is the transfer coefficient, η is the gain of the electrical potential, and F is the Faraday constant.
Electrochemical equations [39,40,41,42]:
· σ s o l ϕ s o l + R s o l = 0
· σ m e m ϕ m e m + R m e m = 0
where σ is the electrical conductivities and ϕ is the electric potential
Surface overpotential [39,40,41,42]:
η a n = ϕ s o l ϕ m e m U a n 0
η c a t = ϕ s o l ϕ m e m U c a t 0
The half-cell potentials [39,40,41,42]:
U a n 0 = E a n 0 Δ S a n 2 F T T 0 R T 2 F l n ( p H 2 p 0 )
U c a t 0 = E c a t 0 + Δ S a n 2 F T T 0 R T 2 F l n ( p H 2 o p s a t p O 2 / p 0 )
where p s a t is the water saturation pressure and p H 2 , p O 2 , and p H 2 o are the partial pressures of hydrogen, oxygen, and water vapor, respectively.
The dissolved phase is given by [39,40,41,42]:
t ε i M w , H 2 O ρ i E W λ + · i m n d F M w = · M w D w i λ + S H 2 O + S g d + S l d
where ε i is the porosity of porous media, i m is the ionic current density, λ is the dissolved water content, n d is the osmotic drag coefficient, and D w i is the diffusion coefficient of water content.
n d = n o s m g λ = n o s m 2.5   λ 22
The saturation pressure is expressed as [39,40,41,42]:
l o g 10 P s a t = 2.1794 + 0.02953 T 273.17 9.1837 × 10 5 T 273.17 2 + 1.4454 × 10 7 T 273.17 3
The source term S g d is the mass change rate between the gas and dissolved phases, which is given by:
S g d = 1 s θ γ g d M w , H 2 O ρ i E W λ e q λ
The source term S l d is the mass change rate between the liquid and dissolved phases, which is given by:
S l d = s θ γ l d M w , H 2 O ρ i E W λ e q λ
where E W is the equivalent weight of the membrane, λ e q is the equilibrium water content, and γ is the mass exchange rate constant.
λ e q = 0.3 + 6 a 1 tanh a 0.5 + 0.69 λ a = 1 3.52 a 0.5 1 + tanh a 0.89 0.23 + s ( λ s = 1 λ a = 1 )
a = P w v / P s a t
Liquid water transport [39,40,41,42]:
t ε i ρ l s = · ρ l K K r μ l p l + S g l S l d
where ρ l is the liquid water density, μ l is the liquid water viscosity, K is the absolute permeability, K r is the relative absolute permeability, and p l is the liquid pressure.
K r = ( M w , H 2 O ρ l λ s = 1 + E W ρ i M w , H 2 O ρ l λ + E W ρ i · λ λ s = 1 ) 2
The source term S g l is the mass transfer rate between the gas and the liquid:
γ e ε s D g l M H 2 O R T p ln p p s a t p p w v ( p w v < = p s a t )
γ c ε 1 s D g l M H 2 O R T p ln p p s a t p p w v ( p w v > p s a t )
D g l = 0.365 · 10 4 T 343 2.334 · ( 10 5 p )   ( cathode )
D g l = 1.79 · 10 4 T 343 2.334 · ( 10 5 p )   ( anode )
where ε is the porosity, γ e is the evaporation rate coefficient, and γ c is the is the condensation rate coefficient.
Leverett function [39,40,41,42]:
p c = σ | c o s   θ c | ε L J ( s )
J s = a x b x 2 + c x 3
where σ is the surface tension, θ c is the contact angle, and a ,   b ,   a n d   c are Leverett function coefficients, which can be found in Table 3.
The physical properties and the boundary conditions are shown in Table 3.

2.3. Model Validation and Grid Independence Analysis

The numerical model developed in this study was validated through comparison with experimental data obtained by Islam et al. [45]. As can be seen in Figure 2, the simulated polarization curves exhibited excellent agreement with the experimental data across a range of current densities, indicating the robust predictive capabilities of the numerical model. The maximum error was 3.96% between the model and the reference.
The grid independence of the numerical simulations was systematically assessed to ensure the reliability and accuracy of the computational results. As shown in Table 4, a series of simulations were conducted using different element numbers at a current density of 0.4 A/cm2. It can be seen that the voltage deviation was very small under different grid numbers. Therefore, it is considered that the numerical simulation results are reliable and have a good robustness.

3. Results and Discussion

3.1. The Effect of Loop Inclination Angles on the PEMFC Performance

Due to the presence of the island, the main flow was bifurcated into two branches, traversing both the straight segment and the loop segment, respectively. The greater the inclination, the higher the volume of fluid entering into the loop segment. As air flowed through the island, its exit direction opposed that of the through channel, resulting in an increased pressure drop caused by resistance flow. The loop inclination angle can significantly affect the flow characteristics. Therefore, it is necessary to investigate the effect of the loop inclination angles on the PEMFC performance.
Figure 3a shows the polarization curve with a different inclination angle of the Tesla valve structure. The inclination angle gradually decreased from 77.32° (T1) to 43.6° (T3). It can be seen that the total performance of the fuel cell with the Tesla structure could be significantly improved compared with that of a parallel channel. The voltage of T1 increased by 16.3% compared to that of a parallel channel and increased by 3.3% compared to that of T3 at 0.8 A/cm2. In addition, the performance of the reverse flow mode was better than that of forward flow. The voltage of the reverse mode of T1 increased by 3.6% compared to that of the forward mode at 0.8 A/cm2.
Figure 3b compares the pressure drops with different inclination angles. It can be seen that, the greater the inclination, the greater the pressure drop. The pressure drop of T1_R increased by 33.3% compared to that of T3_R. The channel length and the radius of curvature changed slightly as the inclination angle was altered. Therefore, it can be assumed that there was no increase in on-way resistance. This indicates that the change in pressure drop was only related to the inclination angle. In addition, the reverse mode produced a greater pressure drop than that of the forward mode, which is consistent with the theory mentioned above. The pressure differential propels gases or liquids through the flow channels, which is crucial for the overall performance of fuel cells. In the Tesla valve structure, the emergence of vortex structures at the branch locations is the primary cause of an increased pressure drop [38]. Additionally, reverse flow is more prone to forming vortex structures compared to forward flow. This leads to energy dissipation in the cross-section of the branch during reverse flow, resulting in a better “fluid diode” effect and a higher pressure drop compared to forward flow. A higher pressure drop facilitates channel-to-membrane mass transfer, which helps to reduce mass transfer losses. In the polarization curve, the voltage presented a higher value in the region of a high current density.
Figure 4 shows the distribution of velocity and the mass fraction of O2 in the middle plane of the cathode channel. It can be seen that the air flow was divided into two branches by the island, and more oxygen was carried through the loop segment in the reverse mode. In the reverse mode (Figure 4a,b), one of the tributaries entered the loop with a larger velocity component, and oxygen was effectively replenished. In the forward mode (Figure 4c,d), the main flow was concentrated in the straight segment. The velocity component through the loop segment was small, forming a dead zone. This resulted in insufficient local oxygen and performance degradation of the fuel cell. The magnitude of the velocity component in two branches was calculated, as shown in Figure 4e. The velocity magnitude gradually increased when the inclination angle was enlarged, which was benefitted by the gain of a higher pressure drop. It was very obvious that the velocity magnitude in the straight channel increased significantly in the forward mode. The velocity for T1_F could reach 5.34 m/s in the straight segment, which was 2.8 times that in the loop segment.
The concentrations of oxygen and water are direct reflections of the effect of mass transport. Figure 5 shows the distribution of the mass fractions of H2O and O2 in the interface of GDL/CL at 0.8 A/cm2. It can be seen that the difference in water distribution was small with a change in the inclination angle (Figure 5a). With an increase in the inclination angle, the channel was closer to the wall, which aggravated the viscous effect of the wall. Water was concentrated in narrow areas, but the face average mass fraction remained within a closer range. The face average mass fraction of water was about 0.025 at different inclination angles, but the standard deviation of the water distribution of T1_R increased by 21% compared to that of T3_R.
The oxygen distribution is shown in Figure 5b. It can be seen that there was a higher concentration of oxygen downstream of the channel in T1_R, contrasting T3_R. The face average oxygen fraction of T1_R increased by 17.4%. This indicates that an increase in the inclination angle was beneficial for oxygen transfer. In the forward mode, the oxygen was concentrated in the straight channel segment. The average mass fraction of oxygen was about 0.0597. In the reverse mode, there was more oxygen replenishment inside the loop, and the oxygen mass fraction increased by 14.8% compared to that of the forward mode. Therefore, the efficiency of the reverse mode was higher than that of the forward mode at the same current density.

3.2. The Effect of Loop Radius on the PEMFC Performance

In the case of the same inclination angle, an increase in the loop radius resulted in an enlargement of the flow length and channel area. The loop radius increased from 1.5 mm (T1) to 2.5 mm (T5), while the channel area increased by 47.7%. This increase in the channel area helped to increase the reactant contact area. More reactants could be transferred to the reaction interface to enhance the fuel cell performance.
Figure 6a,b show the polarization curves and pressure drops of different loop radiuses of the Tesla valve. The relationship between the channel area variation and current density changes can also be observed (Figure 6c). It can be seen that, as the loop radius augmented, the voltage of the fuel cell stepwise increased (Figure 6a). The voltage increase was more significant in the high-electrical-density region, indicating better oxygen transmission. The voltage of T5 increased by 31.1% compared to that of the parallel flow field at 0.8 A/cm2, while the voltage increased by 12.6% compared to T1. Moreover, the voltage of the reverse mode was obviously higher than that of the forward mode, which was related to the structure characteristic of the Tesla valve.
The relationship between the pressure drop and loop radius is shown in Figure 6b. It can be seen that, with an increase in the loop radius, the pressure drop decreased slightly. The pressure drop of the reverse mode was higher than that of the forward mode. An enlargement of the curvature radius helped to reduce the vortex and the centrifugal force when the fluid was diverted, which could alleviate the pressure loss. But the pressure drop reduction was slight, indicating that the pressure drop changes were not the key factor in the performance improvement.
Further research found that there was a linear relationship between the channel area variation and the current density changes (Figure 6c). An increase in the channel area was positively correlated with the promotion of the current density, which was associated with an improvement in the reactant concentration. When the channel area was increased by 47.6%, the performance of the fuel cell was improved by 12.7%. Therefore, the increase in the reactant concentration caused by the increase in the loop radius was considered to be the crucial factor in the performance enhancement.
Figure 7 shows the distribution of the velocity and mass fractions of O2 of different loop radiuses in the middle plane of the cathode channel. It can be seen that the flow length of the tributary that passed through the loop segment was significantly elongated when the loop radius increased from 1.5 mm (T1) to 2.5 mm (T5). This increase in the curvature radius helped to reduce the secondary flow resistance. The increase in the loop radius helped to increase the total oxygen concentration. Figure 7e calculates the average velocity in the straight segment and loop segment. The velocity in the loop segment increased from 3.26 m/s to 3.46 m/s with the radius expended in the reverse mode. For the forward mode, an enlargement in the radius increased the area of the dead zone. Therefore, the velocity through the loop was greatly reduced.
Figure 8 shows the distribution of the mass fractions of H2O and O2 at the GDL/CL interfaces of different loop radiuses at 0.8 A/cm2. For the distribution of H2O, an enlargement in the radius led to more aggregation near the wall. An increase in the island area was also detrimental to the discharge of water below the island. The standard deviation of H2O distribution increased from 0.0275 to 0.0363 with the radius increase, which indicated a more serious accumulation of water. But the average mass fraction did not rise, although the current density was significantly enhanced, remaining at 0.25. The results indicated that an increase in the radius helped to improve the drainage performance, but also led to water accumulation in the case of an intensified electrochemical reaction.
Figure 8b shows the distribution of the mass fraction of O2. It can be seen that the distribution area of oxygen was larger for T1 compared to T5. The average mass fraction of oxygen nearly doubled from 0.0686 to 0.123 in the reverse mode. An increase in the channel area promoted a substantial increase in the oxygen concentration, which was a key factor in improving the PEMFC efficiency.

3.3. The Effect of Island Removal on the PEMFC Performance

Removing the island can significantly increase the contact area of the channel and GDL without changing the geometrical configuration feature of the Tesla valve, which, in theory, helps to improve the efficiency of the fuel cell. The increase in area is proportional to the radius of the island. When the loop radius was 2.5 mm (T5), the removal of the roundabout could increase the channel area by 48.49%. In this section, the effect of island removal on the fuel cell efficiency was investigated.
Figure 9a,b present the results of the polarization curves and pressure drops in the presence or absence of islands. It can be seen that the removal of the island caused a slight increase in the voltage of the fuel cell in the reverse mode. The voltage only increased from 0.5066 to 0.51 V when the current density was 1 A/cm2. But for the forward mode, the removal of the roundabout had a tendency to deteriorate the fuel cell performance. When the large area of the island was removed, the degradation degree of the voltage was more obvious (Figure 9a, line T5_F and line T5_non_F).
Figure 9b shows the pressure drop change with or without the island. It can be seen that the removal of the island could significantly increase the pressure drop. The growth rate became dramatic as the island area increased. The pressure drop increased by 19.96% when the island was removed of T5. The results indicated that the flow characteristics became worse and the resistance along the flow path increased.
Figure 9c presents the relationship of the channel area variation and current density changes. An increase in the channel area greatly increased the reactant contact area, but the current density did not increase. This indicated that, although the concentration of reactant in the channel increased, the mass transfer capacity became worse, counteracting the positive effect of the concentration increase. The results also corresponded with the polarization curve showing that the removal of the island did not improve the fuel cell performance.
Figure 10 shows the distribution of the velocity and mass fraction of O2 in the presence or absence of islands at a radius of 2.5 mm (T5). The display plane was the middle plane of the cathode channel. In the presence of the island, the main stream split into two branches in the reverse mode, with one tributary directly flowing to the outlet through a straight section. However, upon the removal of the island, all of the fluid flowed into the loop, increasing the linear loss and flow length, resulting in a higher pressure drop along the path (Figure 10b). Additionally, a vortex was generated inside the loop, and regions with a low oxygen concentration were formed near the straight segment, which was detrimental to the fuel cell performance. In the forward mode, the removal of the island did not change the direction of the flow, but created a larger dead zone (Figure 10d). The area of the dead zone was proportional to the area of the island, which was not conducive to mass transfer.
Figure 11 shows the distribution of the mass fractions of H2O and O2 in the presence or absence of islands at the GDL/CL interface at 0.8 A/cm2. It can be seen that the removal of the island helped to enhance the mass transfer in the GDL opposite the island. The concentration of water was mitigated and the concentration of oxygen was enhanced, with thus enhancement effect being positively related to the area of the island. However, the increase in the average mass fraction was slight, and the mass transfer effect was poor when the island was removed. The average mass fraction of oxygen increased from 0.1231 to 0.1377, and that for water decreased from 0.2506 to 0.2422. Although the removal of larger islands helped to increase the reactant contact area, the mass transfer effect in the loop deteriorated due to the enlargement of the dead zone. This resulted in a small overall performance improvement and even a tendency to deteriorate in the forward flow mode.

4. Conclusions

In this work, the influence of the structural parameters of a Tesla valve flow field on the performance of fuel cells was investigated. The impacts of the loop radius, inclination angle, and the existence of the island on the polarization curves, flow field characteristics, and reactant distribution were studied separately. The main conclusions were as follows.
(1) The larger the inclination angle, the more obvious the resistance effect of the tributary flowing through the loop to the main stream. The aggrandizement in pressure drop facilitated channel-to-membrane mass transfer, which helped to reduce mass transfer losses. Additionally, the efficiency of the reverse mode was higher than that of the forward mode when PEMFCs operated in the same conditions, which is related to the emergence of vortex structures at the branch locations.
(2) There was a linear relationship between the improvement rate of the fuel cell performance and the increase in the loop radius. A larger loop radius increased the reactant contact area, thus improving the total concentration of oxygen. In addition, an increase in the loop radius also helped to improve the drainage performance, despite the increase in water accumulation near the wall.
(3) The removal of islands increased the reactant contact area, but did not obviously increase the reactant concentration at the electrochemical reaction interface. A larger dead zone formed when the island was removed, worsening the mass transfer in the channel to membrane direction and the water discharge. As a result, the performance did not obviously improve, and even showed a tendency to decline.

Author Contributions

Conceptualization, H.G. and C.X.; methodology, H.G., C.X. and L.W.; software, H.G., C.X. and S.Y.; validation, H.G., C.X., Y.P., W.X. and S.Y.; formal analysis, H.G. and C.X.; investigation, H.G., Y.P., W.X., S.Y. and L.W.; resources, S.T. and L.W.; data curation, H.G. and C.X.; writing—original draft preparation, H.G.; writing—review and editing, H.G., C.X. and L.W.; visualization, H.G.; supervision, S.T. and L.W.; project administration, S.T. and L.W.; funding acquisition, S.T. All authors have read and agreed to the published version of the manuscript.

Funding

This research was funded by “Guangxi Science and Technology, grant number AA22068063” and “Guangxi Science and Technology, grant number AA23062001”.

Data Availability Statement

Data will be made available on request due to the original contributions presented in the study are included in the article, further inquiries can be directed to the corresponding author.

Conflicts of Interest

The authors declare no conflicts of interest.

References

  1. Liu, Q.; Lan, F.; Zeng, C.; Chen, J.; Wang, J. A review of proton exchange membrane fuel cell’s bipolar plate design and fabrication process. J. Power Sources 2022, 538, 231543. [Google Scholar] [CrossRef]
  2. Zhou, Y.; Chen, B. Investigation of optimization and evaluation criteria for flow field in proton exchange membrane fuel cell: A critical review. Renew. Sustain. Energy Rev. 2023, 185, 113584. [Google Scholar] [CrossRef]
  3. Li, Y.; Chen, H.; Lu, C.; Zhou, H.; Liu, Z.; Chen, B. Multi-objective optimization design of a planar membrane humidifier based on NSGA-II and entropy weight TOPSIS. J. Therm. Anal. Calorim. 2023, 148, 7147–7161. [Google Scholar] [CrossRef]
  4. Chandan, A.; Hattenberger, M.; El-Kharouf, A.; Du, S.; Dhir, A.; Self, V.; Bujalski, W. High temperature (HT) polymer electrolyte membrane fuel cells (PEMFC)–A review. J. Power Sources 2013, 231, 264–278. [Google Scholar] [CrossRef]
  5. Yang, Z.; Jiao, K.; Wu, K.; Shi, W.; Jiang, S.; Zhang, L. Numerical investigations of assisted heating cold start strategies for proton exchange membrane fuel cell systems. Energy 2021, 222, 119910. [Google Scholar] [CrossRef]
  6. Zhang, X.; Ma, X.; Yang, J.; Zhu, X.; Tai, S.; Shuai, S. Effect of liquid water in flow channel on proton exchange membrane fuel cell: Focusing on flow pattern. Energy Convers. Manag. 2022, 258, 115528. [Google Scholar] [CrossRef]
  7. Min, C.; He, J.; Wang, K.; Xie, L.; Yang, X. A comprehensive analysis of secondary flow effects on the performance of PEMFCs with modified serpentine flow fields. Energy Convers. Manag. 2019, 180, 1217–1224. [Google Scholar] [CrossRef]
  8. Liu, H.; Li, P.; Van Lew, J. CFD study on flow distribution uniformity in fuel distributors having multiple structural bifurcations of flow channels. Int. J. Hydrogen Energy 2010, 35, 9186–9198. [Google Scholar] [CrossRef]
  9. Singdeo, D.; Dey, T.; Gaikwad, S.; Andreasen, S.J.; Ghosh, P.C. A new modified-serpentine flow field for application in high temperature polymer electrolyte fuel cell. Appl. Energy 2017, 195, 13–22. [Google Scholar] [CrossRef]
  10. Liu, Z.; Zeng, X.; Ge, Y.; Shen, J.; Liu, W. Multi-objective optimization of operating conditions and channel structure for a proton exchange membrane fuel cell. Int. J. Heat Mass Transf. 2017, 111, 289–298. [Google Scholar] [CrossRef]
  11. Wang, X.D.; Duan, Y.Y.; Yan, W.M.; Lee, D.J.; Su, A.; Chi, P.H. Channel aspect ratio effect for serpentine proton exchange membrane fuel cell: Role of sub-rib convection. J. Power Sources 2009, 193, 684–690. [Google Scholar] [CrossRef]
  12. Xia, Z.; Chen, H.; Zhang, T.; Pei, P. Effect of channel-rib width ratio and relative humidity on performance of a single serpentine PEMFC based on electrochemical impedance spectroscopy. Int. J. Hydrogen Energy 2022, 47, 13076–13086. [Google Scholar] [CrossRef]
  13. Lim, B.H.; Majlan, E.H.; Daud, W.R.W.; Rosli, M.I.; Husaini, T. Numerical analysis of modified parallel flow field designs for fuel cells. Int. J. Hydrogen Energy 2017, 42, 9210–9218. [Google Scholar] [CrossRef]
  14. Manso, A.P.; Marzo, F.F.; Barranco, J.; Garikano, X.; Mujika, M.G. Influence of geometric parameters of the flow fields on the performance of a PEM fuel cell. A review. Int. J. Hydrogen Energy 2012, 37, 15256–15287. [Google Scholar] [CrossRef]
  15. Yu, Z.; Xia, L.; Xu, G.; Wang, C.; Wang, D. Improvement of the three-dimensional fine-mesh flow field of proton exchange membrane fuel cell (PEMFC) using CFD modeling, artificial neural network and genetic algorithm. Int. J. Hydrogen Energy 2022, 47, 35038–35054. [Google Scholar] [CrossRef]
  16. Han, S.H.; Choi, N.H.; Choi, Y.D. Simulation and experimental analysis on the performance of PEM fuel cell by the wave-like surface design at the cathode channel. Int. J. Hydrogen Energy 2014, 39, 2628–2638. [Google Scholar] [CrossRef]
  17. Mojica, F.; Rahman, M.A.; Sarker, M.; Hussey, D.S.; Jacobson, D.L.; LaManna, J.M.; Chuang, P.Y.A. Study of converging-diverging channel induced convective mass transport in a proton exchange membrane fuel cell. Energy Convers. Manag. 2021, 237, 114095. [Google Scholar] [CrossRef]
  18. Yoshida, T.; Kojima, K. Toyota MIRAI fuel cell vehicle and progress toward a future hydrogen society. Electrochem. Soc. Interface 2015, 24, 45. [Google Scholar] [CrossRef]
  19. Shen, J.; Tu, Z.; Chan, S.H. Performance enhancement in a proton exchange membrane fuel cell with a novel 3D flow field. Appl. Therm. Eng. 2020, 164, 114464. [Google Scholar] [CrossRef]
  20. Wu, H.W.; Shih, G.J.; Chen, Y.B. Effect of operational parameters on transport and performance of a PEM fuel cell with the best protrusive gas diffusion layer arrangement. Appl. Energy 2018, 220, 47–58. [Google Scholar] [CrossRef]
  21. Wang, B.; Chen, W.; Pan, F.; Wu, S.; Zhang, G.; Park, J.W.; Xie, B.; Yin, Y.; Jiao, K. A dot matrix and sloping baffle cathode flow field of proton exchange membrane fuel cell. J. Power Sources 2019, 434, 226741. [Google Scholar] [CrossRef]
  22. Heidary, H.; Kermani, M.J.; Prasad, A.K.; Advani, S.G.; Dabir, B. Numerical modelling of in-line and staggered blockages in parallel flowfield channels of PEM fuel cells. Int. J. Hydrogen Energy 2017, 42, 2265–2277. [Google Scholar] [CrossRef]
  23. Chen, H.; Guo, H.; Ye, F.; Ma, C.F. A numerical study of orientated-type flow channels with porous-blocked baffles of proton exchange membrane fuel cells. Int. J. Hydrogen Energy 2021, 46, 29443–29458. [Google Scholar] [CrossRef]
  24. Li, H.W.; Liu, J.N.; Yang, Y.; Fan, W.; Lu, G.L. Research on mass transport characteristics and net power performance under different flow channel streamlined imitated water-drop block arrangements for proton exchange membrane fuel cell. Energy 2022, 251, 123983. [Google Scholar] [CrossRef]
  25. Roshandel, R.; Arbabi, F.; Moghaddam, G.K. Simulation of an innovative flow-field design based on a bio inspired pattern for PEM fuel cells. Renew. Energy 2012, 41, 86–95. [Google Scholar] [CrossRef]
  26. Liu, S.; Chen, T.; Xie, Y.; Zhang, J.; Wu, C. Numerical simulation and experimental study on the effect of symmetric and asymmetric bionic flow channels on PEMFC performance under gravity. Int. J. Hydrogen Energy 2019, 44, 29618–29630. [Google Scholar] [CrossRef]
  27. Kang, H.C.; Jum, K.M.; Sohn, Y.J. Performance of unit PEM fuel cells with a leaf-vein-simulating flow field-patterned bipolar plate. Int. J. Hydrogen Energy 2019, 44, 24036–24042. [Google Scholar] [CrossRef]
  28. Guo, N.; Leu, M.C.; Koylu, U.O. Bio-inspired flow field designs for polymer electrolyte membrane fuel cells. Int. J. Hydrogen Energy 2014, 39, 21185–21195. [Google Scholar] [CrossRef]
  29. Bethapudi, V.S.; Hack, J.; Trogadas, P.; Cho, J.I.S.; Rasha, L.; Hinds, G.; Coppens, M.O. A lung-inspired printed circuit board polymer electrolyte fuel cell. Energy Convers. Manag. 2019, 202, 112198. [Google Scholar] [CrossRef]
  30. Li, N.; Wang, W.; Xu, R.; Zhang, J.; Xu, H. Design of a novel nautilus bionic flow field for proton exchange membrane fuel cell by analyzing performance. Int. J. Heat Mass Transf. 2023, 200, 123517. [Google Scholar] [CrossRef]
  31. Monika, K.; Chakraborty, C.; Roy, S.; Sujith, R.; Datta, S.P. A numerical analysis on multi-stage Tesla valve based cold plate for cooling of pouch type Li-ion batteries. Int. J. Heat Mass Transf. 2021, 177, 121560. [Google Scholar] [CrossRef]
  32. Qian, J.Y.; Chen, M.R.; Gao, Z.X.; Jin, Z.J. Mach number and energy loss analysis inside multi-stage Tesla valves for hydrogen decompression. Energy 2019, 179, 647–654. [Google Scholar] [CrossRef]
  33. Thompson, S.M.; Paudel, B.J.; Jamal, T.; Walters, D.K. Numerical investigation of multistaged tesla valves. J. Fluid Eng. 2014, 136, 081102. [Google Scholar] [CrossRef]
  34. Bao, Y.; Wang, H. Numerical study on flow and heat transfer characteristics of a novel Tesla valve with improved evaluation method. Int. J. Heat Mass Transf. 2022, 187, 122540. [Google Scholar] [CrossRef]
  35. Gong, F.; Yang, X.; Zhang, X.; Mao, Z.; Gao, W.; Wang, C. The study of Tesla valve flow field on the net power of proton exchange membrane fuel cell. Appl. Energy 2023, 329, 120276. [Google Scholar] [CrossRef]
  36. Guo, H.; Tian, S.; Wang, L.; Xiao, C.; Yang, S. Numerical study of Tesla valve flow field on proton exchange membrane fuel cell performance. Int. J. Hydrogen Energy 2024, 50 Pt C, 1573–1583. [Google Scholar] [CrossRef]
  37. Li, W.; Yang, S.; Chen, Y.; Li, C.; Wang, Z. Tesla valves and capillary structures-activated thermal regulator. Nat. Commun. 2023, 14, 3996. [Google Scholar] [CrossRef] [PubMed]
  38. Liu, Z.; Shao, W.Q.; Sun, Y.; Sun, B.H. Scaling law of the one-direction flow characteristics of symmetric Tesla valve. Eng. Appl. Comput. Fluid Mech. 2022, 16, 441–452. [Google Scholar] [CrossRef]
  39. Kulikovsky, A.A.; Divisek, J.; Kornyshev, A.A. Modeling the cathode compartment of polymer electrolyte fuel cells: Dead and active reaction zones. J. Electrochem. Soc. 1999, 146, 3981. [Google Scholar] [CrossRef]
  40. Springer, T.E.; Zawodzinski, T.A.; Gottesfeld, S. Polymer Electrolyte Fuel Cell Model. J. Electrochem. Soc. 1991, 138, 2334–2342. [Google Scholar] [CrossRef]
  41. Mazumder, S.; Cole, J.V. Rigorous 3-D mathematical modeling of PEM fuel cells: II. model predictions with liquid water transport. J. Electrochem. Soc. 2003, 150, A1510. [Google Scholar] [CrossRef]
  42. Um, S.; Wang, C.Y.; Chen, K.S. Computational fluid dynamics modeling of proton exchange membrane fuel cells. J. Electrochem. Soc. 2000, 147, 4485. [Google Scholar] [CrossRef]
  43. Ramin, F.; Sadeghifar, H.; Torkavannejad, A. Flow field plates with trap-shape channels to enhance power density of polymer electrolyte membrane fuel cells. Int. J. Heat Mass Transf. 2019, 129, 1151–1160. [Google Scholar] [CrossRef]
  44. Baz, F.B.; Ookawara, S.; Ahmed, M. Enhancing under-rib mass transport in proton exchange membrane fuel cells using new serpentine flow field designs. Int. J. Hydrogen Energy 2019, 44, 30644–30662. [Google Scholar] [CrossRef]
  45. Islam, M.N.; Mansoor Basha, A.B.; Kollath, V.O.; Soleymani, A.P.; Jankovic, J.; Karan, K. Designing fuel cell catalyst support for superior catalytic activity and low mass-transport resistance. Nat. Commun. 2022, 13, 6157. [Google Scholar] [CrossRef] [PubMed]
Figure 1. Geometric models and the computational grids.
Energies 17 04442 g001
Figure 2. Model variation with experiment results by Islam et al. [45].
Energies 17 04442 g002
Figure 3. The comparation of (a) polarization curve and (b) pressure drops in different inclination angle of Tesla valve.
Energies 17 04442 g003
Figure 4. The distribution of velocity and mass fraction of O2 of different inclination angles in the middle plane of cathode channel. (a) T1_R; (b) T3_R; (c) T1_F; (d) T3_F; and (e) average velocity in straight segment and loop segment. m s−1.
Energies 17 04442 g004
Figure 5. The distribution of mass fraction of (a) H2O and (b) O2 in the GDL/CL interface of different inclination angles at 0.8 A/cm2.
Energies 17 04442 g005
Figure 6. (a) Polarization curves and (b) pressure drops of different loop radiuses of Tesla valve; (c) the relationship between channel area variation and current density changes.
Energies 17 04442 g006
Figure 7. The distribution of velocity and mass fractions of O2 of different loop radiuses in the middle plane of cathode channel. (a) T1_R; (b) T5_R; (c) T1_F; (d) T5_F; and (e) average velocity in straight segment and loop segment.
Energies 17 04442 g007
Figure 8. The distribution of mass fractions of (a) H2O and (b) O2 at GDL/CL interfaces of different loop radiuses at 0.8 A/cm2.
Energies 17 04442 g008
Figure 9. The comparation of (a) polarization curves and (b) pressure drops in the presence or absence of islands and (c) the relationship between channel area variation and current density changes.
Energies 17 04442 g009
Figure 10. The distribution of velocity and mass fraction of O2 in the presence or absence of islands in the middle plane of cathode channel. (a) T5_R; (b) T5_R without island; (c) T5_F; and (d) T5_F without island.
Energies 17 04442 g010
Figure 11. The distribution of mass fractions of (a) H2O and (b) O2 in the presence or absence of islands at GDL/CL interface at 0.8 A/cm2.
Energies 17 04442 g011
Table 1. Geometric parameters of model.
ParametersValuesUnits
Length and width of model54 × 10mm
Height of anode and cathode BPs1.5mm
Depth of anode and cathode channels1mm
Thickness of anode and cathode GDLs0.2mm
Thickness of anode and cathode CLs0.01mm
Thickness of membrane0.012mm
Table 2. Design parameters of Tesla valve.
Serial NumberAngle of Inclination α (deg)Radius of Loop (mm)Channel Area with Island (mm2)Channel Area without Island (mm2)The Ratio of Area Increase (%)
T177.321.5111.14119.887.86
T261.931.5105.94115.759.26
T343.61.5104.62114.449.39
T477.322137.93172.9425.38
T577.322.5164243.5248.49
Table 3. Physical properties and the boundary conditions of PEMFCs [21,43,44].
NameValuesUnits
Faraday constant96,487C/mol
Reference current density of anode/cathode10,000/10A/m2
Reference concentration of anode/cathode0.5/0.1kmol/m3
GDL porosity0.8-
CL porosity0.4-
Absolute permeability of GDL3 × 10−12m2
Absolute permeability of CL2 × 10−13m2
Contact angle of GDL110deg
Contact angle of CL95deg
Equivalent weight1100Kg/mol
Operation temperature353K
Operation pressure10,1325Pa
Open-circuit voltage0.95V
Mass flow rate of anode/cathode inlet6 × 10−7/5 × 10−6kg/s
Relative humidity of anode/cathode10%/80%-
Stoichiometric ratio of anode/cathode2/2-
Electrical conductivity of GDL/CL5000S/m
Electrical conductivity of BP20,000S/m
PEM/ Liquid density1980/982kg/m3
Surface/volume ratio200,0001/m
Leverett function coefficients (a/b/c)1.417/2.12/1.263-
Table 4. Grid independence verification.
Element NumberVoltage (V)Relative Deviation
Mesh 1285,1200.56010.34%
Mesh 2499,5000.55980.28%
Mesh 32,754,0000.5582-
Disclaimer/Publisher’s Note: The statements, opinions and data contained in all publications are solely those of the individual author(s) and contributor(s) and not of MDPI and/or the editor(s). MDPI and/or the editor(s) disclaim responsibility for any injury to people or property resulting from any ideas, methods, instructions or products referred to in the content.

