Article

Energy Hub Model for the Massive Adoption of Hydrogen in Power Systems

by
Fabio Massaro
1,
Maria Luisa Di Silvestre
1,
Marco Ferraro
2,
Francesco Montana
1,*,
Eleonora Riva Sanseverino
1 and
Salvatore Ruffino
1
1
Department of Engineering, University of Palermo, 90128 Palermo, Italy
2
National Research Council of Italy (CNR), Institute for Advanced Energy Technologies “Nicola Giordano” (ITAE), 90128 Palermo, Italy
*
Author to whom correspondence should be addressed.
Energies 2024, 17(17), 4422; https://doi.org/10.3390/en17174422
Submission received: 17 July 2024 / Revised: 26 August 2024 / Accepted: 27 August 2024 / Published: 3 September 2024
(This article belongs to the Special Issue Advances in Hydrogen Energy IV)

Abstract

:
A promising energy carrier and storage solution for integrating renewable energies into the power grid currently being investigated is hydrogen produced via electrolysis. It already serves various purposes, but it might also enable the development of hydrogen-based electricity storage systems made up of electrolyzers, hydrogen storage systems, and generators (fuel cells or engines). The adoption of hydrogen-based technologies is strictly linked to the electrification of end uses and to multicarrier energy grids. This study introduces a generic method to integrate and optimize the sizing and operation phases of hydrogen-based power systems using an energy hub optimization model, which can manage and coordinate multiple energy carriers and equipment. Furthermore, the uncertainty related to renewables and final demands was carefully assessed. A case study on an urban microgrid with high hydrogen demand for mobility demonstrates the method’s applicability, showing how the multi-objective optimization of hydrogen-based power systems can reduce total costs, primary energy demand, and carbon equivalent emissions for both power grids and mobility down to −145%. Furthermore, the adoption of the uncertainty assessment can give additional benefits, allowing a downsizing of the equipment.

1. Introduction

1.1. Motivation

Hydrogen has been gaining attention in recent years all over the world as a versatile energy vector due to its potential to store and transport energy efficiently. Although hydrogen is not freely available in nature, it can be produced from diverse primary energy sources such as fossil fuels and biomass or secondary energy sources such as renewable electricity from hydroelectric, wind, and solar power. In detail, steam reforming is massively used to obtain hydrogen from fossil fuels, mostly methane; biomasses can be exploited using gasification or pyrolysis processes, while renewable electricity can be employed to feed water electrolyzers. According to IEA, although total global production was 94 Mt of hydrogen in 2021, low-emission hydrogen accounts for less than 1 Mt (0.7%), mainly from fossil fuels with carbon capture, utilization, and storage. The share of hydrogen produced from electricity via water electrolysis was only 0.037% (35 kt) in 2021, with an increase of almost 20% with respect to the previous year [1].
If obtained from renewable electricity and used in fuel cells with oxygen or in internal combustion engines, hydrogen is considered an energy carrier with zero carbon emissions; however, there are several factors influencing the life-cycle carbon footprint of hydrogen, such as the resources used, the production methods applied, the carbon emissions used to extract it, and the transport method to the final user [2,3]. According to a widely used classification, although it is not uniquely accepted, hydrogen is assigned a color scale according to its production method. Among the most common colors, “gray hydrogen” is generated from fossil fuels through steam methane reforming, “blue hydrogen” is also produced through steam reforming using fossil fuels and then by capture, utilization, and storage of the associated CO2 emissions, and “green hydrogen” is produced from renewable sources through the water electrolysis [4]. This classification is referenced in the subsequent sections of the present study.
A study published in mid-2021 stated that blue hydrogen might cause a reduction in life-cycle carbon emissions with respect to gray hydrogen between 5% (worst case) and 36% (best case), depending on the time horizon and on the methane leakage rate [5]. Another study in 2021 focused on the life-cycle assessment of the greenhouse gas emissions related to green hydrogen produced using an alkaline electrolyzer and electricity from PV. The outcome was that, accounting for many different energy, political, and economic factors, the life-cycle emissions associated with green hydrogen production could be up to 93% lower than the emissions associated with gray hydrogen in the best-case scenario, while they could be only 14% lower in the worst-case scenario [6].
Hydrogen can feed a broad range of end-use conversion processes in industry, even hard-to-abate processes such as refineries and steel production, mobility, energy, and building sectors. One of the most significant current uses is in fuel cells, where hydrogen is converted directly to electricity with minimal environmental impact, producing only water vapor as a byproduct. This makes it a promising alternative to traditional fossil fuels in applications such as transports, where hydrogen-powered vehicles are becoming prevalent. Nevertheless, since hydrogen oxidation produces zero carbon emissions, green hydrogen will be a competitive substitute of fossil fuels for transportation as well as a crucial energy vector for energy system decarbonization. Furthermore, hydrogen from electrolysis can be also combined with carbon dioxide to produce the so-called e-fuels, namely synthetic fuels produced from green hydrogen, further helping in the transition to a carbon-neutral society.
Another prominent use of hydrogen gaining more and more interest is for electrical energy storage, allowing for a better integration of intermittent renewable energy sources (RES) like solar and wind and a higher flexibility of the energy system. In detail, a major drawback of RES is that, due to local favorable conditions for producibility, they are typically concentrated in areas that may be far from demand sites. Intermittency of RES is another drawback since it forces grid operators to acquire capacity reserve to balance the demand and production. Since there is a lack of reliable and economically viable storage systems with the unique exception of pumped hydro power stations, fossil fuel-based power stations are typically used to fill the gap when RES production is low and demand is high, while on the other hand, renewable energy is typically lost when demand is lower than production, applying the so-called power curtailment [7]. By storing excess energy produced during peak generation times, hydrogen can be later converted back into electricity to meet the demand when renewables are not producing enough. These drawbacks of RES make hydrogen an attractive option as a versatile energy vector mainly for storage and for transportation. The massive adoption of the hydrogen technology would also reduce capital investment costs that are currently still high. Moreover, average conversion efficiencies are still low, both in turning electricity into hydrogen (50–70%) and vice versa (60%) [1]. Nevertheless, one of the key drawbacks to be faced in the integration of hydrogen in the power systems is the leakage in the storage systems. Since the hydrogen molecule is the smallest and lightest one, the pressurized tanks face significant leakage rates, which are difficult to predict and might range between 0.2% and 20% in liquid storage systems [8]. This is still an open issue, and several technologies are being studied, such as liquid hydrogen storage or geological storage, although no data on leakage rates are available.
On a system scale, regions with favorable producibility from RES might produce low-cost hydrogen to be transported using the existing natural gas pipelines to demand centers as is or blended with natural gas. With specific reference to the current European roadmap for Climate Neutrality by 2050 [9], regions with high availability of solar and wind energies and good pipeline distribution like Italy in the southern region and the Netherlands and Denmark in the northern region might become green hydrogen hubs for the whole continent. The Italian Transmission System Operator (TSO) of the natural gas network SNAM published a research study on green hydrogen production in 2019 that emphasized the significance of the nation’s green hydrogen production. The study specifically examined a potential application in Sicily because of the island’s favorable solar and wind availability, its connections with North Africa, and the presence of refineries as hydrogen-demanding industries. In the study, hydrogen was proposed for uses spread from fuel for trains to home heating as a blend with natural gas in pipelines [10]. A recent paper further stressed this result, comparing several scenarios and proving that, with the current economic conditions, the production of green hydrogen in Sicily is already economically profitable [11].
As reported in a more recent study by SNAM and Terna, the Italian electricity TSO, the FF55 scenario (which aims to reduce EU emissions by at least 55% by 2030) predicts that almost 102 GW of installed solar and wind plants will be needed by 2030, with an increase of as much as +70 GW compared to the 32 GW installed in 2019. Given this high penetration of renewable energy sources, the hydrogen production through electrolyzers represents a further opportunity to value overgeneration to produce green hydrogen to be used in other sectors. Out of the 5 GW electrolyzers installations planned in Italy, 1.5 GW will be built between the north and central north, while the remaining 3.5 GW are expected to be located between the south, central south, and the islands [12].
What is described above is rapidly becoming reality. European Union launched the REPowerEU Action Plan in 2022 with the target, among others, of scaling up the development of hydrogen infrastructures and the production of 10 Mt of green hydrogen inside Europe and the import of 10 Mt of green hydrogen from outside Europe by 2030 [13]. In the USA, the company Green Hydrogen International unveiled plans to create Hydrogen City in Texas, a plant that will use 60 GW of electricity from solar and wind RES to produce over 3 billion kilograms of hydrogen per year. The plant will exploit two salt caverns as hydrogen storage systems and is set to start operation in 2026 [14].

1.2. Literature Review

The scenario described so far strongly suggests that hydrogen can be favorably integrated into the energy sector with a multi-carrier approach concerning electricity, heating, transport, and industrial uses. This approach might support the integration of this new vector since it is well known that multi-carrier energy systems are conceived to improve energy efficiency and reduce costs [15]. Nevertheless, most of the current research has focused on the exploitation of non-programmable RES to generate hydrogen, known as power-to-hydrogen technology.
In the past, various management and interconnection strategies between the electricity grid and the natural gas grid [16,17,18] have been studied for the same purpose; more recently, attention is focusing on the use of green hydrogen.
In [19], a wind–hydrogen-based system was described and analyzed. The system consists of a direct-drive wind turbine, four converters, an alkaline electrolyzer, and a PEMFC; the simulation model of the system was implemented in MATLAB/Simulink software and employed to test the feasibility of the wind–hydrogen coupling system aimed at improving the consumption of wind-generated power and low-voltage ride-through capability. The results demonstrated that the proposed system could efficiently solve the problem of wind power curtailment, withdrawing the excess power and supplementing the power balance when the wind turbine output is insufficient. Furthermore, if a short-circuit fault happens on the grid, a hydrogen-based energy storage system might avoid the occurrence of over-voltage and over-current, keeping the unit connected to the grid with continuous operation.
In [7], the authors developed an optimization model to reduce the curtailment from wind energy in HV power systems due to grid stability issues. Excess renewable energy is converted into hydrogen, stored in a tank, and then converted in electricity to be injected into the grid when renewable production is low. Results showed that wind energy curtailment might be easily reduced by about 35%, equivalent to about 55 MWh in a single day.
The study conducted in [20] provides a techno-economic analysis and a method for sizing and scheduling the equipment making up a hybrid energy system composed by offshore wind power with a power-to-hydrogen facility, considering the supply of hydrogen to different end-users. In particular, the test system was studied in a Belgian port. The increasing offshore wind installations in the North Sea and the huge number of industrial sites operating in the region make this case study very interesting. The goal of the study was to evaluate the convenience of investing in a hydrogen-based systems to increase the utilization of power from wind farms and avoid curtailment. Under the assumptions adopted in this study, the inclusion of a fuel cell generating electricity from the stored hydrogen was found to be less profitable than direct hydrogen sales.
Hydrogen refueling stations with on-site hydrogen production via electric power drawn from the grid can also provide balancing services. As reported in [21], the fast response capability of electrolyzers could allow to use the station demand as a flexible electrical load, storing the hydrogen to be used when needed. The cited paper used a sensitivity factor method for the management of active networks to illustrate the profitability of turning hydrogen refueling stations in flexible loads, showing that the proposed control strategy allows avoiding up to 9.5 times more curtailment than in the case of a passive control strategy for wind farms. With this technique, the station’s net cost related to electricity consumption might be reduced by 7.5% by exploiting the excess electricity that would unlike be curtailed.
In [22], instead, it was shown that hydrogen storage power plants can provide an instantaneous reserve for primary and secondary regulation ancillary services to overcome the disturbance of frequency, while in [23], a wind power plant model coordinated with a hydrogen storage system was studied using a real-time pricing-based demand response strategy.
In [24], an energy hub model was applied to study the possible interactions between the power system and the hydrogen production system in steady-state conditions. The mathematical model developed in this paper includes the power grid, renewable (PV and wind) generation, hydrogen network, and hydrogen storage system and considers the power losses; the power flow of this comprehensive energy network was evaluated using Gauss–Seidel and Newton–Raphson methods.
In [25], the combined problem of optimal siting and sizing of hydrogen refueling stations was discussed. The study considered distributed hydrogen production and aimed to reduce costs for regional consumers by optimizing the hydrogen supply chain from production to final consumption.
In [26], an optimal method for sizing a green hydrogen plant for a steel industry was described using a linear energy hub model. The results showed that the rated size required to completely cover the factory requirement would be huge, and space constraints would make it hard to realize. Nevertheless, the investment would be highly profitable from an economic point of view.
Regarding the inclusion of hydrogen in multi-carrier energy systems, only the following studies were found in literature.
In [27], an energy hub consisting of a hybrid energy storage plant based on a fuel cell, wind energy, photovoltaic energy, and a particular unit of fuel cells was studied. Scenarios with elastic demand and capacity reserves that participate in energy markets as a single entity were considered for the optimization of the operation of the energy hub. The study also modeled the uncertainty of load demand, wind turbine speed, and photovoltaic irradiance using the Monte-Carlo method.
In [28], instead, the stochastic method based on the conditional value at risk (CVaR) was adopted to study the uncertainty associated with the production of wind energy in a multi-vector energy system where hydrogen plays a significant role in reducing the operating costs of the energy system and in increasing the penetration of wind energy.
In [29], an optimal management strategy was studied for an energy hub where there are both a natural gas network used to power a cogenerator and a furnace and a hydrogen network to which an electrolyzer and a fuel cell are connected. The hub also has a wind turbine, a hydrogen storage system, and a thermal demand response system. The purpose of the study was to minimize management costs and emissions.
Even in [30], an energy hub model in which hydrogen is used as an energy vector to facilitate the integration of different RES was proposed: In the discussed energy hub, there are wind, photovoltaic, and concentrated solar plants. To maximize the operating profits of the multi-energy system, an optimization problem was formulated using the matrix matching methodology; the CPLEX software tool (v22.1.1) was used to obtain the optimal solution in the dispatching period. The simulation results demonstrated that with the proposed model, a higher penetration of renewable energy and higher profits are achieved as compared to the traditional operating mode without hydrogen.
In [31], an algorithm was proposed for the daily programming of energy resources with recourse to uncertainty resolution for an isolated energy hub powered by wind and photovoltaic plants and equipped with two storage systems: batteries and a set of electrolyzers, hydrogen tanks, and fuel cells. As reported in the article, hydrogen offers a number of advantages and could play an increasing role in future energy hubs because it eliminates the end-of-life environmental concerns associated with batteries and, in addition, offers another mechanism for transferring energy, potentially enabling hydrogen power supply to nearby hubs and fuel cell electric vehicles; however, this power supply was not considered by the authors.
In [32] a risk-constrained planning of a multi-energy microgrid was implemented, featuring charging stations for electric vehicles and hydrogen vehicles as well as photovoltaic, wind, biomass, and combined heat and power plants, boiler, electrolyzer, cryptocurrency miners, electrical, thermal and hydrogen storage systems, and reactive demands. To consider the uncertainties of the various demands, the availability of photovoltaic and wind energy, as well as the price of electricity purchased from the pool market, the authors resorted to a two-stage stochastic scheduling method. The results published in the article show how the use of renewable sources together with storage and demand response programs significantly reduces operating costs. Similar results were obtained in [33], where a technique for the daily programming of an intelligent micro-energy hub integrated with power-to-hydrogen plants was proposed. In [34], a single-objective economic optimization model was proposed for a multi-carrier energy hub, including electricity, hydrogen, natural gas, heating, and cooling. The model was applied to the conversion of the city of Chicago to a 100% renewable system.
The study in [35] discussed the robust two-stage operation of electricity–gas–heat-integrated multi-energy microgrids, focusing on the challenges posed by uncertainties in renewable energy generation and load. It introduced a robust dispatch method to improve the flexibility, reliability, and economic efficiency of multi-energy microgrids, considering dynamic network characteristics and proposing a ladder-type carbon emission cost mechanism to reduce emissions.
In [36], the authors introduced the concept of the committed carbon emission operation region for integrated energy systems. The paper proposed a model to analyze low-carbon operations, incorporating uncertainties and characteristics of renewable energy. The paper focused on characterizing the low-carbon feasible space of integrated energy systems and presented simulation results to validate the proposed methods.
A recap of the main aspects of this literature review is provided in the following Table 1, highlighting and comparing the main features of the studies.

1.3. Contribution

In the context of the hydrogen production from renewable energies and its exploitation within several final uses in the energy transition process with a multi-vector approach, the aim of this study is to demonstrate how to optimally identify sizes and management schedule of a power system based on the hydrogen exploitation by developing a simulation and optimization model based on the hybrid energy hub scheme [37].
An energy hub is an integrated model that coordinates multiple energy sources, storage, and consumption devices to optimize energy production, distribution, and usage. By combining renewable and conventional energy sources such as solar, wind, and natural gas, energy hubs can enhance energy efficiency, reliability, and sustainability. When a multi-carrier model is developed, it is called a hybrid energy hub.
A linear mathematical formulation was selected, allowing a balance between flexibility in the modeling and computational time, while the decisional variables are real and integer.
The model was conceived to be as generic as possible and is made up of multiple infrastructures, energy vectors, and conversion and storage equipment, thus creating an infrastructure able to manage different energy carriers in a combined way. In detail, the generality of the modeling approach allows to analyze different applications, such as power lines, microgrids, and single buildings. The results of the study should encourage the integration of hydrogen-based systems into a widely larger framework to exploit the higher energy efficiency possibility enabled by a multi-carrier energy system. Another important source of innovation is the adoption of many objective functions, namely four in this study, allowing a comparison between the optimal solutions according to different criteria typically aimed at preferring different design solutions. In this context, the literature review showed that hydrogen-based energy systems are usually optimized according to economic criteria only, neglecting the huge potential related to the carbon emission and primary energy reduction. Furthermore, the inclusion of a life-cycle assessment approach allows considering for the effective energy and carbon saving solutions since the primary energy and carbon emissions related to the manufacturing phases are also included in the optimization study. This kind of approach is becoming more important nowadays since many countries are introducing strict carbon taxation schemes and since EU has also rolled out the carbon border adjustment mechanism aimed at penalizing raw materials and manufacts involving impacting processes.
To verify the feasibility of the model and the applicability of the method, a case study involving the robust preliminary sizing of equipment for a microgrid was developed. The goal of the case study is to identify the minimum costs, primary energy, carbon equivalent emissions, and grid interactions of an urban microgrid as well as the optimal rated size of equipment to fulfill the electricity, thermal energy, cooling energy, and hydrogen final demands. The approach presented in this article illustrates the integration of renewable energy systems connected to the main power grids and working in tandem with traditional conversion systems and storage systems. In the case study, the robustness of the solution was assessed, introducing the uncertainty on the renewable production and on the energy demands.
This study represents an extension of a previous publication of some of the authors [38]. The additional contributions include the following:
(1)
A versatile framework based on multi-carrier energy hubs for simulation and optimization of design and operation. In detail, many components can be compared and assessed;
(2)
A detailed economic analysis for both design and operation;
(3)
A multi-objective approach aimed at balancing the minimization of costs, the grid interactions, primary energy use, and the impact on the greenhouse effect;
(4)
The consideration of the uncertainty on the most unpredictable input data (energy production from RES and final energy demands) is introduced in both case studies.
From the analysis of the previous literature, the proposed approach introduces as novelties the simultaneous optimization of design and operation phases of a multi-vector hybrid energy hub based on a multi-objective, uncertain approach, allowing the introduction of hydrogen for enhancing the flexibility and the penetration of the renewable energies into the power system. Among the renewables, the concentrated solar power was also included in addition to PV and solar thermal. Furthermore, differently from the previous approaches, the present study allows the interaction of the hydrogen vector with many other energy flows, such as heating energy, cooling energy, and natural gas. Last, an important issue such as leakages of the hydrogen storage systems was accurately modeled in the present study, although this aspect is often neglected in the existing literature on optimization studies involving hydrogen [28,29,39].
This document is structured as follows:
  • Section 2. Materials and Methods, with the description of the energy hub model developed for this study and the main assumptions, showing the coordinated optimization of a multi-carrier energy system including hydrogen, power, and heating final demands. The data collection phase is also described;
  • Section 3. Results, illustrating the results of the study for the reference case and for the stochastic scenarios;
  • Section 4. Discussion and conclusions, recapping the main aspect of this paper and giving some insights for further deepen the topic.
The abbreviations and symbols used in the paper are summarized in Table 2.

2. Materials and Methods

2.1. Energy Hub

The design of a multi-carrier energy system (MES) requires power, water, heating, cooling, transportation, and other infrastructures to be interconnected to achieve these goals. A MES can obtain several advantages over an independent power supply system. The multi-energy system approach creates more degrees of freedom, which is reflected in the following benefits both in the planning and in the operational phase:
  • Increased efficiency through optimal interaction of various energy vectors and conversion units. For example, an electrical system with massive non-predictable renewable energy penetration might use the excess energy to charge electricity storage devices such as electric vehicles or to produce hydrogen;
  • Increased security of supply through high availability of multiple power sources. MES are designed in such a way that each load does not depend on a single energy source or technology and can be met by the cheapest and most available energy carrier;
  • Increased flexibility through greater degree of freedom in powering loads. An apparently polluting or expensive energy source might be substituted with a cleaner energy source.
On the other hand, an MES is inherently more complex than a traditional energy system, making the modeling more difficult. To overcome this problem, the MES can be studied using the energy hub (EH) model [40]. Energy hubs are defined as “interconnected systems that consume energy at their connected input ports, e.g., power distribution networks and natural gas infrastructures and provide the required energy services such as electricity, heating, cooling, compressed air, etc., in the output ports” [41]. Energy hubs can be used to control the flows of energy carriers in systems with different sizes, from the local to the national level. An energy hub can be seen as an interface between energy suppliers and consumers through the network infrastructure [42]. On the input side, electricity, natural gas, and district heating are required by the relevant infrastructure and processed at the hub and delivered to the output side, where the cooling, heating, or electricity requirements are met.
The EH model is based on some simplifying assumptions that allow a compact formulation for the modelling of each component and energy flow:
  • The hub operation is analyzed in several timesteps in steady-state conditions, when all transients or fluctuating conditions have damped out and all quantities remain essentially constant in each timestep;
  • Within the EH, losses are considered only in converters and storages, although it is possible to include line gas/electricity lines losses;
  • Unidirectional flows from the inputs to the outputs of the converters are usually assumed;
  • Power flow through converter devices is univocally identified using the power and energy quantities, using constant efficiency terms to consider energy transformations and losses.
In this study, the EH model was exploited to model an MES based on the exploitation of green hydrogen both for grid flexibility services and for final uses. A graphical representation of the hub and the main flow of the problem is provided in Figure 1.
The MES considers electricity (E), heating (H), cooling (F), natural gas (NG), hydrogen (H2), and water flows (W). The electricity demand can be satisfied using power from the grid or the production from RES, the net output from a battery (ESS), and fuel cell (FC). The heating demand can be fulfilled using district heating, the waste heat recovered from the FC or using the back-up gas-fired boiler (GB), RES, heat pump (HP), and the net output from a storage system (TSS). The absorption chiller (AC), the reversible HP, and the district cooling can meet the cooling demand. Hydrogen demand is satisfied by the hydrogen transported through tank trucks, schematically represented as an input grid, and by the production of the electrolyzer (EL) that is stored in the tank (TK). The hydrogen production system by electrolysis (EL) considered in the model and depicted in Figure 1 also includes the necessary hydrogen compression step, with its associated energy consumption, as well as the necessary water purification and deionization systems. The four demands can be fully satisfied using the main power grid and district heating as a back-up. All the vectors can be stored in a dedicated storage system to decouple production and consumption. The excess production of electricity, heating, cooling, and hydrogen can be sold to the electrical grid, district heating network, district cooling network, and hydrogen network, respectively.
Each component is considered as the equivalent of many analogous components with similar features (e.g., efficiency) and lower-rated power. This energy hub model might be used to simulate a single building, a district of buildings, urban microgrids, or small islands.
A crucial aspect of the model development is that the mathematical formulation of all the objective functions and constraints was kept linear. This choice was formulated to ensure the uniqueness of the optimal solutions obtained in each simulation, although this forces simplification of the modeling of the equipment behavior, such as the degradation of performance over the lifetime or the dependance of the efficiency with the load. For instance, as shown in Table 1, in most of the literature, the optimization of hydrogen-based systems rely on linear models.
The model is composed of real and integer variables. Integer variables were introduced to model some equipment aspects, such as the storage systems operation, the synthesis variables for the inclusion of each equipment, or the number of renewable units to be included. Thus, the optimal solution was identified through a mixed-integer linear programming (MILP) algorithm based on the Branch and Bound algorithm available on the MATLAB library [43].

2.2. Objective Functions

In this study, the optimal and design and operation of the MES were formulated as a multi-objective optimization problem. The solutions deriving from the minimization of total costs, the life cycle primary energy use, the life cycle greenhouse impact, and the grid interactions of the energy hub were thus derived. Starting from a base case where all the demands of the hub are fulfilled by direct purchase, for the first three objective functions, the contribution of the purchase of components and the operating contribution were both included in the evaluation. Under the assumption of assessing Kday daily trends that are representative of the average annual trend, each day having Khour equivalent hours, the mathematical formulation for these objectives was structured as shown in Equations (1)–(4).
The annualized total cost was formulated as in Equation (1):
min 365 / K d a y t = 1 K d a y K h o u r C o p e x , E E g r i d , i n ( t ) + C o p e x , N G H G B ( t ) / K G B , g h   + +   C o p e x , H H g r i d , i n ( t ) + C o p e x , F F g r i d , i n ( t ) + C o p e x , H 2 H 2 , g r i d , i n ( t ) + C o p e x , W W g r i d , i n ( t )   +   R o p e x , E E g r i d , o u t ( t ) R o p e x , H H g r i d , o u t ( t ) R o p e x , F F g r i d , o u t ( t ) R o p e x , H 2 H 2 , g r i d , o u t ( t )   +   R o p e x , W W g r i d , i n ( t ) + e q u i p = 1 N e q u i p C c a p e x , e q u i p C R F e q u i p S e q u i p   + +   C c a p e x , e q u i p ( 0 ) C R F e q u i p Θ e q u i p + C O & M , e q S e q
where t is the timestep; C indicates the cost; R indicates the revenues; CRF is the uniform-series capital recovery factor of the investment, i.e., a coefficient that is used to spread investments over a year basis [44]; S is the rated size of the component (design variables); Θ is the synthesis variables of the component, i.e., Boolean variables that are equal to zero when the component is not convenient to install or are equal to one when the component should be installed; the subscript opex indicates that the cost or the revenue is related to the supply of energy carriers; the subscript capex indicates that the cost is related to the investment in equipment; the subscript grid indicates that the flow comes from or is injected into the main grid; the subscript in indicates the input flows; the subscript out indicates the output flows. The subscript equip is the generic equipment to be installed, Nequip is the total number of equipment assessed in the study, and the subscript O&M stands for operation and maintenance. The investment costs were assessed using a linear formulation rather than a unit cost formulation [45]. With Equation (1), the economic optimization was based on the purchase of the equipment to be installed inside the hub and their operating costs.
The annualized life cycle primary energy use was formulated as in Equation (2):
min 365 / K d a y t = 1 K d a y K h o u r C E D E E g r i d , i n ( t ) + C E D N G N G g r i d , i n ( t )   + +   C E D H H g r i d , i n ( t ) + C E D F F g r i d , i n ( t ) + C E D H 2 H g r i d , i n ( t ) + C E D W W g r i d , i n ( t )   + +   e q u i p = 1 N e q u i p C E D e q u i p S e q
where CED indicates the primary energy consumption from a life-cycle perspective, assessed using the cumulative energy demand indicator, that is required to produce a unit of each energy vector (operating CED) or to manufacture a component with a unitary rated size (embodied CED).
The annualized life cycle greenhouse impact was formulated as in Equation (3):
min 365 / K d a y Σ t = 1 K d a y K h o u r G W P E E g r i d , i n ( t ) + G W P N G N G g r i d , i n ( t )   + +   G W P H H g r i d , i n ( t ) + G W P D C F g r i d , i n ( t ) + G W P H 2 H 2 , g r i d , i n ( t ) + G W P W W g r i d , i n ( t )   + +   e q u i p = 1 N e q u i p G W P e q u i p S e q
where GWP indicates the contribution to the greenhouse effect from a life-cycle perspective assessed using the global warming potential indicator, that is required to produce a unit of each energy vector (operating GWP) or to manufacture a component with a unitary rated size (embodied GWP).
The annual grid interaction was formulated as in Equation (4):
min p Σ t = 1 K d a y K h o u r E g r i d , i n ( t ) + N G g r i d , i n ( t ) + H g r i d , i n ( t ) + F g r i d , i n ( t ) + H 2 , g r i d , i n ( t )   + +   W g r i d , i n ( t ) + E g r i d , o u t ( t ) + H g r i d , o u t ( t ) + F g r i d , o u t ( t ) + H 2 , g r i d , o u t ( t ) + W g r i d , o u t ( t )
where p is a penalty factor, i.e., a constant with very large value.
The multi-objective problem was converted into a single-objective function using the scalarization technique, i.e., normalizing the objective functions and minimizing their weighted sum. The normalization factors adopted for each objective function in this study were selected according to the feasible–value–constraint approach illustrated in [46]. This approach inherently allows to make each single objective function assume the same value of the others once the weighting factors are selected. Although the scalarization technique is known not to guarantee the convergence in all cases, the MILP problem assessed in this study was not influenced by this drawback.

2.3. Final Demands

The final energy and hydrogen demands of the user can be predicted with sufficient accuracy using average standard days. Nevertheless, the effective daily behavior might significantly differ from the average trend, causing results to deviate from the prediction deriving from the optimization and the oversizing of the equipment. Thus, the uncertainty related to the final demands was accurately modeled in this study, employing a Gaussian (or normal) distribution function for each demand, as is common practice in the literature [27,47]. In this way, each demand is characterized by an average value and a standard deviation for each timestep. When the model is run, as well as for renewable energies, a Monte Carlo algorithm generates several uncertain scenarios based on the probability distribution functions. For each scenario, the final demands are used as input parameters for the optimal planning. Furthermore, each demand is associated with a flexible amount to be used for load shifting over the day to exploit additional sources of energy saving.

2.4. Constraints

2.4.1. Constraints Describing Energy and Mass Balance Equations

In the EH model, a mass balance equation or an energy balance equation is set for each flow and for each timestep. Each equation links homologous flows incoming to and outgoing from the hub with flows between the equipment inside the hub. These equations constitute some of the equality constraints for the optimization problem and were imposed according to the schematic shown in Figure 1. For this study, the mass balance was imposed for natural gas (Equation (5)), hydrogen (Equation (6)), and water (Equation (7)), while the energy balance was imposed for electricity (Equation (8)), heating (Equation (9)), and cooling flows (Equation (10)). All the following equations are written explicating constant terms on the right-hand side, while variable terms are on the left-hand side.
NGgrid,in (t) − NGGB (t) = 0
H2,grid,in (t) − H2,grid,out (t) + H2,EL (t) − H2,FC (t) − H2,TK,in (t) + H2,TK,out (t) +
− H2,dem,fl (t) = H2,dem,fix (t)
Wgrid,in (t) − Wgrid,out (t) − EEL (t) · KEL,eh2· KEL,h2w + EFC (t)/KFC,h2e· KFC,h2w +
− WWSS,in (t) + WWSS,out (t) − Wdem,fl (t) = Wdem,fix (t)
Egrid,in (t) − Egrid,out (t) + EFC (t) − EESS,in (t) + EESS,out (t) + ERES (t) − EHP (t) − EEC (t) +
− EEL (t) − Edem,fl (t) = Edem,fix (t)
Hgrid,in (t) − HHT,grid,out (t) + HGB (t) + HFC (t) + HRES (t) − HTSS,in (t) +
+ HTSS,out (t) + EHP (t) · KHP,eh − FAC (t)/KAC,hf − Hdem,fl (t) = Hdem,fix (t)
Fgrid,in (t) − Fgrid,out (t) + EEC (t) · KEC,ef + FAC (t) − FTSS,in (t) + FTSS,out (t) − Fdem,fl (t) =
= Fdem,fix (t)
In the previous equations, the K terms are the conversion efficiencies of the components, while dem subscripts indicate the demands of the various energy carriers, divided into a flexible (dem,fl) and a fixed demand (dem,fix).

2.4.2. Renewable Energy Sources

The energy production from the RES was set to be estimated on historical data. Thus, this is an input vector for the optimization problem rather than a vector of variables.
The energy hub model includes three renewable energy generators: the photovoltaic system (PV), solar thermal collector (STC), and concentrating solar power (CSP). The first system produces electrical energy, the second produces thermal energy, and the latter generates both electrical and thermal energy. Furthermore, the systems producing thermal energy allow two temperature levels, named high-temperature heating and low-temperature heating. This difference was included to detail different thermal uses like space heating and domestic hot water in a residential application or two different thermal levels in an industrial application.
The modelling of the renewable energy generators was performed considering the variation of conversion efficiency with the main external conditions. Depending on the availability of renewable energy source, the power output was evaluated for each uncertain scenario depending only on the design variable, i.e., the number of units of a given rated power to be installed.
The uncertainty of renewable energy sources was modelled using statistical probability distribution functions. Air temperature was modelled as a Gaussian (or normal) distribution function since the site-specific data used for the case study fitted very well with this function. Solar radiation components (direct, diffuse, and reflected) were modelled using the Beta distribution function, as is common practice in the literature [27,47,48,49]. Regarding air temperature and solar radiation components, these quantities were characterized in the model through a mean value and a standard deviation for each timestep. For the European context, these data might be evaluated using the PVGIS database, whose data span over 16 years, thus allowing a good representativity of the uncertainty of these quantities. When the model is run, a Monte Carlo algorithm generates several uncertain scenarios based on the probability distribution functions. In detail, average value and standard deviation of the three solar radiation components are used to evaluate the ψ and ω parameters of the Beta distribution function according to the method illustrated in [27]. Available radiation data should be evaluated using the same tilt and azimuth angles of the PV system to be installed. Then, the Monte Carlo algorithm is run to generate the solar radiation scenarios and the air temperature scenarios according to their respective distribution functions.
For each scenario, the renewable energy production is then calculated and used as input parameters for the optimal planning.
The mathematical formulation of constraints describing the operation of RES systems is given in Equations (11)–(19).
-
Photovoltaic Systems (PV)
The PV cell temperature is evaluated for each scenario according to the following equation [27,47,50]:
T c e l l t = T a i r t + G s o l t G N O C T · N O C T T a , N O C T
where Tair is the air temperature; Gsol is the global solar radiation, i.e., the sum of the three radiation components; NOCT is the normal operating cell temperature, i.e., the operating temperature to which the cell is brought in the case of GNOCT irradiance of 800 W/m2 and air temperature Ta,NOCT of 20 °C. The cell temperature is then used to evaluate the PV efficiency according to the following equation [27]:
η P V t = η P V · 1 + β P V · T c e l l t T r e f
Lastly, the PV system power production is calculated multiplying the solar radiation, the PV system efficiency, the balance of plant (BOP) efficiency, the system surface, and the number of modules:
E P V t = η P V t · η B O P · G s o l t · A P V · N P V
-
Solar Thermal Collector (STC)
The STC heat output is evaluated taking into account for the thermal losses to the surrounding air depending on the air temperature. Thus, for each scenario and for each timestep, the collector’s efficiency is evaluated as shown in the equation below [51]:
K S T C t = η 0 a 1 · T m T a i r t G s o l t a 2 · T m T a i r t 2 G s o l t
where Tm is the average temperature of the fluid in the collector, while η0, a1, and a2 are the performance coefficients of the collector. The heat energy production is evaluated from the efficiency, the global solar radiation, the surface of each collector, and the number of collectors:
H S T C t = K S T C t · G s o l t · A S T C · N S T C
H S T C t = H S T C , H T t + H S T C , L T t
-
Concentrating Solar Power (CSP)
The CSP exploits only the direct component of the solar radiation, Gbeam. The direct radiation is then multiplied by the equivalent area, the conversion efficiency, the equivalent surface, and the number of units to obtain the electrical and thermal power:
E C S P t = K C S P , s e · G b e a m t · A C S P · N C S P
H C S P t = K C S P , s h · G b e a m t · A C S P · N C S P
H C S P t = H C S P , H T t + H C S P , L T t

2.4.3. Energy Conversion Components

The energy hub model includes five traditional energy conversion systems: a natural gas boiler (GB), reversible heat pump (HP), water electrolyzer (EL), absorption chiller (AC), and fuel cell (FC). The first system burns natural gas to produce heating (GB), the second and third use electricity as input to produce heating and cooling (HP) or hydrogen (EL), the fourth uses a high-temperature heating flow to produce cooling (AC), and the last uses hydrogen to produce electricity and heating (FC). Furthermore, a water input is required for the EL, and a water output is associated with the FC. The GB allows two temperature levels for the heating production as well as the thermal RES.
The modelling of the traditional energy conversion systems was performed, maintaining their conversion efficiency but ensuring a stable and optimal range of operation for each component. In detail, the operation of these components was modelled as independent from external conditions but controllable depending on the final demand. Nevertheless, to consider the actual operation features and to fall within the assumption of constant average conversion efficiency, these components were modelled to allow a variation of their production from full load down to a specific part load. Furthermore, the variation between the production in each timestep and the subsequent timestep cannot overcome a specific rate both in ramp-up and in ramp-down behaviors. All the equations included in the model are well established in the scientific literature.
Differently from the renewable energy production that is calculated before each optimization run and is one of the input parameters of the optimization model, the input and output flows of traditional energy conversion systems are modelled as variables of the problem. Thus, since the equations shown in the following subsections link together at least two variables, these are the equality and inequality constraints of the optimization problem. The mathematical formulation of constraints describing the operation of energy conversion components is given in Equations (20)–(33).
-
Gas-fired Boiler (GB)
The natural gas-fired boiler integrates the district heating system and the other components to fulfill the heating demand of the hub according to Equations (20)–(21):
HGB (t) = NGGB (t) · KGB gh · LHVg
HGB (t) ≤ SGB
where HGB is the heating flow from the boiler, NGGB is the natural gas flowing into the boiler, KGB gh is the boiler efficiency, and SGB is the rated size of the boiler.
-
Reversible Heat Pump (HP)
The operation of this component is described by Equations (22)–(24):
HHP (t) = EHP (t) · KHP eh
FHP (t) = EHP (t) · KHP ef
FHP (t) ≤ SHP
where HHP and FHP are the heating and cooling flows generated from the heat pump, respectively; EHP is the electricity input; KHP eh and KHP ef are the conversion factor from electricity to heating or cooling, respectively; and SHP is the rated size of the heat pump.
-
Absorption Chiller (AC)
The component is described by Equations (25) and (26):
FAC (t) = HAC (t) · KAC hf
FAC (t) ≤ SAC
where FAC is the cooling flow from the chiller, HAC is the heating flow input, KAC hf is the conversion factor from heating to cooling, and SAC is the rated size of the absorption chiller.
-
Electrolyzer (EL)
The relationships describing this component in the present study are illustrated in Equations (27)–(29):
H2 EL(t) = EEL (t) · KEL eh2
WEL (t) = H2 EL(t) · KEL h2w
EEL (t) ≤ SEL
where KEL eh2 is the electricity-to-hydrogen conversion efficiency and depends on the higher heating value of the hydrogen, on the compression efficiency, and on the efficiencies of the converters included to interface the RES plant with the electrolyzer; KEL h2w derives from the stoichiometric coefficients of the chemical reaction and represents the water required to produce one kilogram of hydrogen (water consumption of the electrolyzer cooling system is not taken into account); and SEL is the rated size of the electrolyzer.
-
Fuel Cell (FC)
The equations related to FC are given in Equations (30)–(33):
EFC (t) = H2 FC(t) · KFC h2e
HFC (t) = H2 FC(t) · KFC h2h
WFC (t) = H2 FC(t) · KFC h2w
EFC (t) ≤ SFC
where KFC h2e is the hydrogen-to-electricity conversion efficiency and depends on the hydrogen higher heating value, on the specific FC technology, and on the efficiencies of converters employed to interface the fuel cell with the power grid; KFC h2h is the hydrogen-to-heating conversion efficiency; KFC h2w derives from the stoichiometric coefficients of the chemical reaction; and SFC is the rated size of the fuel cell.

2.4.4. Storage Systems

The inclusion of storage systems in the optimization of a multi-vector microgrid is of paramount importance since it allows the production of an energy vector, although there is no demand on that vector. With reference to electrical and heating energy storages, they can store the excess of renewable production to meet the load of the subsequent hours. The energy hub model includes five storage systems: an electricity storage system (ESS), a hot water thermal storage system (TSS,H), a cold water thermal storage system (TSS,F), a hydrogen storage tank (TK), and a water storage system (WSS).
The modelling approach for all the storage systems is the same, with the unique exception of the TSS,H, whose output can be used to fulfil both the high-temperature and low-temperature heating demands. The modelling of these components was performed using a black box approach for the storage system and assessing only the input and output flows and the state of charge, indicated with SOC, i.e., the amount of energy or mass contained in the storage system. Losses in the component are considered using average and constant values of charging efficiency, discharging efficiency, and self-discharge rate proportional to the state of charge. All the equations included in the model are well established in the scientific literature.
Besides the coefficients for the objective functions (investment and operating costs, embodied primary energy, embodied carbon, exergy use, and critical raw materials content), the parameters set into the software tool are charging efficiency, discharging efficiency, self-discharge rate, depth of charge, and depth of discharge.
Differently from the renewable energy production that is calculated before each optimization run and is one of the input parameters of the optimization model, the input and output flows of storage systems are modelled as variables of the problem. Thus, since the equations shown in the following subsections link together at least two variables, these are the equality and inequality constraints of the optimization problem. The mathematical formulation of constraints describing the operation of energy conversion components is given in Equations (34)–(57).
-
Electricity Storage System (ESS)
The EES, assumed as a battery, is described using Equations (34)–(41):
SOCESS (t + 1) = SOCESS (t) · (1 − EESS,loss) + EESS,in (t + 1) · KESS,in +
− EESS,out (t + 1)/KESS,out
SOCESS (0) = SOCESS (T)
EESS,in (t) ≤ δESS,in (t) · QESS,in
EESS,out (t) ≤ δESS,out (t) · QESS,out
δESS,in (t) + δESS,out (t) ≤ 1
DoD · SESS ≤ SOCESS (t) ≤ SESS
EESS,in (t) ≤ SESS · (1 − DoDESS)
EESS,out (t) ≤ SESS · (1 − DoDESS)
where SOCESS (t) stands for the electrical energy accumulated in the storage system, and KESS,in and KESS,out are the charging and discharging efficiencies of the electrical storage, respectively. EESS,in (t) and EESS,out (t) stand for the incoming and outgoing electricity flows of the storage, respectively. EESS,loss is the self-discharge rate of the battery, modelled as a fraction of the electrical energy stored at each timestep; δESS,in (t) and δESS,out (t) are Boolean variables stating whether the ESS stands for in charging or discharging phase at time t, respectively; QESS,in and QESS,out are the upper limits to EESS,in (t) and EESS,out (t), respectively. DoD is the depth of discharge of the electrical storage system, and SESS is the capacity of the ESS.
-
Thermal Energy Storage System (TSS)
The TSS is used to store excess thermal production. Its operation is according to Equations (42)–(49):
SOCTSS (t + 1) = SOCTSS (t) · (1 − HTSS,loss) + HTSS,in (t + 1) · KTSS,in − HTSS,out (t + 1)/KTSS,out
SOCTSS (0) = SOCTSS (T)
HTSS,in (t) ≤ δTSS,in (t) · QTSS,in
HTSS,out (t) ≤ δTSS,out (t) · QTSS,out
δTSS,in (t) + δTSS,out (t) ≤ 1
SOCTSS (t) ≤ STSS
HTSS,in (t) ≤ STSS
HTSS,out (t) ≤ STSS
where SOCTSS (t) is the thermal energy stored in the device, and KTSS,in and KTSS,out are the charge and discharge efficiencies of the thermal storage, respectively. HTSS,in (t) and HTSS,out (t) are the incoming and outgoing heating flows of the storage, respectively; HTSS,loss is the self-discharge rate of the storage, assumed as a fraction of the thermal energy stored at each timestep; δTSS,in (t) and δTSS,out (t) are Boolean variables stating whether the electrical storage is in charging or discharging phase at time t, respectively; QTSS,in and QTSS,out are the upper limits to HTSS,in (t) and HTSS,out (t), respectively; and STSS is the capacity of the thermal storage.
-
Hydrogen storage tank (TK)
The equations describing the TK behavior are the following Equations (50)–(57):
SOCTK (t + 1) = SOCTK (t) · (1 − H2 TK,loss) + H2 EL(t + 1) · KTK,in − H2 TK,out(t + 1)/KTK,out
SOCTK (0) = SOCTK (T)
H2 EL (t) ≤ δTK,in (t) · QTK,in
H2 TK,out (t) ≤ δTK,out (t) · QTK,out
δTK,in (t) + δTK,out (t) ≤ 1
SOCTK (t) ≤ STK
H2 EL (t) ≤ STK
H2 TK,out (t) ≤ STK
where SOCTK is the hydrogen mass stored in the device, and KTK,in and KTK,out are the charge and discharge efficiencies of the hydrogen storage, respectively. T is the hour of the last timestep; H2 EL and H2 TK,out are the input and output hydrogen flows of the tank, respectively; H2 TK,loss is the leakage coefficient, assumed as a fraction of the stored hydrogen mass since the leakages are proportional to the pressure inside the tank. This aspect is unfortunately often neglected in the existing literature and is considered of paramount importance by the authors. δTK,in and δTK,out are Boolean variables that state whether the tank is charging or discharging at time t, respectively; QTK,in and QTK,out are the upper limits to H2 EL and H2 TK,out; and STK is the capacity of the hydrogen tank.

2.5. Case Study Description and Data Collection

The main aim of this case study is to investigate the economic feasibility of green hydrogen production within a microgrid interfaced to the power distribution system whose needs for electricity, thermal energy, and hydrogen must be guaranteed. This kind of application can fully unlock the energy-saving potential of a MES, exploiting the interactions between different energy carriers. The simulation and optimization of such a reality might resemble the development of sustainable districts, positive energy districts, and renewable energy communities.
The EH evaluated in this case study is supplied by the district heating network, natural gas network, power grid, urban water network, hydrogen network, and district cooling network. The final power demand, electric chiller, and electrolyzer are supplied by the local RES and FC as well as the power grid. The fuel cell was included to convert hydrogen back to electricity when mobility demand is low or when the tank is full. Thermal demand is met by the district heating network, gas boiler, heat pump, local thermal renewables, and waste heat recovered from the FC. Hydrogen demand is met by hydrogen from the grid and locally produced hydrogen from the electrolyzer. Finally, the cooling demand is met by the district cooling network, the electric chiller, and the absorption chiller.
This reality fits very well with the autonomous province of Bolzano, which was therefore taken as a case study in which to place the energy hub, as it is currently one of the Italian territories that already uses publicly available hydrogen refueling stations for mobility and, at the same time, has a district heating and cooling network as well as a high demand for electricity. In the case study, hydrogen can be produced on site or delivered via tank truck (although this quantity was indicated as H2,grid,in in the equations and figures).
The purpose of the study is to identify the optimal nominal size of the components and their optimal management with an effective and detailed model.
To estimate the hydrogen final demand for mobility, the trend, shown in Figure 2a, was reconstructed taking as reference the visiting times of an existing service station in Bolzano, dividing the daily hydrogen consumption into the various hours of the day, estimated starting from the annual consumption expected in the 2025 in Alto Adige [52] and assuming the same demand for every day of the year. In detail, although hydrogen volume in tanks might change over the year due to thermal expansion, the final demand is calculated in kilograms since this is the effective quantity influencing the vehicles performance.
As regards the final electricity demand in the case study, reference was made to the annual energy consumptions of the province of Bolzano for the years from 2017 to 2020, contained in Terna’s statistical yearbook as reported in [53]. For each year, daily consumption was calculated, considering a constant demand for all days of the year; then, the average daily consumption for the four years was calculated. Hourly electricity demand was derived by dividing the average daily consumption according to the typical pattern of an electrical load diagram, characterized by two peaks: one in the late morning and one during the evening hours, as shown in Figure 2b.
For the thermal energy demand, it was decided to act on the energy fed into the grid annually by inefficient district heating systems in the entire province, reported in [54], for 2020. Using the method of degree days derived from the standard [55], the energy fed into the grid monthly was derived. Assuming uniform demand for all days of the month, daily demand was derived for four typical days: one for each season starting from winter. Finally, hourly demand was estimated by assuming a non-uniform thermal demand pattern at various times of the day. Using the same approach, cooling demand was determined. Hourly heating and cooling demands are shown, respectively, in Figure 2c,d.
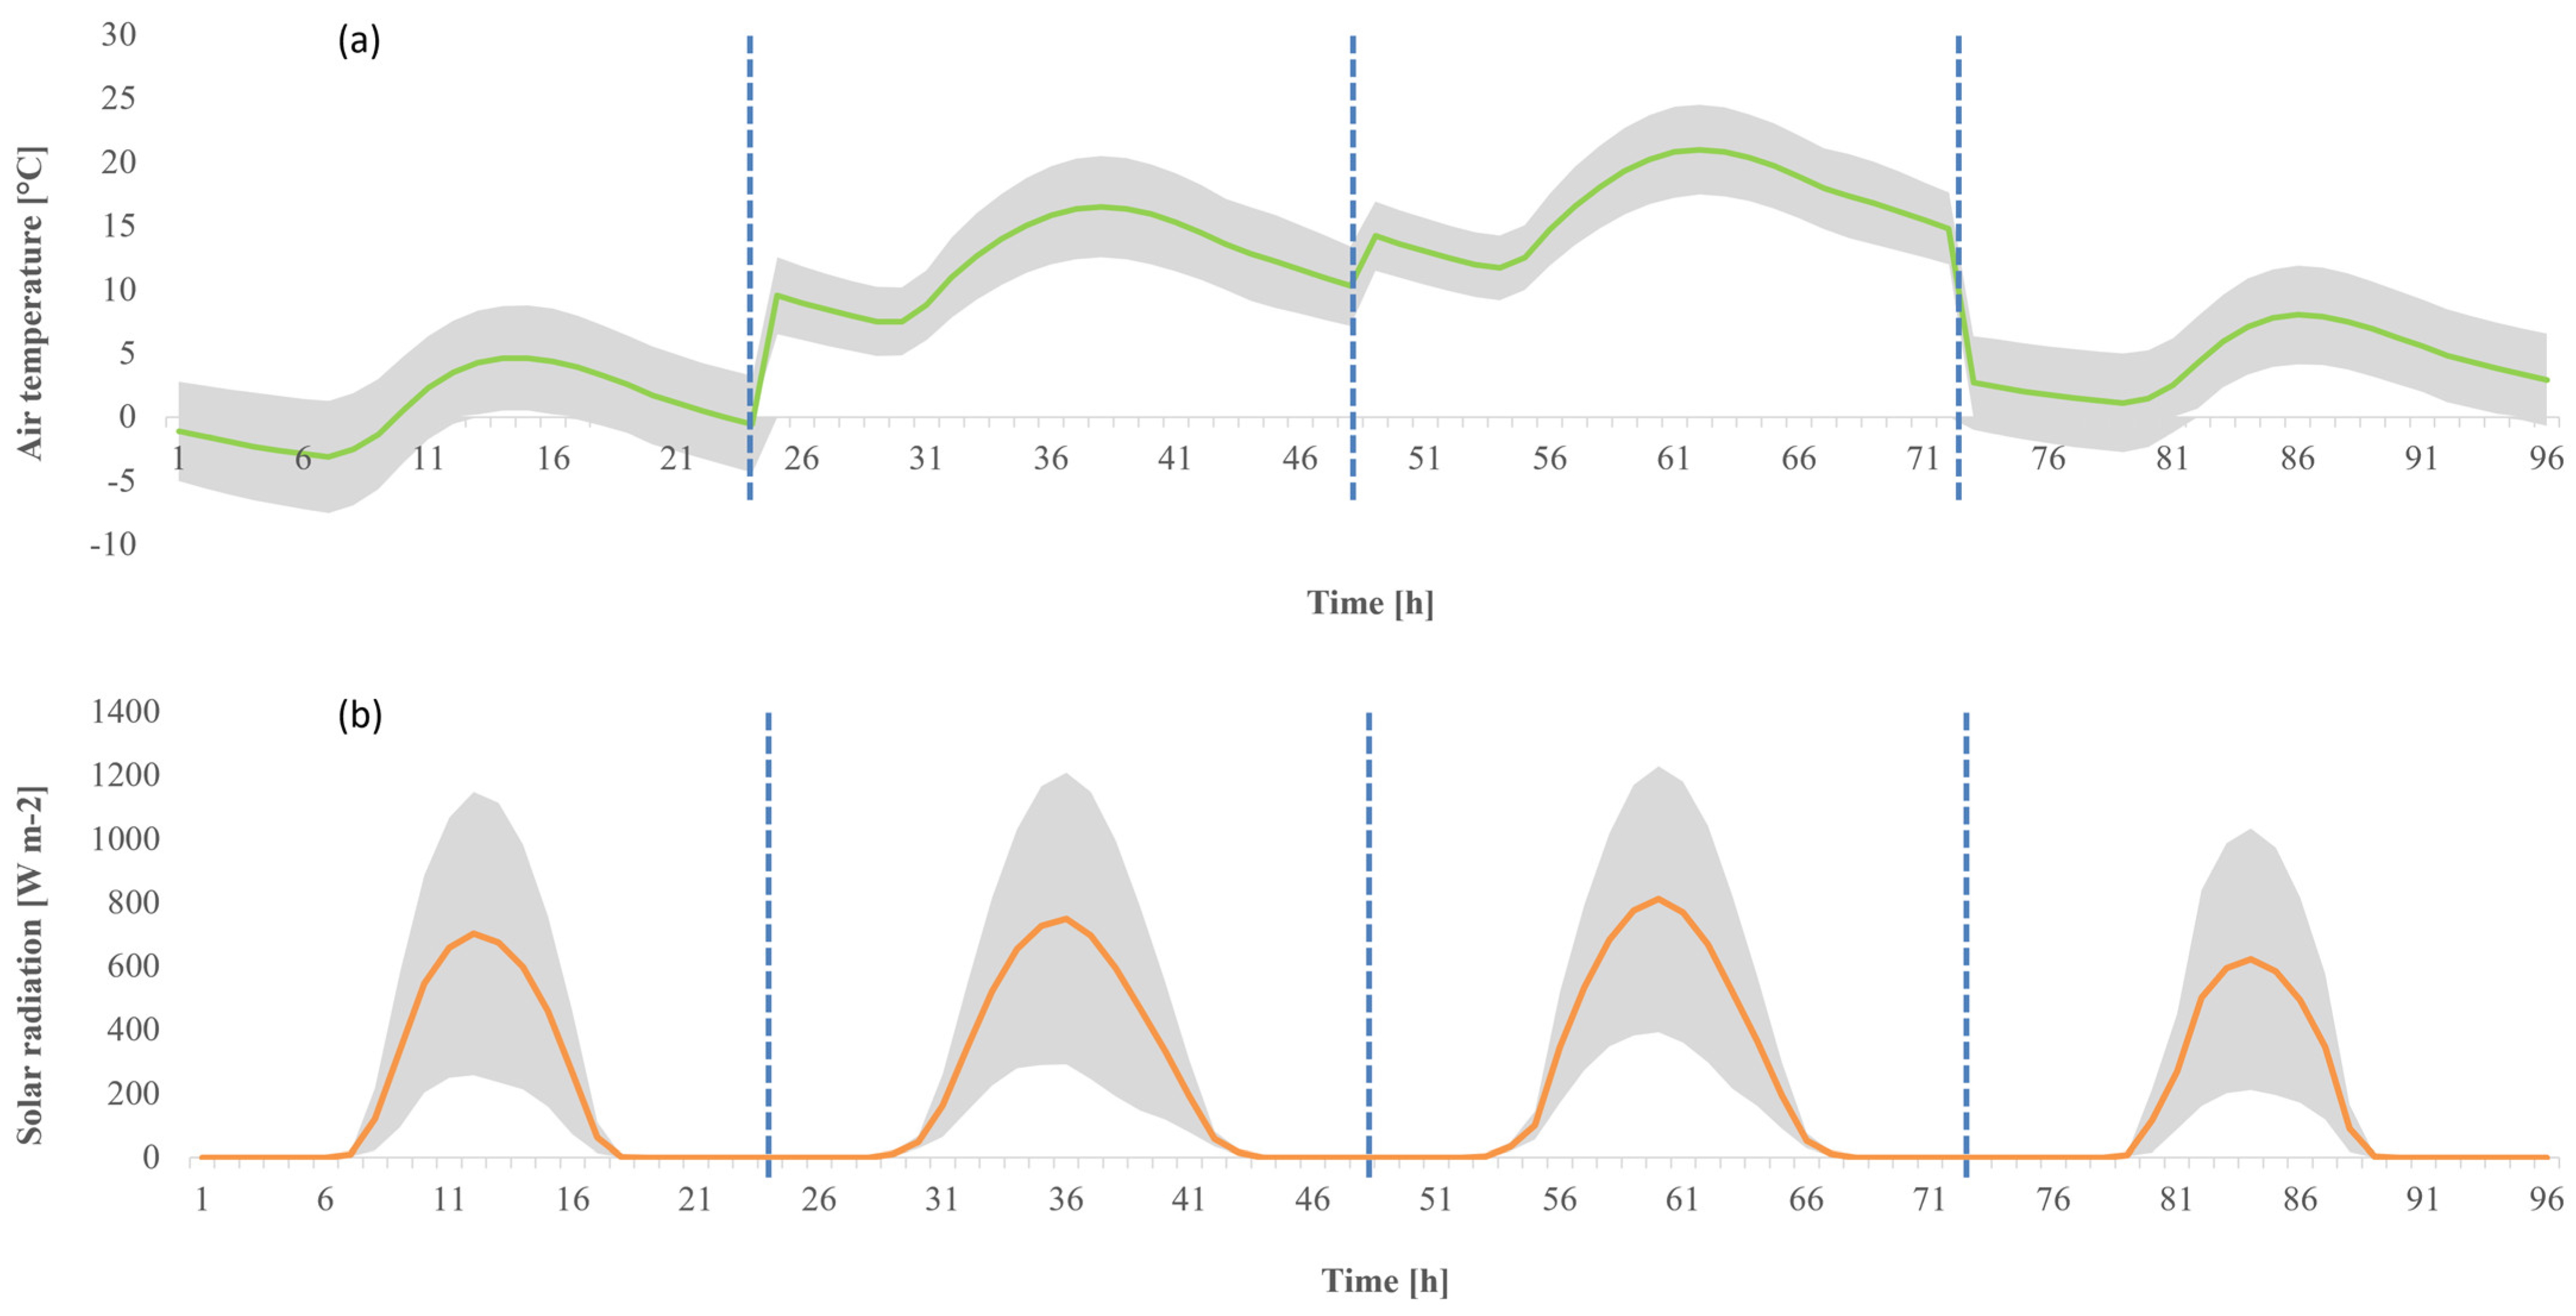
The local renewable production was estimated as a mix of photovoltaic, concentrated solar power, and solar thermal collector. The energy production of these systems depends on the solar radiation (only the beam component for CSP) and on the air temperature. These data were gathered from the PVGIS database for the city of Bolzano in the period between 2005 and 2020 and then elaborated to obtain average values and standard deviations. These quantities are illustrated in Figure 3 for the seasonal standard days.
Areas shown in grey in Figure 2 and Figure 3 represent the ranges within which air temperature and solar radiation values may lie due to uncertainty. Although they are more evident in Figure 2a,b and in Figure 3, both the space heating and cooling demands were also subject to an uncertainty rate.
Figure 2. Final demands of the energy hub with the average values in colored line and uncertainty interval in grey. (a) Hydrogen; (b) electrical energy [53]; (c) space heating [55]; (d) space cooling [55].
Energies 17 04422 g002
Figure 3. Outdoor conditions in the city of Bolzano with the average values in colored line and uncertainty interval in grey. (a) Air temperature and (b) global solar radiation (sum of beam, diffuse, and reflected components).
Energies 17 04422 g003
The parameters included in the EH model to describe the case study are recapped in Table 3 and Table 4. The parameters non-explicitly indicated in these tables were set equal to zero.

3. Results

3.1. Results for the Reference Case

The EH model allows to individuate the schedule of the energy flows in the four standard days, minimizing the weighted sum of the objective functions in the hub.
For the reference case (deterministic optimization), single-objective optimizations were initially performed, setting the weights of each objective function alternatively equal to one for the selected function and equal to zero for the other functions. In multi-objective optimization, equal weights were assigned to the four functions (0.25).
The results, in terms of the sizes of the various energy hub components and the values assumed by the objective functions, are shown in Table 5 and Table 6, respectively.
As can be seen, considering the specific techno-economic context described with the parameters in Table 3 and Table 4 and Figure 2 and Figure 3, the results in Table 5 regarding the equipment sizes indicate that some components should always be installed regardless of the objective function, although with different sizes. These components include the natural gas-fired boiler, heat pump, adsorption chiller, photovoltaic system, and electricity and heating thermal storage systems. The last two have the same values of rated size in all scenarios, equal to the upper limit set in the optimization algorithm for these components. This limit was set as proportional to each energy or mass annual final demand, although this value may sometimes represent a non-reasonable value, such as for the photovoltaic system or the electrical storage system.
The solar collector is considered only economically profitable, while it is disregarded according to the OFs. On the opposite, the CSP is both energy- and environmentally optimal although the high installation cost.
Regarding the objective functions shown in Table 6, the first evidence is that all the scenarios allow a huge improvement with respect to the non-optimized scenario, where all demands are met by the grid, with the exception of the minimum grid interaction, leading to the highest costs and primary energy caused by the massive installation of large-sized equipment. The multi-objective scenario proves to be a good compromise between the four OFs.
Moreover, as it might be expected, minimization of primary energy consumption and minimization of carbon emissions are closely related since the components that need to be installed are the same, and their respective sizes are almost equal. In both cases, however, the on-site production of hydrogen is practically negligible because the electrolyzer has a very small size, and almost the whole demand is satisfied by an external provider delivering hydrogen via tank truck. This is different than in the case of minimizing interactions with the grid, where the electrolyzer and fuel cell are present with very large sizes, helping to meet the demands for hydrogen, heat, and electricity. In multi-objective optimization, finally, the electrolyzer and fuel cell are considered, again, not advantageous.
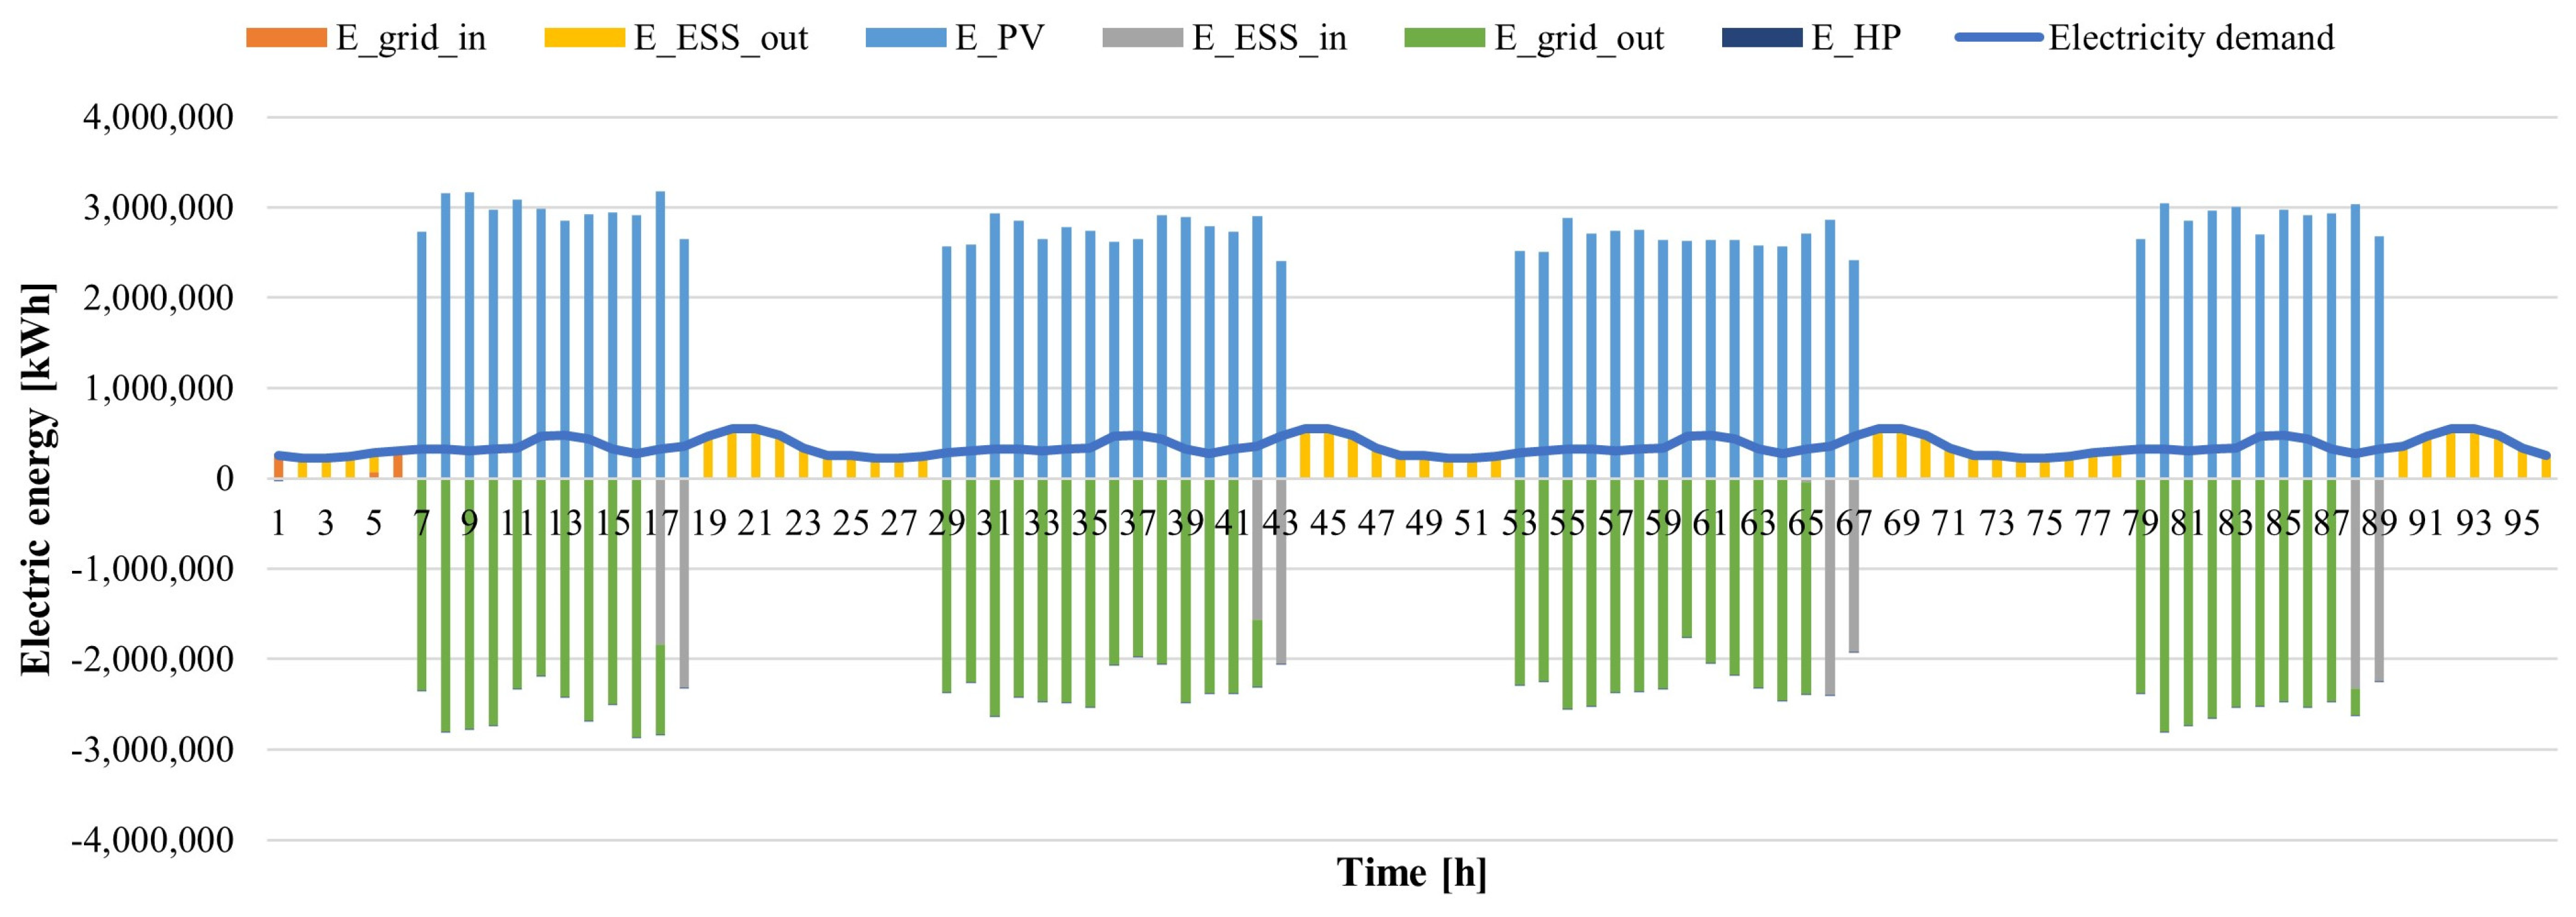
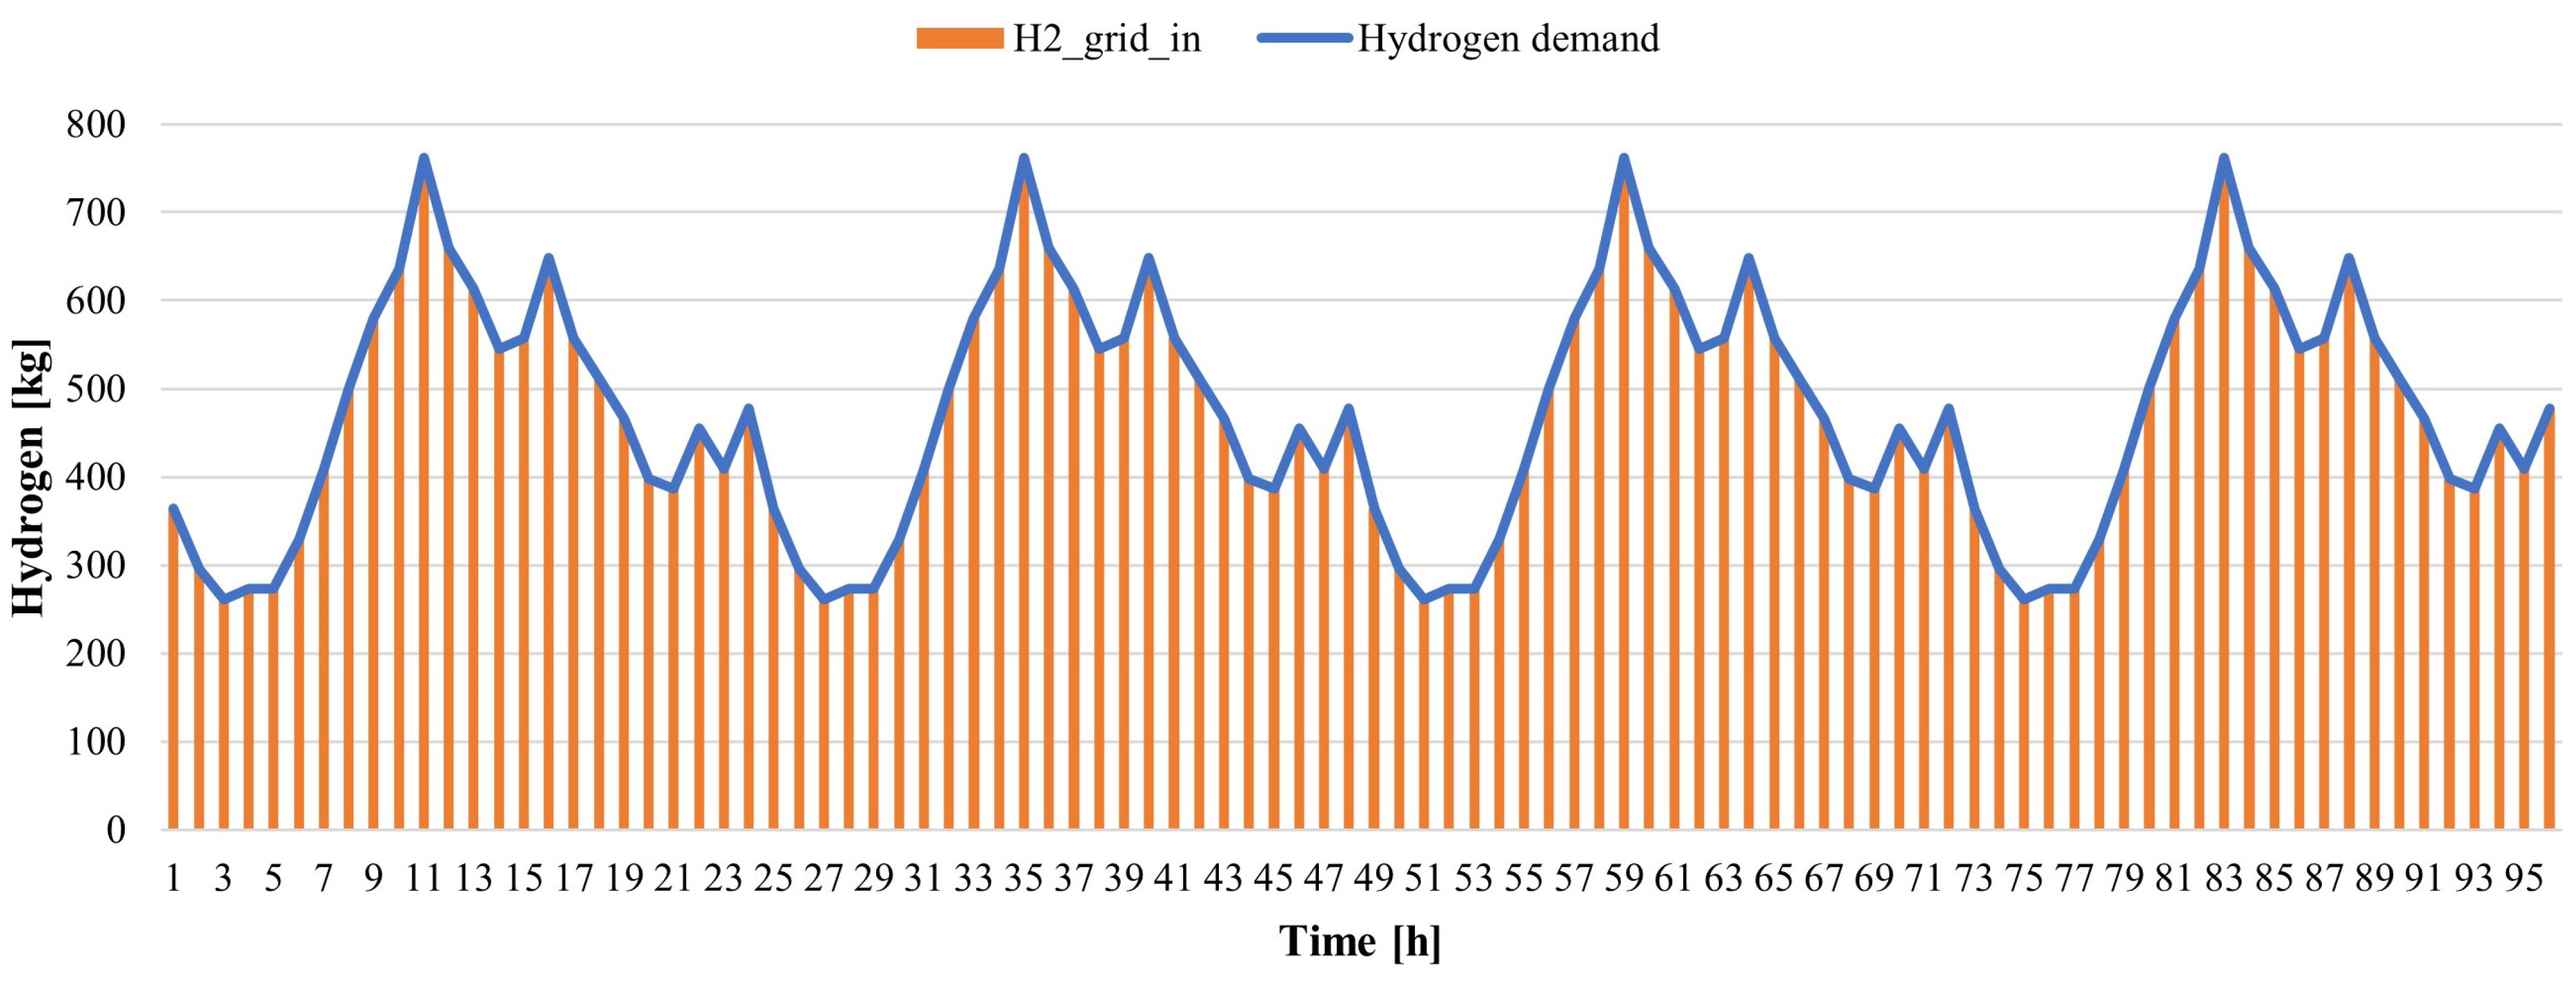
The graphical representation of electricity, heat, cooling, and hydrogen flow balances over the four seasonal standard days in the economic optimization case are shown in Figure 4, Figure 5, Figure 6 and Figure 7, respectively.
From the visual exam of these graphs, it is possible to see that, to achieve the lowest cost, the demand for electricity is covered almost entirely with energy supplied by the PV system and storage, with a large amount of excess energy being sold to the grid. Even in the case of cooling demand, the required energy is produced on-site through the adsorption chiller, with the excess sold to the grid. Cold energy storage, as opposed to heat storage, does not prove to be cost effective. Finally, hydrogen is taken totally from the grid, so installing the electrolyzer for on-site production is not cost effective.
The cost function, as seen in Table 6, takes a negative value in this case, so revenues due to the sale of excess energy carriers to the grid exceed expenditures.

3.2. Uncertainty Assessment

The design of distributed energy systems performed deterministically can lead to risks from suboptimal decisions due to the uncertainty of some parameters [63].
This section of the paper shows the results obtained by considering the uncertainty associated with electricity, heat, and hydrogen demands as well as with the air temperature and solar radiation. In addition to the four single-objective optimizations and the multi-objective optimization with equal weights for the four objective functions, additional multi-objective optimizations were performed with different weights associated with the various functions. For each optimization, 500 uncertain scenarios were assessed. This value was chosen since it proved to give the same results to the assessment of 5000 scenarios in term of average objective functions and mode of the rated sizes.
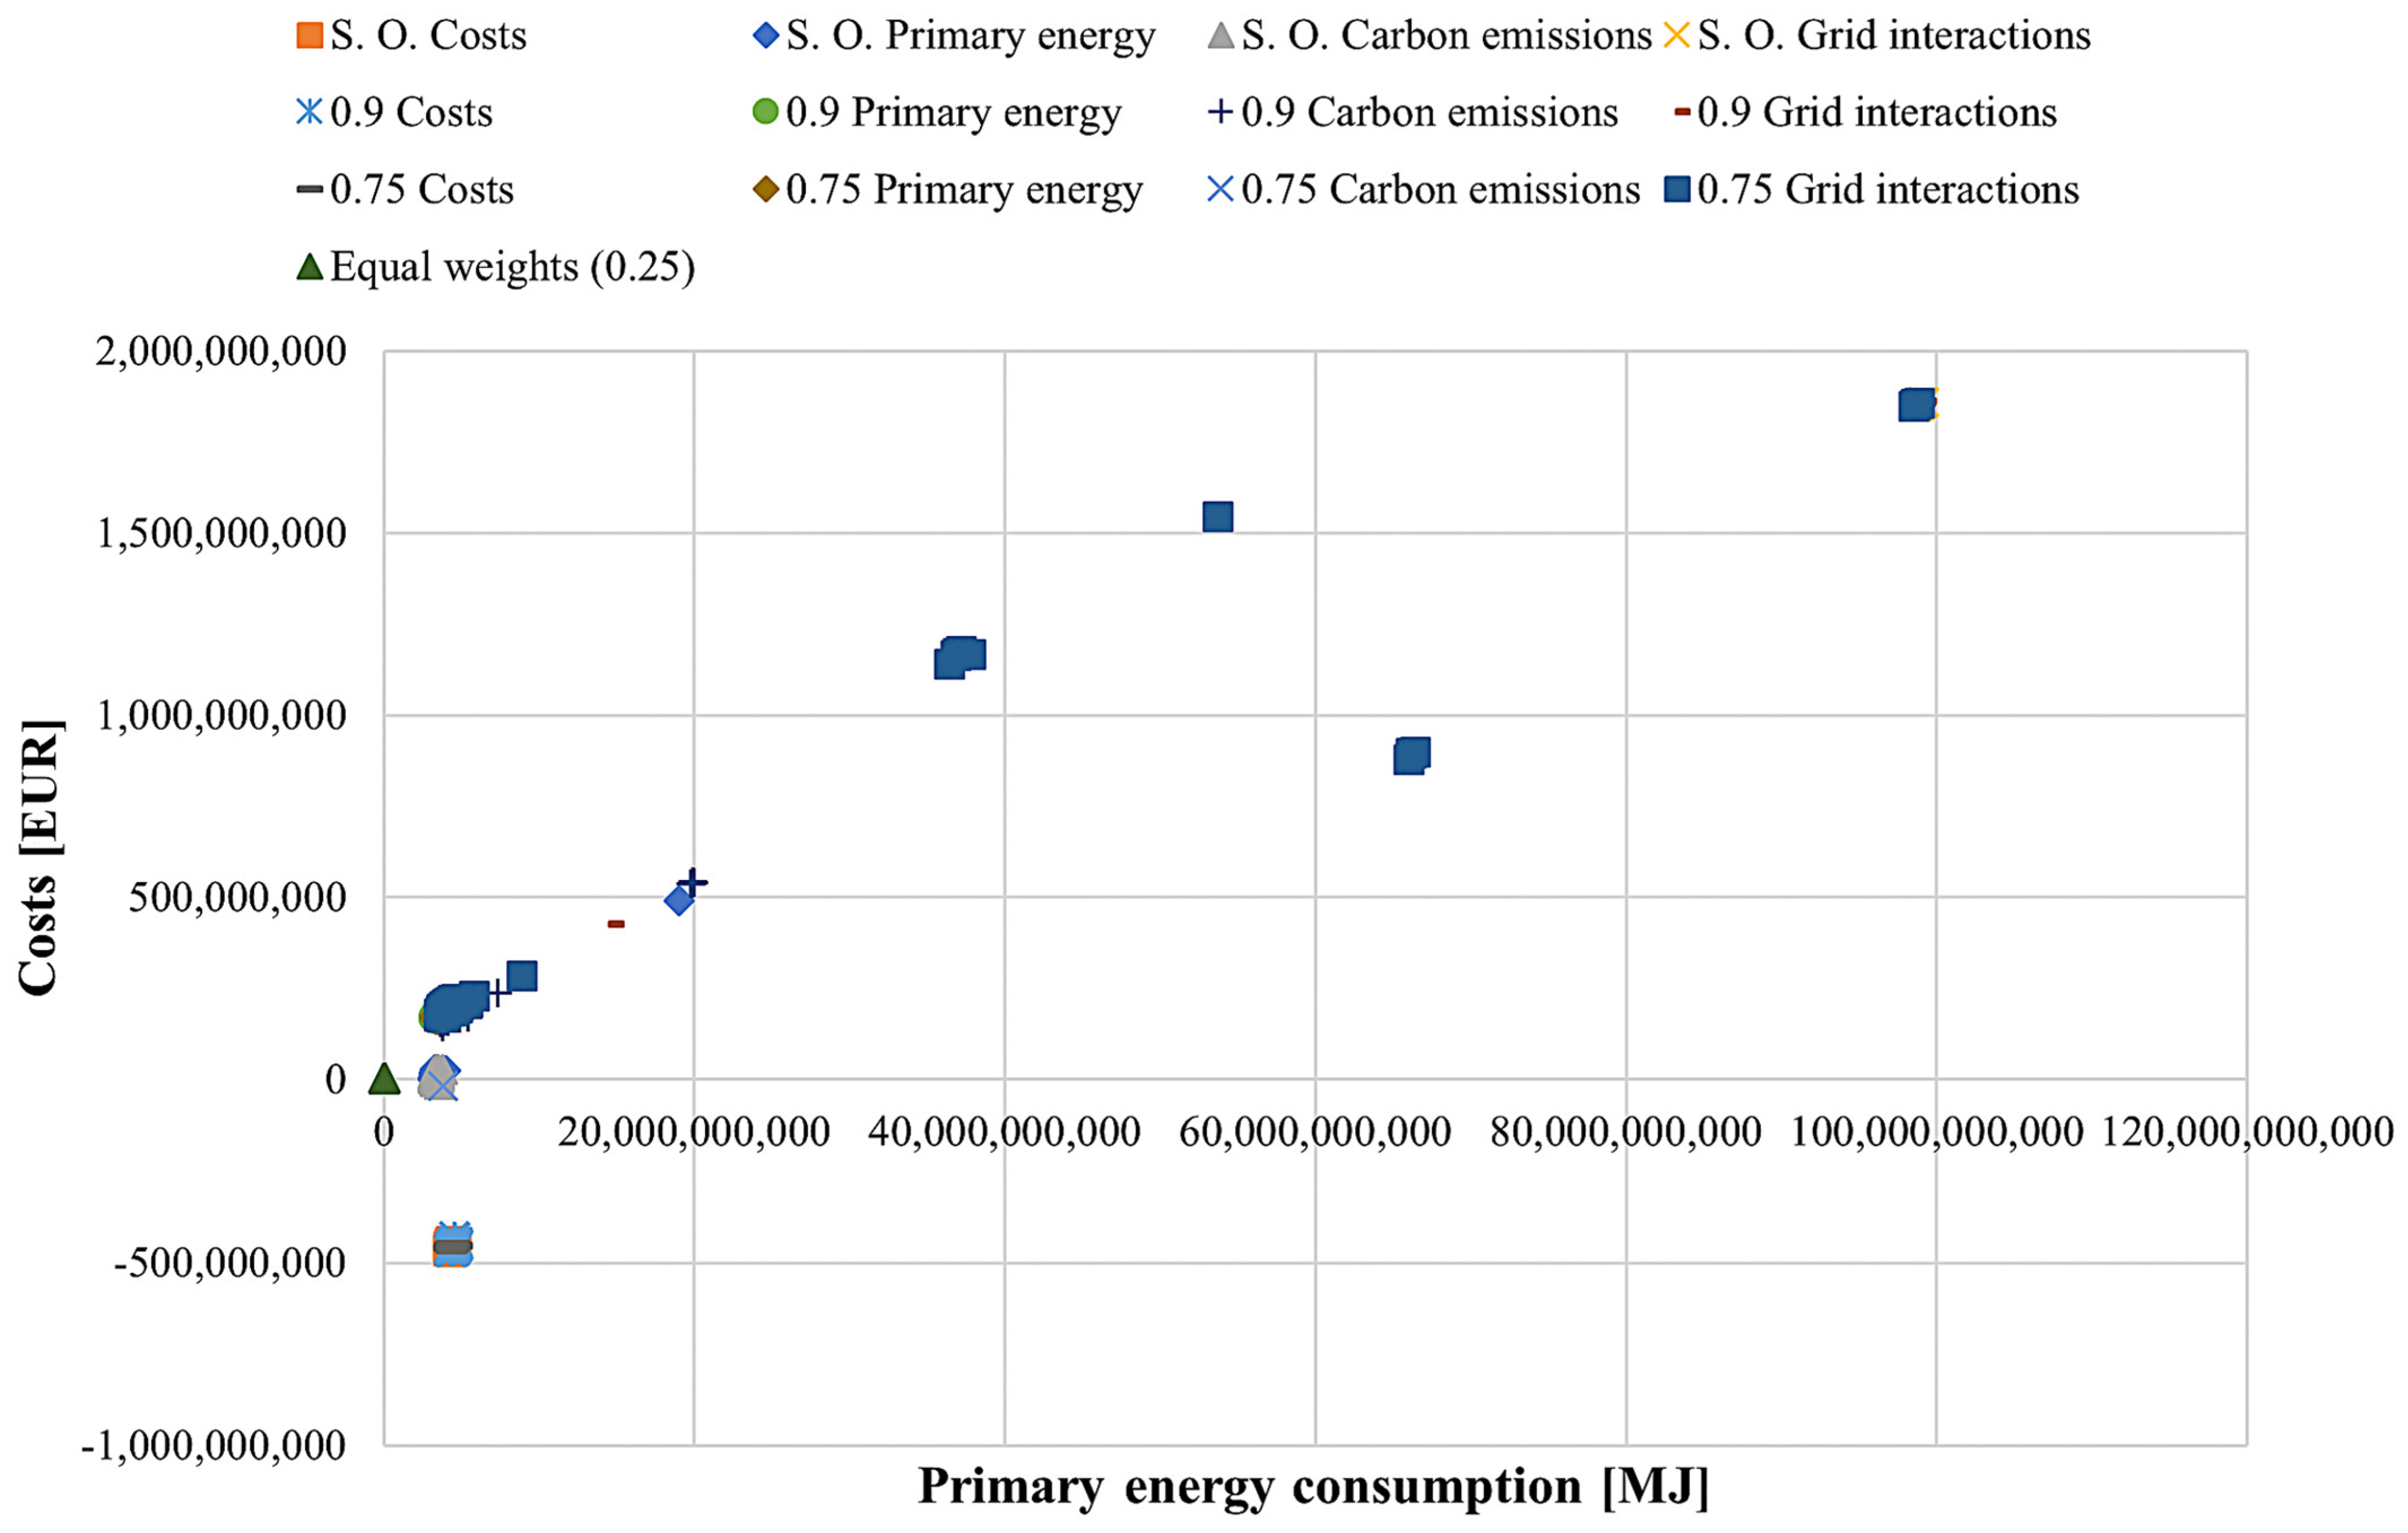
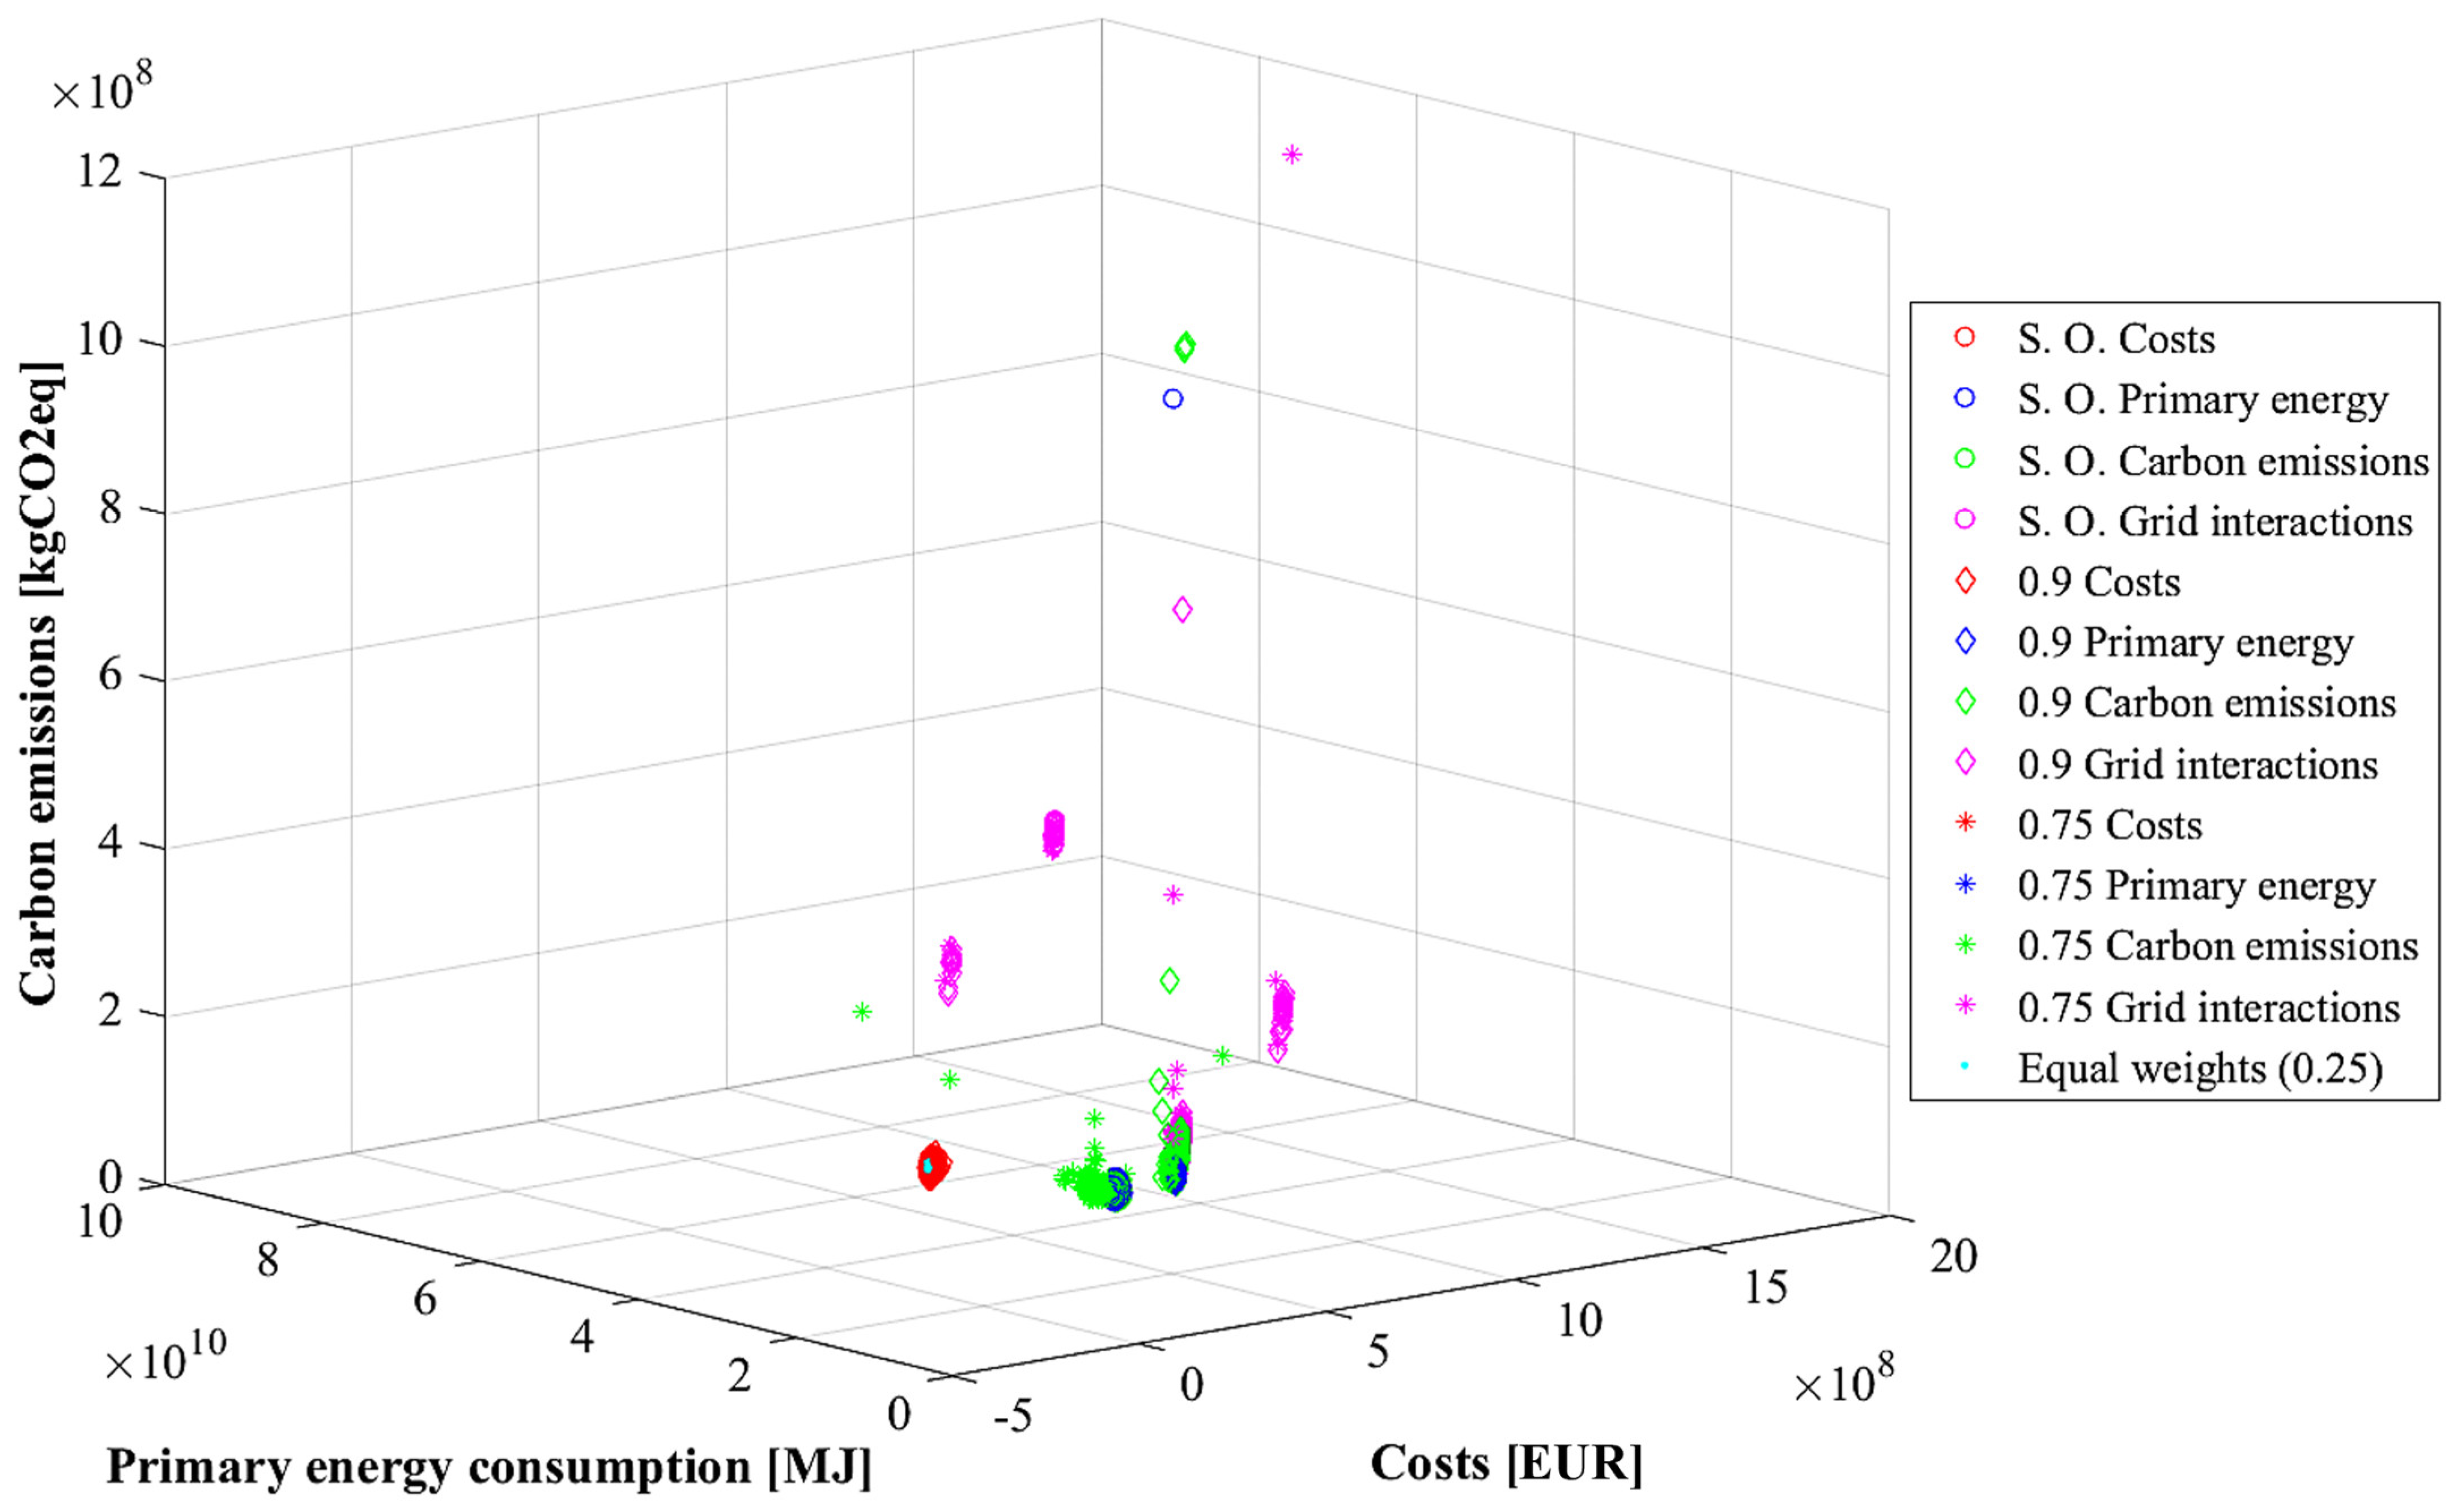
In Figure 8, Figure 9 and Figure 10, combinations of the objective functions of cost, primary energy consumption, and carbon emissions are depicted; interactions with the grids are not depicted because this is a penalty function devoid of physical meaning. Figure 11, on the other hand, shows the combinations of all three objective functions, also considering the values for the minimizations of grid interactions.
Table 7 shows the statistical mode of the sizes of the energy hub components obtained in the various uncertain scenarios compared with the sizes obtained in the case without uncertainty. The mode was selected as A statistical indicator to identify the best value out of the 500 uncertain scenarios since it represents the most common occurrence of a specific value in a set of data, providing a more useful indication that what the average value or median might give.
From the results shown in Table 7, the stochastic approach allows to confirm or, in many cases, to reduce the rated size of the components compared to the values obtained by the deterministic approach. Instead, Figure 11 shows that the adoption of a multi-objective perspective can deeply affect the results in terms of objective functions.
In terms of computational burden, on an average-performance personal computer, the uncertainty assessment resulted in a significant increase in simulation time, which increased from the few minutes required for the deterministic approach to several days (even a week) for the stochastic cases.

4. Discussion and Conclusions

In this paper, a framework to develop a constrained programming model to individuate the optimal rated size and schedule of a hydrogen-based energy hub is proposed. The model can fulfill the hydrogen, high- and low-temperature heating, cooling, electricity, and water demands of a final user. The optimization model illustrated in this work allows the optimal coordination of the components included in the EH in response to the fluctuation of the loads deriving from the electricity generation from RES.
The method was based on the energy hub model and is made up of linear equations in order to ensure the attainment of a unique optimal solution. The adoption of an EH model allowed to investigate new energy-saving potential and further flexibility deriving from the interactions between many energy vectors. The optimality of the solution was assessed using a multi-objective approach according to four criteria, considering economic, energy, environmental, and grid interaction issues. In this way, the consequences deriving from different points of view were investigated. Furthermore, including the uncertainty assessment of resources and demands in the optimal sizing approach ensured a higher level of reliability on the obtained solution.
To simulate the physical reality, the model needs several kinds of input data (typical energy and hydrogen demands, weather data, technical features of components, market data, and life-cycle assessment indicators) with the desired time horizon (e.g., one day or one year, hourly or daily variation, etc.).
The feasibility of the methodological framework was illustrated on a real-world case study representing current issues for the energy system. For the examined case, the deterministic optimization proved that the non-optimized scenario had a large improvement margin, reducing all the objective functions in all the cases. The unique exception was the minimization of the grid interactions, which forced oversizing all equipment to make the hub self-sufficient.
Furthermore, the optimality of the solution was deeply assessed through a study assessing the uncertainty associated with both energy carrier demands and renewable energy production. The results showed that, considering uncertainty, some components could be downsized, reducing the related investment costs as well as the embodied primary energy and embodied carbon emissions necessary for their manufacturing.
In detail, the results showed that the installation of electrolyzers for hydrogen production is useful only when minimizing interactions with the grid and, to a small extent, when minimizing primary energy consumption and carbon dioxide emissions. In other cases, however, namely the economic and multi-objective optimization, the installation of electrolysis plants is not beneficial. This helps us understand how fundamental it is to invest in the research of materials and methodologies that can allow a reduction in the costs of electrolyzers and fuel cells.
In future work, the model will be applied to different kind of energy systems and socioeconomic scenarios to assess the potential benefits deriving from the introduction of hydrogen in other systems, like hard-to-abate industrial sectors or the curtailment of renewable energy during congestions in HV lines. Moreover, a deeper multi-objective optimization study might be developed, assessing more combinations of weights to the four objective functions. Finally, the results will be compared with an accurate simulation model able to verify how the simplifications introduced into a linear model might influence the final results.

Author Contributions

Conceptualization, F.M. (Fabio Massaro), M.L.D.S., M.F., F.M. (Francesco Montana), E.R.S., and S.R.; methodology, F.M. (Fabio Massaro), M.L.D.S., F.M. (Francesco Montana), and E.R.S.; software, F.M. (Francesco Montana) and S.R.; formal analysis, M.L.D.S., M.F., F.M. (Francesco Montana), and S.R.; investigation, F.M. (Francesco Montana) and S.R.; data curation, F.M. (Fabio Massaro), F.M. (Francesco Montana), and S.R.; writing—original draft preparation, F.M. (Francesco Montana) and S.R.; writing—review and editing, F.M. (Fabio Massaro), M.L.D.S., M.F., F.M. (Francesco Montana), E.R.S., and S.R.; visualization, E.R.S. and S.R.; supervision, F.M. (Fabio Massaro), M.L.D.S., M.F., and E.R.S.; project administration, F.M. (Fabio Massaro), M.L.D.S., M.F., and E.R.S.; funding acquisition, F.M. (Fabio Massaro), M.L.D.S., M.F., and E.R.S. All authors have read and agreed to the published version of the manuscript.

Funding

This study was developed in the framework of the research activities carried out within the Project “Network 4 Energy Sustainable Transition—NEST”, Spoke 8: Final use optimization, sustainability\& resilience in energy supply chain, Project code PE0000021, Concession Decree No. 1561 of 11.10.2022 adopted by Ministero dell’Università e della Ricerca (MUR), CUP B73C22001280006. The project was funded under the National Recovery and Resilience Plan (NRRP), Mission 4 Component 2 Investment 1.3—Call for tender No. 341 of 15.03.2022 of Ministero dell’Università e della Ricerca (MUR), funded by the European Union—NextGenerationEU.

Data Availability Statement

The data presented in this study are available on request from the corresponding author.

Conflicts of Interest

The authors declare no conflicts of interest.

References

  1. IEA. Global Hydrogen Review 2022; IEA: Paris, France, 2022. [Google Scholar]
  2. Thapa, B.S.; Neupane, B.; Yang, H.S.; Lee, Y.H. Green Hydrogen Potentials from Surplus Hydro Energy in Nepal. Int. J. Hydrogen Energy 2021, 46, 22256–22267. [Google Scholar] [CrossRef]
  3. Holden, N.; Costa, D.; Guimarães Da Silva, M.; Maniscalco, M.P.; Longo, S.; Cellura, M.; Miccichè, G.; Ferraro, M. Critical Review of Life Cycle Assessment of Hydrogen Production Pathways. Environments 2024, 11, 108. [Google Scholar] [CrossRef]
  4. Ajanovic, A.; Sayer, M.; Haas, R. The Economics and the Environmental Benignity of Different Colors of Hydrogen. Int. J. Hydrogen Energy 2022, 47, 24136–24154. [Google Scholar] [CrossRef]
  5. Howarth, R.W.; Jacobson, M.Z. How Green Is Blue Hydrogen? Energy Sci. Eng. 2021, 9, 1676–1687. [Google Scholar] [CrossRef]
  6. Palmer, G.; Roberts, A.; Hoadley, A.; Dargaville, R.; Honnery, D. Life-Cycle Greenhouse Gas Emissions and Net Energy Assessment of Large-Scale Hydrogen Production via Electrolysis and Solar PV. Energy Environ. Sci. 2021, 14, 5113–5131. [Google Scholar] [CrossRef]
  7. Di Carlo, S.; Genna, A.; Massaro, F.; Montana, F.; Riva Sanseverino, E. Optimizing Renewable Power Management in Transmission Congestion. An Energy Hub Model Using Hydrogen Storage. In Proceedings of the 21st IEEE International Conference on Environment and Electrical Engineering and 2021 5th IEEE Industrial and Commercial Power System Europe, EEEIC/I and CPS Europe 2021—Proceedings, Bari, Italy, 7–10 September 2021. [Google Scholar] [CrossRef]
  8. Esquivel-Elizondo, S.; Hormaza Mejia, A.; Sun, T.; Shrestha, E.; Hamburg, S.P.; Ocko, I.B. Wide Range in Estimates of Hydrogen Emissions from Infrastructure. Front. Energy Res. 2023, 11, 1207208. [Google Scholar] [CrossRef]
  9. 2050 Long-Term Strategy—European Commission. Available online: https://climate.ec.europa.eu/eu-action/climate-strategies-targets/2050-long-term-strategy_en (accessed on 14 March 2024).
  10. Snam. The Hydrogen Challenge. The Potential of Hydrogen in Italy; Snam: Milan, Italy, 2019; pp. 1–13. [Google Scholar]
  11. Massaro, F.; Ferraro, M.; Montana, F.; Riva Sanseverino, E.; Ruffino, S. Techno-Economic Analysis of Clean Hydrogen Production Plants in Sicily: Comparison of Distributed and Centralized Production. Energies 2024, 17, 3239. [Google Scholar] [CrossRef]
  12. Terna; Snam. Documento Di Descrizione Degli Scenari 2022; Terna: Rome, Italy, 2022; pp. 1–87. [Google Scholar]
  13. European Commission. Commission Staff Working Document—Implementing The Repower EU Action Plan: Investment Needs, Hydrogen Accelerator And Achieving The Bio-Methane Targets; European Commission: Brussels, Belgium, 2022. [Google Scholar]
  14. Hydrogen City. Available online: https://www.ghi-corp.com/projects/hydrogen-city (accessed on 1 April 2024).
  15. Crainz, M.; Curto, D.; Franzitta, V.; Longo, S.; Montana, F.; Musca, R.; Sanseverino, E.R.; Telaretti, E. Flexibility Services to Minimize the Electricity Production from Fossil Fuels. A Case Study in a Mediterranean Small Island. Energies 2019, 12, 3492. [Google Scholar] [CrossRef]
  16. He, C.; Liu, T.; Wu, L.; Shahidehpour, M. Robust Coordination of Interdependent Electricity and Natural Gas Systems in Day-Ahead Scheduling for Facilitating Volatile Renewable Generations via Power-to-Gas Technology. J. Mod. Power Syst. Clean Energy 2017, 5, 375–388. [Google Scholar] [CrossRef]
  17. Zeng, Q.; Fang, J.; Li, J.; Chen, Z. Steady-State Analysis of the Integrated Natural Gas and Electric Power System with Bi-Directional Energy Conversion. Appl. Energy 2016, 184, 1483–1492. [Google Scholar] [CrossRef]
  18. Bai, L.; Li, F.; Cui, H.; Jiang, T.; Sun, H.; Zhu, J. Interval Optimization Based Operating Strategy for Gas-Electricity Integrated Energy Systems Considering Demand Response and Wind Uncertainty. Appl. Energy 2016, 167, 270–279. [Google Scholar] [CrossRef]
  19. Hang, L.; Yuqiang, W.; Yifan, Z.; Ming, Z.; Rulei, H.; Junfei, H. Using Hydrogen Energy Storage System to Improve Wind Power Consumption and Low Voltage Ride through Capability. In Proceedings of the 2021 IEEE Sustainable Power and Energy Conference: Energy Transition for Carbon Neutrality, iSPEC 2021, Nanjing, China, 23–25 December 2021; pp. 274–280. [Google Scholar] [CrossRef]
  20. Dadkhah, A.; Van Eetvelde, G.; Vandevelde, L. Optimal Investment and Flexible Operation of Power-to-Hydrogen Systems Increasing Wind Power Utilisation. In Proceedings of the 2022 IEEE International Conference on Environment and Electrical Engineering and 2022 IEEE Industrial and Commercial Power Systems Europe, EEEIC/I and CPS Europe 2022, Prague, Czech Republic, 28 June–1 July 2022. [Google Scholar] [CrossRef]
  21. Sun, W.; Harrison, G.P. Active Load Management of Hydrogen Refuelling Stations for Increasing the Grid Integration of Renewable Generation. IEEE Access 2021, 9, 101681–101694. [Google Scholar] [CrossRef]
  22. Ahmed, N.; Weber, H. Frequency Regulation by the Distributed Hydrogen Storage Power Plant (HSPP); IET: London, UK, 2022; pp. 497–502. [Google Scholar] [CrossRef]
  23. Wang, F.; Yang, H.; Yu, H.; Li, C.; Ren, W. Coordinated Optimization Model of the Wind Power Plant with Hydrogen Storage System and Demand Response. In Proceedings of the 5th IEEE Conference on Energy Internet and Energy System Integration: Energy Internet for Carbon Neutrality, EI2 2021, Taiyuan, China, 22–24 October 2021; pp. 1948–1954. [Google Scholar] [CrossRef]
  24. Liu, Z.; Liu, H.; Wang, S.; Ge, B.; Li, J.; Liu, S.; Gao, R.; Su, X. Fast Power Flow Calculation Method for Electricity Hydrogen Storage Integrated Energy Network. In Proceedings of the 5th IEEE Conference on Energy Internet and Energy System Integration: Energy Internet for Carbon Neutrality, EI2 2021, Taiyuan, China, 22–24 October 2021; pp. 1783–1788. [Google Scholar] [CrossRef]
  25. Sun, H.; He, C.; Yu, X.; Wu, M.; Ling, Y. Optimal Siting and Sizing of Hydrogen Refueling Stations Considering Distributed Hydrogen Production and Cost Reduction for Regional Consumers. Int. J. Energy Res. 2019, 43, 4184–4200. [Google Scholar] [CrossRef]
  26. Coveri, M.; Di Silvestre, M.L.; Ferraro, M.; Massaro, F.; Montana, F.; Sanseverino, E.R.; Ruffino, S. Economic Optimization of the Hydrogen Demand in a Hard-to-Abate Industrial Sector. In Proceedings of the 2023 Asia Meeting on Environment and Electrical Engineering (EEE-AM), Hanoi, Vietnam, 13 November 2023; pp. 1–6. [Google Scholar]
  27. Mokaramian, E.; Shayeghi, H.; Sedaghati, F.; Safari, A.; Alhelou, H.H. A CVaR-Robust-Based Multi-Objective Optimization Model for Energy Hub Considering Uncertainty and E-Fuel Energy Storage in Energy and Reserve Markets. IEEE Access 2021, 9, 109447–109464. [Google Scholar] [CrossRef]
  28. Heris, M.N.; Mirzaei, M.A.; Asadi, S.; Mohammadi-Ivatloo, B.; Zare, K.; Jebelli, H.; Marzband, M. Evaluation of Hydrogen Storage Technology in Risk-Constrained Stochastic Scheduling of Multi-Carrier Energy Systems Considering Power, Gas and Heating Network Constraints. Int. J. Hydrogen Energy 2020, 45, 30129–30141. [Google Scholar] [CrossRef]
  29. Kholardi, F.; Assili, M.; Lasemi, M.A.; Hajizadeh, A. Optimal Management of Energy Hub with Considering Hydrogen Network. In Proceedings of the 2018 International Conference on Smart Energy Systems and Technologies, SEST 2018—Proceedings, Seville, Spain, 10–12 September 2018; pp. 5–10. [Google Scholar] [CrossRef]
  30. Zhang, W.; Han, D.; Sun, W.; Li, H.; Tan, Y.; Yan, Z.; Dong, X. Optimal Operation of Wind-Solar-Hydrogen Storage System Based on Energy Hub. In Proceedings of the 2017 IEEE Conference on Energy Internet and Energy System Integration (EI2), Beijing, China, 26–28 November 2017. [Google Scholar]
  31. Geng, S.; Vrakopoulou, M.; Hiskens, I.A. Optimal Capacity Design and Operation of Energy Hub Systems. Proc. IEEE 2020, 108, 1475–1495. [Google Scholar] [CrossRef]
  32. Nasir, M.; Rezaee Jordehi, A.; Tostado-Véliz, M.; Mansouri, S.A.; Sanseverino, E.R.; Marzband, M. Two-Stage Stochastic-Based Scheduling of Multi-Energy Microgrids with Electric and Hydrogen Vehicles Charging Stations, Considering Transactions through Pool Market and Bilateral Contracts. Int. J. Hydrogen Energy 2023, 48, 23459–23497. [Google Scholar] [CrossRef]
  33. Mansour-Saatloo, A.; Agabalaye-Rahvar, M.; Mirzaei, M.A.; Mohammadi-Ivatloo, B.; Abapour, M.; Zare, K. Robust Scheduling of Hydrogen Based Smart Micro Energy Hub with Integrated Demand Response. J. Clean. Prod. 2020, 267, 122041. [Google Scholar] [CrossRef]
  34. Daneshvar, M.; Mohammadi-Ivatloo, B.; Zare, K. An Innovative Transactive Energy Architecture for Community Microgrids in Modern Multi-Carrier Energy Networks: A Chicago Case Study. Sci. Rep. 2023, 13, 1529. [Google Scholar] [CrossRef] [PubMed]
  35. Zhang, R.; Chen, Y.; Li, Z.; Jiang, T.; Li, X. Two-Stage Robust Operation of Electricity-Gas-Heat Integrated Multi-Energy Microgrids Considering Heterogeneous Uncertainties. Appl. Energy 2024, 371, 123690. [Google Scholar] [CrossRef]
  36. Jiang, Y.; Ren, Z.; Li, W. Committed Carbon Emission Operation Region for Integrated Energy Systems: Concepts and Analyses. IEEE Trans. Sustain. Energy 2024, 15, 1194–1209. [Google Scholar] [CrossRef]
  37. Geidl, M.; Andersson, G. Optimal Power Flow of Multiple Energy Carriers. IEEE Trans. Power Syst. 2007, 22, 145–155. [Google Scholar] [CrossRef]
  38. Genna, A.; Di Carlo, S.; Massaro, F.; Montana, F.; Riva Sanseverino, E. Optimizing the Generation System in a Microgrid with Power, Thermal Energy and Mobility Demands. In Proceedings of the 21st IEEE International Conference on Environment and Electrical Engineering and 2021 5th IEEE Industrial and Commercial Power System Europe, EEEIC/I and CPS Europe 2021—Proceedings, Bari, Italy, 7–10 September 2021. [Google Scholar] [CrossRef]
  39. Tebibel, H. Methodology for Multi-Objective Optimization of Wind Turbine/Battery/Electrolyzer System for Decentralized Clean Hydrogen Production Using an Adapted Power Management Strategy for Low Wind Speed Conditions. Energy Convers. Manag. 2021, 238, 114125. [Google Scholar] [CrossRef]
  40. Huo, D.; Gu, C.; Yang, G.; Blond, S. Le Combined Domestic Demand Response and Energy Hub Optimisation with Renewable Generation Uncertainty. Energy Procedia 2017, 142, 1985–1990. [Google Scholar] [CrossRef]
  41. Favre-Perrod, P.; Geidl, M.; Koeppel, G.; Klöckl, B.; Andersson, G.; Fröhlich, K. The energy hub—A powerful concept for future energy systems. In Proceedings of the Third Annual Carnegie Mellon Conference on the Electricity Industry, Pittsburgh, PA, USA, 13–14 March 2007. [Google Scholar]
  42. Geidl, M. Integrated Modeling and Optimization of Multi-Carrier Energy Systems; ETH Library: Zurich, Switzerland, 2007. [Google Scholar] [CrossRef]
  43. MATLAB Webpage—Intlinprog Algoritm. Available online: https://www.mathworks.com/help/optim/ug/intlinprog.html (accessed on 9 August 2024).
  44. Short, W.; Packey, D.J.; Holt, T. A Manual for the Economic Evaluation of Energy Efficiency and Renewable Energy Technologies; NREL: Golden, Colorado, 1995.
  45. Cannata, N.; Cellura, M.; Longo, S.; Montana, F.; Riva Sanseverino, E.; Luu, Q.L.L.; Nguyen, N.Q. Multi-Objective Optimization of Urban Microgrid Energy Supply According to Economic and Environmental Criteria. In Proceedings of the 2019 IEEE Milan PowerTech, PowerTech 2019, Milan, Italy, 23–27 June 2019; pp. 1–6. [Google Scholar]
  46. Burachik, R.S.; Kaya, C.Y.; Rizvi, M.M. A New Scalarization Technique and New Algorithms to Generate Pareto Fronts. SIAM J. Optim. 2017, 27, 1010–1034. [Google Scholar] [CrossRef]
  47. Zubo, R.H.A.; Mokryani, G.; Abd-Alhameed, R. Optimal Operation of Distribution Networks with High Penetration of Wind and Solar Power within a Joint Active and Reactive Distribution Market Environment. Appl. Energy 2018, 220, 713–722. [Google Scholar] [CrossRef]
  48. Faraji, J.; Hashemi-Dezaki, H.; Ketabi, A. Optimal Probabilistic Scenario-Based Operation and Scheduling of Prosumer Microgrids Considering Uncertainties of Renewable Energy Sources. Energy Sci. Eng. 2020, 8, 3942–3960. [Google Scholar] [CrossRef]
  49. Di Somma, M.; Buonanno, A.; Caliano, M.; Jin, L.; Rossi, M.; Graditi, G.; Comodi, G. Stochastic Energy Management for the Italian UNIVPM Campus as a Multi-Carrier Energy Hub Participating in the Day-Ahead Market. In Proceedings of the IEEE EUROCON 2023—20th International Conference on Smart Technologies, Torino, Italy, 6 July 2023; pp. 251–256. [Google Scholar]
  50. Ju, L.; Tan, Z.; Yuan, J.; Tan, Q.; Li, H.; Dong, F. A Bi-Level Stochastic Scheduling Optimization Model for a Virtual Power Plant Connected to a Wind–Photovoltaic–Energy Storage System Considering the Uncertainty and Demand Response. Appl. Energy 2016, 171, 184–199. [Google Scholar] [CrossRef]
  51. EN 15316-4-3:2017; Energy performance of buildings—Method for calculation of system energy requirements and system efficiencies—Part 4-3: Heat generation systems, thermal solar and photovoltaic systems, Module M3-8-3, M8-8-3, M11-8-3. European Committee for Standardization: Brussels, Belgium, 2017.
  52. Masterplan Idrogeno. Euregio Tirolo-Alto Adige-Trentino Corridoio Dell’idrogeno Lungo l’asse Del Brennero; Tyrol–South Tyrol–Trentino Euroregion: Bolzano, Italy, 2021. [Google Scholar]
  53. Terna. Annuario Statistico CONSUMI; Terna: Rome, Italy, 2020. [Google Scholar]
  54. GSE (Gestore dei Servizi Energetici). Nota Teleriscaldamento e Teleraffrescamento 2020; GSE: Rome, Italy, 2022. [Google Scholar]
  55. UNI 10349-3:2016; Riscaldamento e Raffrescamento Degli Edifici—Dati Climatici—Parte 3: Differenze Di Temperatura Cumulate (Gradi Giorno) Ed Altri Indici. UNI: Milan, Italy, 2016.
  56. European Union Joint Research Centre (JRC) European Reference Life Cycle Database (ELCD). Available online: https://nexus.openlca.org/database/ELCD (accessed on 28 April 2020).
  57. ARERA Prezzi Dell’energia Elettrica per Usi Industriali Nel 2021 (al Netto e al Lordo Delle Imposte)—Da 2.000 a 20.000 MWh Annui. Available online: https://www.arera.it/fileadmin/allegati/dati/ra21/eepcfr2.xlsx (accessed on 7 April 2024).
  58. ARERA Prezzi Finali Del Gas Naturale per i Consumatori Industriali Nel 2021—Utenti Con Consumi Da 260-2.600 Migliaia Di Metri Cubi Annui. Available online: https://www.arera.it/fileadmin/allegati/dati/gas/gpcfr2.xlsx (accessed on 7 April 2024).
  59. Enel X Web Page. Available online: https://www.enelxstore.com/it/it/prodotti/ (accessed on 7 April 2024).
  60. Biancardi, A. The Cost of Capital in the Energy and Water Sectors in Italy; ARERA: Milan, Italy, 2016. [Google Scholar]
  61. Beccali, M.; Cellura, M.; Longo, S.; Nocke, B.; Finocchiaro, P. LCA of a Solar Heating and Cooling System Equipped with a Small Water—Ammonia Absorption Chiller. Solar Energy 2012, 86, 1491–1503. [Google Scholar] [CrossRef]
  62. Mcmanus, M.C. Environmental Consequences of the Use of Batteries in Low Carbon Systems: The Impact of Battery Production. Appl. Energy 2012, 93, 288–295. [Google Scholar] [CrossRef]
  63. Mavromatidis, G.; Orehounig, K.; Carmeliet, J. Design of Distributed Energy Systems under Uncertainty: A Two-Stage Stochastic Programming Approach. Appl. Energy 2018, 222, 932–950. [Google Scholar] [CrossRef]
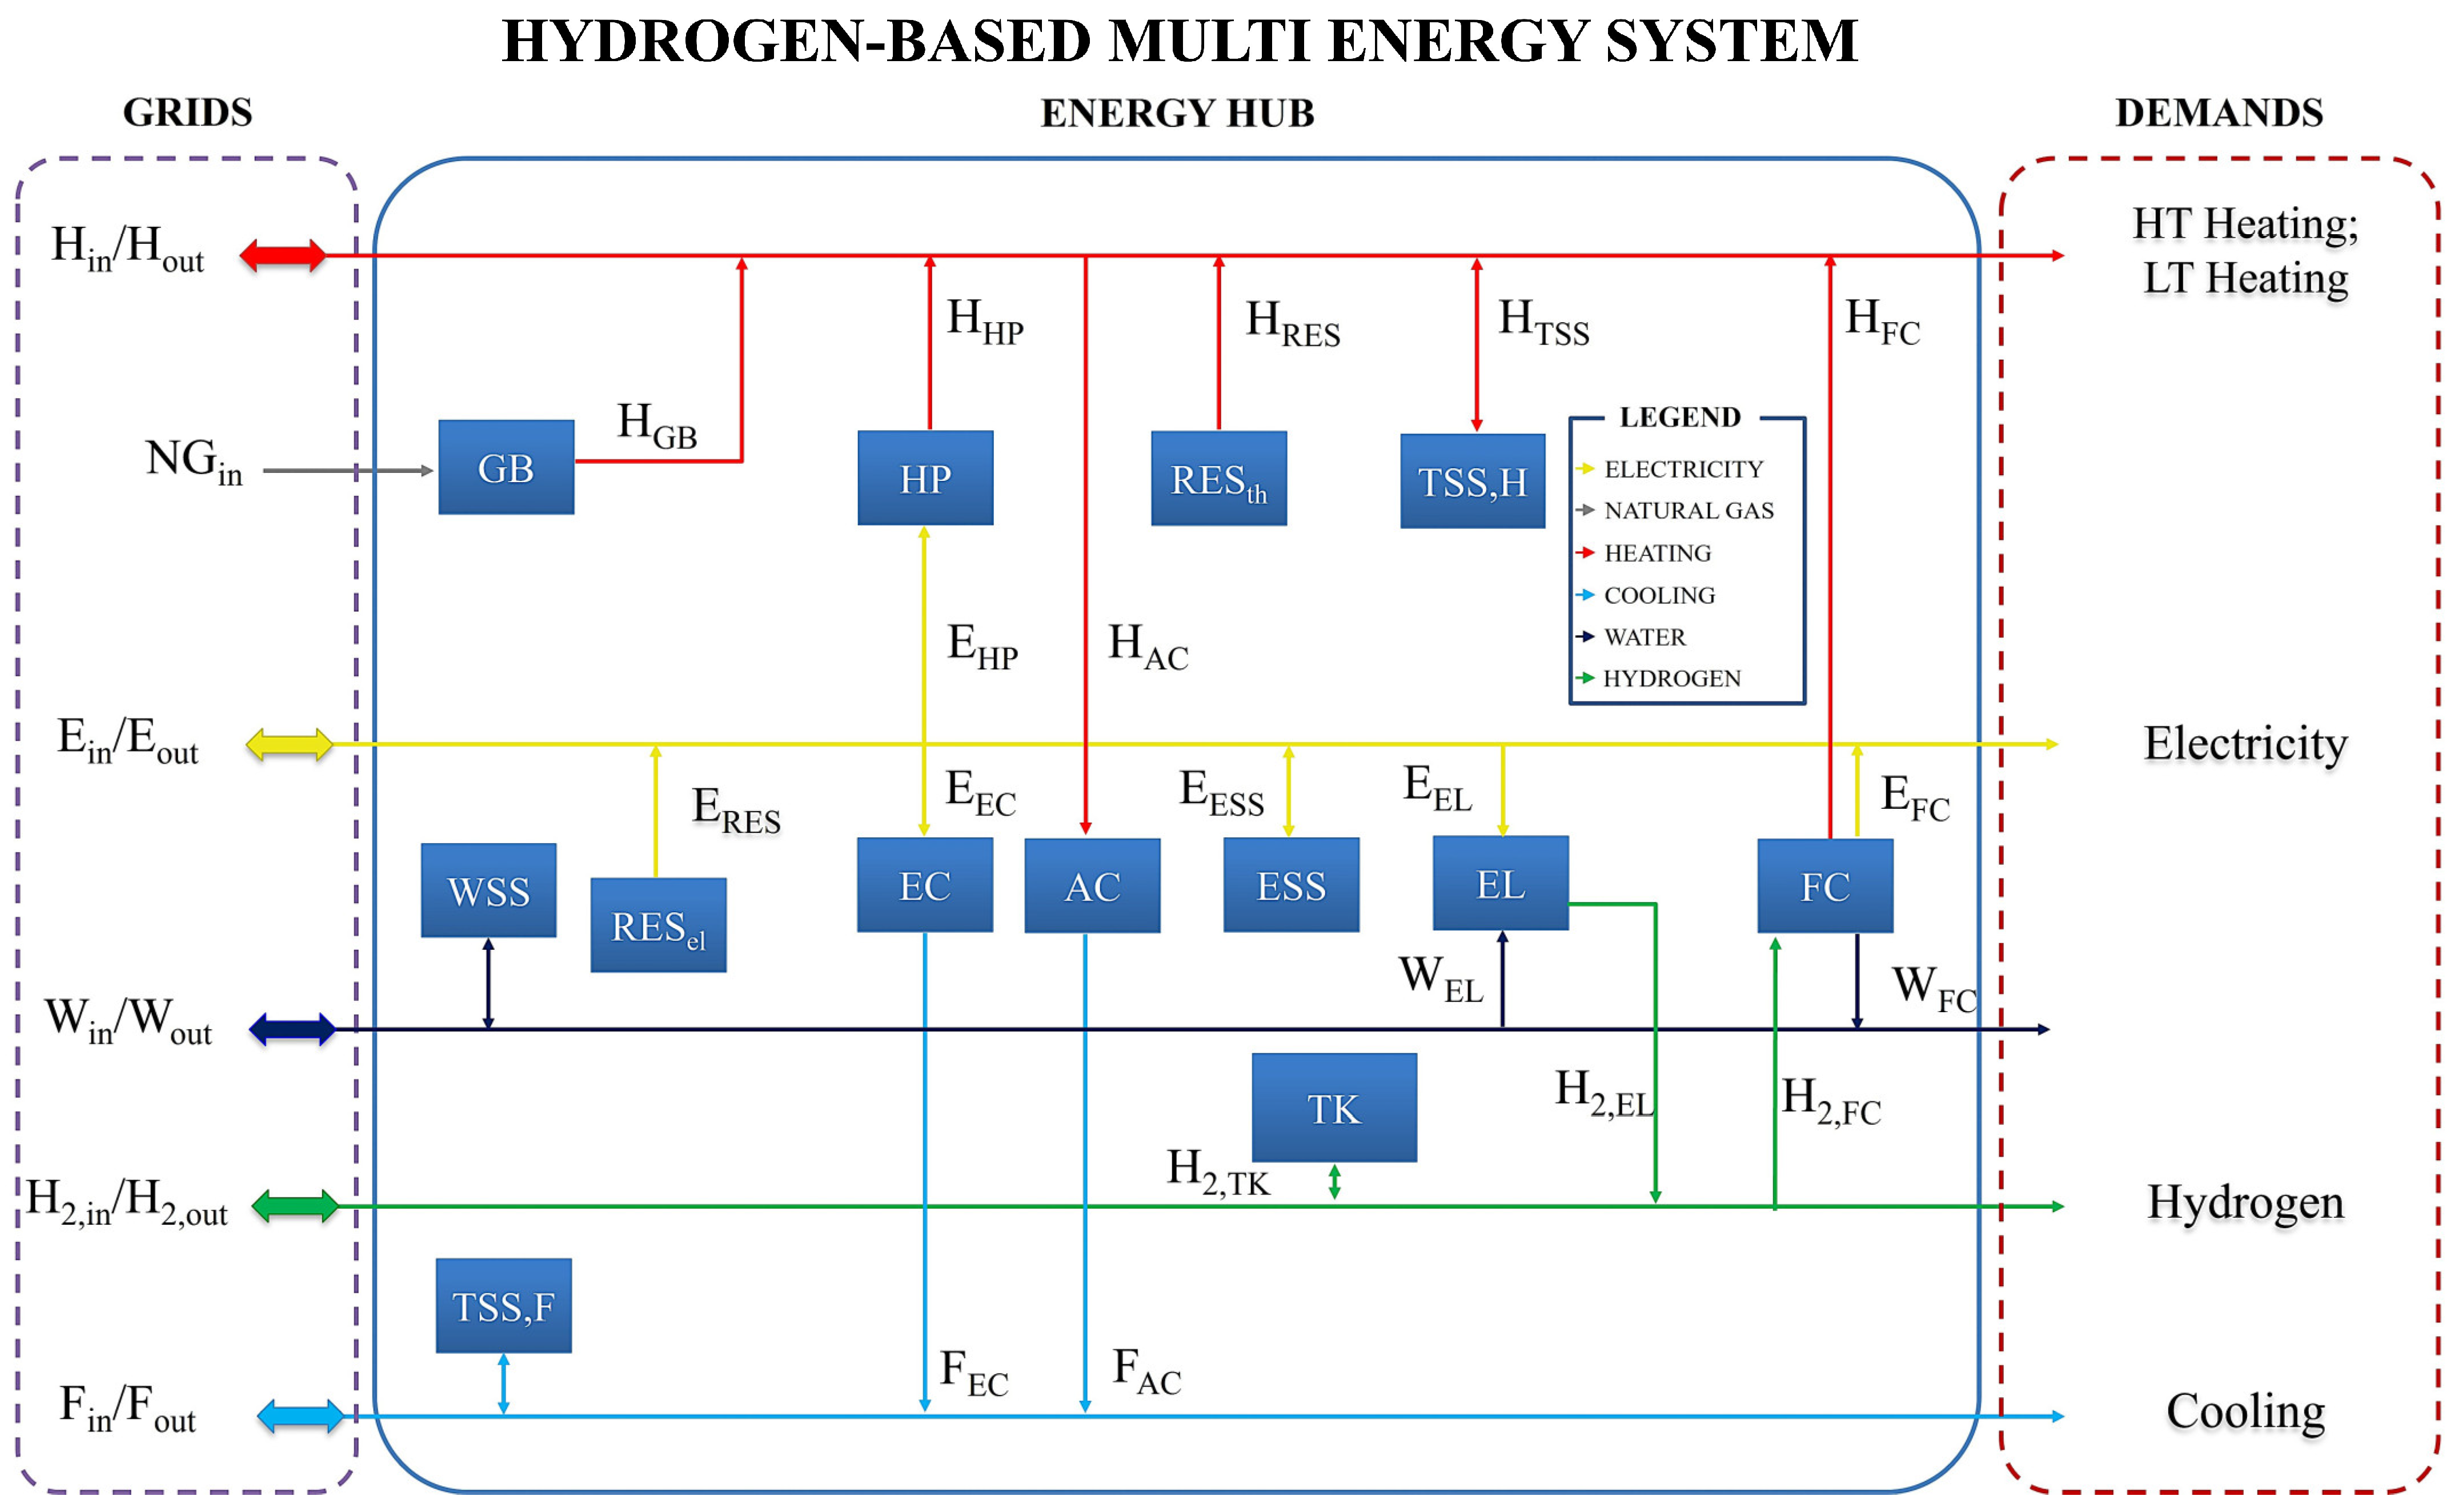
Figure 1. Schematic representation of the energy hub based on hydrogen analyzed in this study.
Energies 17 04422 g001
Figure 4. Electric energy flows in the case of economic optimization (heat pump contribution is too low for the scale).
Energies 17 04422 g004
Figure 5. Heat energy flows in the case of economic optimization (heat pump contribution is too low for the scale).
Energies 17 04422 g005
Figure 6. Cooling energy flows in the case of economic optimization.
Energies 17 04422 g006
Figure 7. Hydrogen flows in the case of economic optimization.
Energies 17 04422 g007
Figure 8. Costs against primary energy consumption for different scenarios.
Energies 17 04422 g008
Figure 9. Carbon emissions against primary energy consumption for different scenarios.
Energies 17 04422 g009
Figure 10. Costs against carbon emissions for different scenarios.
Energies 17 04422 g010
Figure 11. Combined values of cost, primary energy consumption, and carbon emissions resulting from different scenarios.
Energies 17 04422 g011
Table 1. Main Features of the Studies from the Literature Review.
Ref.OptimizationObjective Function/Main TargetHydrogenRenewable EnergiesFlexibility/Ancillary Services/Demand ResponsePhasesSensitivity or Uncertainty AssessmentMulti-Carrier (>2 Carriers)Mathematical Model
[19]NoWind curtailment (costs)YesYesNoOperationNoNoNonlinear
[7]YesWind curtailment (costs)YesYesNoOperationNoNoLinear
[20]YesCostsYesYesNoDesign and operationYes (Sensitivity)NoLinear
[21]NoCostsYesYesYesOperationNoNoLinear
[22]NoGrid interactionsYesYesYesOperationNoNoNonlinear
[23]YesCostsYesYesYesOperationNoNoMILP
[24]NoPower flowYesYesNoOperationNoNoNonlinear
[25]YesCostsYesNoNoDesignNoNoNonlinear
[26]YesCostsYesYesNoDesign and operationYes (Sensitivity)NoLinear
[27]YesCosts and emissionsYesYesYesOperationYes (Uncertainty)Yes (4)MINLP
[28]YesCostsYesYesNoOperationYes (Uncertainty)Yes (4)Nonlinear
[29]YesCosts and emissionsYesYesNoOperationNoYes (4)MILP
[30]YesCostsYesYesNoOperationNoYes (4)Linear
[31]YesCostsYesYesNoDesign and operationYes (Uncertainty)Yes (4)MILP
[32]YesCostsYesYesYesOperationYes (Uncertainty)Yes (4)MILP
[33]YesCostsYesYesYesOperationYes (Uncertainty)Yes (4)MILP
[34]YesCostsYesYesNoOperationYes (Uncertainty)Yes (5)MILP
[35]YesCostsYesYesNoOperationYes (Uncertainty)Yes (4)MILP
[36]YesEmissionsYesYesYesOperationYes (Uncertainty)Yes (5)MILP
This studyYesCosts, primary energy, emissions, grid interactionsYesYesYesDesign and operationYes (Uncertainty)Yes (7)MILP
Table 2. Abbreviations and Symbols.
AbbreviationMeaning
ACAbsorption chiller
BOPBalance of plant
CCost
CEDCumulative energy demand
CVaRConditional value at risk
DCDistrict cooling
DHDistrict heating
DHWDomestic hot water
EElectricity
EHEnergy hub
ELElectrolyzer
ESSElectrical energy storage
FCooling
FCFuel cell
GBGas-fired boiler
GWPGlobal warming potential
HHeating
H2Hydrogen
HPHeat pump
KConstant
MESMulti-carrier energy system
NGNatural gas
PEMFCProton exchange membrane fuel cell
RESRenewable energy source
TSSThermal energy storage
TKTank
TRTransformer
TSOTransmission system operator
WWater
Table 3. Main parameters related to the grids used for the case study [56,57,58].
Grid/NetworkCostsCEDGWPGrid Interactions
ECopex,E = 0.30 EUR/kWhelCEDE = 11.8 MJ/kWhGWPE = 0.071 kgCO2eq/kWh100,000
NGCopex,NG = 0.09 EUR/kWhthCEDNG = 4.12 MJ/kWhGWPNG = 0.037 kgCO2eq/kWh100,000
H---100,000
F---100,000
H2Copex,H2 = 20 EUR/kgCEDH2 = 213.52 MJ/kgGWPH2 = 11.95 kgCO2eq/kg100,000
WCopex,W = 2.19 EUR/kgCEDW = 0 MJ/kg
(negligible)
GWPW = 0 kgCO2eq/kg
(negligible)
100,000
Table 4. Main parameters related to the equipment used for the case study [26,56,59,60,61,62].
EquipmentConversion FactorsCostsCED [MJ/kWh or MJ/kg]GWP [kgCO2eq/kWh or kgCO2eq/kg]
GBKGB gh = 0.9Ccapex,GB = 55.51 EUR/kW
Ccapex,GB (0) = 118.8 EUR
92.6519.5
HPKHP eh = 5.7Ccapex,HP = 111.93 EUR/kW
Ccapex,HP (0) = 630.63 EUR
1250.4239.4
ACKAChf = 0.9Ccapex,AC = 216.9 EUR/kW2338.42147.5
ELKEL eh2 = 0.016 kg/kWh 1
KEL h2w = 8.55 kg/kg
Ccapex,EL = 1274 EUR/kW168,63528
FCKFC h2e = 12.23 kWh/kg
KFC h2h = 20.11 kWh/kg
KFC h2w = 9.47 kg/kg
Ccapex,FC = 1532.44 EUR/kW71,46611.87
PVNOCT = 47 °C
APV = 1.2 m2
ηPV = 0.21
β PV = −3.7 10−3 °C−1
ηBOP = 0.95
PPV = 0.25 kW/unit
Ccapex,PV = 311.95 EUR/unit4582358
CSPKCSP,se = 0.1394
KCSP,sh = 0.3964
ACSP = 400 m2
PCSP = 1000 kW/unit
Ccapex,CSP = 273,002.73 EUR/unit7210.63545.04
STCASTC = 1.867 m2
η0 = 0.734
a1 = 1.529 W/m2 K
a2 = 0.0166 W/m2 K2
Tm = 40 °C
Ccapex,STC = 500 EUR/unit3745.52210.56
TKKTK,in = 1
KTK,out = 1
H2 TK,loss = 0.02
Ccapex,TK = 171.33 EUR/kg
Ccapex,TK (0) = 716,859 EUR
3222.20.048
ESSKESS,in = 0.97
KESS,out = 0.97
ESS,loss = 0.01
DoDESS = 0.2
Ccapex,ESS = 419.37 EUR/kWh
Ccapex,ESS(0) = 677,502.83 EUR
54076.28
TSSKTSS,in = 1
KTSS,out = 1
TSS,loss = 0.01
Ccapex,TSS,H = 26.18 EUR/kWh
Ccapex,TSS,F = 65.46 EUR/kWh
Ccapex,TSS(0) = 266
CEDTSS,H = 201
CEDTSS,F = 504
GWPTSS,H = 11
GWPTSS,F = 27
1 including the power consumption to produce hydrogen (about 55 kWh/kg) and its compression to the tank pressure level of 500 bar (about 5 kWh/kg).
Table 5. Sizes of the energy hub components in the reference case.
Minimum CostMinimum Primary Energy ConsumptionMinimal Carbon EmissionsMinimal Grid Interactions0.25 Weights Multi-Objective Optimization
GB [kWth]37,87929,06529,064447,68129,065
HP [kWfr]51076390639063906390
AC [kWfr]6390636363906390
EL [kWel]073735,488,3360
FC [kWel]0005,488,3360
PV [n.]
PV [kW]
5,488,336
1,383,061
1,300,865
327,818
1,299,567
327,491
1,511,170
380,815
1,375,615
346,655
CSP [n.]
CSP [kW]
0
0
2
2000
2
2000
0
0
0
0
STC [n.]
STC [m2]
92
171.8
0
0
0
0
0
0
0
0
TK [kg]0007,6240
ESS [kWhel]5,488,3365,488,3365,488,3365,488,3365,488,336
TSSH [kWhth]447,681447,681447,681447,681447,681
TSSF [kWhfr]02902294463906390
Table 6. Objective functions in the reference case (values and percentage reduction with respect to the non-optimized scenario).
Non-Optimized Base ScenarioMinimum CostMinimum Primary Energy ConsumptionMinimal Carbon EmissionsMinimal Grid Interactions0.25 Weights Multi-Objective Optimization
Costs
[million euros/year]
1007−455.39
(−145%)
0.83
(−100%)
13.27
(−99%)
1818
(+81%)
190.6
(−81%)
Primary energy consumption [TJ/year]37,2524488
(−88%)
3369
(−91%)
3369
(−91%)
98,138
(+163%)
3965
(−89%)
Carbon emissions
[t CO2eq/year]
268,383236,642
(−12%)
173,588
(−35%)
173,289
(−35%)
194,924
(−27%)
209,702
(−22%)
Grid interaction penalty function [-]-1.3 × 10132.2 × 10122.2 × 10126.0 × 10103.7 × 1011
Table 7. Comparison between the mode of the sizes of the energy hub equipment among 500 uncertain scenarios and the sizes obtained in the cases without uncertainty.
Minimum CostMinimum Primary Energy ConsumptionMinimal Carbon EmissionsMinimal Grid Interactions0.25 Weights Multi-Objective Optimization
Without UncertaintyWith UncertaintyWithout UncertaintyWith UncertaintyWithout UncertaintyWith UncertaintyWithout UncertaintyWith UncertaintyWithout UncertaintyWith Uncertainty
GB [kWth]37,87934,69329,06527,87229,06427,821447,681447,68129,065447,681
HP [kWfr]5107510863906390639063906390639063906390
AC [kWfr]63906390636263626390639063906390
EL [kWel]00737373735,488,3365,488,33600
FC [kWel]0000005,488,3365,488,33600
PV [n.]5,488,3365,488,3361,300,8651,048,7261,299,5671,216,8721,511,1701,332,1431,375,6155,488,336
CSP [n.]0020220000
STC [n.]9218000000054.64
TK [kg]0000007624762400
ESS [kWhel]5,488,3365,488,3365,488,3365,488,3365,488,3365,488,3365,488,3365,488,3365,488,3365,488,336
TSSH [kWhth]447,681447,681447,681447,681447,681447,681447,681447,681447,681447,681
TSSF [kWhfr]0029020294452.226390639063900
Disclaimer/Publisher’s Note: The statements, opinions and data contained in all publications are solely those of the individual author(s) and contributor(s) and not of MDPI and/or the editor(s). MDPI and/or the editor(s) disclaim responsibility for any injury to people or property resulting from any ideas, methods, instructions or products referred to in the content.