Article

Machine Learning-Driven Quantification of CO2 Plume Dynamics at Illinois Basin Decatur Project Sites Using Microseismic Data

1
Department of Petroleum and Natural Gas Engineering, West Virginia University, Morgantown, WV 26506, USA
2
Department of Geology and Geography, West Virginia University, Morgantown, WV 26506, USA
3
Obsertelligence LLC, Aubrey, TX 76227, USA
*
Author to whom correspondence should be addressed.
Energies 2024, 17(17), 4421; https://doi.org/10.3390/en17174421
Submission received: 9 July 2024 / Revised: 26 August 2024 / Accepted: 2 September 2024 / Published: 3 September 2024
(This article belongs to the Section H: Geo-Energy)

Abstract

:
This study utilizes machine learning to quantify CO2 plume extents by analyzing microseismic data from the Illinois Basin Decatur Project (IBDP). Leveraging a unique dataset of well logs, microseismic records, and CO2 injection metrics, this work aims to predict the temporal evolution of subsurface CO2 saturation plumes. The findings illustrate that machine learning can predict plume dynamics, revealing vertical clustering of microseismic events over distinct time periods within certain proximities to the injection well, consistent with an invasion percolation model. The buoyant CO2 plume partially trapped within sandstone intervals periodically breaches localized barriers or baffles, which act as leaky seals and impede vertical migration until buoyancy overcomes gravity and capillary forces, leading to breakthroughs along vertical zones of weakness. Between different unsupervised clustering techniques, K-Means and DBSCAN were applied and analyzed in detail, where K-means outperformed DBSCAN in this specific study by indicating the combination of the highest Silhouette Score and the lowest Davies–Bouldin Index. The predictive capability of machine learning models in quantifying CO2 saturation plume extension is significant for real-time monitoring and management of CO2 sequestration sites. The models exhibit high accuracy, validated against physical models and injection data from the IBDP, reinforcing the viability of CO2 geological sequestration as a climate change mitigation strategy and enhancing advanced tools for safe management of these operations.

1. Introduction

The escalating concerns surrounding climate change and the associated rise in atmospheric carbon dioxide (CO2) levels necessitate the exploration of effective carbon capture and storage (CCS) solutions. The increasing concentration of CO2 and other greenhouse gasses in the atmosphere is a primary driver of global warming, leading to severe environmental consequences such as melting polar ice caps, rising sea levels, and more frequent and intense weather events [1]. As nations strive to meet international climate targets set by agreements such as the Paris Agreement, there is an urgent need to develop and implement technologies that can significantly reduce CO2 emissions from industrial sources [2].
Geological sequestration of CO2, involving the injection of CO2 into deep underground formations, has emerged as a promising strategy to mitigate greenhouse gas emissions [3,4]. This process entails capturing CO2 from emission sources, transporting it to a suitable geological site, and injecting it into deep rock formations such as depleted oil and gas fields, deep saline aquifers, or unmineable coal seams [3]. The CO2 is stored securely in these formations, preventing its release into the atmosphere and thus contributing to the reduction in overall atmospheric CO2 levels [5]. This method not only aids in mitigating climate change but also enhances the viability of fossil fuel-based industries by providing a pathway to reduce their carbon footprint.
The Illinois Basin Decatur Project (IBDP) stands at the forefront of such initiatives, offering a comprehensive dataset that includes well logs, microseismic activity records, and CO2 injection metrics [6]. Located in the Illinois Basin, the IBDP is one of the leading CCS demonstration projects globally, aiming to advance the understanding and implementation of CO2 sequestration technologies [7]. The project’s extensive dataset is invaluable for research and development in this field, providing detailed insights into the behavior of CO2 in the subsurface environment [8]. This dataset includes continuous monitoring of CO2 injection processes, capturing critical data on how the CO2 plume evolves over time within the geological formation [9].
In this study, we explore the application of machine learning methodologies to quantify the spatial extent of CO2 plumes by leveraging microseismic data and injection data obtained from the IBDP site, spanning from November 2011 to June 2018. Machine learning, a subset of artificial intelligence, involves the development of algorithms that can learn from and make predictions based on data [10]. By applying these advanced computational techniques to microseismic data from the IBDP, this research aims to accurately map and predict the movement of CO2 within the storage formation. Microseismic monitoring, which records the small-scale seismic events induced by CO2 injection, provides crucial information about the subsurface movements and the behavior of the injected CO2 [11]. The integration of machine learning with microseismic data analysis offers a powerful tool for enhancing the precision and reliability of CO2 plume monitoring and prediction [12,13].
Previous interpretations of microseismic events at the Illinois Basin Decatur Project (IBDP) site have varied. Some show events predominately in Mount Simon [14], while other interpretations show events concentrated in the basement [15]. It appears that it is unclear if the datum is the measured depth from the surface or if it is the sea level, although the data are reported as measured depth not subsea levels, suggesting that the data were recorded from the local surface (~675 feet). However, we believe the best interpretation aligns the observed data with fundamental physical principles like buoyancy effects. Aligning the majority of detected seismic events within the basement rather than the reservoir contradicts the expected behavior of buoyant CO2 displacing denser brine [16]. In similar projects, such as the Sleipner site, the expected buoyancy CO2 migration creates distinct seismic signatures in the subsurface layers [13,17].
To address these discrepancies, this study employs machine learning to reinvestigate and more accurately allocate CO2 saturation using seismic, geological, and operational data, including baffles, localized barriers, and injection logs. The primary goal is to enhance the accuracy and consistency of subsurface interpretations by integrating various data sources with advanced computational techniques.
For this study, we conducted a comprehensive well log analysis to identify baffles and fractures, utilizing both traditional well log techniques and advanced methods involving computer vision and deep learning [12]. Additionally, we explored the correlation between microseismic events and the densities of baffles and fractures, complemented by Pulsed Neutron Logging (PNL) to assess CO2 saturation distribution. We then analyzed the clustering and dynamics of microseismic events, both 2D and 3D, over time using unsupervised machine learning techniques, correlating these findings with three key data sources: fracture and baffle intensities, microseismic activity, and PNL-derived CO2 saturation distribution. Our analysis, supported by an invasion percolation model for CO2 migration and fundamental physical principles such as buoyancy effects, provides a coherent explanation of the observed CO2 plume dynamics and the corresponding microseismic signatures.

2. Materials and Methods

2.1. Illinois Basin Decatur Project Site

The Illinois Basin Decatur Project (IBDP), a key initiative of the Midwest Geological Sequestration Consortium (MGSC) and funded by the U.S. Department of Energy, successfully proved the potential for CO2 injection and storage in geological formations. The project’s primary goal was to inject 1 million tonnes of CO2, sourced from Archer Daniels Midland Company (ADM) in Decatur, IL, USA, into the Mt. Simon Sandstone at a depth of approximately 2100 m.
The Mt. Simon Sandstone, located within the Illinois Basin—a 155,000 square kilometer cratonic basin—is a significant saline reservoir with an estimated storage capacity ranging from 11 to 150 billion tonnes. Early geophysical studies conducted in 2007 confirmed the location’s suitability by detecting no faults that would render it unsuitable for CO2 storage [6].
The Mount Simon Sandstone, from the Cambrian period, is a vast and thick sandstone layer found extensively in the Midwestern United States, especially within the Illinois Basin. Its extensive regional spread and significant thickness make it an excellent choice for CO2 storage, offering a substantial and stable reservoir. At the Illinois Basin Decatur Project (IBDP) site, the Mount Simon Sandstone exceeds 457 m (1500 feet) in thickness. The upper section was formed in a tidally influenced environment, while the lower 183 m (600 feet) is composed of arkosic sandstone from a high-energy braided river or alluvial fan system, which provides excellent secondary porosity due to the dissolution of feldspar grains [18].
The Eau Claire Formation, which lies above the Mount Simon Sandstone, serves as the primary caprock. It is 212 m (695 feet) thick and mainly consists of shale with layers of fine-grained sandstones. Due to its low permeability and porosity, it acts as an effective barrier, preventing the upward migration of CO2 and ensuring the long-term stability and safety of the storage site. Together, the Mount Simon Sandstone and the Eau Claire Formation create a robust geological sequestration system, which is crucial for the success of the IBDP [19].
In November 2011, CO2 injection started after test wells were drilled and a compression plant was built. A variety of methods are used to closely monitor the injected CO2 to guarantee the efficiency and safety of the carbon storage operation. To make sure the CO2 stays confined, pressure monitoring is employed to track the movement and distribution of the CO2 within the storage reservoir, ensuring that it remains contained. In addition to microseismic monitoring, 3D seismic monitoring attempted to detect any potential leaks or movement of the CO2 underground [6]. Figure 1 shows The Illinois Basin Decatur Project site along with the location of major project elements. The red outline for the demonstration site is approximately 800 m (2600 ft) on the side. CCS1 is the injection well and VW1 is the monitoring well. The orange line is the CO2 pipeline extended to the compressors, shown as orange rectangles in the southeast corner of the image.

2.2. Subsurface Supercritical CO2 Transport and Storage Mechanisms

Supercritical CO2 is essential for carbon capture and storage (CCS) due to its liquid-like density and gas-like viscosity, enabling effective penetration and storage volumes in porous rock formations. Achieved at temperatures above 31.04 °C and pressures above 73.82 bar, it enhances fluid displacement and storage efficiency in deep saline aquifers and depleted reservoirs [20]. Temperature and pressure variations during CO2 injection influence its phase and interaction with formation water, affecting migration and distribution. These factors are critical for machine learning models analyzing microseismic data to map CO2 plumes and identify leakage pathways.
The fluid front is the interface between injected CO2 and resident fluids within the storage reservoir. Monitoring its progression helps calibrate models and detect anomalies, indicating potential storage risks or inefficiencies. Factors such as reservoir permeability, porosity, and pressure conditions influence the fluid front’s movement. As CO2 is injected, it displaces resident fluids, creating a moving front through porous rock formations.
Understanding fluid front behavior is crucial for effective CO2 storage [21]. A uniform and controlled fluid front maximizes reservoir utilization and prevents bypassing low-permeability zones, which can lead to inefficient storage and leakage risks. The heterogeneous nature of subsurface geology, including variations in rock permeability and the presence of faults and fractures, creates complex flow patterns affecting CO2 distribution.
Injection rate and pressure also play critical roles in shaping the fluid front [22]. High injection rates can advance the fluid front rapidly, risking low-permeability zone bypass and caprock fracturing, while controlled rates ensure uniform fluid displacement and enhanced storage security. Additionally, temperature differences between injected CO2 and formation fluids create thermal gradients that influence CO2 viscosity and density, impacting fluid front stability and behavior.
The buoyancy effect plays a critical role in CO2 behavior and stability during carbon capture and storage (CCS). Since supercritical CO2 is less dense than resident fluids such as formation brine, it rises and accumulates beneath caprock due to buoyant forces, despite gravity and capillary forces attempting to retain it [23]. In the Illinois Basin Decatur Project, supercritical CO2’s lower density compared to brine causes it to rise and spread toward the top of the Mt. Simon Sandstone, creating a distinct CO2–brine interface and facilitating CO2 migration to higher reservoir regions. This movement is influenced by reservoir permeability, porosity, and geological structures, which can redirect or impede CO2 flow. Microseismic monitoring tracks this buoyant migration, revealing areas of increased pressure and potential fracturing.

2.3. Importance of Natural Fractures and Baffles

Natural fractures and baffles at the Illinois Basin Decatur Project (IBDP) play a crucial role in understanding subsurface dynamics and optimizing CO2 sequestration. Baffles can impede vertical movement and concentrate lateral spreading of the CO2 front within a higher permeability thief zones. While fractures can enhance storage by increasing the contact area for processes like dissolution and mineral trapping, they also pose risks by providing potential pathways for CO2 leakage if they connect to overlying or adjacent permeable layers.
We have implemented advanced machine learning techniques, including computer vision and deep learning, and significantly improved the identification and analysis of these subsurface features. Within the measured depth interval, from 5371.5 feet to 7198 feet, of the Mount Simon Sandstone, 5875 baffles were identified [12]. As expected in a vertical well through an essentially flat lying cratonic formation, numerous fractures were not recognized. The numerous baffles highlight the potential influence of baffles and localized seals on the upward and lateral movement of buoyant CO2. Our results suggest an invasion percolation model for upward CO2 migration, where the CO2 plume trapped within sandstone intervals as highly saturated layers periodically breaks through barriers by overcoming gravity and capillary forces.

2.4. Microseismic Monitoring

Microseismic events, which are small-scale seismic activities, play a crucial role in monitoring subsurface dynamics in carbon capture and storage (CCS) projects [24]. These events provide essential data on the geomechanical responses of storage reservoirs to CO2 injection, helping to ensure site integrity and stability. During CO2 injection, increased pressure can induce microseismicity by altering stress distributions and potentially reactivating faults or fractures [22]. Sensitive seismic sensors detect these events, enabling precise localization and characterization [25]. Microseismic event location for monitoring CO2 injection can perturb the ambient stress field and trigger brittle failure on small fractures or faults [11,26]. These data help operators understand CO2 plume dynamics and maintain the structural integrity of storage sites.

2.5. Machine Learning in Seismic Data Analysis

Machine learning, especially unsupervised learning techniques such as clustering, is increasingly vital in geological studies and seismic data analysis [27,28,29,30]. These advanced computational methods uncover patterns and features within seismic data that traditional methods might miss, enhancing the ability to discern underlying geological structures and anomalies. Among these techniques, K-Means clustering is widely used [31], partitioning data into predefined clusters based on inherent features, which facilitates more accurate and insightful interpretations of complex datasets. Another valuable algorithm is DBSCAN (Density-Based Spatial Clustering of Applications with Noise), which identifies clusters of varying shapes and sizes while distinguishing noise from significant data points [32]. In this study, both K-Means and DBSCAN clustering techniques are optimized and implemented, and the outcomes are compared using the Silhouette Score and Davies–Bouldin Index.
We have also developed an opensource tool to visualize and analyze microseismic data using both K-Means and DBSCAN clustering techniques. This tool, accessible through an online dashboard, utilizes the Python programming language and packages such as NumPy and Pandas, offering data loading and processing functionalities, and is available at https://cz63dzvzquchsikhdpugsq.streamlit.app/ accessed on 8 July 2024. The dashboard accounts for varying time spans to detect CO2 plume pressure dynamics both laterally and vertically from the injection point. Additionally, the dashboard offers the option to optimize the K-Means and DBSCAN clustering techniques. Once the parameters are set, the workflow is applied to both datasets provided: “SLB Data" and "Relocated Data,”.

2.5.1. Data Collection and Visualization

We have used the dataset spanning from December 2011 to July 2018, which provides detailed information on microseismic events related to CO2 injection at the Illinois Basin Decatur Project (IBDP). The Mt. Simon Sandstone layers (A Lower, A Upper, B, C, and D) serve as the primary reservoir for CO2 injection, offering significant storage capacity due to their porosity and permeability. The dataset, provided in the Supplementary Materials, contains two sheets, "SLB Data" and "Relocated Data," each detailing microseismic events, including the following:
  • Origin Time: exact date and time of each microseismic event.
  • Horizontal Difference: horizontal displacement in feet from a reference point.
  • Depth Difference: vertical displacement in feet.
  • Total Difference: combined horizontal and vertical displacements.
  • Year/Mo. Category: categorizes events by year and month for temporal analysis.

2.5.2. Data Preprocessing and Feature Engineering

The initial step in this study involved comprehensive preprocessing of microseismic data to ensure reliability and accuracy for subsequent analyses. This included data cleaning, normalization, and feature extraction. Data cleaning addressed missing, incomplete, or erroneous entries, enhancing data quality. Normalization adjusted the data to a standard scale, ensuring equal contribution of all features in the clustering process. The key features considered were SLB Depth Difference (vertical displacement), SLB Horizontal Difference (horizontal movement), time of occurrence, and geological formations. Standardizing these features prevented any single feature from dominating the clustering process, allowing for balanced consideration of all seismic event aspects. This resulted in a well-prepared dataset for machine learning analysis, effectively contributing to identifying patterns and anomalies in CO2 plume dynamics.

2.5.3. Data Visualization

Data visualization modules were developed using Python and Streamlit to enable the visualization of depth difference data for selected datasets. The process involved selecting the time period of the investigation, selecting the data base, and choosing chart type.

2.5.4. Unsupervised Clustering Techniques

Unsupervised clustering techniques are essential tools in data analysis, allowing for the discovery of inherent patterns and structures within unlabeled datasets. Among the most widely used methods are K-Means and DBSCAN (Density-Based Spatial Clustering of Applications with Noise). The K-Means clustering section involves applying the K-Means algorithm to group similar data points in the dataset based on features like depth and horizontal differences. This unsupervised learning technique helps identify clusters of seismic line segments with similar characteristics, revealing potential geological formations or patterns within the seismic data. K-Means works by partitioning the data into a predefined number of clusters without prior knowledge of the labels
The DBSCAN clustering utilizes Density-Based Spatial Clustering of Applications with Noise (DBSCAN) on the dataset. This unsupervised learning technique identifies clusters based on density, effectively pinpointing areas with high microseismic activity and detecting outliers. Unlike K-Means, DBSCAN does not require pre-specifying the number of clusters. Instead, it uses two key parameters: epsilon (eps) and min_samples. Epsilon defines the radius around each point to assess density, while min_samples sets the minimum number of points within epsilon to form a dense region. DBSCAN is more effective in identifying clusters of arbitrary shapes and varying sizes, a flexibility not offered by K-Means, which assumes spherical clusters of similar sizes. By integrating both techniques, K-Means provides an initial partitioning of clusters, while DBSCAN refines these clusters by uncovering intricate patterns and isolating outliers. The Silhouette Score and Density-Based Clustering Validation (DBCV) Index are also used to evaluate the quality of the clustering and density separation between clusters [33].

3. Results

Clustering the microseismic events by time intervals revealed vertical distributions within restricted ranges away from the injection well. Within these clusters, the upward distance from the injection zone displayed a complex distribution of event frequencies and amplitudes. This pattern supports a model of periodic CO2 migration, where buoyant CO2 accumulates in thin, highly saturated layers within sandstone intervals. These layers periodically overcome gravity and capillary forces, breaching discrete barriers or baffles and allowing CO2 to migrate vertically through zones of weakness.
The following sections detail the application of machine learning clustering techniques and their validation with physical models, along with conventional analysis of microseismic events and well logs.

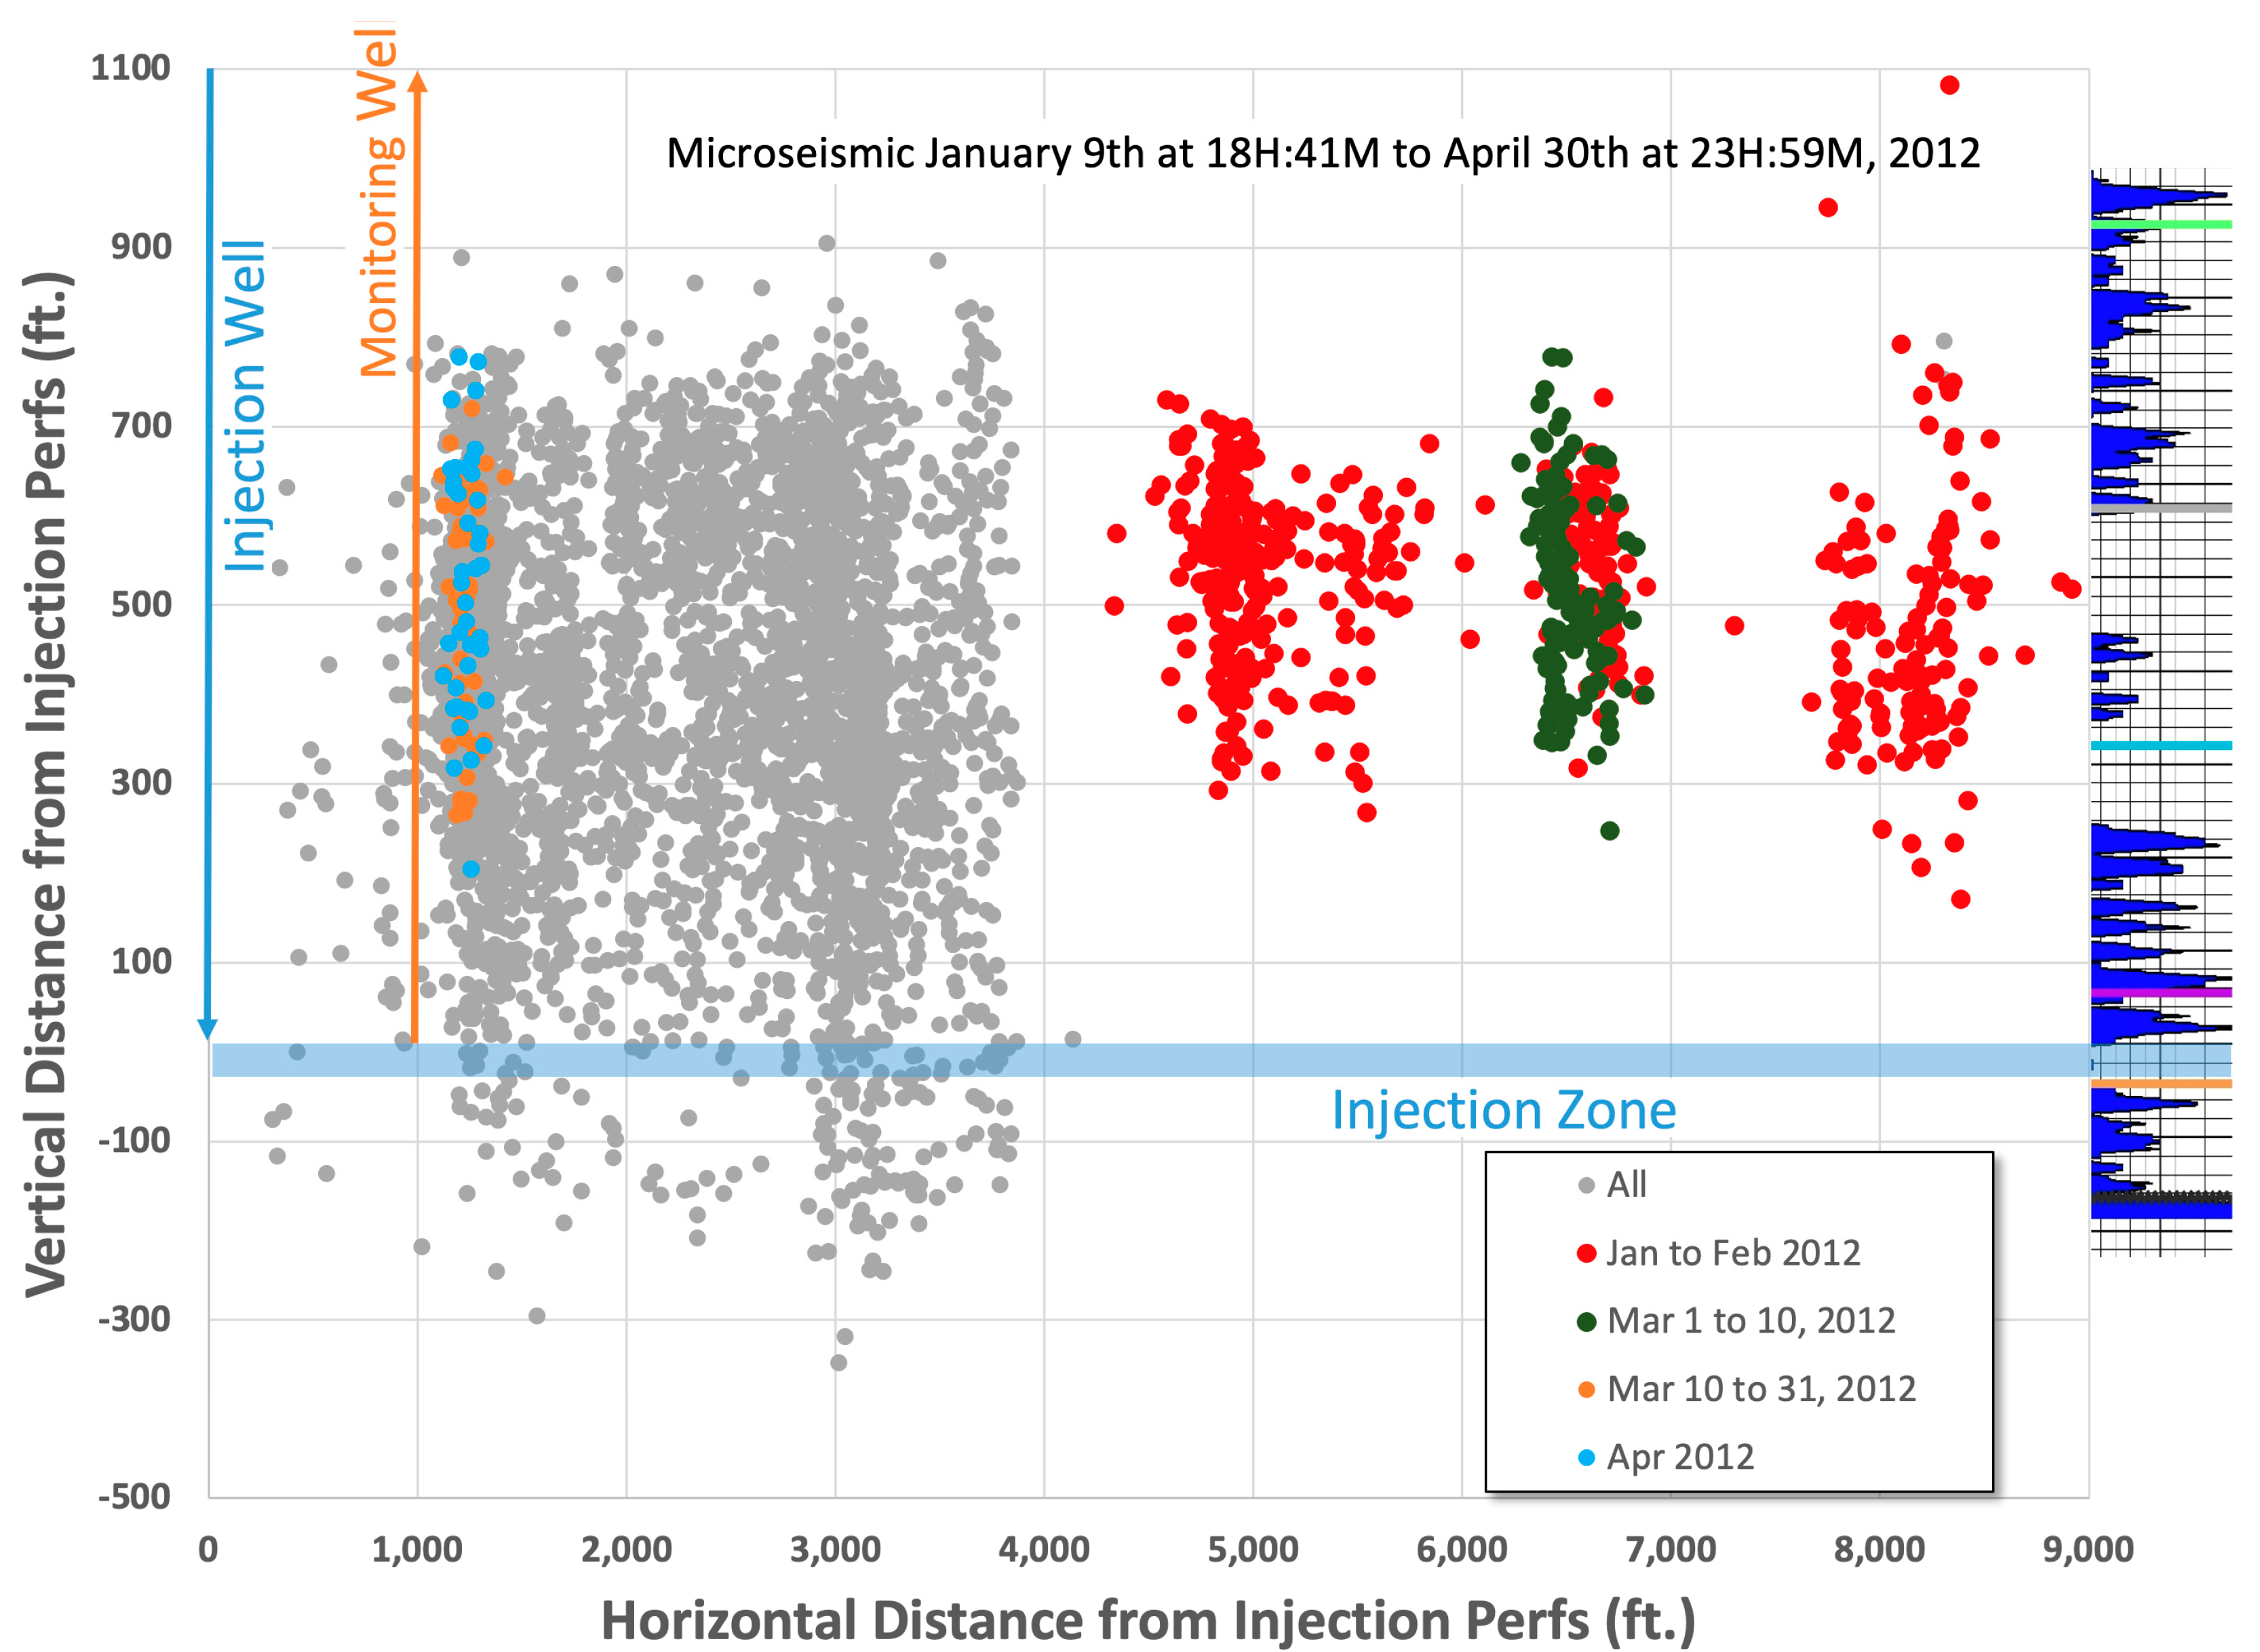
3.1. Microseismic Monitoring of IBDP

At the Illinois Basin Decatur Project (IBDP), a comprehensive monitoring system, including geophones in both the injection well CCS#1 and the nearby monitoring well VW#1, provides extensive coverage [6]. The analysis of microseismic data from the IBDP reveals the temporal and spatial distribution of microseismic events, offering insights into the CO2 plume’s subsurface behavior. This monitoring system recorded 10,123 microseismic events, indicating CO2 movement and pressure buildup, particularly in the Mt. Simon A formation in CCS#1 and the entire Mt. Simon column in VW#1. Figure 2 shows the map of the IBDP site with all microseismic events relative to the CCS1 injection well and VW1 monitoring well from December 2011 to February 2018 (gray), with events from January 2012 to 30 April 2012 highlighted. Advanced techniques like FMI logging identified baffles that significantly influenced CO2 migration, often halting its upward movement near the injection point CCS#1 and causing lateral movement away from CCS#1, leading to localized pressure increases. From December 2011 to February 2012, data showed a clear pattern of horizontal spread of these events away from the injection point. This observation, in line with previous studies [12], indicates the movement of the CO2 plume laterally away from the injection point, rather than an upward movement.
From April 2012 to the end of the injection in December 2014, microseismic events were concentrated near the injection perforations, indicating pressure buildup around the injection point. This led to the CO2 plume breaching the baffles and expanding vertically upward. At this stage, the lateral expansion of the CO2 plume was confined to less than 4000 ft, as opposed to the earlier extension around 9000 ft away from the injection point.
Figure 3 shows these events spreading both vertically (ranging from −500 ft to 1100 ft) and horizontally (extending up to 9000 ft), suggesting the CO2 plume’s extension and interaction with various geological layers, including the Mt. Simon Sandstone and the Precambrian basement. Initially, the CO2 plume spread laterally away from the injection point, accumulating around 9000 ft away (December 2011–February 2012). The baffle density log on the right margin of Figure 3 shows the presence of high-density baffles above the injection zone that facilitate these horizontal movements. It then moved back toward the injection point during March 2012 and concentrated around the injection point for the rest of the injection time and post-injection period until February 2018. As pressure builds up near the injection point, it overcomes gravity and capillary forces, resulting in breaching discrete barriers or baffles and allowing CO2 to migrate vertically through zones of weakness. Post-injection events mainly occurred between 2600 and 3900 ft away from the injection point, extending up to lower Mount Simon C.

3.2. Pulsed Neutron Logging (PNL) for CO2 Saturation Distribution

Pulsed Neutron Logging (PNL) is a crucial technique for monitoring CO2 saturation and formation fluids near the wellbore. PNL logs provide comparative analyses by contrasting pre-injection (base pass) measurements with subsequent monitoring logs taken during and after the injection period in both the CCS#1 injection well and the VW#1 monitoring well. A time-lapse evaluation of PNL data indicated that most of the CO2 was contained within the lower Mt. Simon A interval, with minor extension into the Upper Mt. Simon A in the CCS#1 injection well. Post-injection PNL logs revealed minimal changes in CO2 saturation, except for minor buoyancy effects that reduced saturation at the bottom of the permeable zones in CCS#1. However, repeat PNL logs of VW1 highlighted vertical CO2 plume movement up to Mt. Simon D and Mt. Simon. This vertical movement is attributed to the presence of highly dense baffles identified using FMI logs in Mt. Simon A, which prevent vertical CO2 plume movement in the CCS#1 well and redirect the CO2 plume toward VW#1 (Figure 4). The pressure buildup in VW#1 leads to CO2 periodically breaching these localized barriers or baffles and migrating upward to Mt. Simon D and Mt. Simon. The PNL log was obtained during four runs: in 2014, 2016, 2018, and 2019. These intervals allowed us to monitor the dynamic changes in CO2 distribution over time. The data reveal that CO2 reached the VW#1 monitoring well and migrated through the Mt. Simon formation, extending up to the Eau Claire Shale caprock. The main concentration of CO2 was observed in both the Lower and Upper Mt. Simon intervals. Interestingly, CO2 was not detected throughout the Mt. Simon formation in the injection well, CCS#1, where, during all five years of monitoring, the CO2 remained contained within the Lower and Upper Mt. Simon intervals. These observations provide critical insights into how barriers and baffles direct the CO2 plume towards the VW monitoring well, where it encounters vertical fractures and subsequently moves upward. Our findings are consistent with earlier studies by [34], which demonstrated that CO2 plume geometry is strongly influenced by low-porosity and low-permeability layers (baffles), significantly affecting CO2 distribution at distances greater than 984 feet from CCS#1. Similar phenomena were also observed in the CO2 sequestration project at Citronelle Dome, Alabama [35].

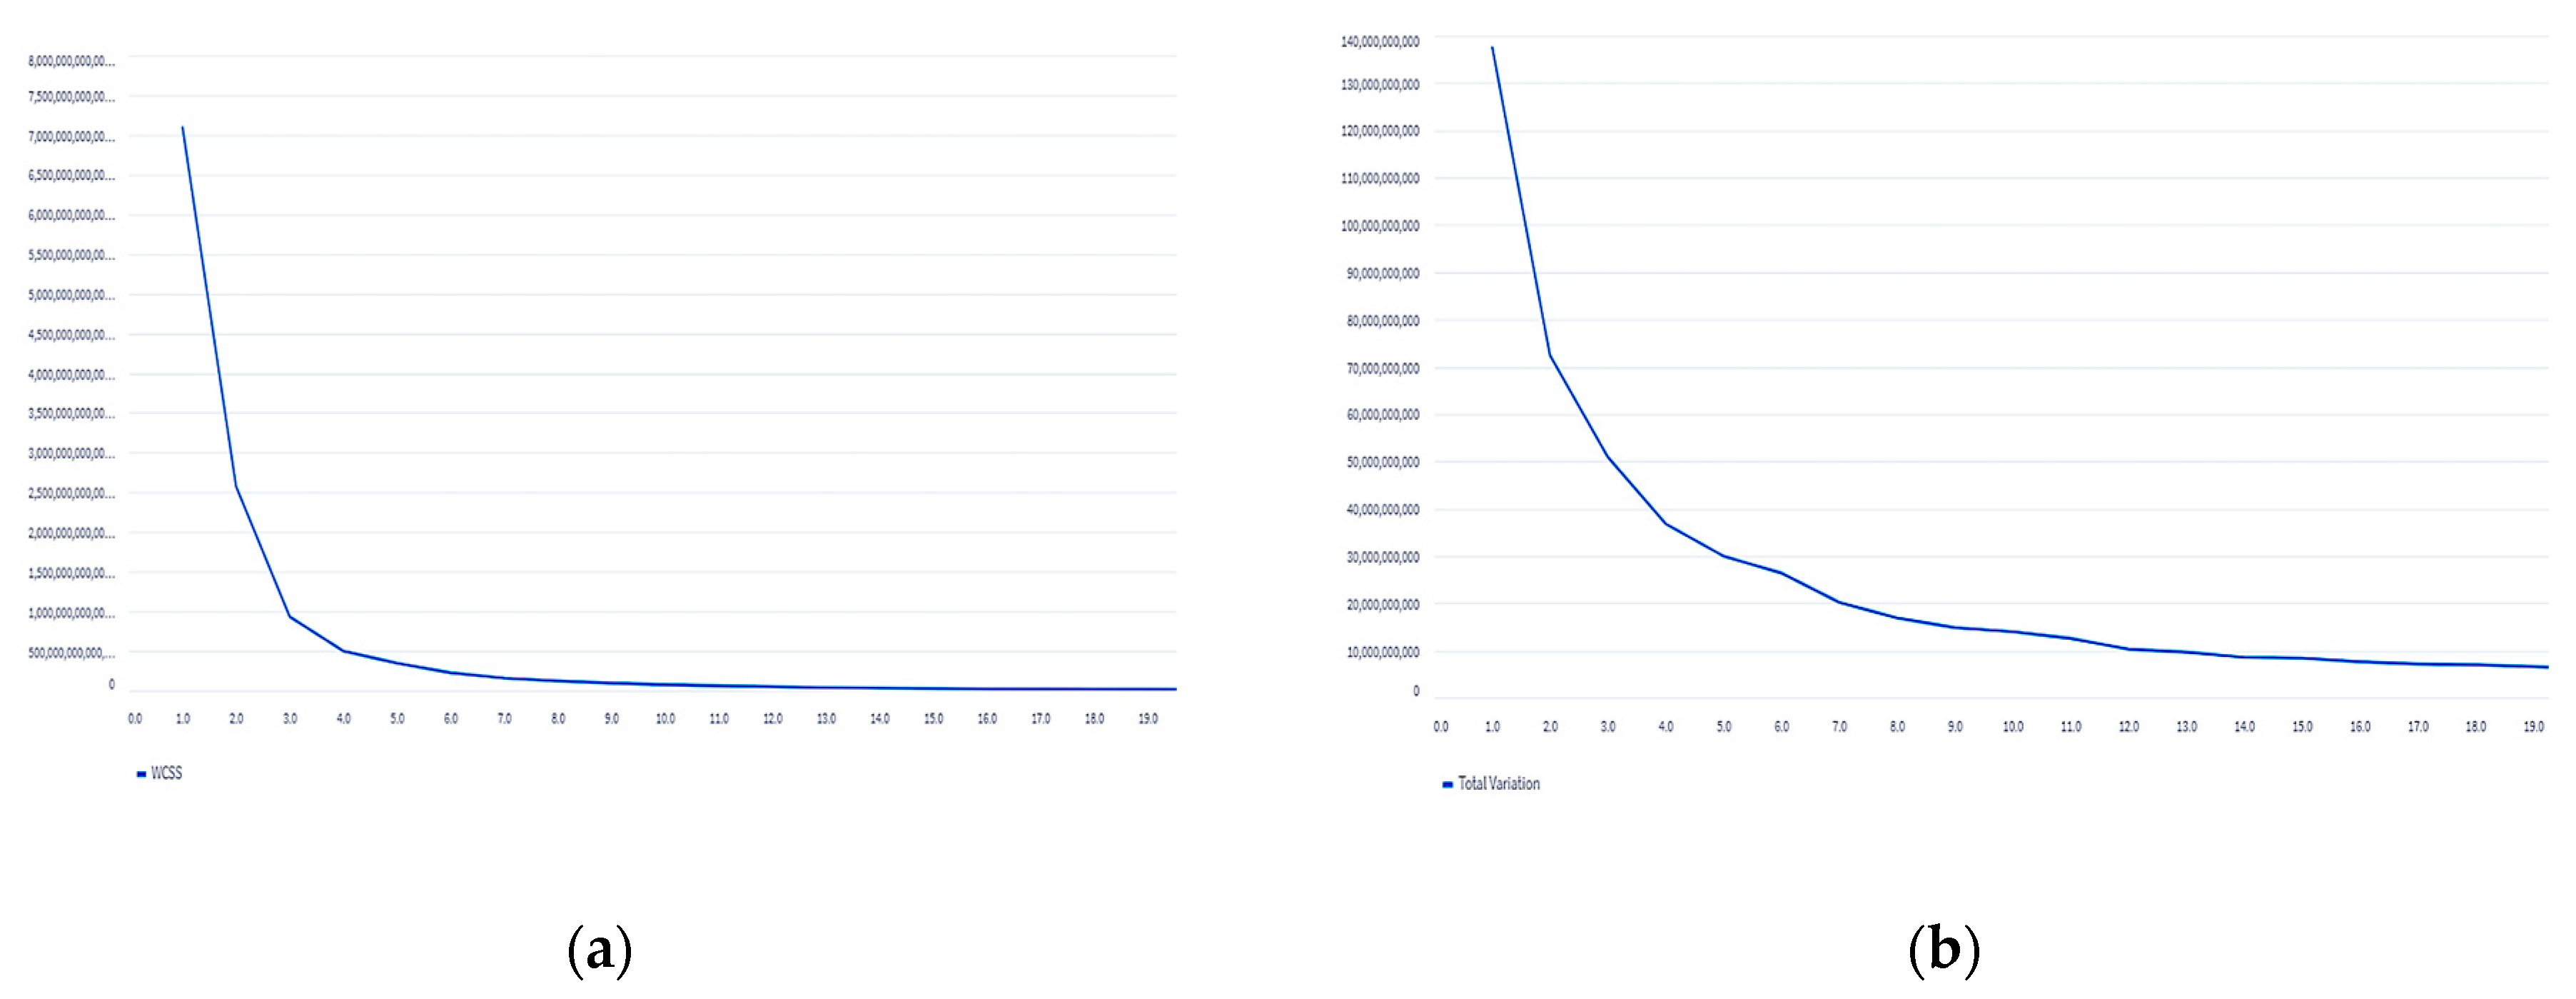
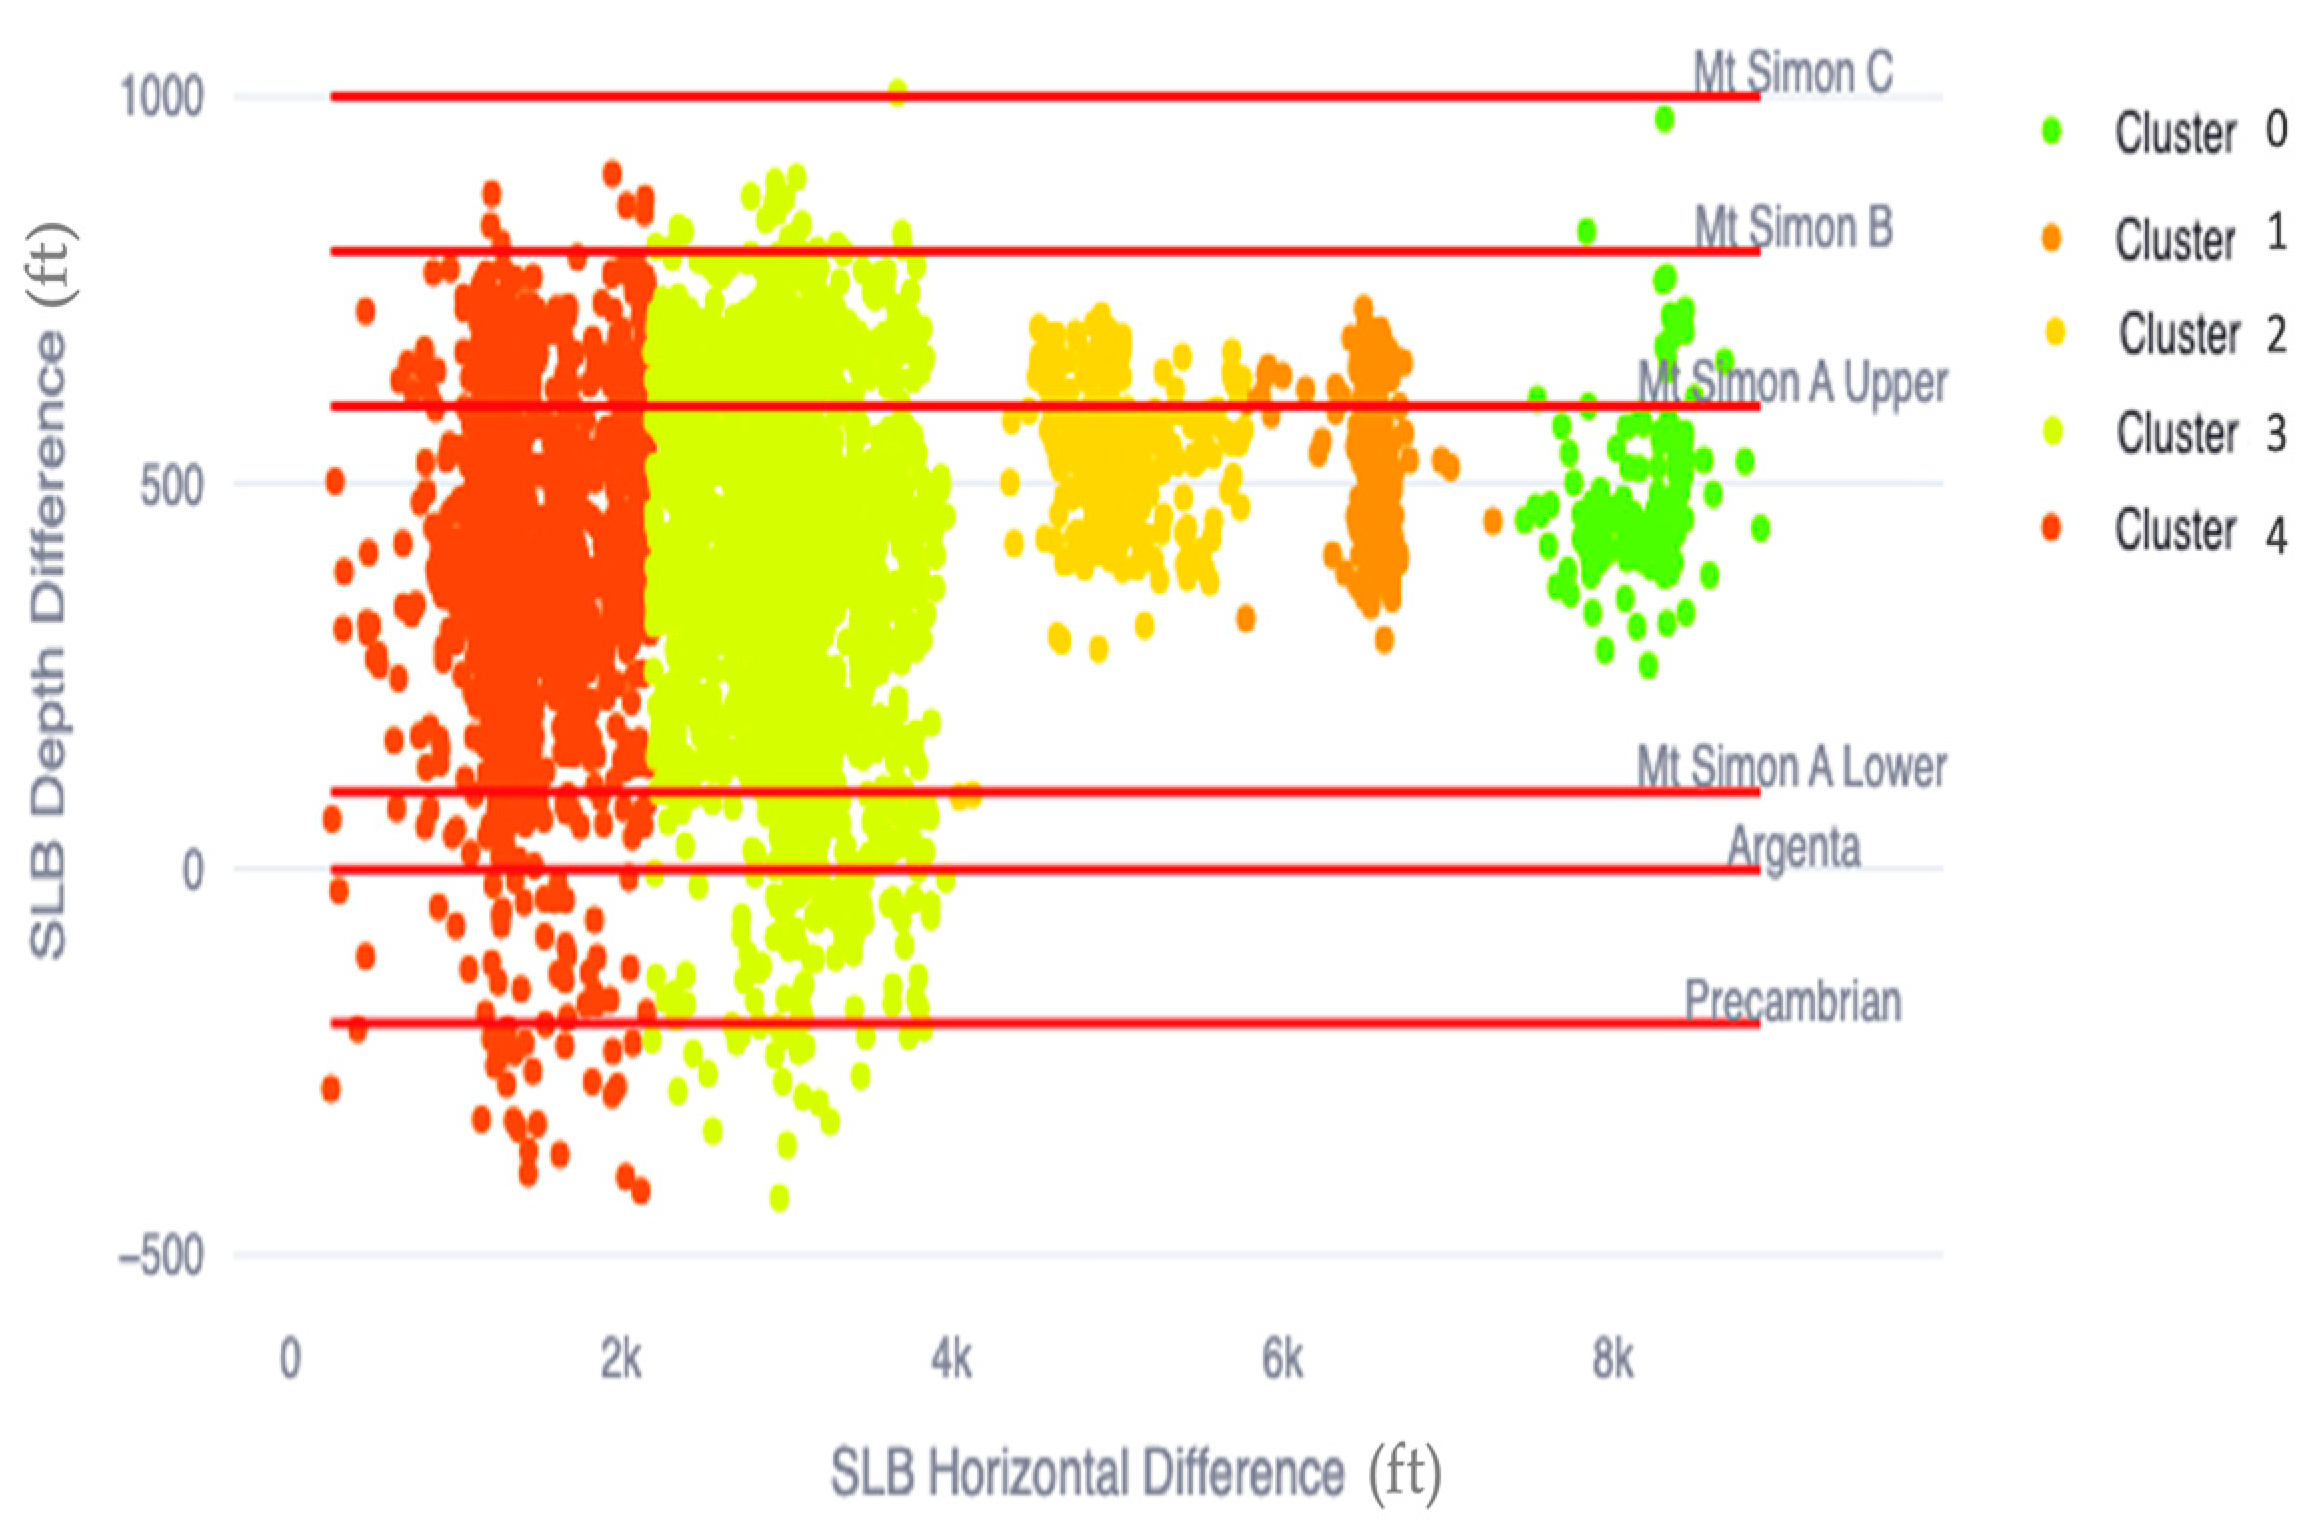
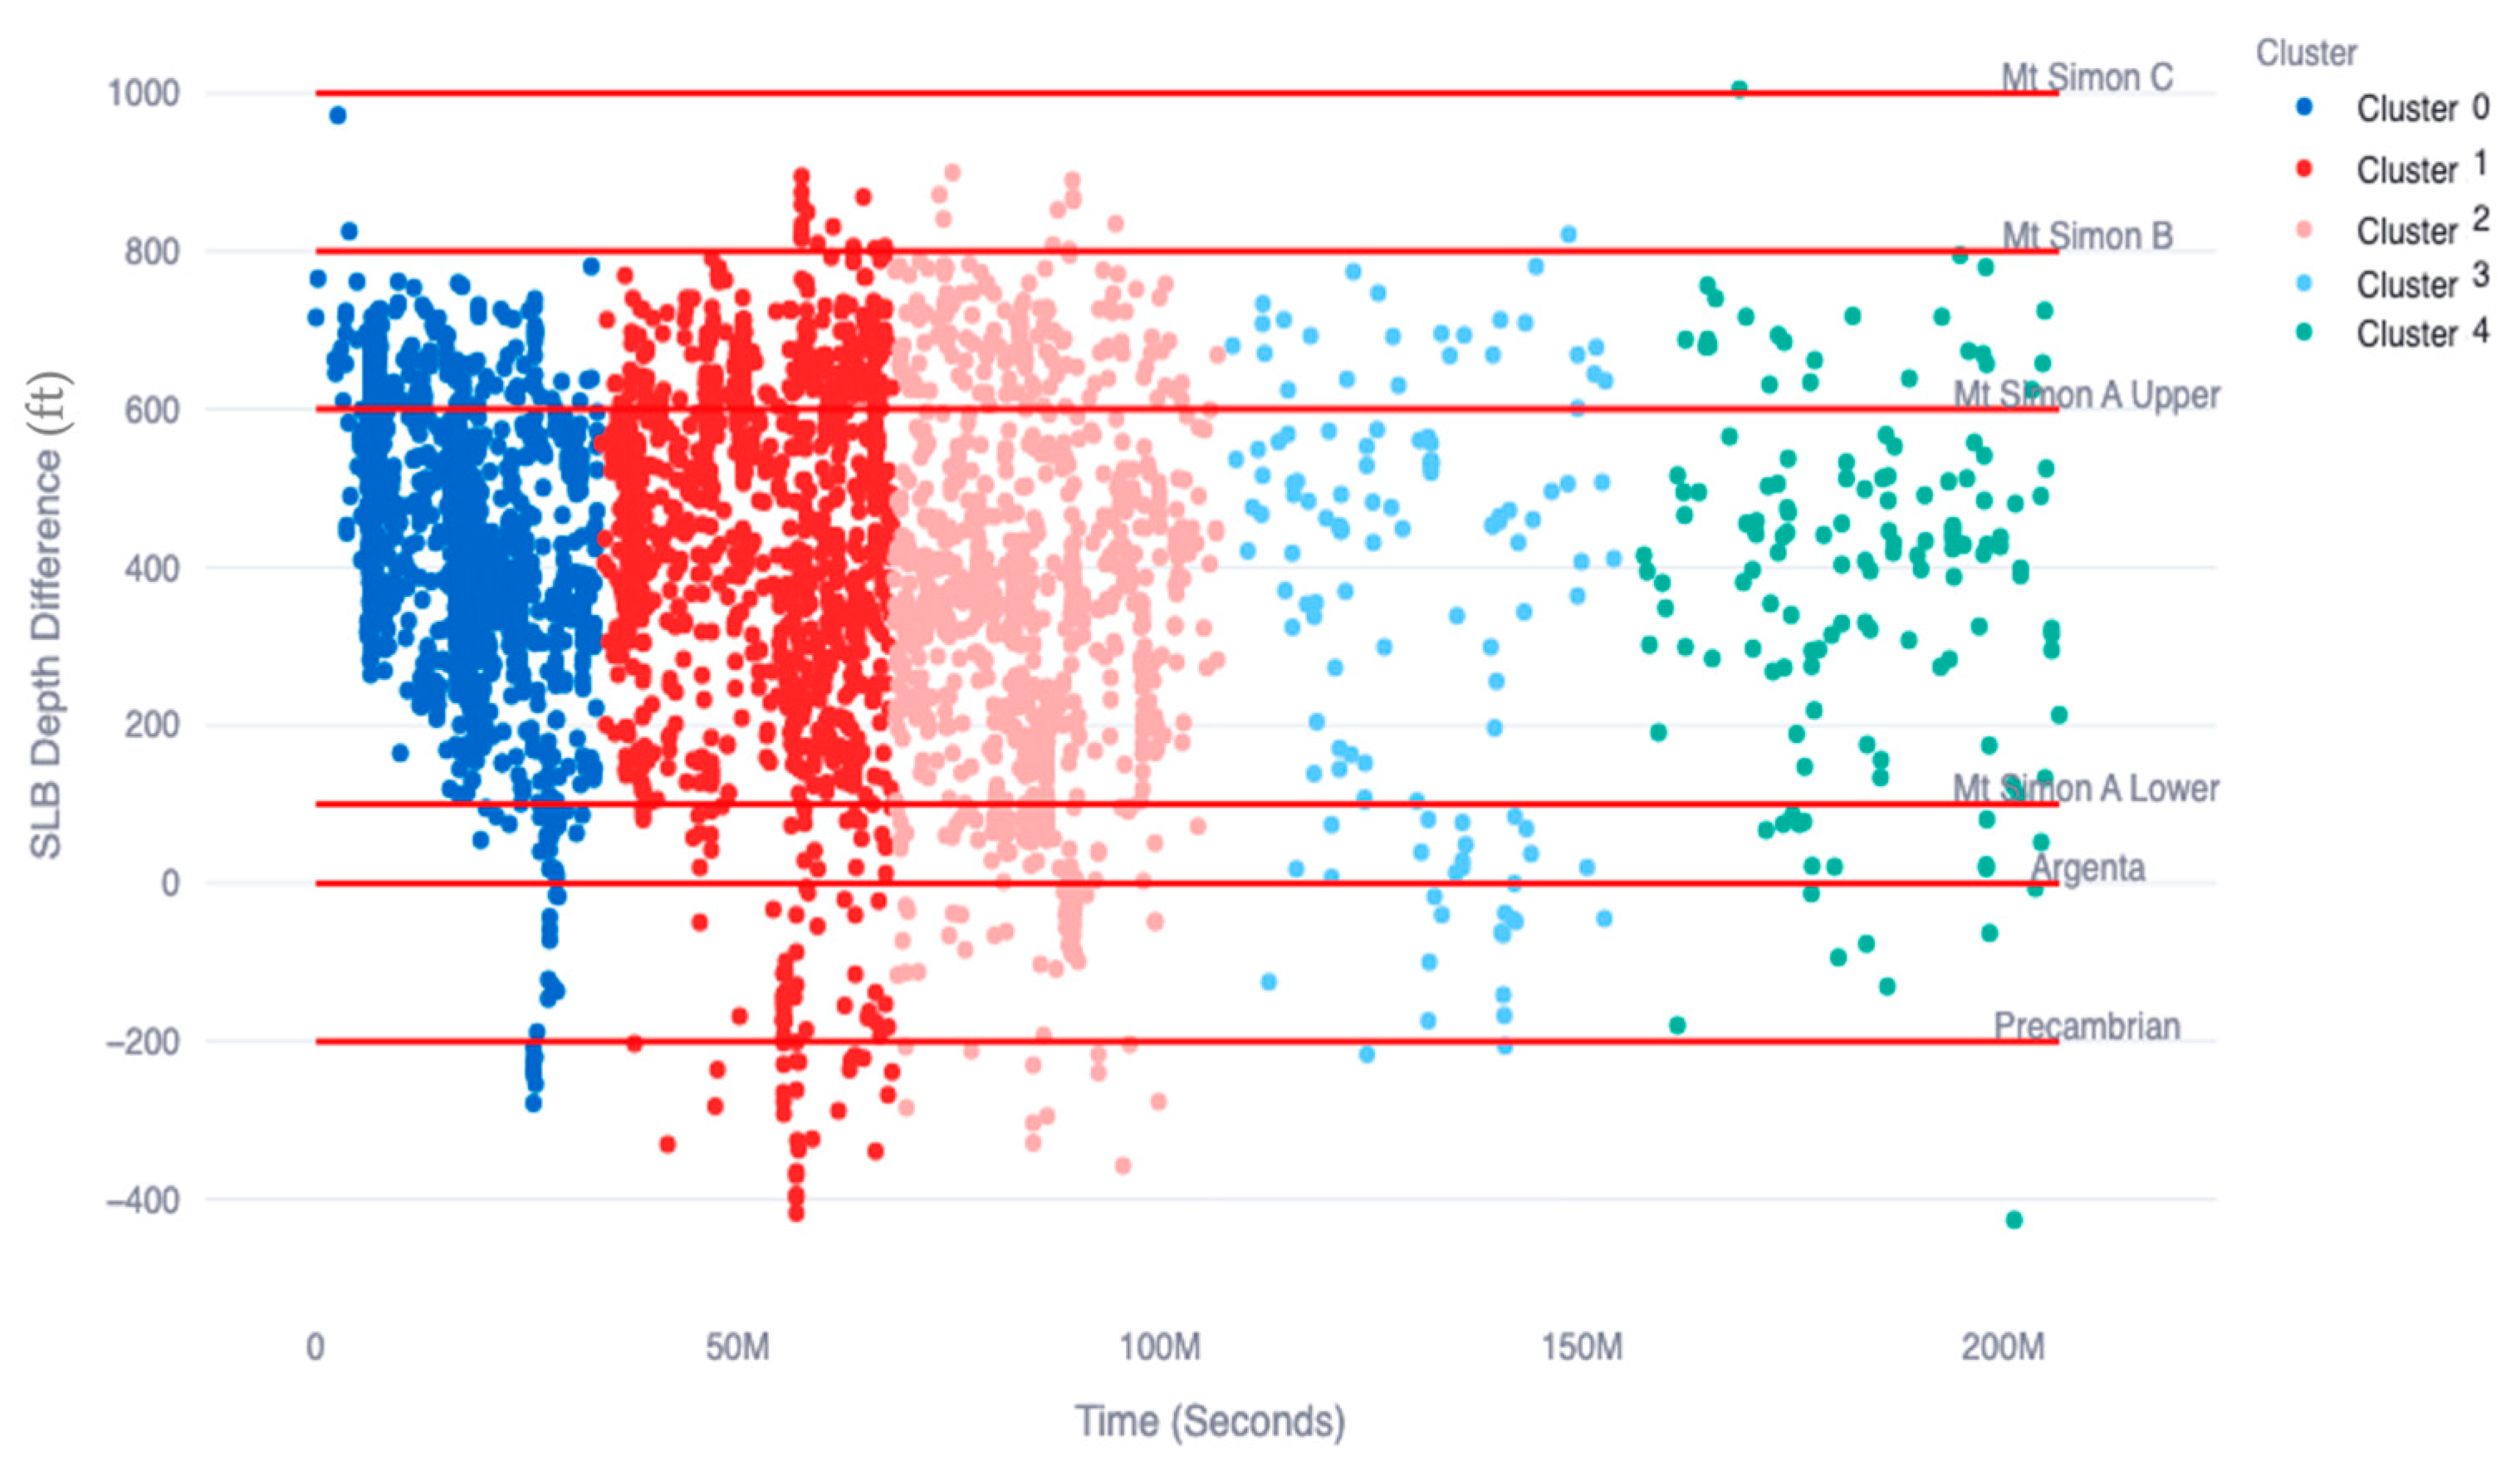
3.3. K-Means Clustering Techniques

K-Means partitions data into a predefined number of clusters without prior knowledge of the labels. To determine the optimal number of clusters (k), methods such as Total Variation and Within-Cluster Sum of Squares (WCSS) are used. Total Variation measures the overall spread within clusters, while WCSS calculates the sum of squared distances between data points and their cluster centers. The optimal k is identified at the point where adding more clusters results in diminishing returns, often visualized using an "elbow curve." This curve bends at the optimal point, indicating that further increases in k provide only marginal improvements.
In this case, three clusters were identified as optimal by WCSS, while Total Variation suggested five clusters, as shown in Figure 5. To refine the selection, both three and five clusters were evaluated using the Silhouette Score and Davies–Bouldin Index. The Silhouette Score measures how similar a point is to its own cluster compared to other clusters, ranging from −1 to 1, with higher values indicating better-defined clusters. The Davies–Bouldin Index evaluates the average similarity ratio of each cluster with its most similar cluster, where lower values indicate better clustering. Table 1 summarizes the Silhouette Score and Davies–Bouldin Index for K-Means clustering, indicating that three clusters have a higher Silhouette Score and a lower Davies–Bouldin Index for the SLB dataset.
Figure 6 illustrates the K-Means clustering of microseismic events in a 3-dimensional space of time, horizontal difference, and depth difference with respect to the injection point using three clusters. Initially, the CO2 plume moved laterally away from the injection point and vertically up to Mt. Simon C. Over time, it began to accumulate around the injection point and did not extend beyond 4000 ft laterally from the injection point.
To better understand CO2 plume dynamics, dimensionality reduction to 2D subsets was performed, and K-Means clustering was applied for visualization. This required new clustering, resulting in different clusters based on the chosen dimensions. Figure 7 shows the determination of the optimal number of clusters when the 3D original data are mapped onto a 2D plane of depth difference and horizontal distance from the injection point. Similar to the original dataset, the "elbow curve" for WCSS suggested three clusters, while Total Variation suggested five clusters. Table 2 compares these indices for three and five clusters, confirming that five clusters are optimal for this subset of data.
The optimal number of clusters for each subset was determined using “elbow curves” for both WCSS and Total Variation and confirmed by the highest Silhouette Score and the lowest Davies–Bouldin Index. Table 3 compares these indices across different subsets, confirming that the physical interpretation of clusters aligns with PNL logging observations and FMI log data on baffle intensity, supporting five clusters as the optimal number (Figure 4).
Figure 8 illustrates the K-Means clustering of microseismic events on the 2D plane of depth difference and horizontal distance from the injection point, highlighting the horizontal and vertical extension of the CO2 plume. The y-axis represents the depth difference relative to the injection point, while the x-axis shows the horizontal spread of the events.
Five clusters of microseismic events were identified. Clusters 0, 1, and 2, which had lower event densities, occurred early in the injection period (December 2011 to early March 2012) and were located farther from the injection point. This suggests an initial horizontal spread of CO2 due to baffle confinement, followed by upward movement as pressure built up, leading to breakthroughs near the injection point. From mid-June 2012 to the end of injection in November 2014, and continuing post-injection until February 2018, CO2 accumulated around the injection point.
Figure 9 displays the clustering of microseismic events in a 2D subset of time (in 10^6 s) versus horizontal distance from the injection point. The optimal number of clusters for this subset was five. Initially, microseismic events spread up to 9000 feet from the injection point but later concentrated closer. Post-injection activities primarily occurred between 2600 and 3900 feet away, with fewer events near the injection point. This pattern suggests that high-density baffles and barriers near the injection point closed after injection stopped and pressure decreased below the closure pressure.
Figure 10 shows microseismic events in the 2D subset of depth difference versus time. The optimal number of clusters here was also five. This clustering reveals vertical CO2 movement throughout the injection and post-injection periods. Being lighter than formation water, CO2 accumulated in highly saturated sandstone layers, overcame gravity and capillary forces, and breached barriers to migrate vertically. Most microseismic events were concentrated in Mt. Simon A upper and Mt. Simon B, with fewer events in Mt. Simon A lower and some extending to Mt. Simon C and the Precambrian.

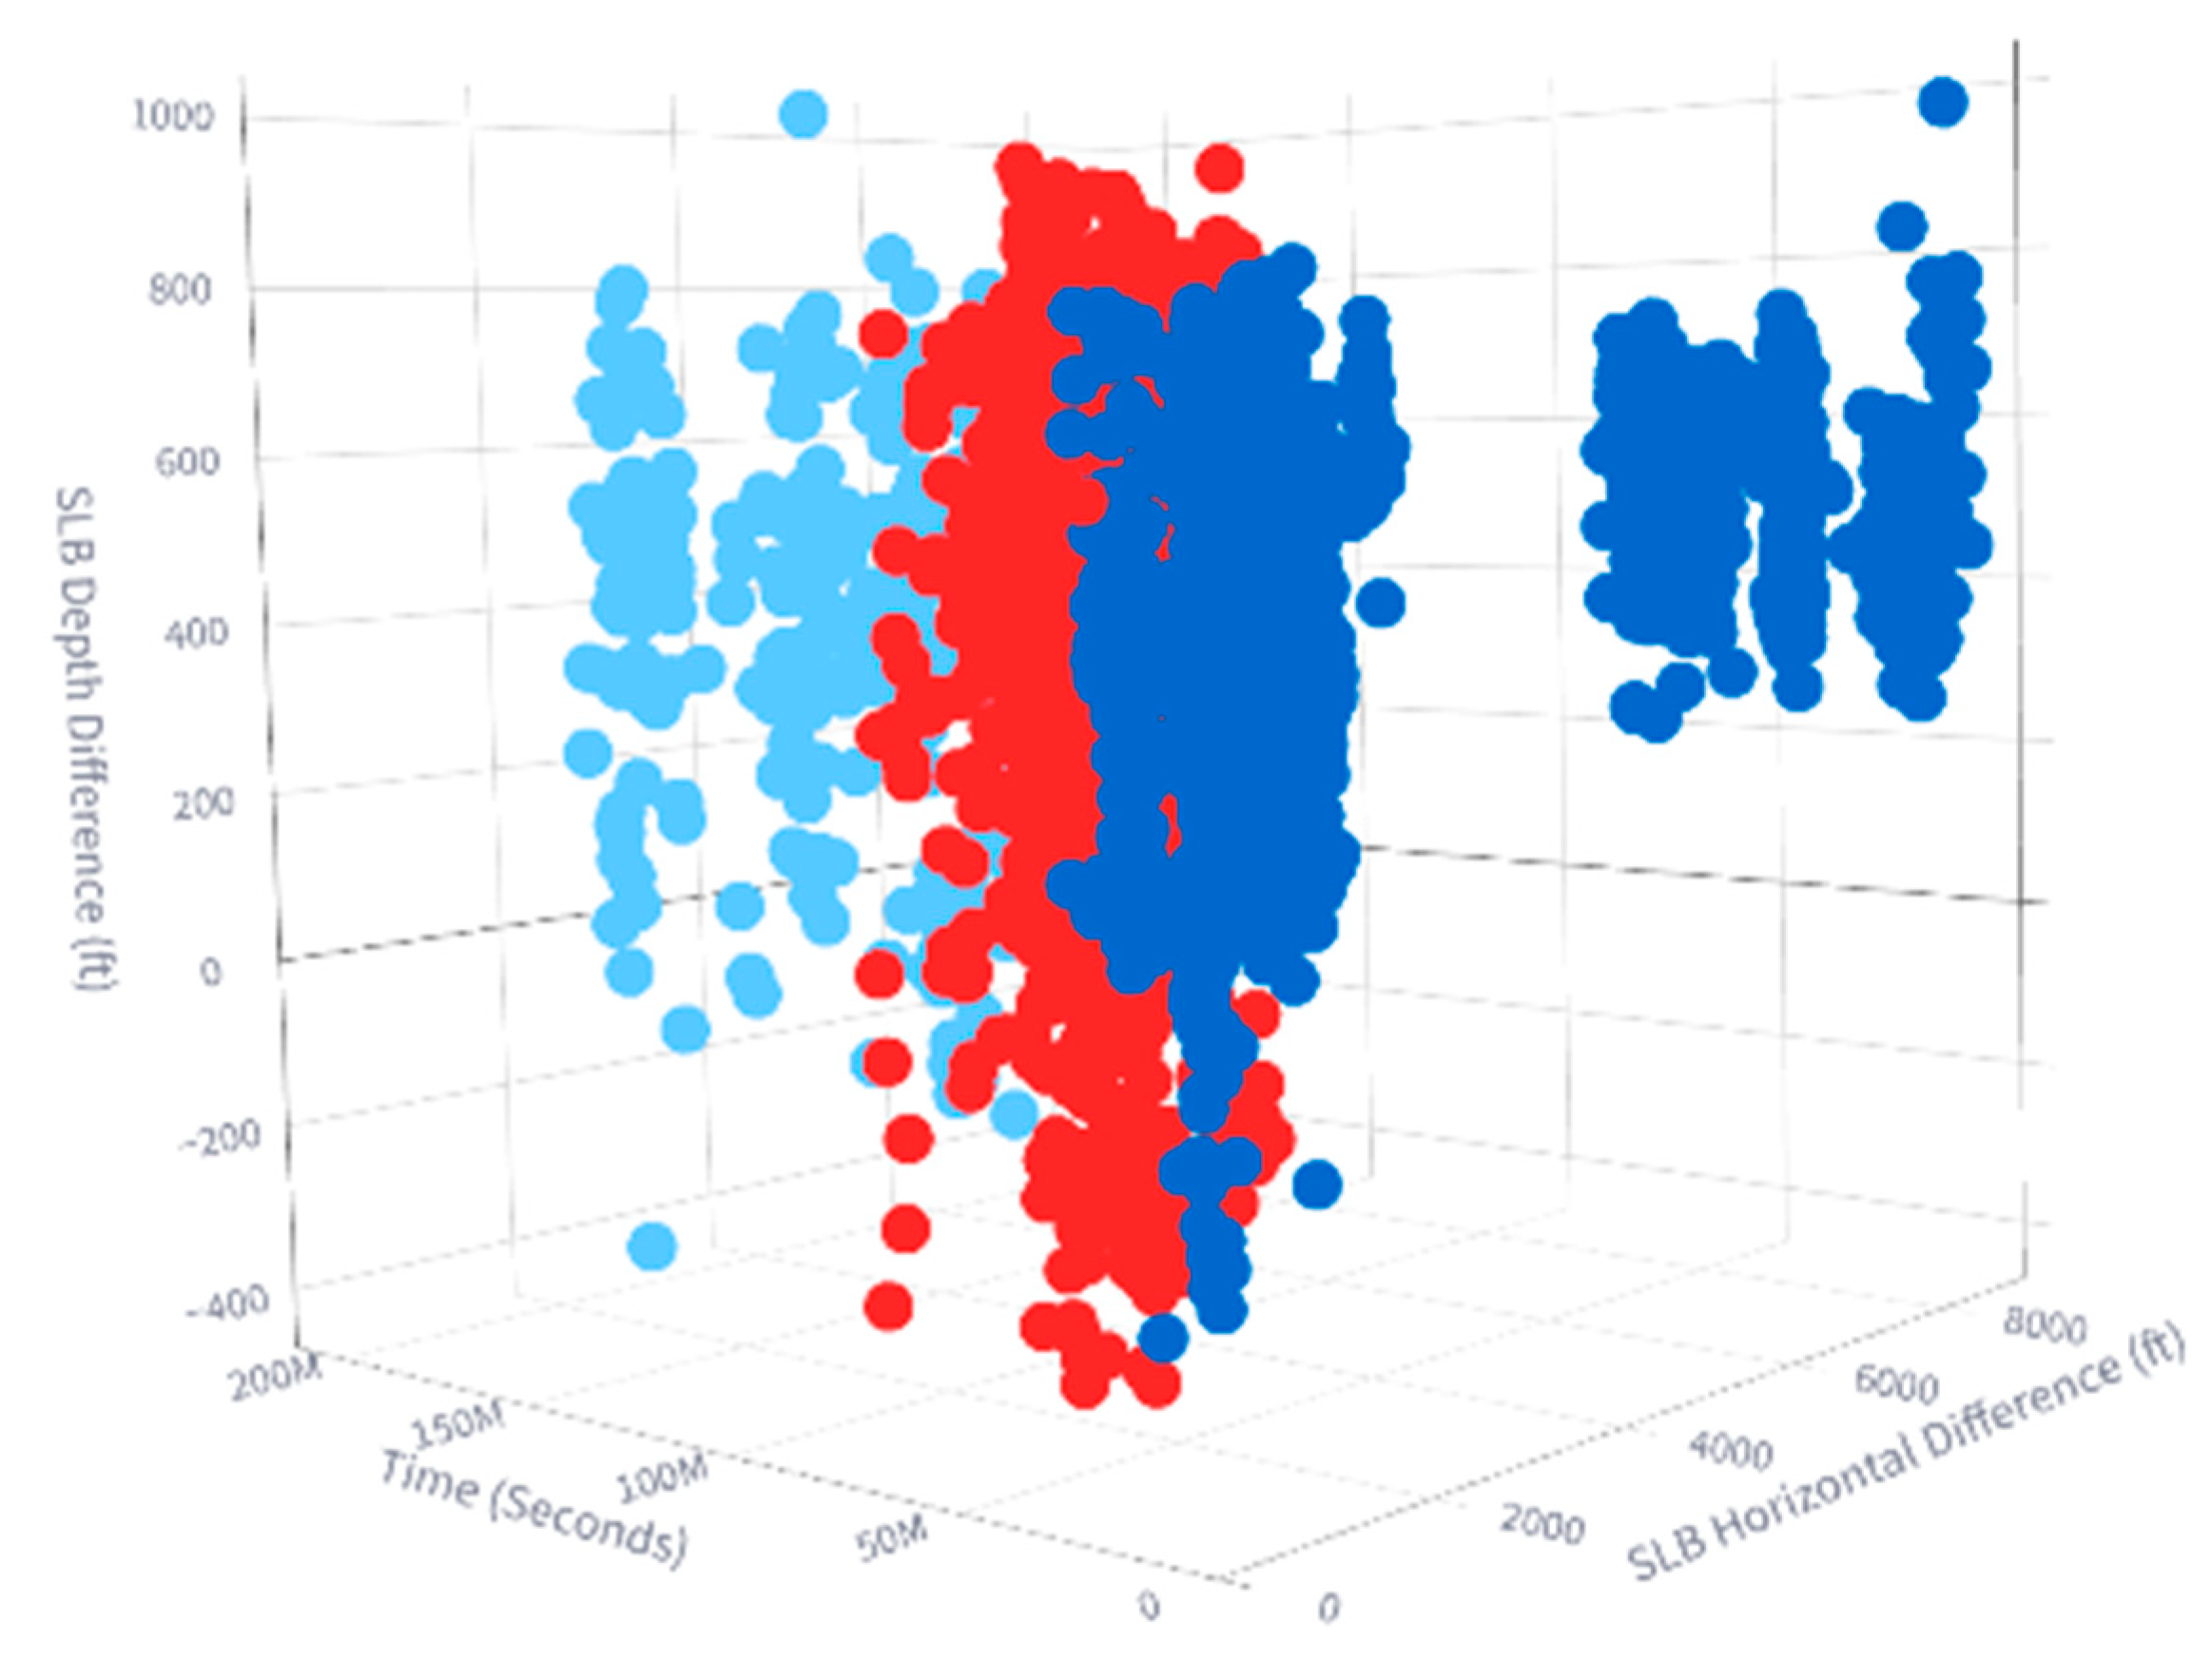
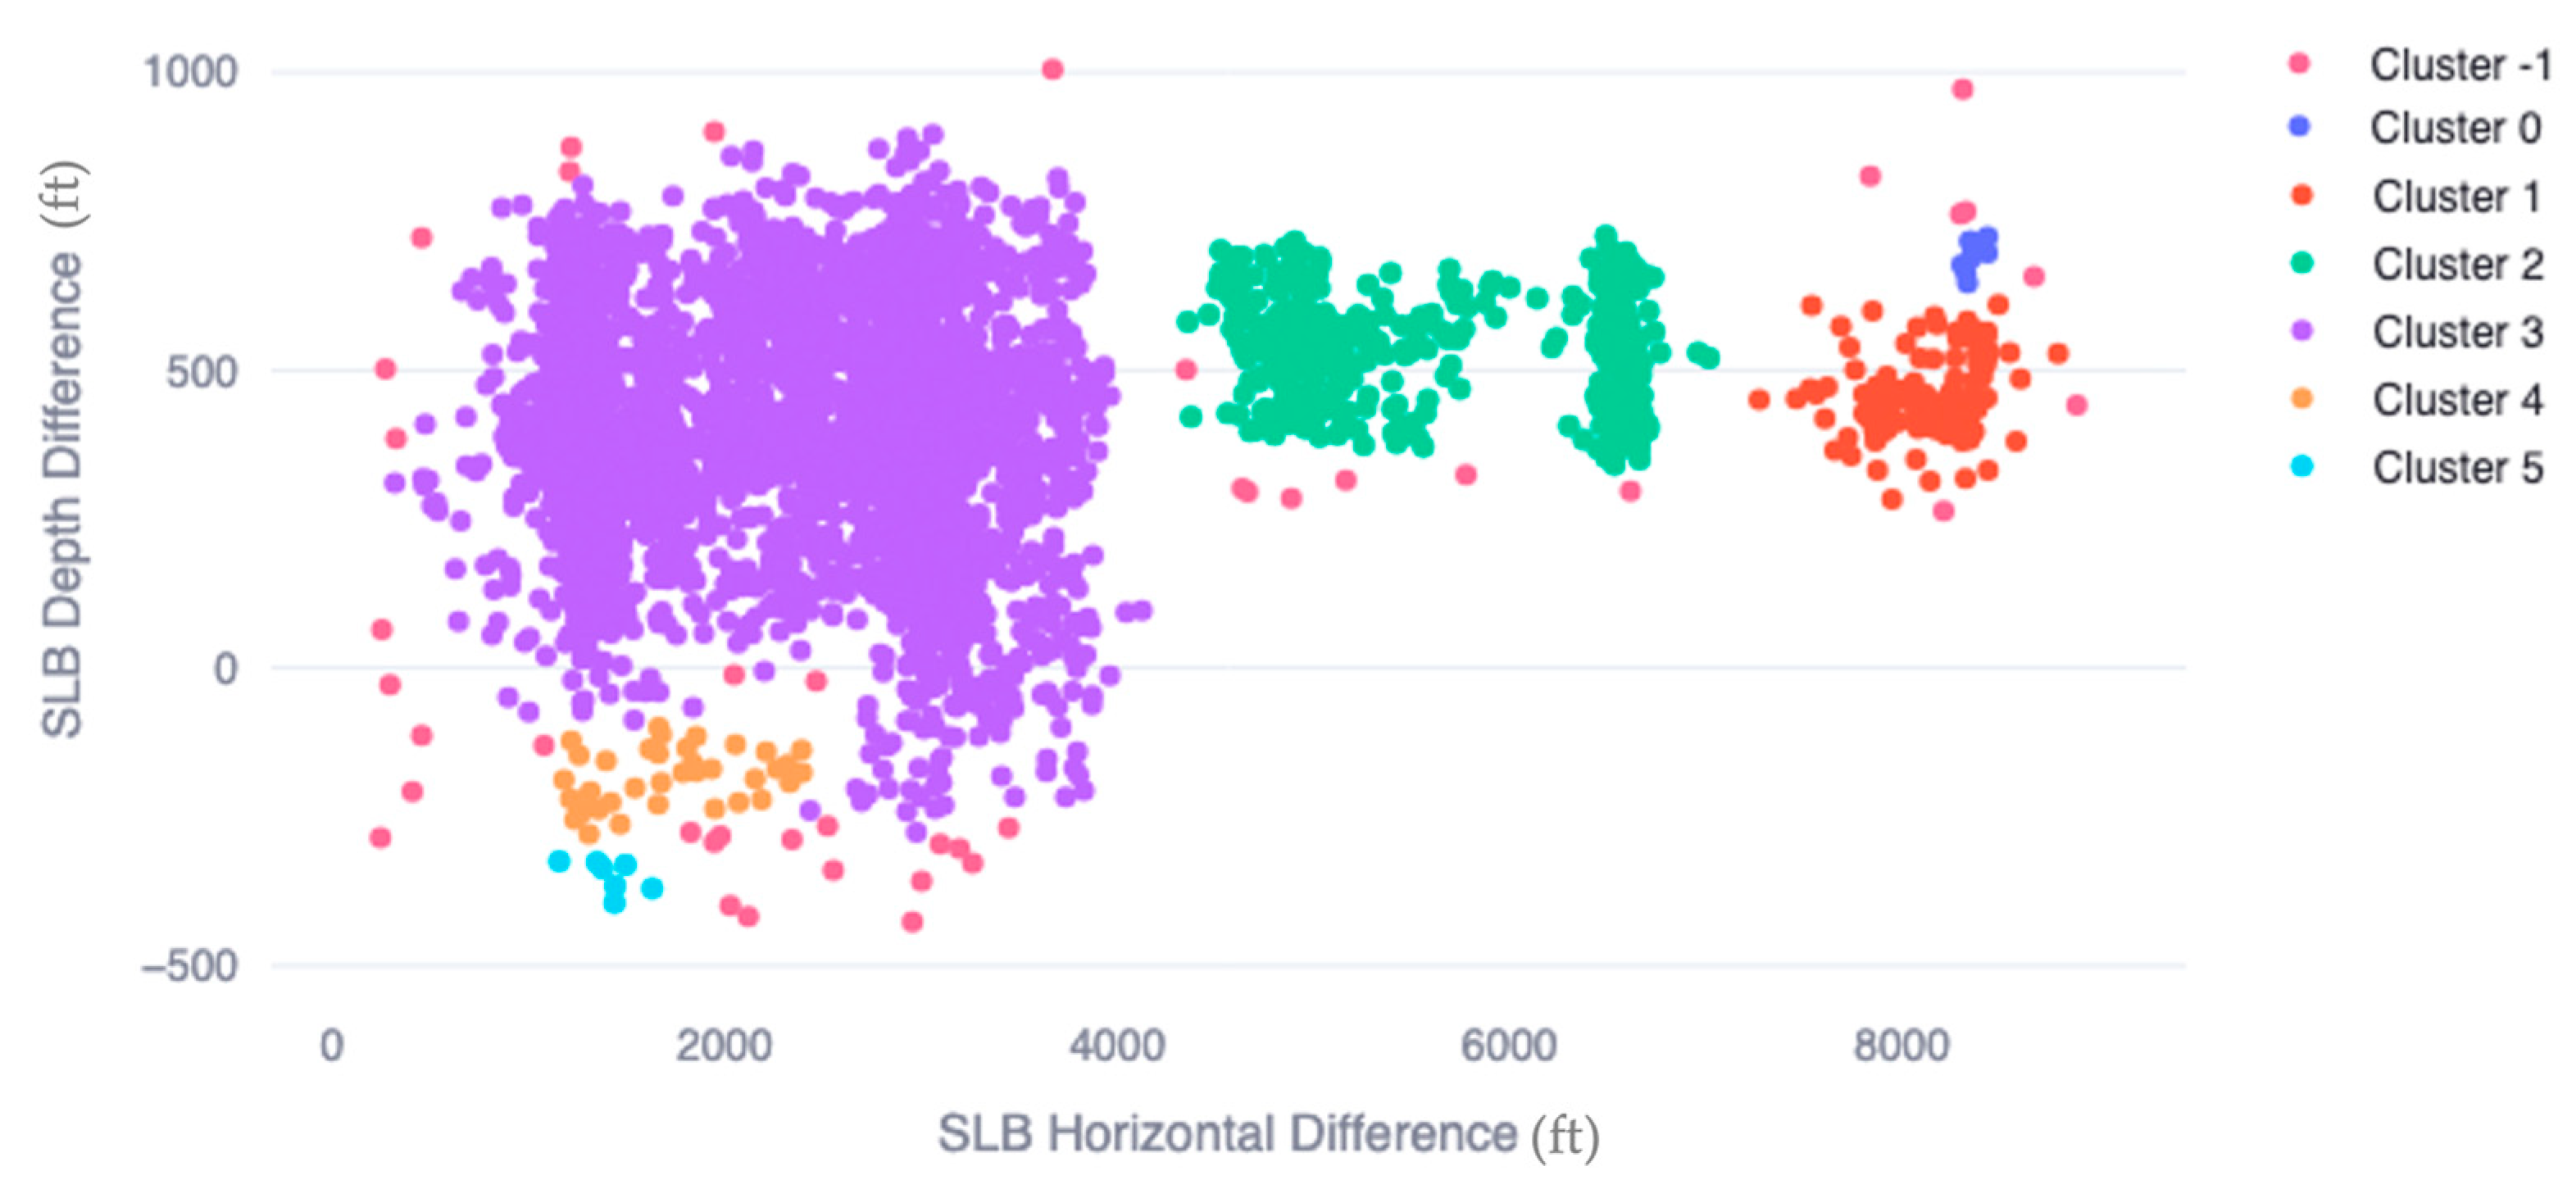
3.4. DBSCAN Clustering Techniques

DBSCAN uses two key parameters: epsilon (eps) and min_samples. Epsilon defines the radius around each point within which density is assessed, while min_samples sets the minimum number of points required within this radius to form a dense region. The choice of the "eps" value significantly influences DBSCAN clustering.
A common technique to determine the optimal "eps" value is the K-Distance graph. This graph plots the distances of each point to its k-th nearest neighbor. A sharp change in the graph indicates a good candidate for the "eps" value. Figure 11 shows that the optimal "eps" value is 0.2, according to the K-Distance graph for the 5th nearest neighbor distance.
DBSCAN clustering of the SLB whole dataset suggests six major clusters and one outlier cluster, presented as cluster −1, as shown in Figure 12. Table 4 compares the Silhouette Score and Davies–Bouldin Index for DBSCAN and K-Means clustering. The results indicate that K-Means clustering outperforms DBSCAN and will therefore be used for the final conclusions.

4. Discussion

The Illinois Basin Decatur Project (IBDP) provided an extensive dataset for analyzing CO2 plume dynamics, leveraging microseismic event monitoring through a comprehensive system including geophones in both the injection well CCS#1 and the nearby monitoring well VW#1. The collected data, spanning from November 2011 to December 2014, comprised 10,123 recorded microseismic events. The analysis of these events, particularly using advanced machine learning (ML) clustering techniques like K-Means and DBSCAN, has yielded significant insights into the subsurface behavior of the CO2 plume, especially in the context of identifying and understanding the role of geological features such as baffles and local barriers.
Initially, spatial and temporal K-Means clustering revealed distinct vertical and horizontal distributions of microseismic events, indicative of the CO2 plume’s movement. Clusters identified early in the injection period (December 2011 to early March 2012) displayed a lateral spread up to 9000 ft away from the injection point, as CO2 encountered baffles that confined its vertical migration. Subsequent pressure buildup led to breakthroughs, allowing upward migration. This phenomenon was evident from mid-June 2012 to the end of the injection and post-injection period (February 2018), where microseismic events concentrated near the injection point, highlighting the cyclical nature of CO2 migration and accumulation. The clustering of microseismic events in multi-dimensional and 2D spaces, respectively, confirmed the dynamics observed. The optimal clustering configuration identified five clusters, as validated by both Silhouette Scores and Davies–Bouldin Indices, underscoring the robustness of the K-Means approach. This clustering aligned well with physical observations from Formation Micro-Imager (FMI) logs, which identified high-density baffles and barriers, corroborating the ML-derived patterns of CO2 movement. The FMI logs showed cemented or shale-rich intra-formational intervals, acting as leaky seals inhibiting vertical migration, a critical factor influencing the plume’s horizontal and vertical dynamics. The PNL log data further supported these interpretations, detailing the pressure dynamics around the injection point.
DBSCAN clustering, while effective in identifying major and outlier clusters, as shown in Figure 10 and Figure 11, did not perform as well as K-Means in providing clear, actionable insights. The effectiveness of K-Means clustering in interpreting CO2 plume dynamics is evident in its ability to delineate clusters that align with physical geological features and monitoring logs. This alignment not only validates the clustering results but also enhances the understanding of CO2 behavior in the subsurface, informing better management and prediction strategies for carbon sequestration projects.

5. Conclusions

The application of machine learning clustering techniques, particularly K-Means, has significantly enhanced the interpretation of CO2 plume dynamics at the Illinois Basin Decatur Project (IBDP). By effectively delineating spatial and temporal patterns of microseismic events, K-Means clustering provided crucial insights into the horizontal and vertical movements of the CO2 plume, especially in relation to geological features such as baffles and localized barriers. The clustering results, validated by FMI and PNL log data, highlighted the initial lateral spread followed by vertical migration due to pressure build-up and the post-injection stabilization. Comparative analysis demonstrated K-Means’ superior performance over DBSCAN, affirming its robustness for geospatial analysis. This integration of ML techniques with physical monitoring enhances the accuracy of subsurface modeling, informing better carbon sequestration strategies and ensuring long-term project efficacy. Integrating machine learning with FMI image logs and PNL log monitoring has significant implications for CO2 capture, utilization, and storage (CCUS). It enhances the precision of CO2 plume pressure and saturation analysis during (area of review) and after injection (post injection site care), which improves site management. This integration helps in assessing legal pore space ownership, ensuring cap rock integrity, and evaluating reservoir capacity, thereby optimizing regulatory compliance, operational safety, and overall project efficiency. These advancements contribute to more effective carbon sequestration strategies and support progress toward climate change mitigation goals.

Supplementary Materials

The following supporting information can be downloaded at: https://www.mdpi.com/article/10.3390/en17174421/s1.

Author Contributions

Conceptualization, T.R.C. and E.F.; methodology, T.R.C. and E.F.; software, I.I.; validation, T.R.C., E.F. and F.B.; formal analysis, T.R.C., E.F. and F.B.; investigation, I.I.; resources, I.I.; data curation, I.I.; writing—original draft preparation, I.I., E.F. and F.B.; writing—review and editing, T.R.C. and F.B.; visualization, I.I.; supervision, T.R.C. and E.F. All authors have read and agreed to the published version of the manuscript.

Funding

This research was funded by the National Energy Technology Laboratory, United States of America program for Science-informed Machine Learning for Accelerating Real-Time Decisions in Subsurface Applications (SMART) under a contract through Leidos entitled Subsurface Data-to-Knowledge in a Fractured Reservoir Initiative (Subcontract No. P010220883 Task 27).

Data Availability Statement

The following supporting information can be downloaded at: https://edx.netl.doe.gov/workspace/resources/smart-initiative?folder_id=e962087e-244a-4638-b7fa-6604dd6747ba, time_microseismic2.xlsx. The opensource dashboard can be obtained at https://cz63dzvzquchsikhdpugsq.streamlit.app/ accessed on 8 July 2024.

Conflicts of Interest

Author Fatemah Belyadi was employed by the company Obsertelligence LLC. The remaining authors declare that the research was conducted in the absence of any commercial or financial relationships that could be construed as a potential conflict of interest.

References

  1. IPCC. IPCC Sixth Assessment Report 2021. Available online: https://www.ipcc.ch/report/ar6/wg1/ (accessed on 23 May 2024).
  2. United Nations. United Nation Climate Change, 2015. Available online: https://unfccc.int/process-and-meetings/the-paris-agreement (accessed on 23 May 2024).
  3. Benson, S.M.; Cole, D.R. CO2 Sequestration in Deep Sedimentary Formations. Elements 2008, 4, 325–331. [Google Scholar] [CrossRef]
  4. Fathi, E.; Carr, T.R.; Adenan, M.F.; Panetta, B.; Kumar, A.; Carney, B.J. High-Quality Fracture Network Mapping Using High-Frequency Logging While Drilling (LWD) Data: MSEEL Case Study. Mach. Learn. Appl. 2022, 10, 100421. [Google Scholar] [CrossRef]
  5. IEA International Energy Agency. Greenhouses Gas R&D Program. 2007. Available online: http://www.ieagreen.org.uk/ (accessed on 29 May 2024).
  6. Finley, R.J. An Overview of the Illinois Basin-Decatur Project. Greenh. Gases Sci. Technol. 2014, 4, 571–579. [Google Scholar] [CrossRef]
  7. Freiburg, J.T.; Morse, D.G.; Leetaru, R.P.; Hoss, H.E.; Yan, Q. A Depositional and Diagenetic Characterization of the Mt. Simon Sandstone at the Illinois Basin-Decatur Project Carbon Capture and Storage Site, Decatur, Illinois, USA; Technical Report; Illinois State Geological Survey, Prairie Research Institute, University of Illinois: Champaign, Illinois, IL, USA, 2014; Circular No. 583. Available online: https://www.researchgate.net/publication/277890733_A_Depositional_and_Diagenetic_Characterization_of_the_Mt_Simon_Sandstone_at_the_Illinois_Basin_-_Decatur_Project_Carbon_Capture_and_Storage_Site_Decatur_Illinois_USA (accessed on 29 May 2024).
  8. Kaven, J.O.; Hickman, S.H.; McGarr, A.F.; Ellsworth, W.L. Surface Monitoring of Microseismicity at the Decatur, Illinois, CO2 Sequestration Demonstration Site. Seismol. Res. Lett. 2015, 86, 1096–1101. [Google Scholar] [CrossRef]
  9. Couëslana, M.L.; Butsch, R.; Will, R.; Locke II, R.A. Integrated Reservoir Monitoring at the Illinois Basin–Decatur Project. Energy Procedia 2014, 63, 2836–2847. [Google Scholar] [CrossRef]
  10. Mohsen, S.; Behrooz, A.; Roza, D. Artificial Intelligence, Machine Learning and Deep Learning in Advanced Robotics: A Review. Cogn. Robot. 2023, 3, 54–70. [Google Scholar]
  11. Zhou, R.; Huang, L.; Rutledge, J. Microseismic Event Location for Monitoring CO2 Injection Using Double-Difference Tomography. Lead. Edge 2010, 29, 208–214. [Google Scholar] [CrossRef]
  12. Adenan, M.F.; Fathi, E.; Carr, T.R.; Panetta, B. Advancing Subsurface Analysis: Integrating Computer Vision and Deep Learning for Near Real-Time Interpretation of Borehole Image Logs in the Illinois Basin Decatur Project. Interpretation 2024, 12, SB19–SB27. [Google Scholar] [CrossRef]
  13. Cavanagh, A.; Haszeldine, R.S. The Sleipner Storage Site: Capillary Flow Modeling of a Layered CO2 Plume Requires Fractured Shale Barriers within the Utsira Formation. Int. J. Greenh. Gas Control 2014, 21, 101–112. [Google Scholar] [CrossRef]
  14. Will, R.; Smith, V.; Leetaru, H.E.; Freiburg, J.T.; Lee, D.W. Microseismic Monitoring, Event Occurrence, and the Relationship to Subsurface Geology. Energy Procedia 2014, 63, 4424–4436. [Google Scholar] [CrossRef]
  15. Will, R.; El-Kaseeh, G.; Jaques, P.; Carney, M.; Greenberg, S.; Finley, R. Microseismic Data Acquisition, Processing, and Event Characterization at the Illinois Basin–Decatur Project. Int. J. Greenh. Gas Control 2016, 54, 404–420. [Google Scholar] [CrossRef]
  16. Williams-Stroud, S.; Stanek, F.; Dichiarante, A.; Langet, N.; Leetaru, H.; Eisner, L.; Greenberg, S. Integrating Induced Seismicity for Enhanced Subsurface Structural Interpretation at the Decatur, Illinois Sequestration Site. In Proceedings of the 16th International Conference on Greenhouse Gas Control Technologies, GHGT-16, Lyon, France, 23–27 October 2022. [Google Scholar]
  17. Cavanagh, A.J.; Marchant, B.P.; Williams, G.A. CO2 Storage Monitoring: Leakage Detection and Measurement in Subsurface Volumes from 3D Seismic Data at Sleipner. Energy Procedia 2014, 63, 4224–4239. [Google Scholar]
  18. Heath, J.E.; Bauer, S.J.; Broome, S.T.; Dewers, T.A.; Rodriguez, M.A. Petrologic and Petrophysical Evaluation of the Dallas Center Structure, Iowa, for Compressed Air Energy Storage in the Mount Simon Sandstone; Sandia National Lab. (SNL-NM): Albuquerque, NM, USA, 2013. [Google Scholar]
  19. Lahann, R.; Rupp, J.; Medina, C. An Evaluation of the Seal Capacity and CO2 Retention Properties of the Eau Claire Formation (Cambrian). Environ. Geosci. 2014, 21, 83–106. [Google Scholar] [CrossRef]
  20. Kruse, H.V. Heterogeneous Catalysis in Supercritical Media: 1. Carbon Dioxide. Chem. Eng. Technol. 2008, 31, 23–32. [Google Scholar] [CrossRef]
  21. Kang, S.M.; Fathi, E.; Ambrose, R.J.; Akkutlu, I.Y.; Sigal, R.F. Carbon Dioxide Storage Capacity of Organic-Rich Shales. SPE J. 2010, 16, 842–855. [Google Scholar] [CrossRef]
  22. Birkholzer, J.T.; Zhou, Q.; Tsang, C.F. Large-Scale Impact of CO2 Storage in Deep Saline Aquifers: A Sensitivity Study on Pressure Response in Stratified Systems. Int. J. Greenh. Gas Control 2009, 3, 181–194. [Google Scholar] [CrossRef]
  23. Oldenburg, C.M.; Rinaldi, A.P. Buoyancy Effects on Upward Brine Displacement Caused by CO2 Injection. Transp. Porous Media 2011, 87, 525–540. [Google Scholar] [CrossRef]
  24. Verdon, J.P.; Kendall, J.-M.; Stork, A.L.; Chadwick, A.R.; White, D.J.; Bissell, R.C. Comparison of Geomechanical Deformation Induced by Hydraulic Fracturing and CO2 Injection: A Case Study from the Weyburn CO2 Storage Project. Proc. Natl. Acad. Sci. USA 2013, 110, E2762–E2771. [Google Scholar] [CrossRef]
  25. Verdon, J.P. Microseismic Monitoring and Geomechanical Modeling of CO2 Storage in Subsurface Reservoirs. Ph.D. Thesis, University of Bristol, Bristol, UK, 2011. Available online: https://www1.gly.bris.ac.uk/~gljpv/PDFS/JamesVerdonThesis.pdf (accessed on 10 June 2024).
  26. Cheng, Y.; Liu, W.; Xu, T.; Zhang, Y.; Zhang, X.; Xing, Y.; Feng, B.; Xia, Y. Seismicity Induced by Geological CO2 Storage: A Review. Earth-Sci. Rev. 2023, 239, 104369. [Google Scholar] [CrossRef]
  27. Fathi, E.; Takbiri-Borujeni, A.; Belyadi, F.; Adenan, M.F. Simultaneous Well Spacing and Completion Optimization Using an Automated Machine Learning Approach: A Case Study of the Marcellus Shale Reservoir, Northeastern United States. Pet. Geosci. 2024, 30, petgeo2023-077. [Google Scholar] [CrossRef]
  28. Pham, V.V.; Fathi, E.; Belyadi, F. New Hybrid Approach for Developing Automated Machine Learning Workflows: A Real Case Application in Evaluation of Marcellus Shale Gas Production. Fuels 2021, 2, 286–303. [Google Scholar] [CrossRef]
  29. Lashari, S.Z.; Takbiri-Borujeni, A.; Fathi, E.; Sun, T.; Rahmani, R.; Khazaeli, M. Drilling Performance Monitoring and Optimization Using Artificial Intelligence Algorithms. J. Pet. Explor. Prod. Technol. 2019, 9, 2747–2756. [Google Scholar] [CrossRef]
  30. Ghahfarokhi, P.K.; Carr, T.; Bhattacharya, S.; Elliott, J.; Shahkarami, A.; Martin, K. A Fiber-Optic Assisted Multi-layer Perceptron Reservoir Production Modeling: A Machine Learning Approach in Prediction of Gas Production from the Marcellus Shale. In Proceedings of the Unconventional Resources Technology Conference, Houston, TX, USA, 23–24 July 2018. [Google Scholar]
  31. Ansari, A.; Fathi, E.; Belyadi, F.; Takbiri-Borujeni, A.; Belyadi, H. Data-Based Smart Model for Real Time Liquid Loading Diagnostics in Marcellus Shale via Machine Learning. In Proceedings of the SPE Canada Unconventional Resources Conference, Calgary, AB, Canada, 13–14 March 2018. D021S007R001. [Google Scholar]
  32. Ester, M.; Kriegel, H.-P.; Sander, J.; Xu, X. A Density-Based Algorithm for Discovering Clusters in Large Spatial Databases with Noise. In Proceedings of the 2nd International Conference on Knowledge Discovery and Data Mining (KDD-96), Portland, OR, USA, 2–4 August 1996; pp. 226–231. Available online: https://www.semanticscholar.org/paper/A-Density-Based-Algorithm-for-Discovering-Clusters-Ester-Kriegel/5c8fe9a0412a078e30eb7e5eeb0068655b673e86 (accessed on 14 June 2024).
  33. Moulavi, D.; Jaskowiak, P.A.; Campello, R.J.G.B.; Zimek, A.; Sander, J. Density-Based Clustering Validation. In Proceedings of the 2014 SIAM International Conference on Data Mining, Philadelphia, PA, USA, 24–26 April 2014. [Google Scholar]
  34. Greenberg, S.E. An Assessment of Geologic Carbon Sequestration Options in the Illinois Basin: Phase III; University of Illinois: Champaign, IL, USA, 2021. [Google Scholar]
  35. Fathi, E.; Arcentales, D.; Belyadi, F. Impacts of Different Operation Conditions and Geological Formation Characteristics on CO2 Sequestration in Citronelle Dome, Alabama. Energies 2023, 16, 3191. [Google Scholar] [CrossRef]
Figure 1. The Illinois Basin Decatur Project site, with the location of major project elements. CCS1 is the injection well and VW1 is the monitoring well. [https://netl.doe.gov/].
Energies 17 04421 g001
Figure 2. Map of IBDP site showing all microseismic events relative to CCS1 injection well and VW1 monitoring well from December 2011 to February 2018 (gray), with events from January 2012 to February 2012 highlighted.
Energies 17 04421 g002
Figure 3. Vertical and lateral distance distribution relative to injection in CCS1 of all microseismic events from December 2011 to February 2018 (gray), with events from January 2012 to 30 April 2012 highlighted. Log shows distribution of baffles and barriers recognized in log data.
Energies 17 04421 g003
Figure 4. CCS#1 injection well logs in left and VW#1 monitoring well in right. Track 1: caliper and gamma ray, Track 2: density, effective, and total porosity, Track 3: baffles obtained from well logs, Track 4 and 5: baffle intensity averaged over 5 and 10 ft using FMI log, Track 6: microseismic frequency per ft, and Track 7: PNL logs for 2014, 2016, 2018, and 2019.
Energies 17 04421 g004
Figure 5. (a) Optimal K-Means clusters identified by WCSS; (b) optimal K-Means clusters identified by Total Variation for 3D K-Means.
Energies 17 04421 g005
Figure 6. Three-dimensional K-Means clustering of SLB data showing horizontal and vertical extension of three clusters of micoseismic events through time, each color represents different cluster.
Energies 17 04421 g006
Figure 7. (a) Optimal K-Means clusters identified by WCSS; (b) optimal K-Means clusters identified by Total Variation for 2D subset of data projected on depth difference–horizontal difference distance to the injection point.
Energies 17 04421 g007
Figure 8. K-Means clustering of SLB data, showing horizontal and vertical extension of five clusters of microseismic events.
Energies 17 04421 g008
Figure 9. K-Means clustering of SLB data in 2D space of time and horizontal distance to injection point.
Energies 17 04421 g009
Figure 10. K-Means clustering of SLB data in 2D space of SLB Depth Difference with injection point and time.
Energies 17 04421 g010
Figure 11. K-Distance Graph of SLB dataset indicating optimum epsilon of 0.2 at the “Knee” point.
Energies 17 04421 g011
Figure 12. DBSCAN clustering of SLB dataset indicating 6 clusters and 1 outlier cluster.
Energies 17 04421 g012
Table 1. Comparison of Silhouette Score and Davies–Bouldin Index of 3 and 5 clusters identified as optimum number of clusters using WCSS and Total Variation techniques.
Number of Clusters Silhouette Score Davies–Bouldin Index
3 0.683 0.427
5 0.623 0.473
Table 2. Comparison of Silhouette Score and Davies–Bouldin Index of 3 and 5 clusters identified as optimum number of clusters using WCSS and Total Variation techniques for 2D subset of data mapped on depth difference–horizontal difference distance to the injection point.
Number of Clusters Silhouette Score Davies–Bouldin Index
3 0.623 0.464
5 0.651 0.355
Table 3. Silhouette Score and Davies–Bouldin Index analysis of different 2D subsets of the original dataset.
Data 2D Subsets Silhouette Score Davies–Bouldin Index
SLB Depth Difference vs SLB Horizontal Difference 0.651 0.355
Time vs SLB Horizontal Difference 0.638 0.461
SLB Depth Difference vs Time 0.638 0.461
Table 4. Silhouette Score of DBSCAN clustering.
EpsilonNumber of ClustersSilhouette Score
0.270.338
Disclaimer/Publisher’s Note: The statements, opinions and data contained in all publications are solely those of the individual author(s) and contributor(s) and not of MDPI and/or the editor(s). MDPI and/or the editor(s) disclaim responsibility for any injury to people or property resulting from any ideas, methods, instructions or products referred to in the content.

