Article

Effects of the Disbursement of EU Cohesion Policy 2014–2020 Funds on Improving the Energy Efficiency of Buildings in Poland and Germany

Institute of Socio-Economic Geography and Spatial Management, Maria Curie-Skłodowska University, 20-718 Lublin, Poland
*
Author to whom correspondence should be addressed.
Energies 2024, 17(17), 4417; https://doi.org/10.3390/en17174417
Submission received: 21 June 2024 / Revised: 23 August 2024 / Accepted: 28 August 2024 / Published: 3 September 2024
(This article belongs to the Section G: Energy and Buildings)

Abstract

:
Improving the energy efficiency of buildings (IEEBs) is crucial to achieving the European Union’s ambitious climate and energy goals. To channel these efforts, new policies, legislation, sources of funding, mechanisms for distributing funds, programs, and support tools are being introduced. The purpose of this study is to demonstrate the effects of the disbursement of EU Cohesion Policy 2014–2020 funds on IEEBs in Poland and Germany, filling the research gap regarding the regional differentiation of investments, beneficiaries, and the spatial distribution of subsidies and projects. An analysis was made of 7818 projects on IEEBs implemented under regional operational programs from European Regional Development Funds under Thematic Objective 4. This research was conducted for two main variables: (1) beneficiaries (8 categories) and (2) investments (8 categories). Based on this division, using a cluster analysis through the use of Ward’s agglomerative hierarchical clustering method, groupings were made in relation to beneficiaries (6 groups) and investments (6 group). The results allowed us to identify regional differences and similarities in the approach to the disbursement of funds on IEEBs, to indicate the main beneficiaries, to highlight trends in this regard, to demonstrate the impact of changes in territorial affiliation on investment targeting, and, furthermore, to capture the variation in the sophistication of the implementation of EU IEEB-related policies and legislation. The results provide a well-documented voice in the discussion of the effects of distributing EU funds for IEEBs in the regions of Poland and Germany and provide a basis for further comparative research.

1. Introduction

Energy is currently one of the key elements determining civilization’s development. Almost all spheres of life and sectors of the economy require energy support, resulting in an increase in demand and consumption globally. The growing demand for energy is one of the key challenges facing humanity’s economic, environmental, social, industrial, and academic development [1]. Dependence on electricity, especially fossil-based energy, is becoming a pressing problem for countries and regions, and reducing energy consumption is one of the most critical tasks for governments around the world [2]. Therefore, a number of initiatives have been launched to intensify global efforts to tackle rising temperatures, the complex consequences of which threaten our environment and health [3], mainly by implementing green solutions and shifting away from fossil fuels to renewable energy sources (RES) [4]. In recent years, the implementation of the Paris Agreement (2015) has mobilized countries worldwide to take decisive steps regarding the achievement of climate targets for reducing greenhouse gas (GHG) emissions and the final energy consumption and to set a horizon for achieving carbon neutrality. These efforts are particularly focused on key sectors: energy and industry, buildings, agriculture, waste management, and transportation [5].
Buildings are a key resource that account for about 40% of the world’s total annual energy consumption. This makes reducing energy consumption and associated GHG emissions in the built environment an important goal in the fight against global warming [1]. One of the key actions in this regard is improving energy efficiency, which according to the statutory definition, is understood as the ratio of the achieved magnitude of the utility effect of a given object, technical device, or installation, under typical conditions of its use or operation, to the amount of energy consumption by this object, technical device, or installation, or as a result of the performed service necessary to achieve this effect [6]. The efforts to improve the energy efficiency of buildings (IEEBs) in recent years have mobilized governments around the world to develop new policies, strategies, and regulations [7,8].
The European Union has actively joined these efforts since the 1990s, by adopting an ambitious energy and climate policy [9]. Significant differences in the levels and standards of the energy performance of buildings across member states (MSs) have prompted the EU to take policy action, the effective implementation of which has been firmly anchored in legislation, setting more stringent requirements for the efficiency of new heat sources, the reduction in CO2 emissions, and the removal of technical barriers to trade in construction products between MSs. After the formation of the United Nations Framework Convention on Climate Change at the Rio Summit in 1992, climate change mitigation has become a key element of EU policy actions [10]. These efforts are reflected in the EU 2020 Climate and Energy Package (the so-called 3x20% package) launched in 2008, which includes legislative initiatives that set, as a leading goal by 2020, a decrease in energy consumption, an improvement in energy efficiency, and an increase in the use of RES at 20%. One of the priorities was the building sector, which accounts for 40% of the EU’s energy consumption and 36% of GHG emissions, which mainly stem from construction, usage, renovation, and demolition [11,12]. This is mainly due to the fact that the stock of buildings in the EU is old (35% are more than 50 years old, and 90% were built before 1990) and has poor energy performance (about 75% of buildings are affected) [13].
The regulations introduced, particularly the amending of the Energy Performance of Buildings Directive (EPBD) [14], focus, on the one hand, on improving the energy efficiency of existing buildings, with an emphasis on reducing energy consumption and raising the technical standards of buildings through the implementation of environmentally friendly RES-based solutions. On the other hand, they emphasize the requirement to increase the share of nearly zero-energy buildings (NZEBs), i.e., buildings with a very high energy performance, where the nearly zero or very low amount of energy required should cover, to a very significant extent, energy from renewable energy sources, including energy from renewable sources produced on-site or nearby [14] (Article 2, 2). This is a pressing problem across the EU, because although building renovations cover about 11% of the building stock annually, the renovation to the NZEB ratio is still low (0.4% to 1.2% in MSs). To accelerate this process, the EPBD stated that new buildings occupied by public authorities have to be NZEBs by 2019, and all new buildings by 2021. Reducing energy consumption in buildings was further reinforced by the provisions of the Energy Efficiency Directive (EED) [15], which aimed to reduce the total final energy consumption by 9% by 2016 and required MSs to renovate 3% of government buildings annually as of 2014.
Introducing provisions of the Paris Agreement [16] mobilized the EU to further legislative efforts for IEEBs under the “Clean energy for All Europeans” package [17] and the 2018 amendments of the EPBD [18] and EED [19]. These efforts have been channeled since 2020 under the European Green Deal [20], and its part of the “Renovation Wave” strategy [13], and were implemented under the “Fit for 55” package [12], requiring member states to establish comprehensive strategies to achieve highly efficient, decarbonized building stocks and a cost-effective retrofitting of existing buildings into NZEBs by 2050. The 2023 EED recast [21] and the 2024 EPBD recast [22] facilitate accelerating the rate of energy renovation of buildings, supporting deep renovation, reducing energy consumption in buildings, increasing the use of RES, especially solar energy and a switch from fossil (e.g., gas and oil) to electrical heating and cooling systems, and introducing zero-emission buildings (ZEBs) focusing on achieving zero emissions during the operational phase of a building. Legislative work on IEEBs is presented in Figure 1.
These transformative roadmaps have resulted in widespread implementation in the construction and renovation sector of new solutions for better insulation in buildings, more efficient heating and cooling systems, and energy production from RES [23]. These include both active solutions for space heating and domestic hot water (e.g., heat pumps, boilers, district heating or decentralized heating, efficient lighting, and appliances) as well as passive technologies (based on thermal insulation to store energy) and increasing the use of renewable technologies (PV, solar thermal, geothermal, and biomass) [24,25].
To strengthen the effects of implementing policies and legislation to improve the energy efficiency of buildings, the European Commission is supporting member states with funds under national and regional operational programs [26]. The provisions of the 3x20% package were embedded in the Europe 2020 strategy for smart, sustainable, and inclusive growth [27], as the “20-20-20 Program”, assuming a reduction in greenhouse gas emissions, an increase in the use of renewable energy, and improved energy efficiency by 2020. These regulations set the framework for the EU Cohesion Policy (EU CP) interventions for 2014–2020. One of the strategic objectives was climate and energy action, promoting a low-carbon economy. Measures and investments were mainly implemented under Thematic Objective (TO) 4, “Supporting the shift towards a low-carbon economy in all sectors”, under the European Regional Development Fund (ERDF) and were supported by an allocation of more than EUR 28.5 billion (https://cohesiondata.ec.europa.eu/cohesion_overview/14-20; accessed on 18 July 2024). The geographical eligibility for support was based on Article 90 of the Regulation (EU) 1303/2013 [28]. Three categories of regions were distinguished according to the level of development achieved. These were the following: less developed regions, whose GDP per head (PPS) was less than 75% of the EU-27 average; transition regions (75–90%, respectively); and more developed regions (above 90%). In addition, EU regulations required member states to allocate a mandatory minimum share of available funding for this purpose in the form of 20% of national ERDF funds in more developed regions, 15% in transition regions, and 12% in less developed regions (https://ec.europa.eu/regional_policy/policy/themes/low-carbon-economy_en, accessed on 25 April 2024). These funds supported EU member states in comprehensively renovating their building stock and meeting ambitious NZEB standards [25]. In addition, new sources of funding, mechanisms for the distribution of funds, programs, and tools were introduced to support the activities of and investments in IEEBs, based mainly on the use of active, passive, and RES-based technical solutions [24,29].
IEEBs are a hot topic in academic debate. Typically, the issue is analyzed in several contexts. The first focuses on technical and technological issues and includes the development of best techniques for performance measurement and evaluation [30] or the implementation of efficient technologies in the building sector [31]. The second stream concentrates on creating sectoral policies to support the transition to low-carbon construction [32,33] and evaluating their effects [25,26,34]. The third group of works deals with various aspects of programming and financing of IEEB-oriented activities and investments, including mechanisms for the distribution of funds [35] and the financial instruments implemented [36]. The fourth, the least numerous, refers to the efforts of various actors for IEEBs, most often local governments [37] and enterprises [38]. Against this background, there is a noticeable paucity of scientific studies that synthesize research on the implementation of climate and energy policies, with its practical implications being in the sphere of investment financing and the entities involved [29]. Therefore, this study aims to identify the effects of the use of EU ERDF 2014–2020 funds on improving the energy efficiency of buildings in Poland and Germany, filling the research gap regarding the regional differentiation of implemented investments and their beneficiaries, as well as the spatial distribution of funds. In this context, three research questions were formulated: (1) how were IEEB subsidies distributed in the regions?, (2) which groups of beneficiaries were involved in the disbursement of IEEB funds?, and (3) which investments were prioritized?
To provide a quantitative and spatial overview of the subject phenomena, we selected and analyzed a total of 7818 projects (3914 in Poland and 3904 in Germany), implemented under 16 regional operational programs (ROPs) for Polish regions (voivodeships) and 15 operational programs (OPs) for German federal states (Länder). Detailed analyses were carried out on a NUTS2 basis for two main sets of variables—(1) beneficiaries (8 categories) and (2) investments (8 categories)—taking into account, in both cases, the share of projects and the share of funding for each voivodeship/federal state. Based on this breakdown, using a cluster analysis through the use of Ward’s agglomerative hierarchical clustering method, a grouping was made with respect to beneficiaries (6 groups) and investments (6 groups). The results identify regional differences and similarities in the approach to IEEB spending and its beneficiaries, capture trends in this regard, demonstrate the impact of changes in territorial affiliation on investment targeting, and further reflect differences in the advancement of the implementation of EU IEEB-related policies and legislation.

2. Motivation and Characteristics of Case Studies

2.1. Motivation

Two countries, Poland and Germany, were selected for analysis. The basis for this choice was the results of the work conducted by the authors on the distribution of funds for IEEBs in regions in Poland [29], which clearly stated that the spatial distribution of investments still reflects the post-partition division of Poland. This was particularly evident in the case of regions located in Prussia and the former Prussian partition (the western, southwestern, and northern parts of Poland), which were incorporated into Poland after World War II. In contrast, the eastern part of Germany, known as the Deutsche Demokratische Republik (DDR; in English: German Democratic Republic; informally known as East Germany) after World War II, was included in a bloc of socialist countries, as was the territory of Poland, which put their development trajectories on a completely different course [39] than the western part, the Bundesrepublik Deutschland (BRD; in English: the Federal Republic of Germany, informally known as West Germany). Poland, and the DDR after the fall of the Berlin Wall in 1990, entered a period of systemic transformation. Poland, as an independent state, had to find its own path of development. In turn, the DDR, after reunification, was able to benefit from the strength, experience, and connections of the economically better developed BRD [40]. In this context, it seems interesting to compare how the two countries are implementing EU policies on IEEBs. The research question formulated on this basis is as follows: do the changes in territorial affiliation matter?

2.2. Characteristics of Case Studies

In this article, we use the proper names of voivodeships and federal states in the original spelling. Below is a list of these names in English. For the Polish voivodeships, these are as follows: Dolnośląskie—Lower Silesian; Kujawsko–Pomorskie—Kuyavian–Pomeranian; Lubelskie—Lublin; Lubuskie—Lubusz; Łódzkie—Łódź; Małopolskie—Lesser Poland; Mazowieckie—Masovian; Opolskie—Opole; Podlaskie—Podlasie; Pomorskie—Pomeranian; Śląskie—Silesian; Świętokrzyskie—Świętokrzyskie; Warmińsko-Mazurskie—Warmian–Masurian; Wielkopolskie—Greater Poland; and Zachodniopomorskie—Westpomeranian. For the German states, these are as follows: Baden-Württemberg—Baden-Württemberg; Bayern—Bavaria; Berlin—Berlin; Brandenburg—Brandenburg; Bremen—Bremen; Hamburg—Hamburg; Hessen—Hesse; Niedersachsen—Lower Saxony; Mecklenburg–Vorpommern—Mecklenburg–Vorpommern; Nordrhein–Westfalen—North Rhine–Westphalia; Rheinland-Pfalz—Rhineland-Palatinate; Saarland—Saarland; Sachsen—Saxony; Sachsen-Anhalt—Saxony-Anhalt; Schleswig-Holstein—Schleswig-Holstein; and Thüringen—Thuringia.
Poland is divided into 16 voivodeships, which are units of territorial self-government of the 1st level in the 3-tier administrative division of the country (voivodeships, counties, and communes). After World War II, the territories that, from the end of the 18th century to the first half of the 19th century, were incorporated into Poland were under the Russian partition (the Lubelskie, Łódzkie, Podlaskie, Łódzkie, Świętokrzyskie, and Mazowieckie voivodeships); Prussian partition (the Śląskie, Dolnośląskie, Wielkopolskie, Zachodniopomorskie, Pomorskie, Kujawsko–Pomorskie, and Warmińsko-Mazurskie voivodeships); and Austrian partition (the Podkarpackie and Małopolskie voivodeships). All of these territories characterized a different density of the settlement network and the character of development [41]. These differences have not disappeared to this day despite the huge investment effort supported by EU funds after Poland’s accession to the EU in 2004 [42].
The German federal states (Länder) have the character of states with limited sovereignty. Following changes in the territorial division of Germany after World War II, the eastern part and the northeastern part of Prussen were annexed to Poland, and the remaining territory was divided into four occupation zones: the American, British, French, and Soviet zones. In 1949, the Deutsche Demokratische Republik was formed from the Soviet zone (Brandenburg, Mecklenburg–Vorpommern, Sachsen, Sachsen-Anhalt, and Thüringen), which was part of the socialist bloc states, and, from the remaining zones, the Bundesrepublik Deutschland was established, with the previously French-controlled Saarland additionally annexed in 1957. BRD joined the stream of social and economic change after World War II, becoming a leader in the international alliances that crystallized into the European Economic Community (EEC) in the 1950s, providing a strong foundation for the European Union established in 1992. In 1990, the unification of Germany took place [40]. Today Germany consists of 16 federal states, three of which are separate cities (Berlin, Hamburg, and Bremen). The areas of the former DDR underwent a strong reorganization and joined the current of socio-economic and urban transformations much faster than Poland, drawing on the models of the western states, as well as EU funds for investments [43].

3. Materials and Methods

3.1. Materials

This research is based on secondary sources from public domains on IEEB investments subsidized under TO4 from ERFF 2014–2020 within the framework of regional operational programs (ROPs) in Poland and state operational programs (OPs) in Germany. For Poland, the primary data source was the portal Fundusze Europejskie (European Funds) (www.funduszeeuropejskie.gov.pl, https://mapadotacji.gov.pl/; accessed on 3 April 2023) of the Ministry of Funds and Regional Policy. In the case of Germany, the websites of ministries and institutions responsible for the disbursement of European funds in the states (Länder) were used [44,45,46,47,48,49,50,51,52,53,54,55,56,57,58]. We worked on a dataset and collected data up to 3 April 2023. The Annex to the Commission Implementing Regulation (EU) No. 184/2014 [59] provided the basis for selecting investments meeting the criteria for areas of support for the energy efficiency of buildings. Data from the National Court Register (in Polish: Krajowy Rejestr Sądowy; KRS) (https://www.gov.pl/web/sprawiedliwosc/krajowy-rejestr-sadowy; accessed on 24 April 2023) (Poland) and the website www.aleo.com (https://aleo.com/int/; accessed on 3 April 2023) (Germany) were used to identify the sector of activity of the beneficiaries. The subsidy amounts analyzed were based on the methodology for calculating the maximum amount of subsidy included in Regulation (EU) No. 1303/2013 [28]. In characterizing EU legislations regarding IEEBs, directives, regulations, and communications from EU public domains were used (https://eur-lex.europa.eu/; accessed on 10 May 2024).

3.2. Research Assumptions and Methodology

The research program is based on three stages of our own design, which are described in the following subsections.

3.2.1. Selection of Projects for Analysis

Based on the set of projects co-financed under TO4 from ERFF 2014–2020 under 16 ROPs and 15 OPs, using desk research [60] and the purposive selection method [61], investments that met the criteria for the areas of intervention for the support of IEEBs, according to EC Regulation No. 184/2014 [59], were selected. These are categories of intervention from the sections coded as follows: 013—energy efficiency renovation of public infrastructure, demonstration projects, and supporting measures; 014—energy efficiency renovation of existing housing stock, demonstration projects, and supporting measures; 068—energy efficiency and demonstration projects in SMEs and supporting measures; and 069—support to environmentally friendly production processes and resource efficiency in SMEs. Projects implemented under these intervention codes were not always directly related to improving the energy efficiency of buildings but also involved investments in their surroundings or promotional and educational actions. Therefore, using a purposive sampling method [61], these projects were eliminated. In Poland, these were street lighting projects. In the case of Germany, the catalog of exclusions was much broader and included the following: the purchase of electric cars, the installation of electric car chargers, information systems, public transportation, bicycle parking at buildings, playgrounds, the European Energy Prize, training, measures and information campaigns, websites, and the establishment of institutions/offices. Finally, a total of 7818 projects (3914 from Poland and 3904 from Germany) were selected for further analysis.

3.2.2. The Selection of the Subject of Analysis

The source materials allowed us to obtain complete data on the type of beneficiary and the type of investment. Based on data from the National Court Register and aleo.com, each beneficiary was checked for its activities and was assigned to one of the leading eight categories (Table 1). The type of investment was verified based on project descriptions obtained from the Polish government portal (www.funduszeeuropejskie.gov.pl, https://mapadotacji.gov.pl/; accessed on 3 April 2023) and portals of individual states [45,46,47,48,49,50,51,52,53,54,55,56,57,58,59]. The eight categories of most frequently implemented investments were distinguished (Table 1). For the FIS category, the same figures (allocations) were analyzed as for FI, since the beneficiary of the funds was a financial institution (FI), which redistributed the obtained funds in the form of IEEB-oriented financial instrument (FIS).

3.2.3. Statistical Analyses

The first step involved the selection of methods and variables for statistical analysis. We decided to use the cluster analysis, which involves grouping objects by searching for homogeneous subsets in a heterogeneous set of objects in such a way that objects belonging to the same groups are as identical among themselves as possible, while being as different as possible from objects in the other resulting groups [62,63]. This method is widely used in analysing similarities and differences between countries, regions, or cities in economic [64], political [65], or social terms [66]. In our case, the use of this method was intended to demonstrate regional (rather than national) differences and similarities in the disbursement of EU funds for IEEBs. According to the logic of the research conducted resulting from the assumptions of this study and the availability of source data, the variables are the categories of beneficiaries and investments selected in the 2nd stage of this work (Table 1). Detailed analyses were carried out for data on the share of each category of beneficiaries and the share of each category of investments in relation to the disbursed amounts (calculated in accordance with Regulation 1303/2013) and projects implemented in the voivodeships/states. It was assumed that each region is a separate observation. Therefore, the state of Hamburg was excluded in the selection of variables, due to the fact that it constituted an empty set (no IEEB projects were implemented here).
The next step was to calculate the coefficient of variation for each variable of the eight categories of beneficiaries and eight categories of investments (Table 1), which assumed values above the accepted value of 10%, which means that the variables are qualitative in terms of the information they have and in terms of being sufficiently differentiated for this study. Analyses were carried out separately for beneficiary and investment categories. Due to the highly divergent scale of the variables, the data were normalized by transformation according to the following formula:
(xij − xj)/sj i = 1, …, n; j = 1, …, p
where
  • xij—the observation value;
  • xj—the average score in the sample;
  • sj—the standard deviation of the sample.
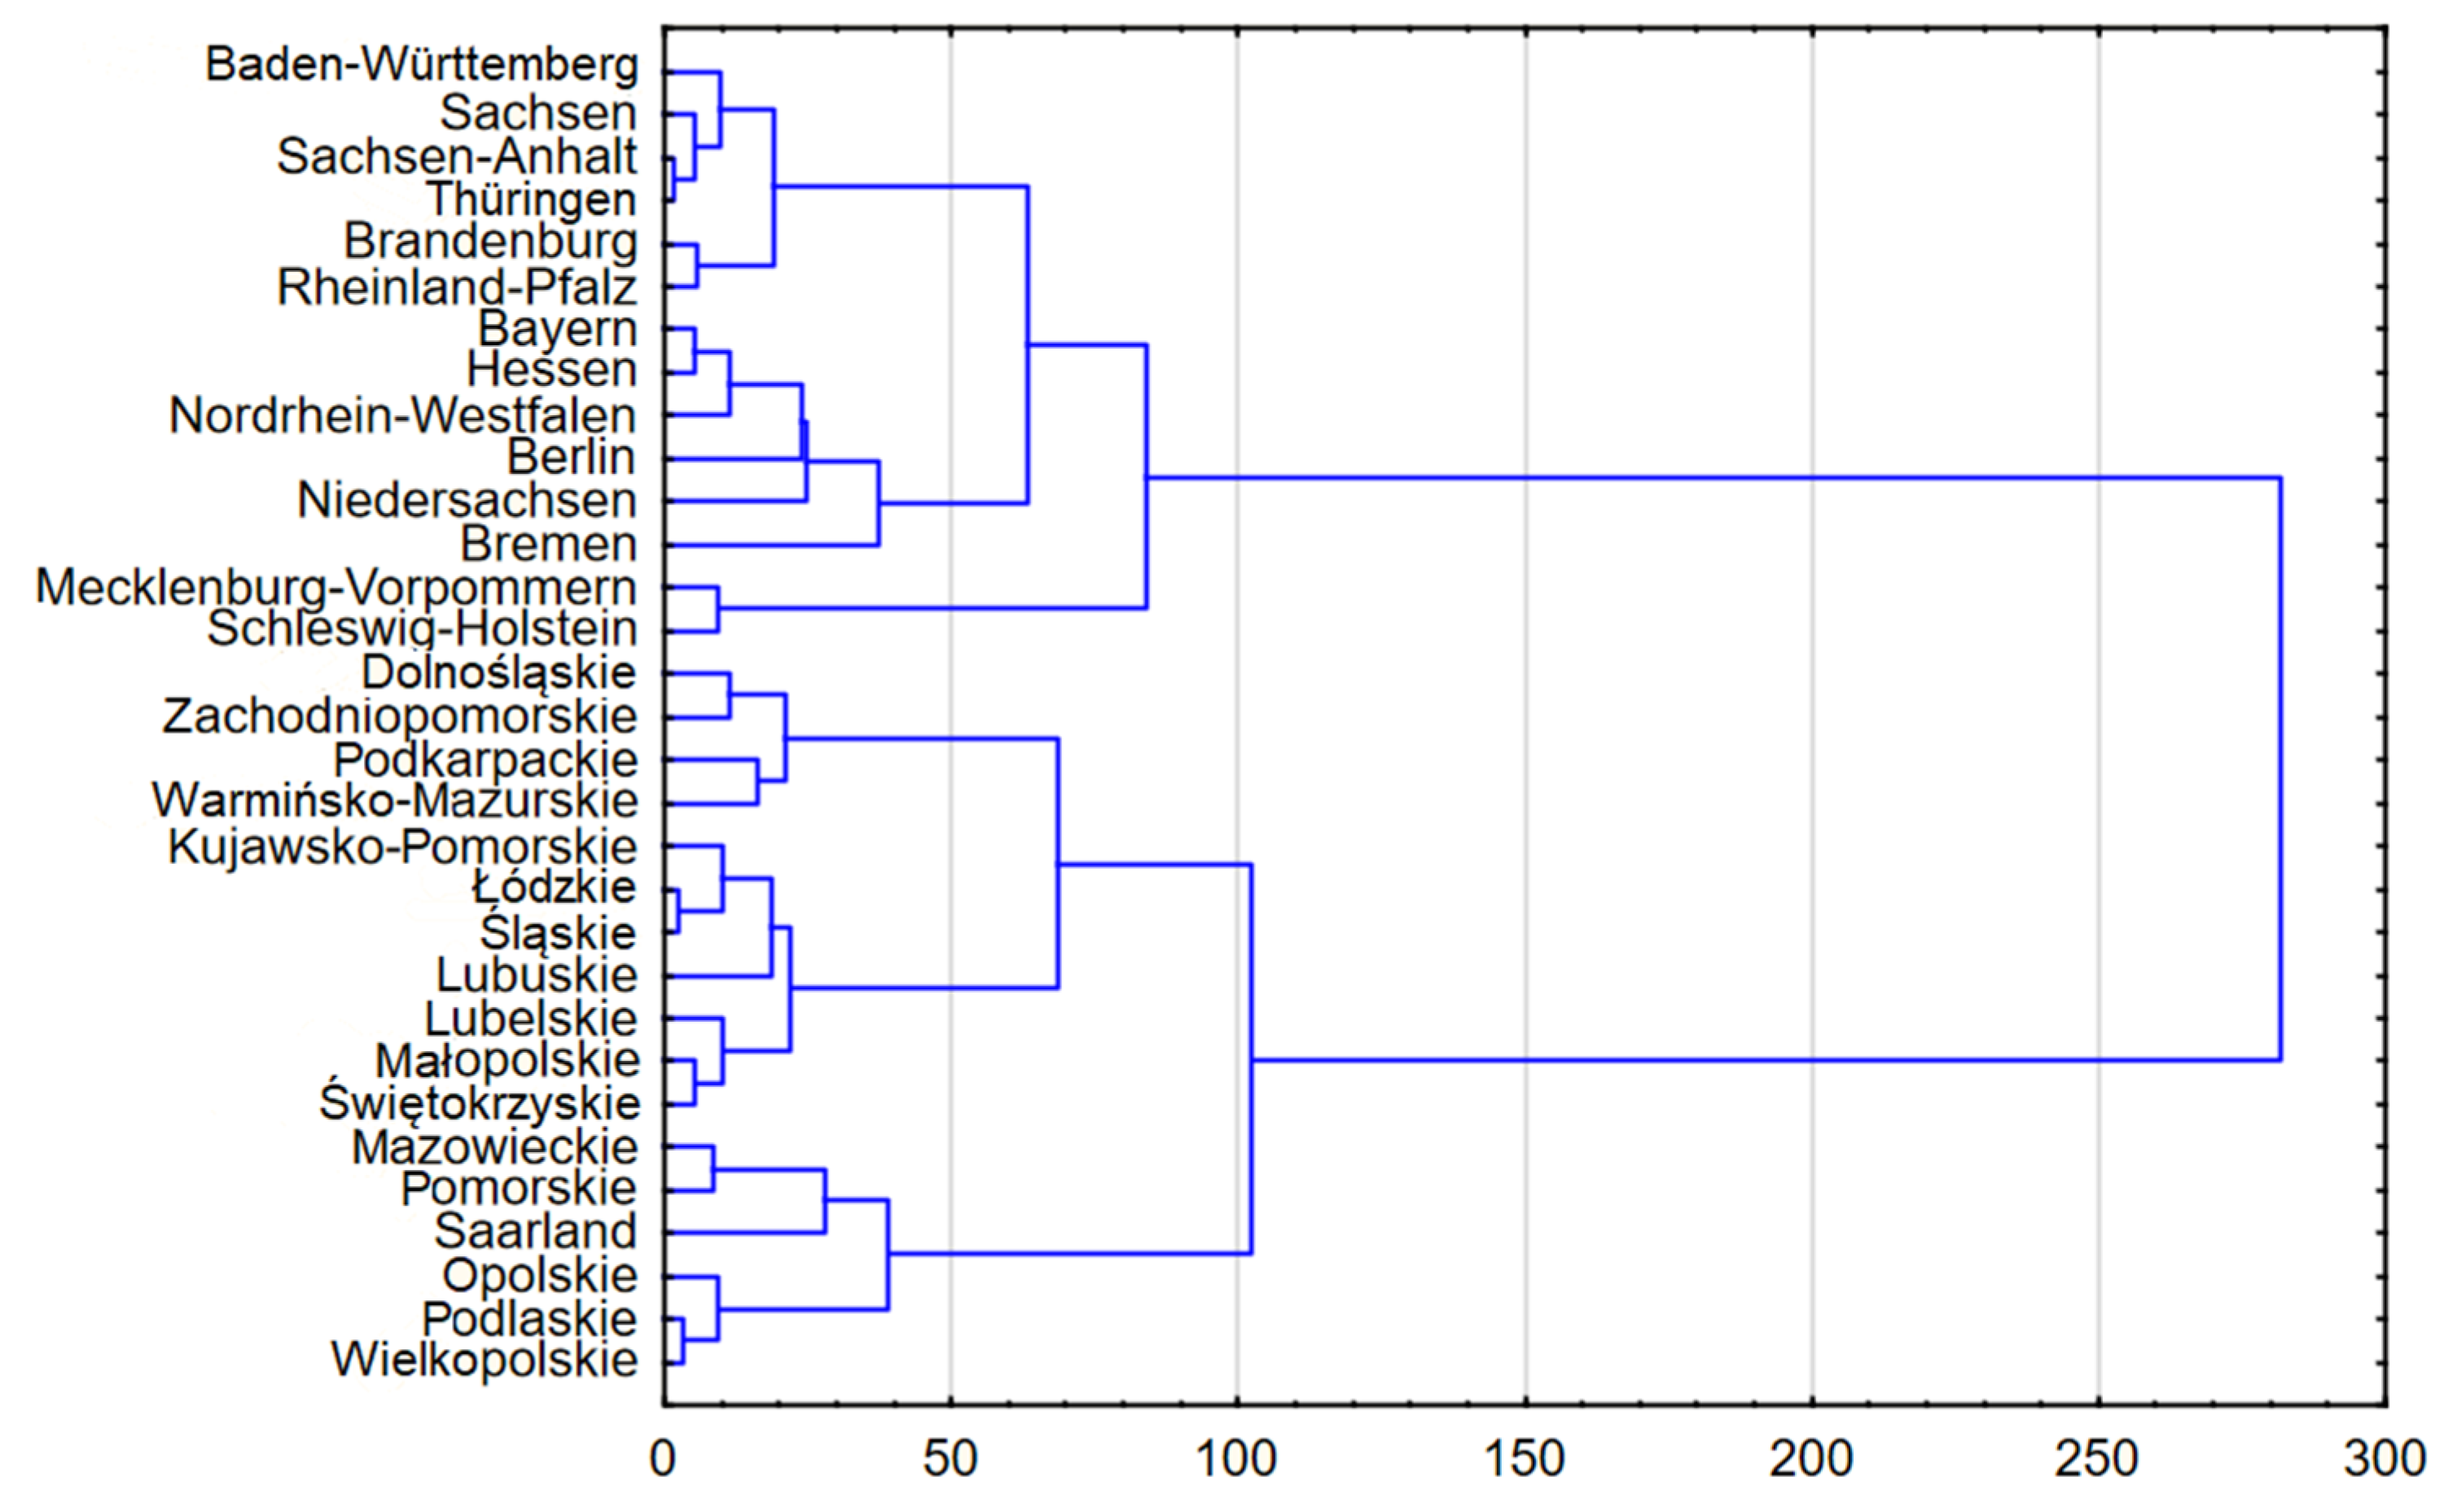
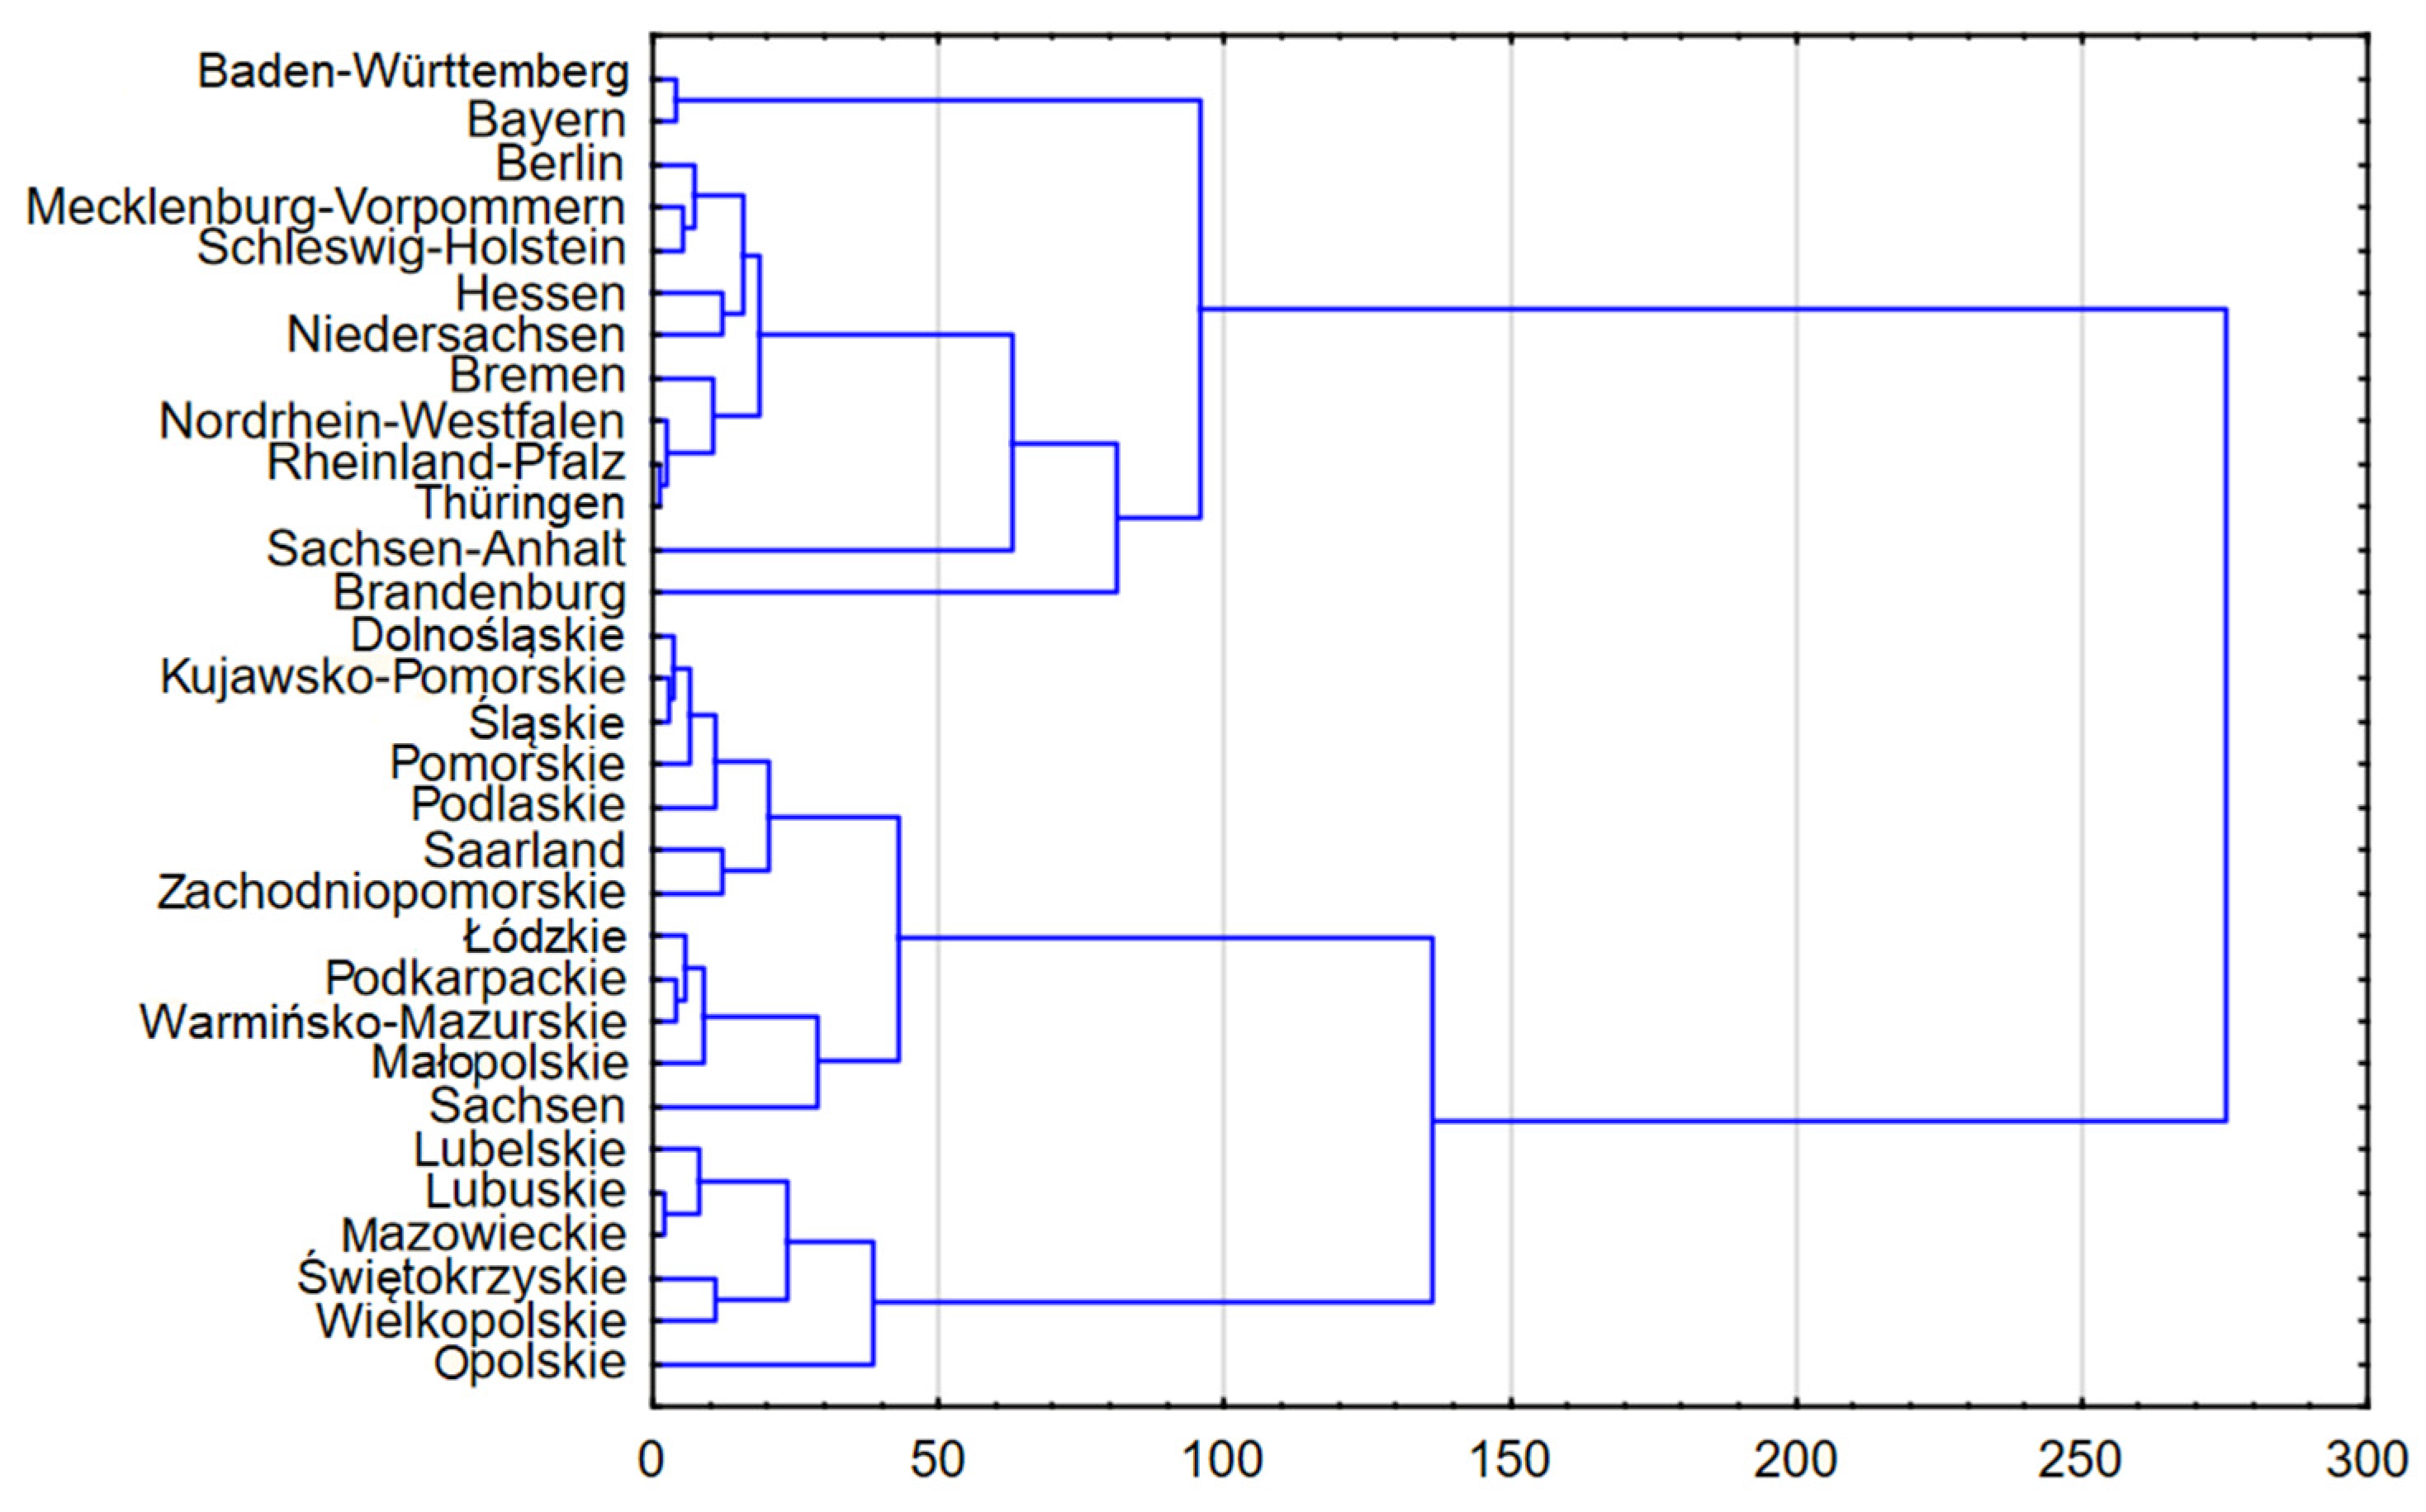
The result was standardized variables with a mean equal to zero and a variance equal to one. Agglomerative hierarchical clustering using Ward’s method with a squared Euclidean distance was used to create similar groups. Ward’s method allowed for the efficient use of the variance analysis during the steps of estimating the distance between the clusters formed, while the selection of a quadratic Euclidean distance was made due to highlight small differences between objects. The primary advantage of Ward’s method is that it aims to minimize the sum of squared differences within clusters. This means that this method focuses on forming clusters in such a way that the differences between elements within a cluster are as small as possible, leading to more homogeneous groups. Due to its principle of minimizing within-cluster variances, Ward’s method often results in more stable and interpretable outcomes compared to other hierarchical methods, such as single linkage (nearest neighbor) or complete linkage (furthest neighbor), which may lead to less homogeneous clusters. To determine the appropriate number of clusters, the dendrograms were cut at a rescaled distance of 50 (i.e., beneficiaries and investments), which resulted in the generation of six groups in both cases. The position of this cut determined the number of clusters and their composition. The cut was made at the cut-off point where an increase in the merging cost becomes significant, suggesting that further merging would merge dissimilar clusters. The dendrograms obtained for beneficiaries are presented in Figure 2 and for investments, in Figure 3.
Then, on the basis of previous analyses, a comparison of the effects of the disbursement of EU funds on improving the energy efficiency of buildings in Polish voivodeships and German states (Länder) was made. A graphical depiction of the research program is shown in Figure 4. The results, described in Section 4.1, Section 4.2 and Section 4.3, are illustrated in Figure 5, Figure 6, Figure 7, Figure 8, Figure 9 and Figure 10. Cartograms and graphs were developed to graphically present the collected statistical material; the maps were made using QGIS 3.16 Hannover. The cartograms in Figure 5 show the percentage of subsidies and Figure 6, the percentage of projects by region (voivodeships and states). In Figure 7, Figure 8, Figure 9 and Figure 10, the cartograms present divisions by groups of beneficiaries (Figure 7 and Figure 8) and investments (Figure 9 and Figure 10). The pie charts, in turn, show the allocations per region for beneficiaries (Figure 7) and investments (Figure 9), as well as the number of projects implemented in each region for beneficiaries (Figure 8) and investments (Figure 10). The results are discussed in Section 5 and a conclusion of the study is provided in Section 6.

4. Results

4.1. Financing of IEEBs in Poland and Germany

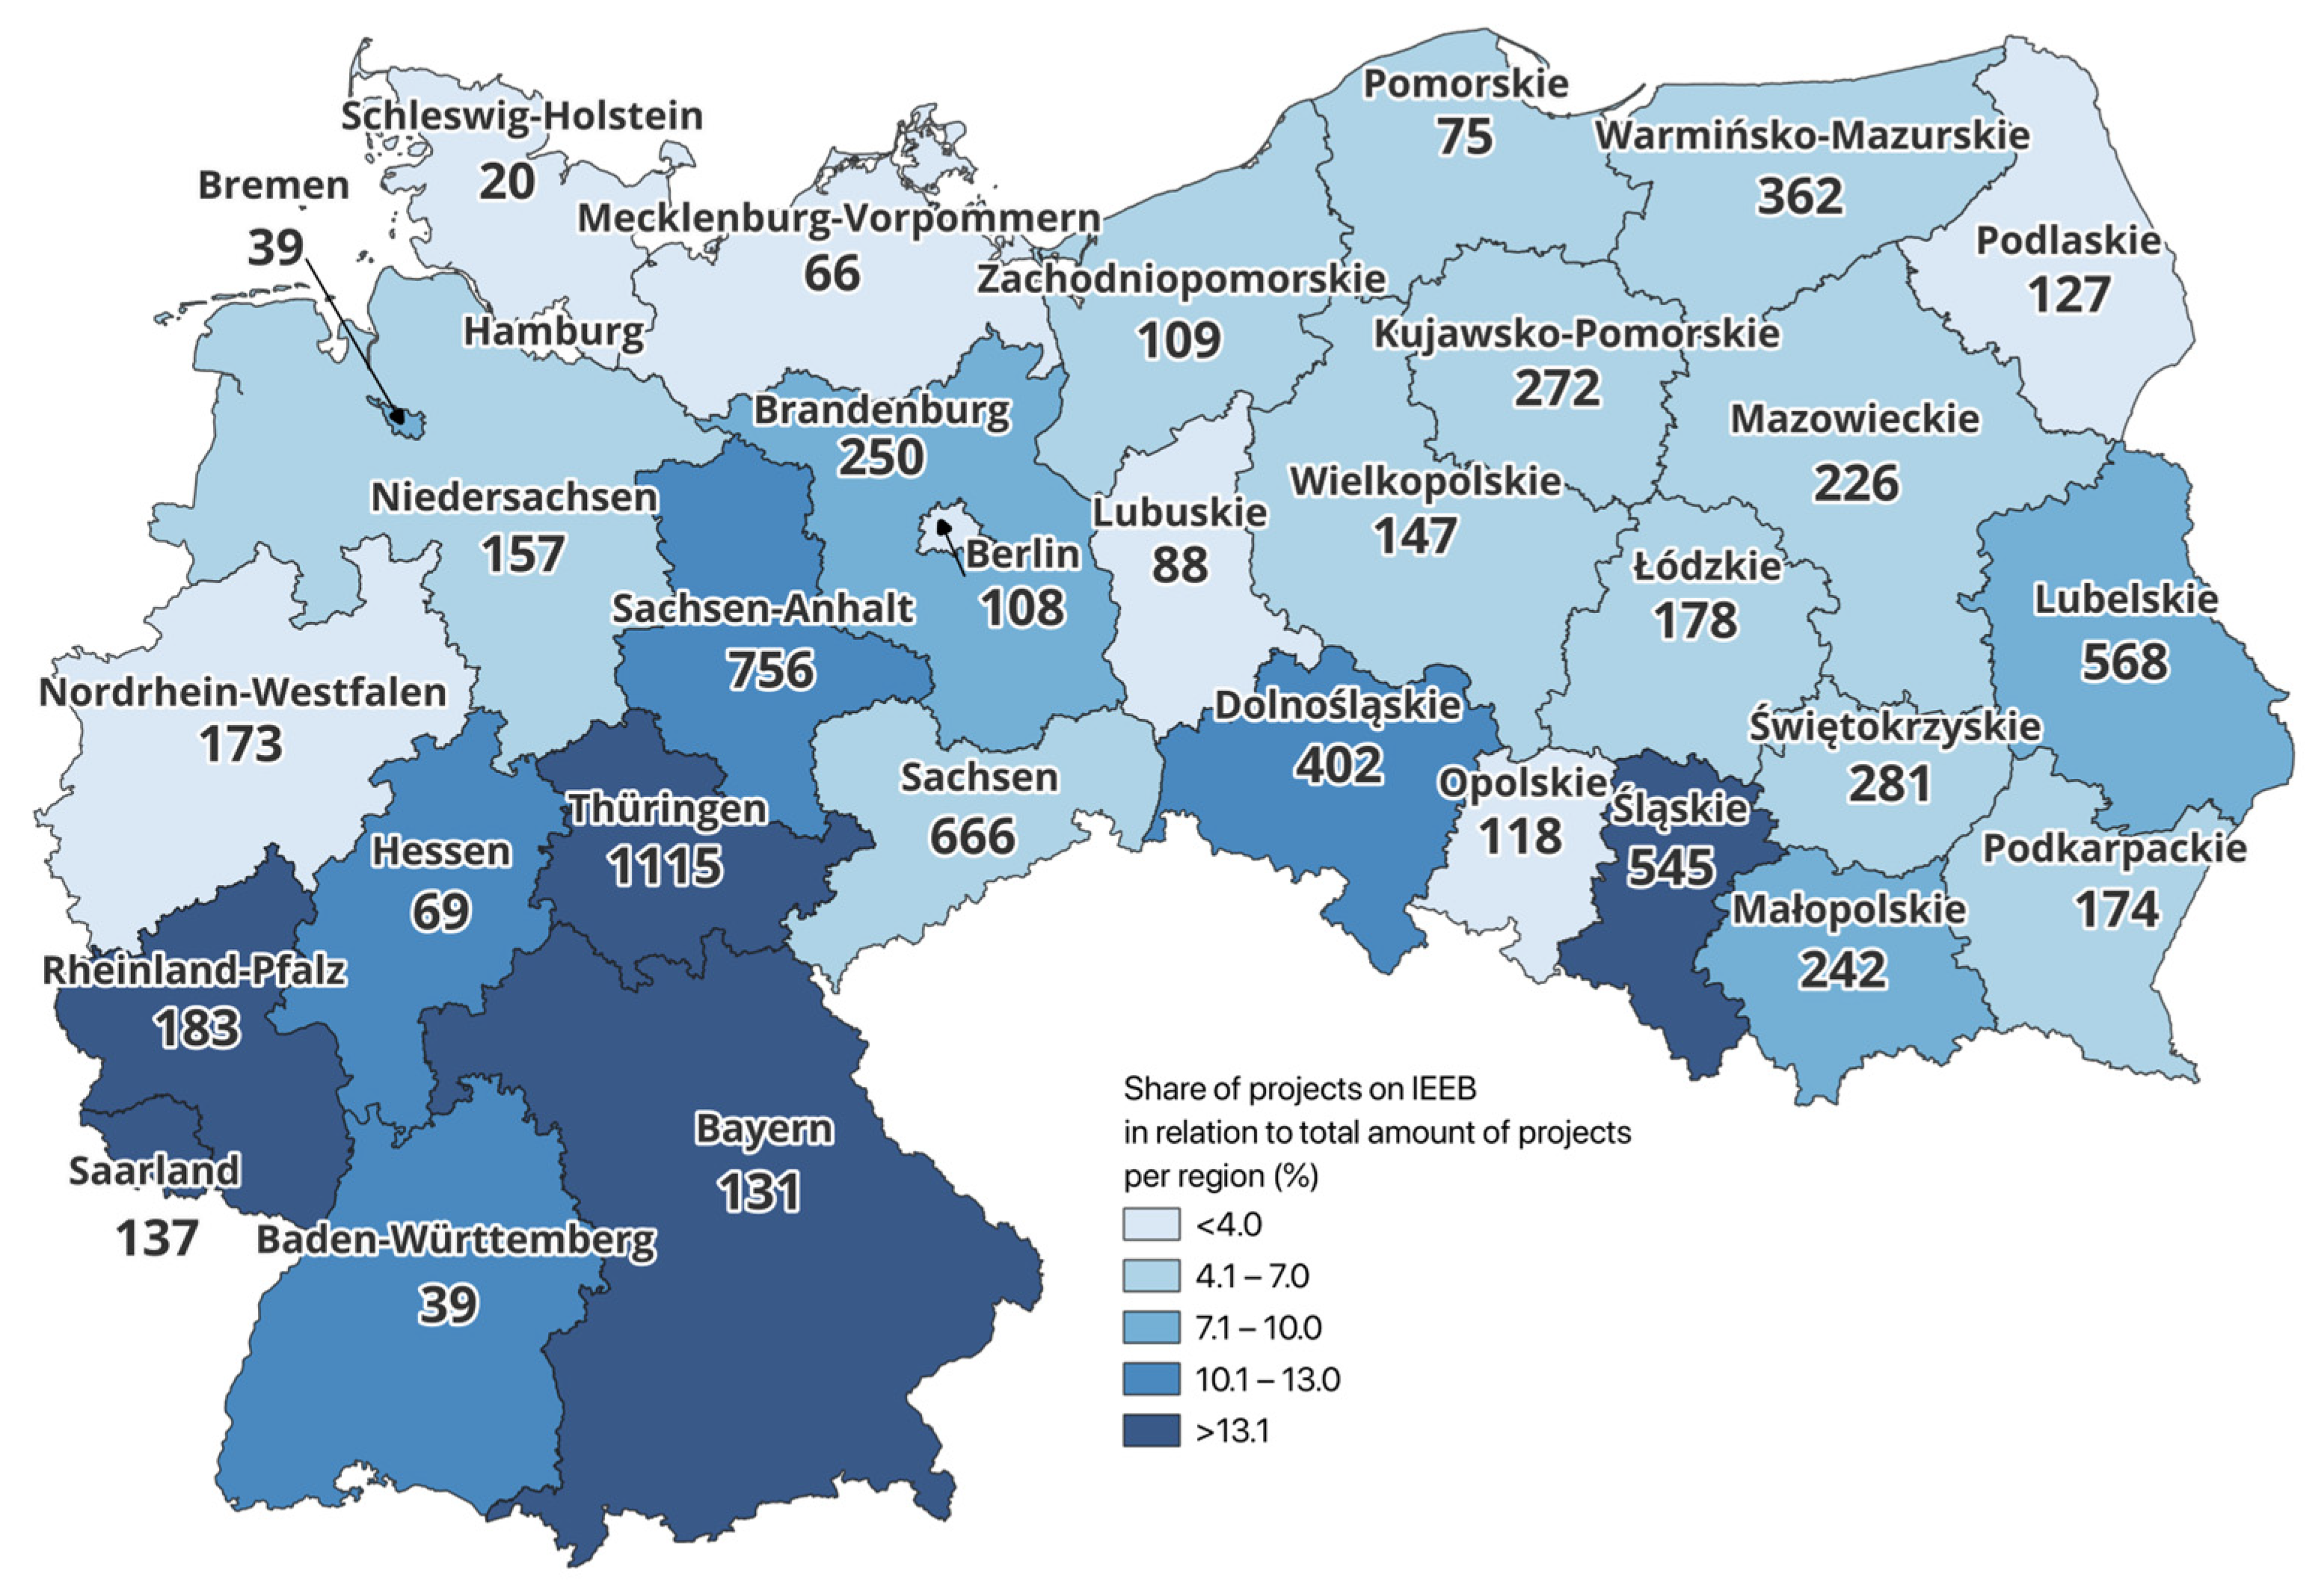
Investments to improve energy efficiency in Germany from the ERDF 2014–2020 under TO4 were implemented under 15 operational programs. According to this research, EUR 1.209 billion was spent on IEEBs. The largest allocations were disbursed in Sachsen (EUR 246.2M) and Sachsen-Anhalt (EUR 221.2M) and the lowest in Schleswig-Holstein (EUR9.0M) and Bremen (EUR 5.8M) (Figure 5). Most funds, in relation to the total amount of subsidies, were allocated in Bayern (24.1%), and the smallest amount was allocated in Mecklenburg–Vorpommern (1.3%). Regionally, subsidies for IEEBs averaged 6.7%. A total of 3904 projects were implemented: from 20 in Schleswig-Holstein to 1115 in Thüringen (Figure 6). The average project value was EUR 309K, reaching a maximum in Bayern (EUR 1.34M) and a minimum in Saarland (EUR 88K).
Figure 5. Comparison of the subsidies on IEEBs (in M) to the share of allocations on IEEBs in the total amount of ERDF 2014–2020 subsidies per region in Poland and Germany.
Energies 17 04417 g005
Figure 6. Comparison of the number of projects on IEEBs in the regions to the share of projects on IEEBs in the total number of projects per region in Poland and Germany.
Energies 17 04417 g006

4.2. Type of Beneficiaries

4.2.1. Group 1B
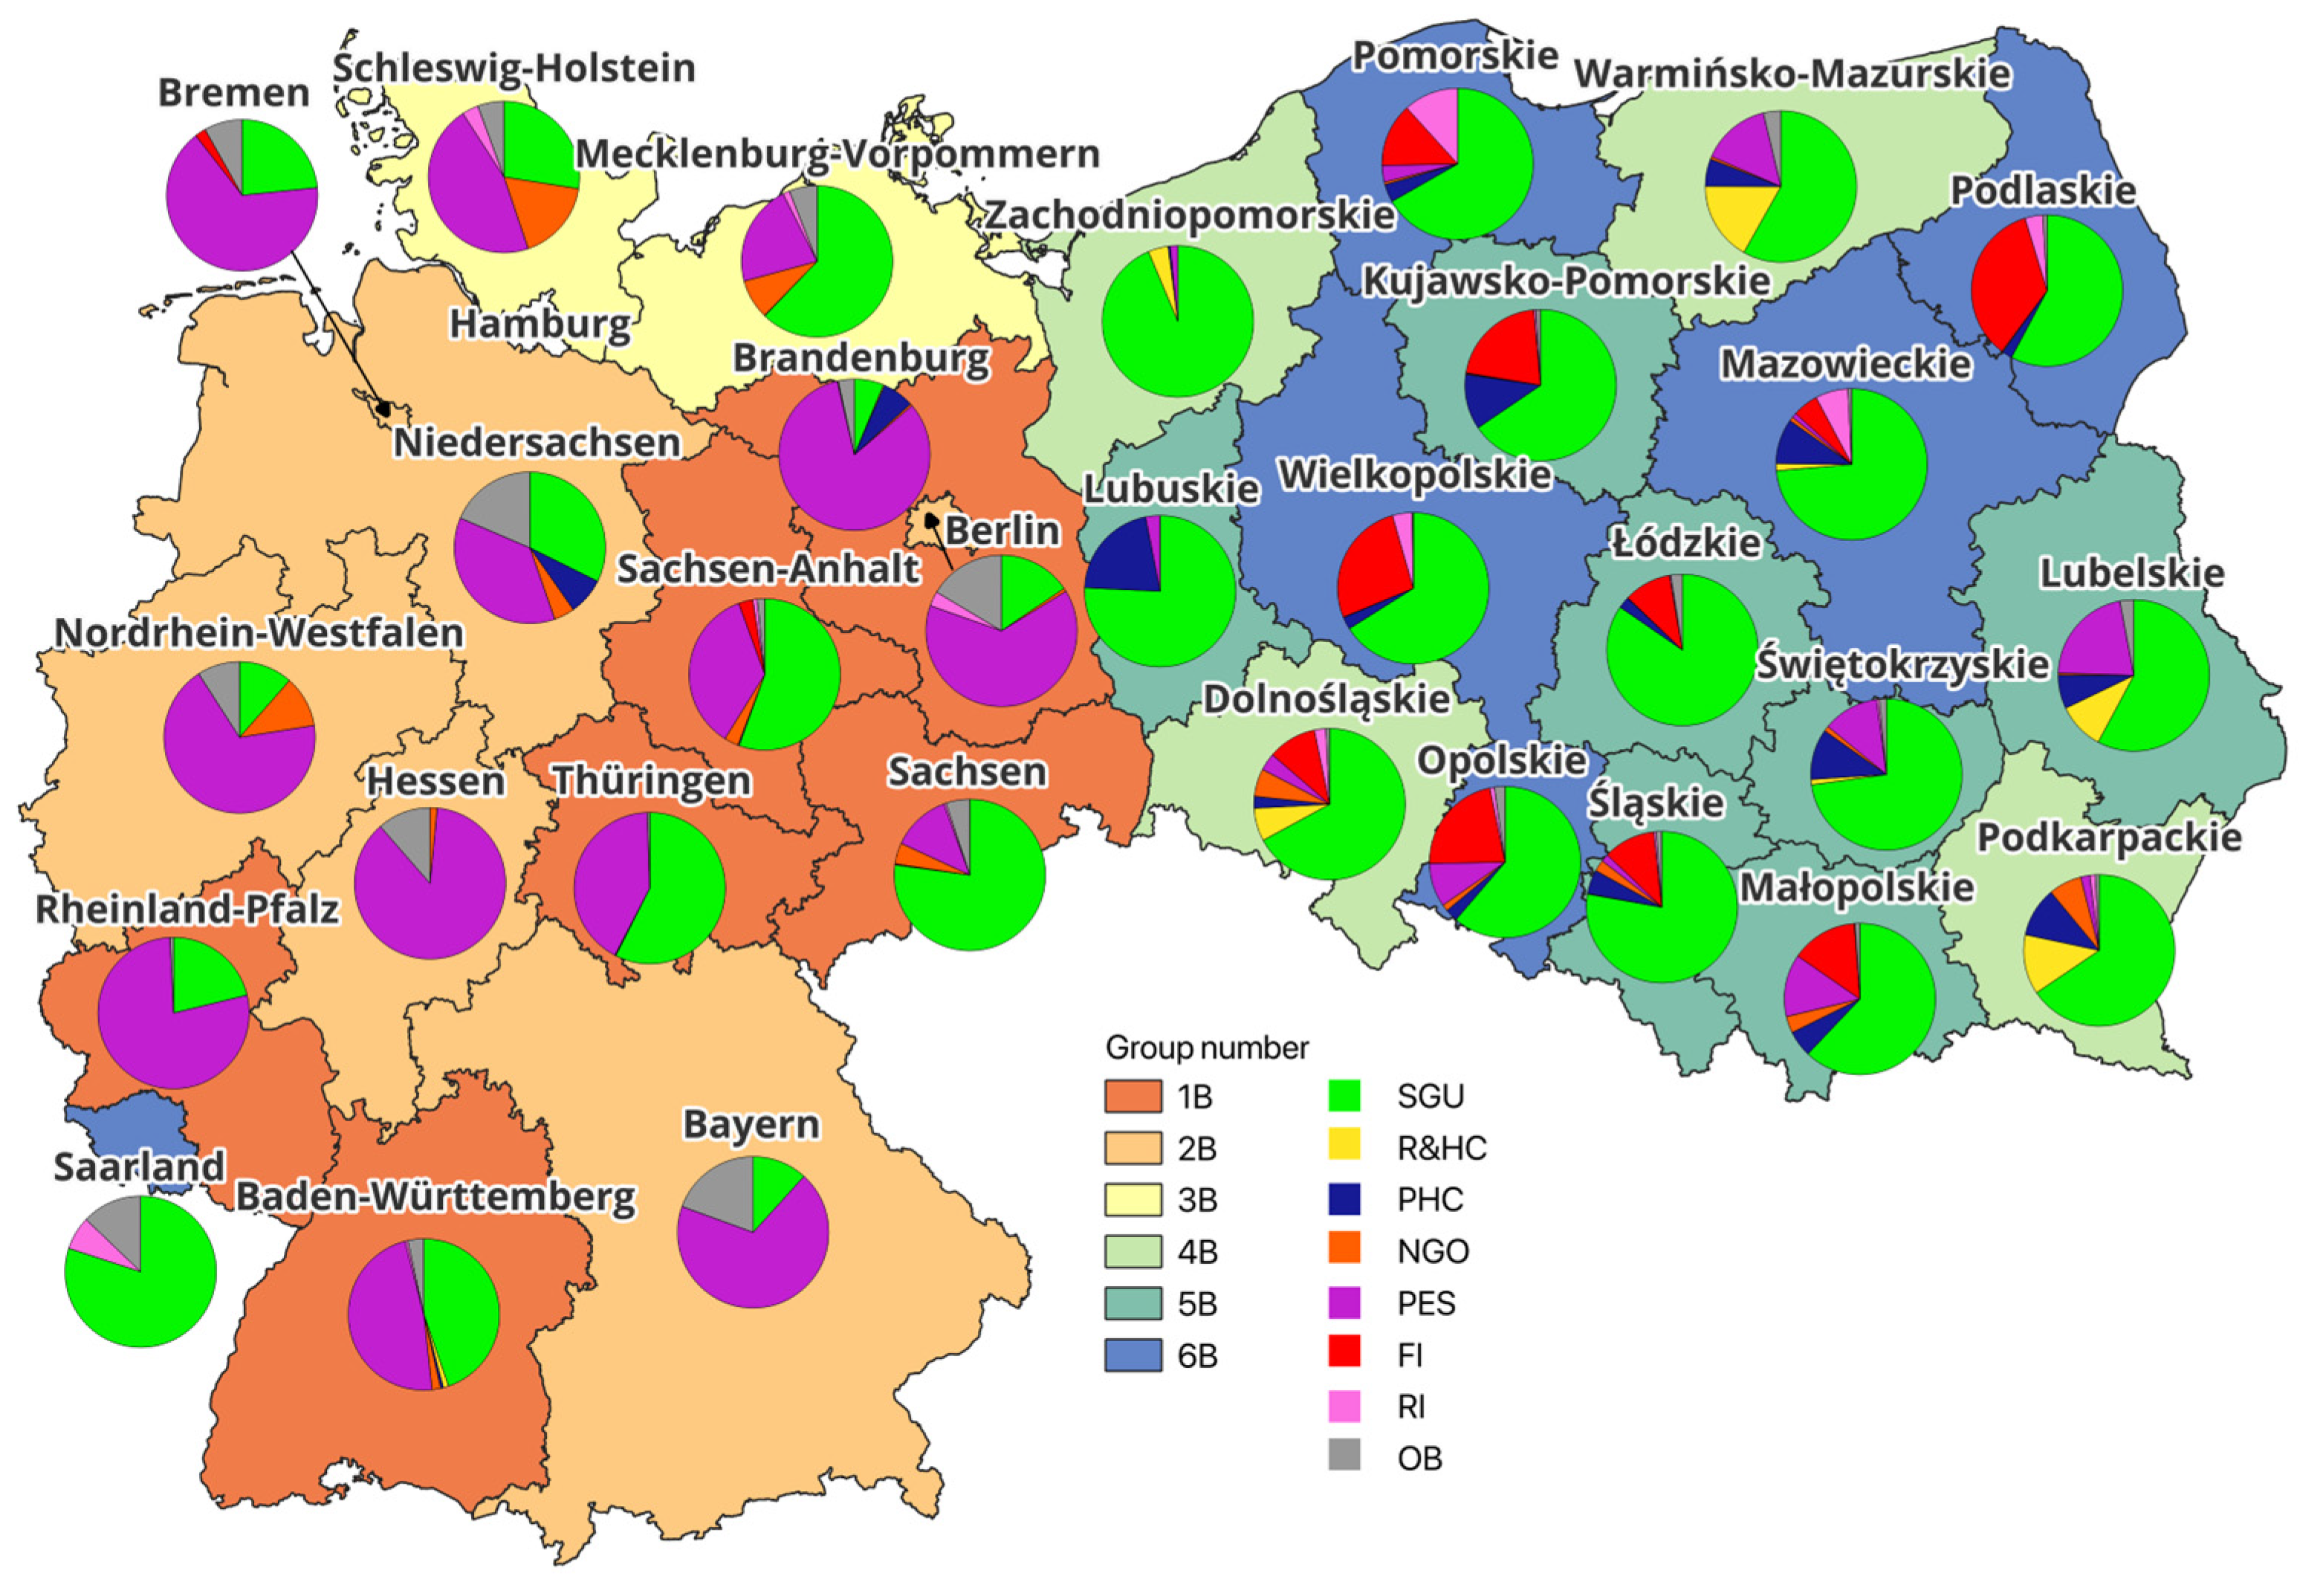
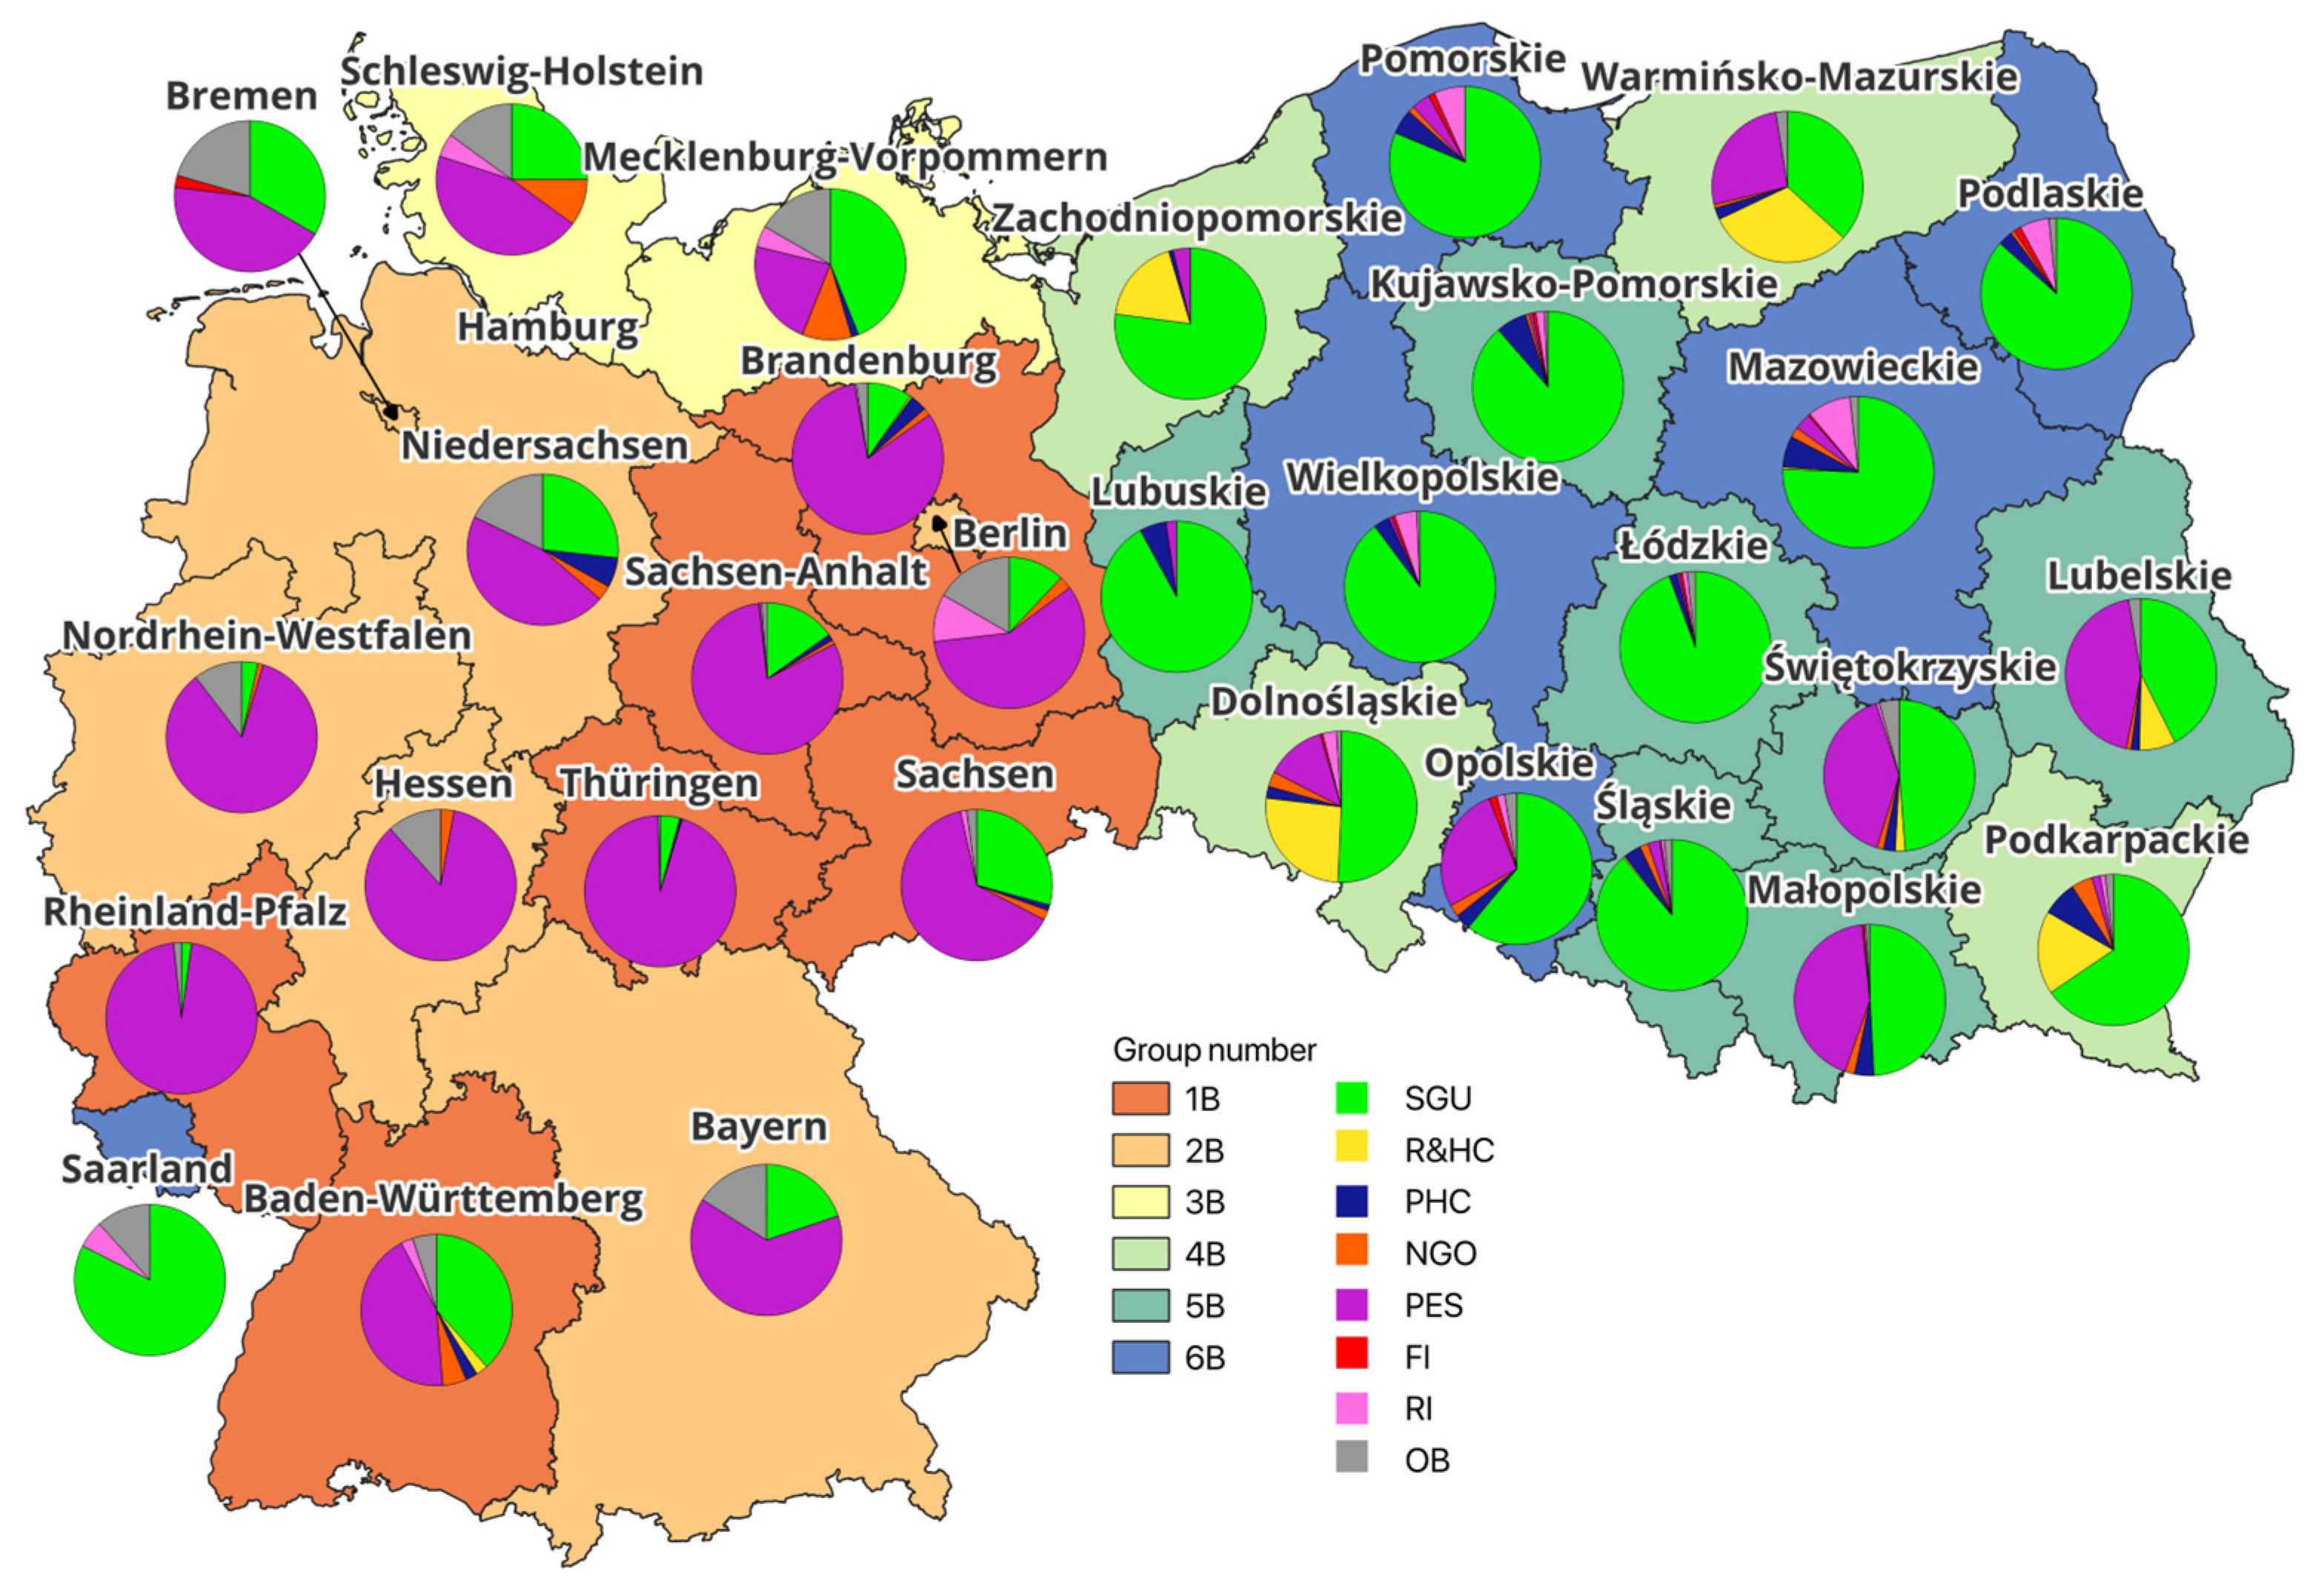
Group 1B included the German federal states of Baden-Württemberg, Rheinland-Pfalz, Thüringen, Sachsen-Anhalt, Brandenburg, and Sachsen. This group is distinguished by the dominance of two categories of beneficiaries—private enterprises and SGUs (Figure 7 and Figure 8). The predominance of enterprises is particularly evident for the share of projects implemented (80–96%) and, only in two federal states, also for the amount of subsidies obtained (Brandenburg, 82.6%; Rheinland-Pfalz, 78.0%). In Sachsen, Sachsen-Anhalt, and Thüringen, high shares of SGU subsidies were observed (77.2%, 55.5%, and 57.4%, respectively) with an incomparably low (from relative to private enterprises) number of implemented projects (from 29.2% to 64.0%, from 15.2% to 80.8%, and from 4.2% to 94.8%, respectively). The exception is Baden-Württemberg, where both the amounts of subsidies to SGUs (44.7%) and enterprises (47.7%) and the share of projects implemented by them (38.5% and 43.6%, respectively) are at similar levels. On the other hand, a characteristic feature of group 1B is the negligible, in some cases zero, share of religious institutions, NGOs, residential and housing communities, and the financial sector.
Figure 7. Share of subsidies in the regions by type of beneficiary.
Energies 17 04417 g007
Figure 8. Share of projects in the regions by type of beneficiary.
Energies 17 04417 g008

4.2.2. Group 2B

Group 2B consists of the states of Bayern, Berlin, Bremen, Hessen, Niedersachsen, and Nordrhein–Westfalen. In this group, entrepreneurs are a distinctive category in terms of both the amount of funding obtained (from 36.8% in Niedersachsen to 87% in Hessen) and the number of projects implemented (from 43.6% in Bremen to 85.5% in Hessen). Compared to group 1B, on the one hand, there was a smaller share of local governments in terms of the amount of subsidies (11–32%) and projects implemented (3–33%); most were in Niedersachsen (32.3% and 26.7%) and Bremen (23.4% and 33.3%). On the other hand, the share of beneficiaries in the OB category strengthened significantly (respectively, 8–19% and 10–19.4%), especially from the states of Bayern (19.4% of allocations), Bremen (20.5% of projects), and Niedersachsen (18.6% and 17.8%). The greatest diversification of beneficiary categories was evident in Niedersachsen. As in group 1B, beneficiaries from the categories of public health, religious institutions, NGOs, R&HCs, and the financial sector recorded very low, often zero, shares. Only in Berlin did the share of religious institutions exceed 10.2% of the number of projects and 3.2% of the subsidy amounts.

4.2.3. Group 3B

Group 3B consists of two Baltic states. In Mecklenburg–Vorpommern, SGUs have a high share of both the amount of funding (62.2%) and the number of projects (43.9%), while the share of entrepreneurs is just over 20%. Schleswig-Holstein has the opposite proportions (SGUs, 25%; entrepreneurs, 45%). Other beneficiaries obtained about 6% of the subsidy amounts and implemented about 15% of the projects. There was an additionally increased share of NGOs, which obtained 8.5–17.3% of the subsidies and implemented about 10% of the projects.

4.2.4. Group 4B

Group 4B consists of four Polish voivodeships: Dolnośląskie, Podkarpackie, Warmińsko-Mazurskie, and Zachodniopomorskie. In each of them, SGUs dominate in terms of the amount of subsidies (58.1–93.6%) and the number of projects (36.7–77.1%). The largest share was recorded in the Zachodniopomorskie voivodeship. Residential and housing communities stand out in group 4B, especially in terms of the share of completed projects (17.8–31.2%), with the share of subsidies not exceeding 17%; the highest values were recorded in the Warmińsko-Mazurskie voivodeship. This voivodeship also stands out in terms of the share of private enterprises (14.8% and 26.2%). The shares of other categories of beneficiaries, religious institutions, NGOs, the financial sector, and public health care range from 0 to 10%.

4.2.5. Group 5B

Group 5B consists of seven Polish voivodeships: Kujawsko–Pomorskie, Łódzkie, Małopolskie, Lubelskie, Lubuskie, Śląskie, and Świętokrzyskie. As in group 4B, there is a strong dominance of SGUs (57.8–84.6% of the subsidy amounts and 42.6–94.4% of projects); the highest values were recorded in the Łódzkie, Śląskie, and Lubuskie voivodeships. High subsidies for beneficiaries in the health care category (21.1% in Lubuskie) and financial institutions (20.9% in Kujawsko–Pomorskie) also stand out in this group. On the other hand, the Lubelskie, Małopolskie, and Świętokrzyskie voivodeships have the highest share of projects implemented by entrepreneurs (44.2%, 42.9%, and 40.2%, respectively, with subsidies of 21.5%, 13.3%, and 12.0%). The rest of the beneficiary categories have shares of no more than 3% (the exception is R&HCs in Lubelskie, with a share of 10.1% of subsidies and 7.8% of projects).

4.2.6. Group 6B

Group 6B consists of five voivodeships (Podlaskie, Pomorskie, Mazowieckie, Opolskie, and Wielkopolskie) and one federal state (Saarland). Among the beneficiaries, SGUs definitely dominate (57.8–80.0% of the subsidy amounts, 67.6% on average, and 61.0–89.8% of projects, 79.5% on average). In terms of the subsidies received, the financial sector also stands out, especially in Podlaskie (as much as 35.1%), Wielkopolskie (26.8%), and Opolskie (22.0%), as well as religious institutions, especially in terms of subsidies obtained in Pomorskie (11.8%) and projects implemented in Mazowieckie (9.3%). In addition, the OB category was prominent in Saarland (12.8% of subsidies and 11.7% of projects), and PESs, in Opolskie Voivodeship (9.4%; 27.1%). There were no beneficiaries from the R&HC category, and there was a negligible share of NGOs (about 1–2%).

4.3. Investments

4.3.1. Group 1I

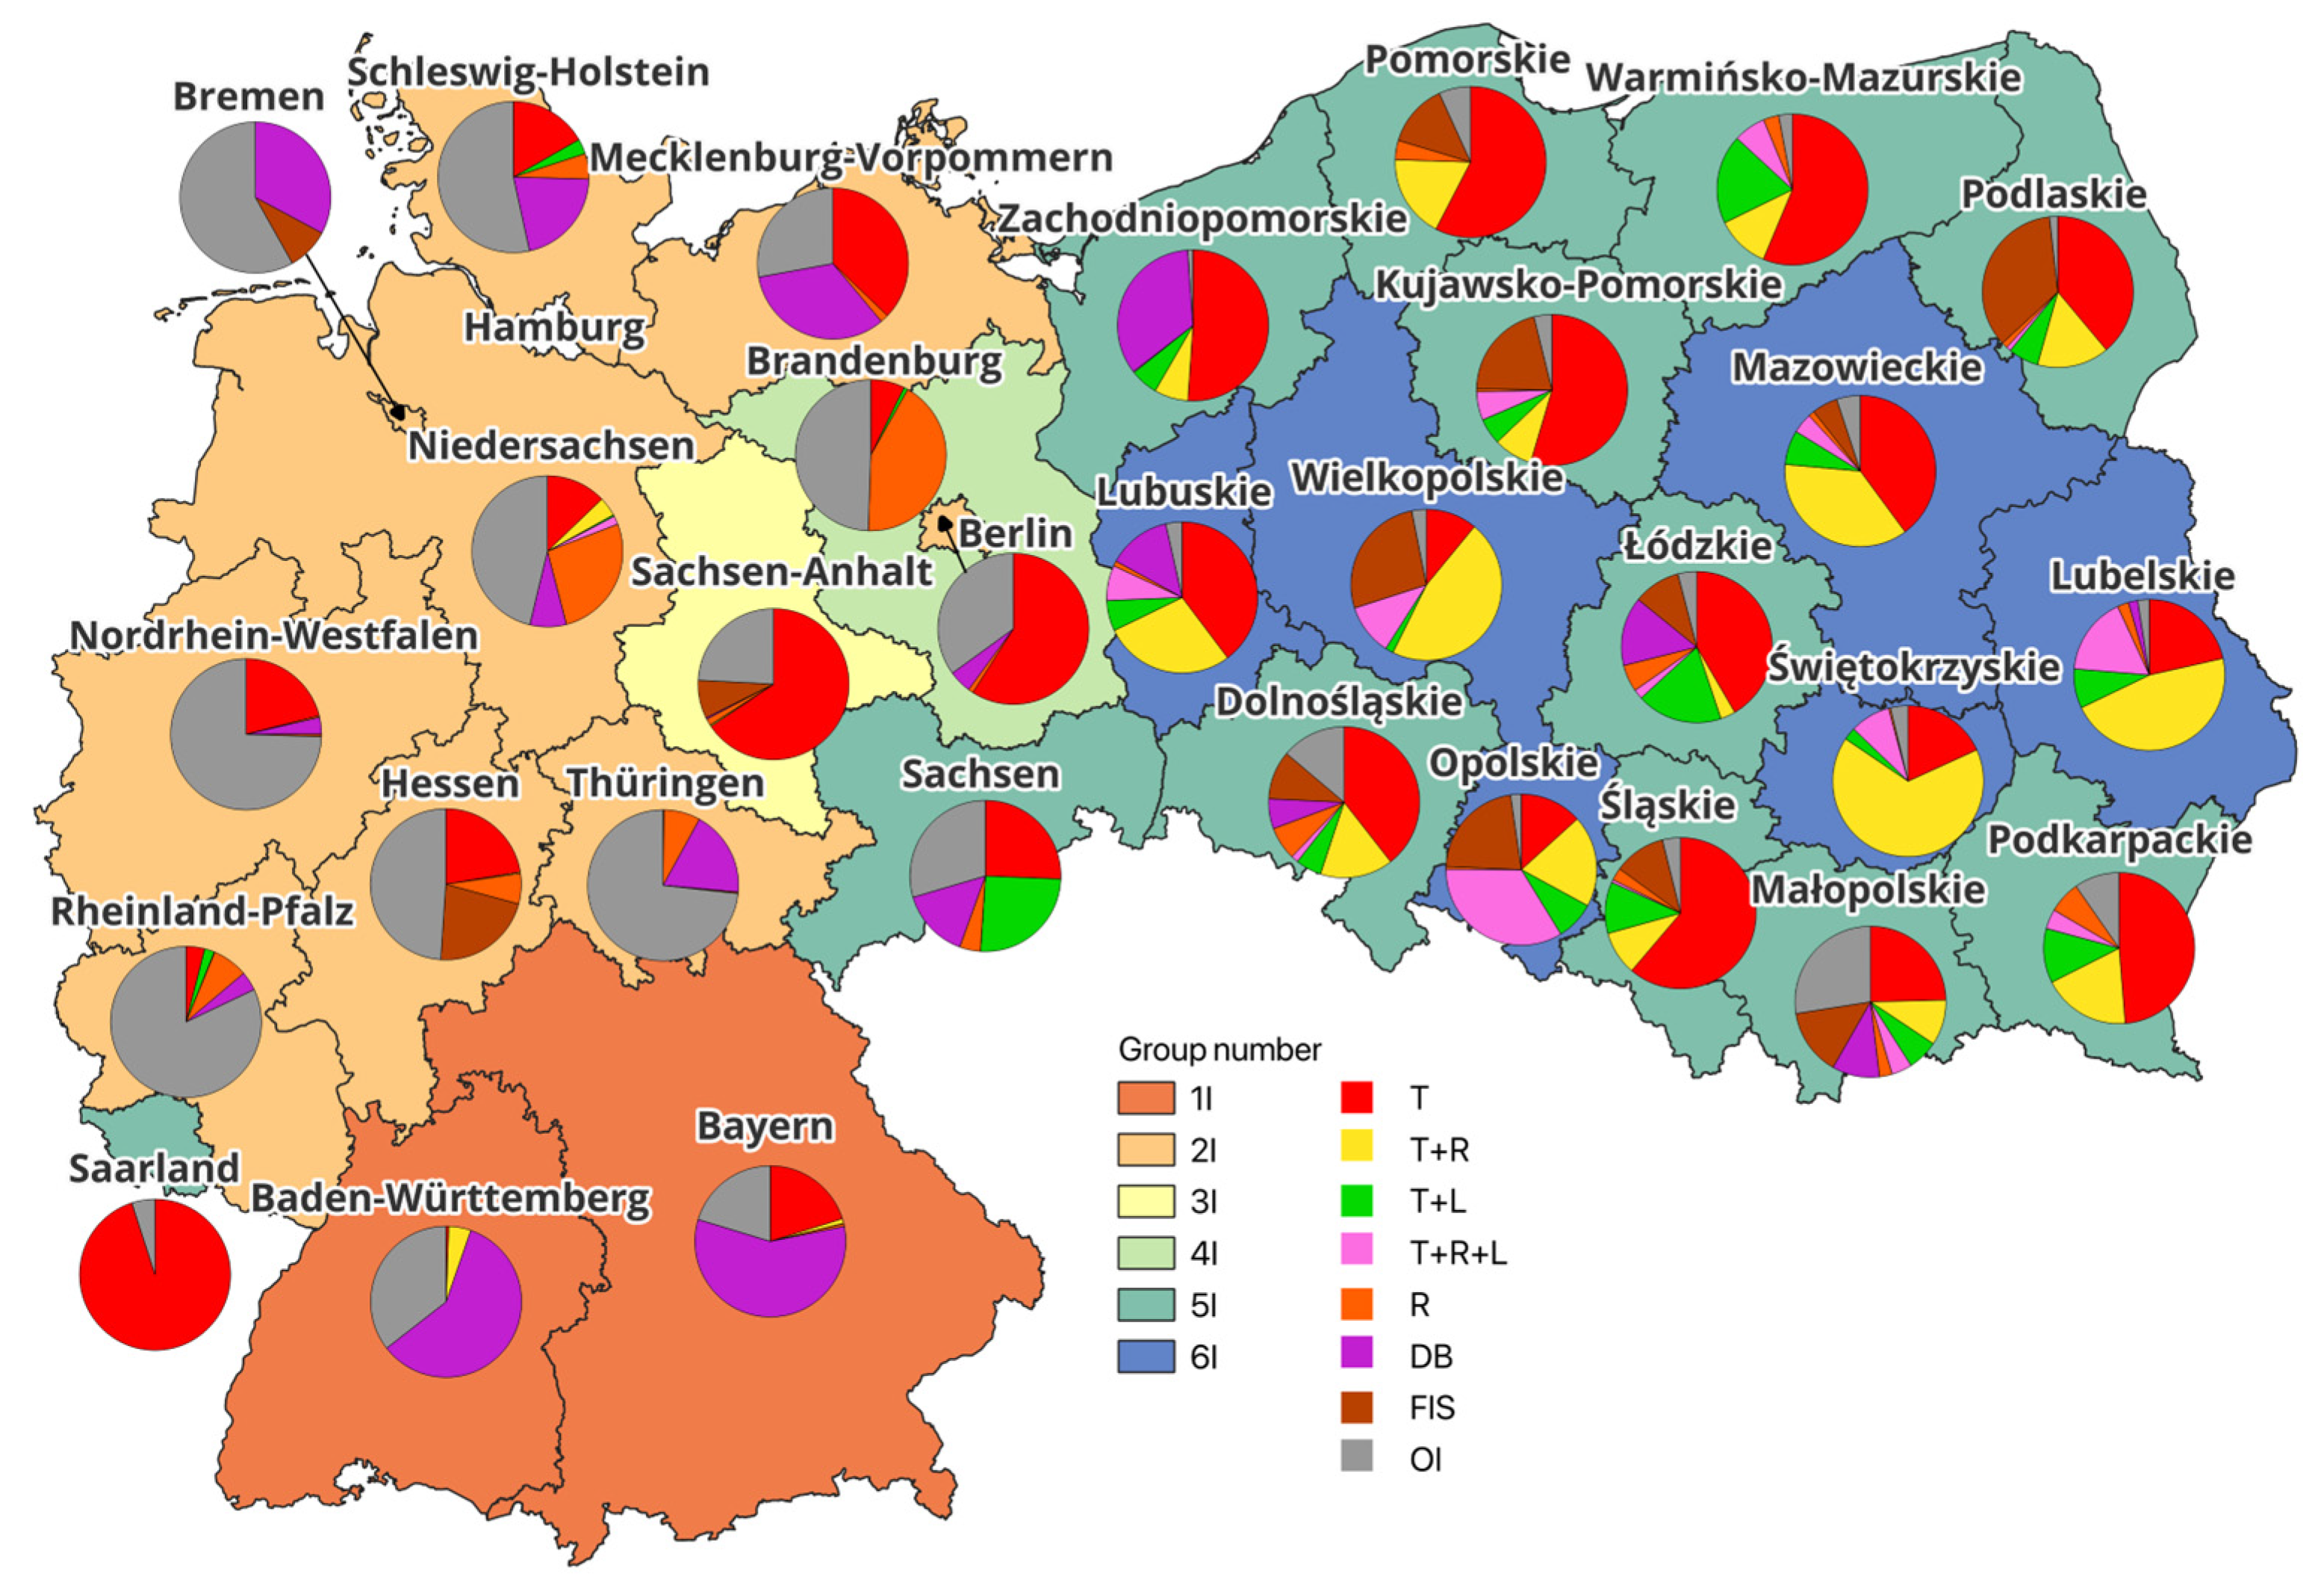
Group 1I consist of two southernmost German federal states of Baden-Württemberg and Bayern (Figure 9 and Figure 10). In both cases, investments from the DB category predominated, accounting for about 59% of the subsidies, with a significant variation in the unit value of projects (in Baden-Württemberg, EUR 10.4M was spent for 28 projects while in Bayern, EUR 101.8 M for 64 projects). Another distinctive category in both states was OI and, in the case of Bayern, also thermal modernization. A characteristic feature of group 1I is the marginal or zero share of T+R, T+R+L, R, and FIS investments.
Figure 9. Share of subsidies in the regions by type of investment.
Energies 17 04417 g009
Figure 10. Share of projects in the regions by type of investment.
Energies 17 04417 g010

4.3.2. Group 2I

Group 2I consists of the nine federal states of Rheinland-Pfalz, Thüringen, Berlin, Bremen, Hessen, Niedersachsen, Nordrhein–Westfalen, Mecklenburg–Vorpommern, and Schleswig-Holstein. A characteristic of this group is their high shares in the OI category (27.8–73.3% of the subsidy amounts and 52.4–95.2% of projects). Thüringen, Rheinland-Pfalz, and Nordrhein–Westfalen are in the lead. Group 2I, moreover, has a significant share of thermal modernization projects, led by Berlin (59% of the subsidy amounts and 37.1% of projects), Mecklenburg–Vorpommern (37.1% and 9.1%), and Hessen (22.4% and 25.6%). Investments in demo buildings were recorded in eight federal states, except that high shares of the subsidy amounts (e.g., Bremen, 32.8%; Mecklenburg–Vorpommern, 33.2%; and Schleswig-Holstein, 21.2%) did not translate into shares in the number of projects (with a max. of 7.7% in Bremen). There are also initial shares of more than 10% of investments in the R (Niedersachsen, 26.8% of subsidies and 10.8% of projects) and FIS (Hessen, 21.8% and 2.4%) categories. The remaining categories are characterized by a marginal share.

4.3.3. Group 3I

In Sachsen-Anhalt, there was a high share of investments from the T (65.6% of subsidies and 29.0% of projects), OI (24.1% and 44.4%), as well as FIS (24.8% and 8.2%) categories.

4.3.4. Group 4I

In Brandenburg, about 50% were investments from the OI category, and about 42% of the subsidies were handed out for RES.

4.3.5. Group 5I

Group 5I consists of two states (Sachsen and Saarland) and ten voivodeships (Dolnośląskie, Podkarpackie, Warmińsko-Mazurskie, Zachodniopomorskie, Kujawsko–Pomorskie, Łódzkie, Małopolskie, Podlaskie, Pomorskie, and Śląskie). This group is distinguished by investments in thermo-modernization (on average 49.6% of subsidies and 60.3% of projects). In this group, Saarland (95% and 87.6%), and, from the Polish voivodeships, Śląskie (61.2% and 72.8%), Pomorskie (57.6% and 74.7%), and Warmińsko-Mazurskie (56.3% and 57.2%) dominated. Each of the regions in this group carried out activities from the OI category. Sachsen (29.5% of subsidies and as many as 79.5% of projects) and Małopolskie (27.5% and 10.3%) stand out in particular. Investments in T+R are noticeable in Podkarpackie, Dolnośląskie, Podlaskie, and Pomorskie. Investments in T+L are noticeable in Saachsen and Łódzkie (respectively, 25.4% and 18.4% of subsidies) and in Warmińsko-Mazurskie (19.0% of subsidies and 19.6% of projects). Investments in DB are noticeable in Zachodniopomorskie, Sachsen, and Łódzkie but only in terms of the share of amounts subsidized (34.3%, 14.9%, and 14.7%). The remaining investment categories recorded values only slightly above 10% or at 0%, and the best example of this is Saarland (no investments in six categories). The greatest diversification of investments was recorded in Dolnośląskie, Łódzkie, Małopolskie, and Śląskie.

4.3.6. Group 6I

Group 6I includes the Lubelskie, Lubuskie, Świętokrzyskie, Mazowieckie, Opolskie, and Wielkopolskie voivodeships. The dominance of thermal modernization (T) and combination projects is discernible, primarily from the T+R category and, to a lesser extent, T+L and T+R+L. The regions demonstrate a different approach to the implementation of thermo-modernization projects and related investments. The combination of thermo-modernization and RES is noticeable in Świętokrzyskie (66.3% of subsidies and 70.1% of projects), Wielkopolskie (46.4% and 57.1%), and Lubelskie (46.4% and 37.7%), while projects focused on thermo-modernization alone prevail in Mazowieckie (39.9% and 44.2%) and Lubuskie (39.7% and 31.8%). The Opolskie voivodeship had the highest performance in the T+R+L category (33.7% and 24.6%).

5. Discussion

Tackling climate change and achieving climate neutrality by 2050 through the implementation of green solutions and a shift away from fossil fuels to renewable energy sources is one of the EU’s key priorities. This is in line with the stream of efforts to increase the level of green energy supply and decarbonize the industrial, transport, and construction sectors in conjunction with reducing energy consumption by improving energy efficiency and promoting energy sufficiency, which has, so far, been the main driver of GHG emission reductions [67]. Both Poland and Germany have been actively involved in these measures, which is reflected in the investments undertaken to improve the energy efficiency of buildings using substantial EU funds. In the 2014–2020 cycle, Poland was the major beneficiary of the EU CP envelope (EUR 78.8 billion—one-fifth of a total allocation), while Germany only received 5% (EUR 20.7 billion). In Poland, EUR 1.876 billion was disbursed for IEEBs under TO4 from the ERDF (4.5% of the total ERDF allocation and 31.7% of the total ERDF allocation for TO4). In comparison in Germany, EUR 1.209 billion was spent, but the commitment to IEEB measures was significantly higher (9.8% and 55.6%, respectively) (https://cohesiondata.ec.europa.eu/cohesion_overview/14-20; accessed on 10 June 2024). The comparison of regional IEEB allocations carried out in this study provides insights into how both countries have approached the energy transition and the shift to a low-carbon economy in their building stock. To shed some light on these issues, it seems crucial to answer four research questions.

5.1. How Were IEEB Subsidies Distributed in the Regions?

Regarding the regional distribution of subsidies for IEEBs, the research conducted indicates (Figure 5) some regularities in the German states. Notable disparities in the distribution of funds were marked between the states of the former DDR, where allocations to IEEBs were generally higher (EUR 124–246M), and the former BRD, with lower subsidies (EUR 6–55M). This is due to the fact that, despite a better start in catching up with post-soviet times, the former DDR states still face numerous socio-economic problems, which placed them in the group of transitional regions (PPS, 75–90% of the EU-27 average, except for Leipzig, which was classified as a more developed region). These problems also apply to building stocks, as for 40 years of socialist rule in Germany, no substantial measures have been taken to improve the state of buildings [68]. Hence, there were higher allocations for co-financing activities related to the building sector’s transition to a low-carbon economy (Figure 5), which generally also translated into a higher number of projects per IEEB (Figure 6).
In Poland, such regularities generally do not occur, and the amount of the allocation does not show such large disproportions (the average level oscillated within EUR 60–140M) (Figure 5). This was due to the fact that, in addition to the criterion of relative wealth (15 regions were classified as less developed, in the Mazowieckie voivodeship as more developed) and population, the amount of the allocation was affected by economic factors related to the labor market and, in the case of industrial regions, also the accumulation of challenges for the transition to a low-carbon economy [69]. This was particularly evident in the Śląskie voivodeship (EUR 285.5M), which was further supported by targeted funds from national operational programs and under Integrated Territorial Investments (ITIs) [70].

5.2. Which Groups of Beneficiaries Were Involved in the Disbursement of IEEB Funds?

The division into groups of beneficiaries showed that the regions of Poland and Germany (with the exception of Saarland) have no common features (Figure 2 and Figure 7). The federal states were classified into groups 1B–3B, where subsidies were mainly obtained by two categories of beneficiaries, i.e., entrepreneurs (dominating especially in 2B) and, to a lesser extent, SGUs (with a predominance in 1B—the states of the former DDR). Considering the share of projects implemented, the dominance of entrepreneurs is a fact (82.3% in 1B and 65.3% in 2B) (Figure 8). It should be noted that entrepreneurs’ projects are less costly than those implemented by SGUs. These differences are particularly evident in group 1B (Thüringen, Sachsen Anhalt, and Sachsen) (with a PES of about EUR 130K and SGUs of EUR 985K). This is directly related to the results of this study on investments. Entrepreneurs were implementing significantly more projects but generating lower costs (focusing on the replacement of production machinery, HVAC systems, and energy audits). SGUs, especially in small- and medium-sized cities, sought to take advantage of the unstable situation in housing markets in major cities and metropolitan regions. This has resulted in increased thermal retrofitting and the revitalization of historic buildings and vacant buildings [71]. In group 2B additionally dominates the OB category (i.e., state administration, education, culture, and science). The most diversified, in terms of beneficiaries, is group 3B (coastal states), where, in addition to SGUs, PESs, and OBs, there are also NGOs (in Schleswig-Holstein, 18% of subsidies and 10% of projects) and RIs.
In contrast, a characteristic feature of Polish voivodeships is the dominance of SGUs, which not only obtained the highest subsidy amounts (69.5%) but also implemented the most projects (65.2%). This applies to all analyzed groups (4B–6B) and is due to the well-established strong position of local governments in the struggle for EU funds [37] and the fact that SGUs still have a poorly energy-efficient housing stock, both in terms of public buildings and communal housing (this refers mainly to the regions of the former Prussian partition) [72]. In addition, some regularities were observed regarding the larger shares of selected categories of beneficiaries in particular groups. Thus, in group 4B, the share of R&HCs stand out (especially in the Warmińsko-Mazurskie, Podkarpackie, and Dolnośląskie voivodeships), which have the largest stock of buildings built predominantly in non-energy-efficient brick and large-panel technology [73,74]. The tenuous commitment of regional authorities to finance the renovation of R&HC assets, coupled with the unsatisfactory results of thermal modernization activities carried out for more than two decades, supported by national and EU funds [75], which have not fully contributed to the decarbonization of their stock [76], poses a huge challenge to achieving the “Fit for 55” goals [77]. In group 5B, private enterprises received larger subsidies (mainly in Lubelskie, Małopolskie, and Świętokrzyskie). And the authorities of almost all Polish voivodeships supported the transformation efforts of entrepreneurs, at a relatively low level (an average of a 2% quota share and a 1–3% project share per region). Compared to Germany (50.5% and 60.6%, respectively), this shows the different orientation of regional authorities towards IEEBs in the private enterprise sector. In the case of Poland, this has two origins. On the one hand, the energy-inefficient post-partition and post-communist stock taken over by private entrepreneurs during the transition period of the 1990s is constantly being retrofitted for economic reasons (cutting heating and lighting costs), mainly using passive methods [78]. On the other hand, new buildings are being constructed using energy-efficient materials and with passive and active technologies and, after Poland’s accession to the EU, with the use of RES [79]. However, enterprises have not been very committed to implementing projects to create and use innovative solutions to decarbonize their building stock [38]. In group 6B, financial institutions stand out (in terms of subsidies obtained, especially in Podlaskie, Wielkopolskie, and Opolskie), which was due to the policy pursued by some regional governments to redistribute funds for IEEBs (shifting this task to institutions of the banking sector), which was not observed in Germany, and religious institutions (renovation of monuments and religious buildings).

5.3. Which Investments Were Prioritized?

Considering the completed IEEB investments in the German federal states, it is evident that there is a strong commitment to activities such as the exchange of machinery or the replacement or installation of HVAC systems, as well as the financing of energy audits (category OI), which are a necessary and legally required tool (under the 2012 EED) for assessing the energy performance of buildings. Their importance is particularly reinforced by the 2024 EPBD recast in the context of the need to implement EU-wide energy performance classes that will strengthen the realization of a common vision for a zero-emission building stock by 2050. These measures are particularly prevalent in group 2I (western and northern parts of Germany, including Thüringen and Mecklenburg–Vorpommern of the former DDR). In states such as Rheinland-Pfalz, Thüringen, and Nordrhein–Westfalen, these investments absorbed 70–80% of subsidies and generated about 90% of projects. This demonstrates a strong commitment to pro-climate and pro-innovation policies through the introduction of modern technologies [80], as well as great attention to ensuring that retrofits are carried out to the highest standards (hence, subsidizing the cost of energy audits). Slightly smaller in this group was the scale of thermal insulation (mainly high-priced projects in Berlin, Hessen, and Mecklenburg–Vorpommern). RES investments were among the key ones (in addition to OI) in Brandenburg (4I). The Berlin-Brandenburg region is particularly interesting in terms of how to achieve ambitious energy transition goals. Brandenburg, sparsely populated (85 people per sq km) and urbanized but with favorable conditions for RES energy production, had already strongly prioritized the green transition since the 1990s (a milestone was achieved in 1995, when the first wind farm was built), involving especially private entrepreneurs in the process. This led to the fact that in 2014, Brandenburg met about 60–70% of its annual energy needs from RES. Therefore, it has been designated as a green energy supply region for Berlin, which, due to its dense development and population (3900 people per sq km), has few open spaces for large-scale RES energy production [81]. In contrast, group 1I (the Alpine Länder of Bayern and Baden-Württemberg) was dominated by DB investments, which coincides with these states’ policies to increase efforts for zero-carbon buildings in cold-climate zones [82]. Local authorities in Thüringen have invested in building energy audits, while SGUs in Sachsen and Sachsen-Anhalt have undertaken thermal retrofits to adjust their stock to EU requirements and standards [83].
The orientation of investments demonstrated the greatest similarities in group 5I, which included ten voivodeships and two federal states (Figure 3). The dominant investments were in thermo-modernization (especially Saarland, with 95% of the subsidy amounts and 88% of the projects) and in the regions of the former Prussian partition. This is mainly due to the need to renovate historic brick buildings [84] and large-panel buildings [73]. Group 6I includes only Polish regions and is characterized by the predominance of combined investments (T+R, T+L, and T+R+L) and OIs, except that, unlike in Germany, in Poland, investments related to decarbonize heating sources and connections to district heating networks dominated [75]. A special case is the Małopolskie voivodeship, where the regional board has allocated almost one-third of the funds to support the replacement of coal furnaces [8]. In group 6I, the investments showed the greatest complexity, as they mostly concerned the stock that was built after World War II with materials (large panels, cellular concrete, and frame technologies) that allow for interferences in the body and the structure of buildings. It should also be noted that the voivodships in group 6I have focused on implementing solutions based on RES (mainly solar energy), which prior to Poland’s accession to the EU were not widely used due to technological limitations and the failure of the Polish energy sector to accept energy from on-grid installations into distributors’ grids [79]. There has been a shift away from the co-financing of RES-based investments, popular in the 2007–2013 cycle, which was especially relevant for installations utilizing solar energy (Lubelskie, Podlasie, and Małopolskie); wind energy (Zachodnopomorskie, Wielkopolskie, and Łodzkie); and biomass (voivodeships of Eastern, Northern, and South-eastern Poland, such as Podlaskie, Warmińsko-Mazurskie, Lubelskie, Podkarpackie, Małopolskie, Zachodniopmorskie, and Pomorskie) [35]. In 2014–2020, we additionally noticed a shift towards more complex investments, combining RES with thermo-modernization and energy-efficient lighting. Thus, these voivodeships are bridging their backwardness and actively joining the current of future transformations set by the slogan “solar-ready buildings” (buildings fit to host solar installations) in the 2024 EPBD recast.
Referring to the need to decarbonize the building sector by 2050 and in line with the implementation of EPBD and EED provisions, retrofitting to NZEBs seems crucial. This applies to all MSs, which, due to climate diversity, the market, and local conditions, demonstrate different degrees of progress in this transformation. Luxembourg (nearly 45%) and Austria (40%) had the highest share of NZEBs in 2012–2016. In Germany, which is quite heavily involved in DB investments (groups 1I and 2I), the share was 25%, while in Poland, it was only 8% (with the least being in MSs),but in both cases, mostly new constructions and renovations of residential buildings were implemented, with less attention being paid to non-residential and public ones [25]. Raising the NZEB rate is a huge challenge for Poland, especially since, as our research confirms, regional governments rarely opted for funded new and retrofit non-residential buildings (a total of 4.4% of the subsidies and 1.0% of projects), and, furthermore, 92.8% of the residential buildings were built before 2011, necessitating extensive measures to renovate the existing stock [85]. It should be noted that investments carried out in Germany in 2014–2020 meet the provisions of the 2024 EPBD recast in terms of, for example, the installation of electric car chargers or the construction of bicycle parking facilities next to buildings. Although, for the purposes of the analyses conducted in this study, these investments were excluded, as they had no reference in the Polish context, but this is valuable information for subsequent studies. It should also be noted that the introduced transformation, in the 2024 EPBD, to zero-emission buildings (ZEBs), pivotal for achieving EU goals in the current climate and energy crisis, requires not only a further increase in RES operations (currently accounting for about 40% in new NZEBs) but also an acceleration of efforts to achieve zero carbon emissions on-site from fossil fuels [33,86]. Therefore, especially in the case of Poland, there is a pressing need to increase support for measures and investments initiated in 2014–2020, aimed at eliminating coal- and gas-fired heat sources.

5.4. Do the Changes in Territorial Affiliation Matter?

Addressing the question of the consequences of the change in the territorial affiliation of the states and voivodeships after World War II and their impact on IEEB-targeting investments, it should be noted that the results of the cluster analysis reflect well the context of Germany, where disparities in the distribution of allocations indicate a greater commitment to financing the energy transformation of buildings in the post-soviet DDR states. In addition, they correspond to the range of investments oriented, in contrast to the federal states of the former BRD, to a greater extent, to thermo-modernization or the use of RES. In this regard, some similarities have been identified with voivodeships in Poland, where, in addition to the dominant thermo-modernization, many combined investments have also been made. However, it should be noted that clustering has not fully highlighted the contexts of changing the territorial affiliation of Polish voivodeships. Much more effective in this case are analyses based on primary data [29], which better depict the connections of the spatial distribution of investments in IEEBs with the post-partition division of Poland.

6. Conclusions

The purpose of this study was to demonstrate the effects of the disbursement of EU CP 2014–2020 funds on improving the energy efficiency of buildings in Poland and Germany, filling the research gap regarding the regional differentiation of investments, beneficiaries, and the spatial distribution of funds. As a result of the analysis and discussion, the following were demonstrated:
(1)
Support for IEEBs is one of the pillars of the EU’s climate and energy policies, which is reflected both in legislation, strategies, and plans, as well as in the rules for programming the distribution of funds under the EU Cohesion Policy;
(2)
A comparison of IEEB allocations revealed a much higher commitment to financing the low-carbon transition of building stocks in Germany (10% of the total ERDF allocation, and 50% allocations under TO4 in OPs) than in Poland (4.5% and 1/3, respectively);
(3)
A characteristic feature of Germany is the concentration of funds and projects for IEEBs in the former East German states (more than 60% of the allocation and over 75% of the projects, with as much as 65% in Sachsen-Anhalt, Sachsen, and Thüringen only). In Poland, the allocation in voivodeships was relatively higher and the distribution of funds, more equal (more than EUR 90M was spent in 11 voivodeships, and the maximum allocation was EUR 285.7M; in comparison, in Germany, EUR 246.2M was spent in five federal states);
(4)
In Germany, the specialization of groups is more evident, both in terms of beneficiaries (dominated by entrepreneurs in 1B and 2B, and to a lesser extent by SGUs in 1B) and investment foci (DB in group 1I; OI in group 2I). Entrepreneurs sought new solutions for IEEBs, moving away from passive (thermal) and RES-based investments (only in groups 4I and 2I) and focusing on active (machinery replacement and HVAC systems) (especially in group 2I) and NZEB-oriented investments (group 1I);
(5)
In Poland, SGUs dominate among the beneficiaries in all regions. Some regional variations were indicated. There is a higher share of projects implemented by entrepreneurs in group 5B and R&HCs in 4B, as well as subsidies to FIs in group 6B. It is noticeable that some of the transformation efforts have been shifted to financial institutions, which have replaced regional authorities in the redistribution of EU funds on IEEBs. Most of the Polish regions, Saarland, and Saxony primarily subsidized thermo-modernization (group 5I), while the other voivodeships also saw a large share of combined projects (group 6I);
(6)
The orientation of the co-financing of regional policies carried out by Poland and Germany is different, which was determined by the geo-political situation and historical background (this is particularly evident in the case of the regions of the former Prussian partition and the states of the former DDR), as well as the technological and institutional advancements in the implementation of EU energy- and climate-policy targets and legislation;
(7)
Regions classified as less developed are still investing in thermo-modernization and combined measures, while the more-developed regions have this stage mostly behind them and are investing in more technologically advanced active solutions and NZEBs.
The results of this study provide a well-documented voice in the discussion of the advancement of EU countries in the energy transition of the building sector by showing national peculiarities, highlighting the consequences of former territorial divisions, and revealing the national contexts of investment targeting and the path of NZEB retrofitting and the leading actors involved in this process. The research program applied in this work constitutes the basis for further comparative studies at the national and regional levels. The methodology can be extrapolated due to the comparability of the allocation distribution mechanism in each member state, as well as the availability of data related to beneficiaries and investments obtainable from both national portals (as conducted in this research) or publicly available EU databases (such as Inforegio or Kohesio). It should also be emphasized that this study illustrates the regional differences and similarities in the disbursement of EU funds for improving the energy efficiency of buildings, which is fundamental not only for the evaluation of CP 2014–2020 but also can be useful as comparative material for the mid-term evaluation of CP 2021–2027 with respect to IEEB-oriented investments and fund beneficiaries, as well a baseline for assessing the implementation of EU policies and legislation.

Author Contributions

Conceptualization, D.K.; methodology, D.K. and M.J.; software, M.J.; validation, D.K. and M.J.; formal analysis, D.K. and M.J.; investigation, D.K.; resources, D.K. and M.J.; data curation, M.J.; writing—original draft preparation, D.K. and M.J.; writing—review and editing, D.K. and M.J.; visualization, M.J.; supervision, D.K.; project administration, D.K. All authors have read and agreed to the published version of the manuscript.

Funding

This research received no external funding.

Data Availability Statement

The original contributions presented in the study are included in the article, further inquiries can be directed to the corresponding author.

Acknowledgments

The authors gratefully acknowledge Julia Chobian from the University of Gdańsk for her invaluable support in refining the methodology.

Conflicts of Interest

The authors declare no conflicts of interest.

References

  1. Harputlugil, T.; De Wilde, P. The Interaction between Humans and Buildings for Energy Efficiency: A Critical Review. Energy Res. Soc. Sci. 2021, 71, 101828. [Google Scholar] [CrossRef]
  2. Sztorc, M. The Implementation of the European Green Deal Strategy as a Challenge for Energy Management in the Face of the COVID-19 Pandemic. Energies 2022, 15, 2662. [Google Scholar] [CrossRef]
  3. Dormido, L.; Garrido, I.; L’Hotellerie-Fallois, P.; Santillán, J. Climate Change and Sustainable Growth: International Initiatives and European Policies; Banco de España: Madrid, Spain, 2023. [Google Scholar]
  4. Li, X. How Can We Make an Orderly Transition Away from Fossil Fuels? A Global Tour of Modern Energy. Energy Environ. 2023, 0958305X2311613. [Google Scholar] [CrossRef]
  5. Wang, D.; Dong, L.; Mei, J. An Advanced Review of Climate Change Mitigation Policies in Germany, France, and the Netherlands. Environ. Res. Lett. 2023, 18, 103001. [Google Scholar] [CrossRef]
  6. Energy Efficiency Act. Journal of Laws of 2016, Item 831 as Amended. Available online: https://isap.sejm.gov.pl/isap.nsf/DocDetails.xsp?id=WDU20160000831 (accessed on 10 May 2024).
  7. Palamarchuk, D. Economic Policy Formation Mechanism for Energy Efficiency Area. ВСЕД (Socio-Econ. Res. Bull.) 2021, 2, 25–40. [Google Scholar] [CrossRef]
  8. Kociuba, D.; Wajs, K. Impact of the Implementation of EU, National and Local Policies and Legislation on the Transition towards Eco-Cities in Poland. Bull. Geogr. Socio-Econ. Ser. 2021, 53, 105–130. [Google Scholar] [CrossRef]
  9. Kulovesi, K.; Van Asselt, H. Three Decades of Learning-by-Doing: The Evolving Climate Change Mitigation Policy of the European Union. In Climate and Energy Law and Policy in the EU and East Asia; Weishaar, S., Kim, E., Tiche, F., Eds.; Edward Elgar Publishing: Northampton, MA, USA, 2023; pp. 47–68. ISBN 978-1-03-530115-7. [Google Scholar]
  10. Economidou, M.; Todeschi, V.; Bertoldi, P.; D’Agostino, D.; Zangheri, P.; Castellazzi, L. Review of 50 Years of EU Energy Efficiency Policies for Buildings. Energy Build. 2020, 225, 110322. [Google Scholar] [CrossRef]
  11. In Focus—Energy Efficiency in Buildings, European Commission—Department: Energy, Brussels, 17 February 2020. Available online: https://commission.europa.eu/news/focus-energy-efficiency-buildings-2020-02-17_en (accessed on 10 May 2024).
  12. EC Communication. “Fit for 55”: Delivering the EU’s 2030 Climate Target on the Way to Climate Neutrality (COM/2021/550 Final). Available online: https://eur-lex.europa.eu/legal-content/EN/TXT/HTML/?uri=CELEX%3A52021DC0550 (accessed on 10 May 2024).
  13. EC Communication. A Renovation Wave for Europe—Greening Our Buildings, Creating Jobs, Improving Lives (COM/2020/662 Final). Available online: https://eur-lex.europa.eu/legal-content/EN/TXT/?uri=CELEX%3A52020DC0662 (accessed on 10 May 2024).
  14. Directive 2010/31/EU of the European Parliament and of the Council of 19 May 2010 on the Energy Performance of Buildings (Recast) (OJ L 153, 18.6.2010). Available online: https://eur-lex.europa.eu/LexUriServ/LexUriServ.do?uri=OJ:L:2010:153:0013:0035:EN:PDF (accessed on 10 May 2024).
  15. Directive 2012/27/EU of the European Parliament and of the Council of 25 October 2012 on Energy Efficiency, Amending Directives 2009/125/EC and 2010/30/EU and Repealing Directives 2004/8/EC and 2006/32/EC (OJ L 315, 14.11.2012). Available online: https://eur-lex.europa.eu/legal-content/EN/TXT/PDF/?uri=CELEX:32012L0027&from=EN (accessed on 10 May 2024).
  16. Council Decision (EU) 2016/1841 of 5 October 2016 on the Conclusion, on Behalf of the European Union, of the Paris Agreement Adopted under the United Nations Framework Convention on Climate Change (OJ L 282, 19.10.2016). Available online: https://eur-lex.europa.eu/legal-content/EN/TXT/?uri=CELEX%3A32016D1841 (accessed on 10 May 2024).
  17. EC Communication. Clean Energy For All Europeans (COM/2016/0860 Final). Available online: https://eur-lex.europa.eu/resource.html?uri=cellar:fa6ea15b-b7b0-11e6-9e3c-01aa75ed71a1.0001.02/DOC_1&format=PDF (accessed on 10 May 2024).
  18. Directive (EU) 2018/844 of the European Parliament and of the Council of 30 May 2018 Amending Directive 2010/31/EU on the Energy Performance of Buildings and Directive 2012/27/EU on Energy Efficiency (OJ L 156, 19.6.2018). Available online: https://eur-lex.europa.eu/eli/dir/2018/844/oj (accessed on 10 May 2024).
  19. Directive (EU) 2018/2002 of the European Parliament and of the Council of 11 December 2018 Amending Directive 2012/27/EU on Energy Efficiency (OJ L 328, 21.12.2018). Available online: https://eur-lex.europa.eu/legal-content/EN/TXT/PDF/?uri=CELEX:32018L2002&from=DE (accessed on 10 May 2024).
  20. EC Communication. The European Green Deal (COM/2019/640 Final). Available online: https://eur-lex.europa.eu/legal-content/EN/TXT/?uri=COM%3A2019%3A640%3AFIN (accessed on 10 May 2024).
  21. Directive (EU) 2023/1791 of the European Parliament and of the Council of 13 September 2023 on Energy Efficiency and Amending Regulation (EU) 2023/955 (Recast) (OJ L 231, 20.9.2023). Available online: https://eur-lex.europa.eu/eli/dir/2023/1791/oj (accessed on 10 May 2024).
  22. Directive (EU) 2024/1275 of the European Parliament and of the Council of 24 April 2024 on the Energy Performance of Buildings (Recast) (OJ L, 2024/1275, 8.5.2024). Available online: https://eur-lex.europa.eu/legal-content/EN/TXT/?uri=CELEX%3A32024L1275 (accessed on 10 May 2024).
  23. Ruggieri, G.; Andreolli, F.; Zangheri, P. A Policy Roadmap for the Energy Renovation of the Residential and Educational Building Stock in Italy. Energies 2023, 16, 1319. [Google Scholar] [CrossRef]
  24. De Boeck, L.; Verbeke, S.; Audenaert, A.; De Mesmaeker, L. Improving the Energy Performance of Residential Buildings: A Literature Review. Renew. Sustain. Energy Rev. 2015, 52, 960–975. [Google Scholar] [CrossRef]
  25. D’Agostino, D.; Tzeiranaki, S.T.; Zangheri, P.; Bertoldi, P. Assessing Nearly Zero Energy Buildings (NZEBs) Development in Europe. Energy Strategy Rev. 2021, 36, 100680. [Google Scholar] [CrossRef]
  26. Dębkowska, K.; Dymek, Ł.; Kutwa, K.; Perło, D.; Perło, D.; Rogala, W.; Ryciuk, U.; Szewczuk-Stępień, M. The Analysis of Public Funds Utilization Efficiency for Climate Neutrality in the European Union Countries. Energies 2022, 15, 581. [Google Scholar] [CrossRef]
  27. EUROPE 2020 A Strategy for Smart, Sustainable and Inclusive Growth (COM/2010/2020 Final). Available online: https://eur-lex.europa.eu/LexUriServ/LexUriServ.do?uri=COM:2010:2020:FIN:EN:PDF (accessed on 10 May 2024).
  28. Regulation (EU) No 1303/2013 of the European Parliament and of the Council of 17 December 2013 Laying down Common Provisions on the European Regional Development Fund, the European Social Fund, the Cohesion Fund, the European Agricultural Fund for Rural Development and the European Maritime and Fisheries Fund and Laying down General Provisions on the European Regional Development Fund, the European Social Fund, the Cohesion Fund and the European Maritime and Fisheries Fund and Repealing Council Regulation (EC) No 1083/2006 (OJ L 347, 20.12.2013). Available online: https://eur-lex.europa.eu/legal-content/en/TXT/?uri=celex%3A32013R1303 (accessed on 10 May 2024).
  29. Kociuba, D.; Janczak, M. Improving the Energy Efficiency of Buildings: Lessons Learned from Poland. BGSS 2024, 64, 7–24. [Google Scholar] [CrossRef]
  30. Chatterjee, S.; Ürge-Vorsatz, D. Measuring the Productivity Impacts of Energy-Efficiency: The Case of High-Efficiency Buildings. J. Clean. Prod. 2021, 318, 128535. [Google Scholar] [CrossRef]
  31. Zhou, A.; Wang, S.; Chen, B. Impact of New Energy Demonstration City Policy on Energy Efficiency: Evidence from China. J. Clean. Prod. 2023, 422, 138560. [Google Scholar] [CrossRef]
  32. He, B.-J.; Zhao, D.-X.; Gou, Z. Integration of Low-Carbon Eco-City, Green Campus and Green Building in China. In Green Building in Developing Countries; Green Energy and Technology; Gou, Z., Ed.; Springer International Publishing: Cham, Switzerland, 2020; pp. 49–78. ISBN 978-3-030-24649-5. [Google Scholar]
  33. Maduta, C.; D’Agostino, D. Readiness of Zero-Emission Buildings (ZEBs) Implementation in the European Union. E3S Web Conf. 2024, 523, 04009. [Google Scholar] [CrossRef]
  34. Liu, Y.; Liu, T.; Wang, B.; Xu, M. Developing a Methodology for the Ex-Post Assessment of Building Energy Efficiency Special Planning in Beijing during the 12th Five-Year Plan” Period. J. Clean. Prod. 2019, 216, 552–569. [Google Scholar] [CrossRef]
  35. Florkowski, W.J.; Rakowska, J. Review of Regional Renewable Energy Investment Projects: The Example of EU Cohesion Funds Dispersal. Sustainability 2022, 14, 17007. [Google Scholar] [CrossRef]
  36. Kochański, M. Finansowanie Instrumentów Poprawy Efektywności Energetycznej w Polsce w Latach 2014-2020 (Financing of Energy Efficiency Improvement Instruments in Poland in 2014–2020). Acta Innov. 2014, 10, 59–77. [Google Scholar]
  37. Poniatowicz, M. Financial Stability of Local Government Units in Respect of the New Financial Perspective of the European Union and Changes in the System of Local Government Income. Ekon. Probl. Usług 2016, 125, 7–23. [Google Scholar] [CrossRef]
  38. Dembicka-Niemiec, A.; Szafranek-Stefaniuk, E.; Kalinichenko, A. Structural and Investment Funds of the European Union as an Instrument for Creating a Low-Carbon Economy by Selected Companies of the Energy Sector in Poland. Energies 2023, 16, 2031. [Google Scholar] [CrossRef]
  39. Michelsen, C.; Weiß, D. What Happened to the East German Housing Market? A Historical Perspective on the Role of Public Funding. Post-Communist Econ. 2010, 22, 387–409. [Google Scholar] [CrossRef]
  40. Siebert, H.; Burda, M.; Obstfeld, M. German Unification: The Economics of Transition. Economic Policy 1991, 6, 287. [Google Scholar] [CrossRef]
  41. Churski, P.; Konecka-Szydłowska, B.; Herodowicz, T.; Perdał, R. Does History Matter? Development Differences in Poland. In Dilemmas of Regional and Local Development; Routledge Taylor & Francis Group: Abingdon, UK, 2020. [Google Scholar]
  42. Truskolaski, T.; Waligóra, K. Impact of Cohesion Policy of the European Union on Reduction of the Interregional Development Gap in Poland. Społeczeństwo Ekon. (Soc. Econ.) 2016, 2, 87–102. [Google Scholar] [CrossRef]
  43. Dolata, M. Współczesne Problemy Rozwojowe Niemiec Wschodnich—Perspektywa Regionalna. Rozw. Reg. Polityka Reg. 2014, 28, 9–24. [Google Scholar] [CrossRef]
  44. Liste Der Geförderten Vorhaben (List of Projects Co-Financed by European Funds) 2014–2020 in Baden-Württemberg 2023. Available online: https://efre-bw.de/datenbank-beguenstigte-vorhaben/ (accessed on 3 April 2023).
  45. Liste Der Geförderten Vorhaben (List of Projects Co-Financed by European Funds) 2014–2020 in Bayern 2023. Available online: https://2014-2020.efre-bayern.de/efre-2014-2020-investitionen-in-wachstum-und-beschaeftigung/information-und-kommunikation/liste-der-vorhaben/ (accessed on 3 April 2023).
  46. Liste Der Geförderten Vorhaben (List of Projects Co-Financed by European Funds) 2014–2020 in Berlin 2023. Available online: https://www.berlin.de/sen/wirtschaft/gruenden-und-foerdern/europaeische-strukturfonds/efre-foerderperiode-2014-2020/publikationen/#Publ3 (accessed on 3 April 2023).
  47. Liste Der Geförderten Vorhaben (List of Projects Co-Financed by European Funds) 2014–2020 in Brandenburg 2023. Available online: https://efre.brandenburg.de/efre/de/kommunikation/beguenstigte-der-eu-foerderung/# (accessed on 3 April 2023).
  48. Liste Der Geförderten Vorhaben (List of Projects Co-Financed by European Funds) 2014–2020 in Bremen 2023. Available online: https://www.efre-bremen.de/projekte/liste-der-vorhaben-15110 (accessed on 3 April 2023).
  49. Liste Der Geförderten Vorhaben (List of Projects Co-Financed by European Funds) 2014–2020 in Hessen 2023. Available online: https://wirtschaft.hessen.de/wirtschaft/efre-europaeischer-strukturfonds (accessed on 3 April 2023).
  50. Liste Der Geförderten Vorhaben (List of Projects Co-Financed by European Funds) 2014–2020 in Mecklenburg-Vorpommern 2023. Available online: https://www.europa-mv.de/foerderinstrumente/fonds_mv/foerderperiode-2014-2020/EFRE-2014-2020/ (accessed on 3 April 2023).
  51. Liste Der Geförderten Vorhaben (List of Projects Co-Financed by European Funds) 2014–2020 in Niedersachsen 2023. Available online: https://www.europa-fuer-niedersachsen.niedersachsen.de/startseite/regionen_und_foerderung/efre_und_esf/liste-der-vorhaben-152610.html (accessed on 3 April 2023).
  52. Liste Der Geförderten Vorhaben (List of Projects Co-Financed by European Funds) 2014–2020 in Nordrhein-Westfalen 2023. Available online: https://www.efre.nrw.de/daten-fakten/liste-der-vorhaben/ (accessed on 3 April 2023).
  53. Liste Der Geförderten Vorhaben (List of Projects Co-Financed by European Funds) 2014–2020 in Rheinland-Pfalz 2023. Available online: https://efre2014-2020.rlp.de/information-und-kommunikation/liste-der-vorhaben (accessed on 3 April 2023).
  54. Liste Der Geförderten Vorhaben (List of Projects Co-Financed by European Funds) 2014–2020 in Saarland 2023. Available online: https://www.saarland.de/mwide/DE/downloads/wirtschaft/efre/efre_2014_2020/efre_vorhabenplanung_9_21 (accessed on 3 April 2023).
  55. Liste Der Geförderten Vorhaben (List of Projects Co-Financed by European Funds) 2014–2020 in Sachsen 2023. Available online: https://www.xn--europa-frdert-sachsen-oec.de/de/projekte (accessed on 3 April 2023).
  56. Liste Der Geförderten Vorhaben (List of Projects Co-Financed by European Funds) 2014–2020 in Sachsen-Anhalt 2023. Available online: https://europa.sachsen-anhalt.de/esi-fonds-in-sachsen-anhalt/informationen-fuer-interessierte/liste-der-vorhaben (accessed on 3 April 2023).
  57. Liste Der Geförderten Vorhaben (List of Projects Co-Financed by European Funds) 2014–2020 in Schleswig-Holstein 2023. Available online: https://www.schleswig-holstein.de/DE/landesregierung/themen/wirtschaft/lpw/ergebnisse/liste-vorhaben/liste-vorhaben_node.html (accessed on 3 April 2023).
  58. Liste Der Geförderten Vorhaben (List of Projects Co-Financed by European Funds) 2014–2020 in Thüringen 2023. Available online: https://2014-2020.efre-thueringen.de/en/projects/?tx_projectsandmap_pluginproject%5B%40widget_0%5D%5BcurrentPage%5D=2&tx_projectsandmap_pluginproject%5BpaginatedProjects%5D%5BcurrentPage%5D=499&cHash=0c21579999e135642bf36c2b65a94cff (accessed on 3 April 2023).
  59. EC Implementing Regulation (EU) No 184/2014 of 25 February 2014 (OJ L 57, 27.2.2014). Available online: https://eur-lex.europa.eu/legal-content/EN/TXT/?uri=CELEX%3A32014R0184 (accessed on 10 May 2024).
  60. Bednarowska, Z. Desk research: Wykorzystanie potencjału danych zastanych w prowadzeniu badań marketingowych i społecznych (Desk research: Exploiting the potential of secondary data in market and social research). Mark. Rynek 2015, 7, 18–26. [Google Scholar]
  61. Frankfort-Nachmias, C.; Leon-Guerrero, A.; Davis, G. Social Statistics for a Diverse Society, 9th ed.; SAGE: Los Angeles, CA, USA, 2021; ISBN 978-1-5443-3973-3. [Google Scholar]
  62. Balicki, A. Statystyczna Analiza Wielowymiarowa i Jej Zastosowania Społeczno-Ekonomiczne (Statistical Multivariate Analysis and Its Socio-Economic Applications); Wydawnictwo Uniwersytetu Gdańskiego: Gdańsk, Poland, 2009. [Google Scholar]
  63. Cluster Analysis, 5th ed.; Wiley series in probability and statistics; Wiley: Chichester, UK, 2011; ISBN 978-0-470-74991-3.
  64. Pavone, P.; Pagliacci, F.; Russo, M.; Righi, S.; Giorgi, A. Multidimensional Clustering of EU Regions: A Contribution to Orient Public Policies in Reducing Regional Disparities. Soc. Indic. Res. 2021, 156, 739–759. [Google Scholar] [CrossRef]
  65. Bulut, H.; Öner, Y.; Sözen, Ç. Clustering of Member and Candidate Countries of the European Union. Int. J. Sci. Basic Appl. Res. 2017, 36, 18–25. [Google Scholar]
  66. Porębski, A. Application of Cluster Analysis in Research on the Spatial Dimension of Penalised Behaviour. FOI 2021, 94, 97–120. [Google Scholar] [CrossRef]
  67. González-Torres, M.; Pérez-Lombard, L.; Coronel, J.F.; Maestre, I.R. A Cross-Country Review on Energy Efficiency Drivers. Appl. Energy 2021, 289, 116681. [Google Scholar] [CrossRef]
  68. Noeske, J. From Comprehensive Planning to Small Interventions. In Histories of Urban Planning and Political Power; Routledge: New York, NY, USA, 2024; pp. 129–144. ISBN 978-1-00-347522-4. [Google Scholar]
  69. Frankowski, J.; Mazurkiewicz, J. Województwo Śląskie w Punkcie Zwrotnym Transformacji (Silesian Voivodship at a Turning Point in Its Transformation); Research Report 02/2020; Instytut Badań Strukturalnych: Warsaw, Poland, 2020. [Google Scholar]
  70. Kociuba, D. Implementation of Integrated Territorial Investments in Poland—Rationale, Results, and Recommendations. Quaest. Geogr. 2018, 37, 81–98. [Google Scholar] [CrossRef]
  71. Knippschild, R.; Zöllter, C. Stadterneuerung Zwischen Revitalisierung Und Denkmalschutz. In Stadterneuerung in Klein- und Mittelstädten; Altrock, U., Kurth, D., Kunze, R., Schmidt, H., Schmitt, G., Eds.; Springer Fachmedien Wiesbaden: Wiesbaden, Germany, 2020; pp. 137–153. ISBN 978-3-658-30231-3. [Google Scholar]
  72. Walicka-Góral, B.; Rybka, A. Rewitalizacja Komunalnych Zasobów Mieszkaniowych (Revitalization of Municipal Housing Resources). Czas. Tech. Archit. (Tech. Trans. Archit.) 2010, 107, 161–168. [Google Scholar]
  73. Tofiluk, A.; Knyziak, P.; Krentowski, J. Revitalization of Twentieth-Century Prefabricated Housing Estates as Interdisciplinary Issue. IOP Conf. Ser. Mater. Sci. Eng. 2019, 471, 112096. [Google Scholar] [CrossRef]
  74. Girus, K. Energooszczędne Rozwiązania Modernizacyjne w Wielkopłytowym Budownictwie Wielorodzinnym. Constr. Mater. 2019, 1, 12–15. [Google Scholar] [CrossRef]
  75. Włodarski, M. Efektywność Energetyczna Budownictwa w Dokumentach Europejskich i Krajowych. Stud. Kom. Przestrz. Zagospod. Kraj. PAN 2018, 187, 260–270. [Google Scholar]
  76. Supreme Audit Office. Efekty Termomodernizacji Wielorodzinnych Budynków Mieszkalnych Będących w Zasobach Spółdzielni Mieszkaniowych, Realizowanej z Udziałem Środków Publicznych (Effects of Thermomodernization of Multi-Family Residential Buildings Owned by Housing Cooperatives, Implemented with Public Funds); Supreme Audit Office: Warszawa, Polish, 2019. (In Polish) [Google Scholar]
  77. Turecki, A.; Tur, M.; Czarnecki, B.; Januszkiewicz, K.; Fiuk, P. Renovation of Modernist Housing Developments in the Pursuit of Modernity for Well-Being and Clean Energy. Energies 2022, 15, 3737. [Google Scholar] [CrossRef]
  78. Skoczkowski, T.; Bielecki, S.; Szymczyk, J.; Palimąka, T. Metody Wzrostu Efektywności Energetycznej w Małych i Średnich Przedsiębiorstwach (Methods of Increasing Energy Efficiency in Small and Medium-Sized Enterprises). Polityka Energetyczna Energy Policy J. 2014, 17, 27–40. (In Polish) [Google Scholar]
  79. Skjærseth, J.B. Implementing EU Climate and Energy Policies in Poland: Policy Feedback and Reform. Environ. Politics 2018, 27, 498–518. [Google Scholar] [CrossRef]
  80. Michailidis, I.T.; Schild, T.; Sangi, R.; Michailidis, P.; Korkas, C.; Fütterer, J.; Müller, D.; Kosmatopoulos, E.B. Energy-Efficient HVAC Management Using Cooperative, Self-Trained, Control Agents: A Real-Life German Building Case Study. Appl. Energy 2018, 211, 113–125. [Google Scholar] [CrossRef]
  81. Moeller, C.; Meiss, J.; Mueller, B.; Hlusiak, M.; Breyer, C.; Kastner, M.; Twele, J. Transforming the Electricity Generation of the Berlin–Brandenburg Region, Germany. Renew. Energy 2014, 72, 39–50. [Google Scholar] [CrossRef]
  82. Wang, R.; Feng, W.; Wang, L.; Lu, S. A Comprehensive Evaluation of Zero Energy Buildings in Cold Regions: Actual Performance and Key Technologies of Cases from China, the US, and the European Union. Energy 2021, 215, 118992. [Google Scholar] [CrossRef]
  83. Putz, A.W. Housing Paul and Paula: Building Repair and Urban Renewal in the German Democratic Republic. Archit. Hist. 2019, 7, 11. [Google Scholar] [CrossRef]
  84. Zagorskas, J.; Paliulis, G.M.; Burinskienė, M.; Venckauskaitė, J. Energetic Refurbishment of Historic Brick Buildings: Problems and Opportunities. Sci. J. Riga Tech. University. Environ. Clim. Technol. 2013, 12, 20–27. [Google Scholar] [CrossRef]
  85. Szymańska, E.J.; Kubacka, M.; Woźniak, J.; Polaszczyk, J. Analysis of Residential Buildings in Poland for Potential Energy Renovation toward Zero-Emission Construction. Energies 2022, 15, 9327. [Google Scholar] [CrossRef]
  86. Maduta, C.; Melica, G.; D’Agostino, D.; Bertoldi, P. Towards a Decarbonised Building Stock by 2050: The Meaning and the Role of Zero Emission Buildings (ZEBs) in Europe. Energy Strategy Rev. 2022, 44, 101009. [Google Scholar] [CrossRef]
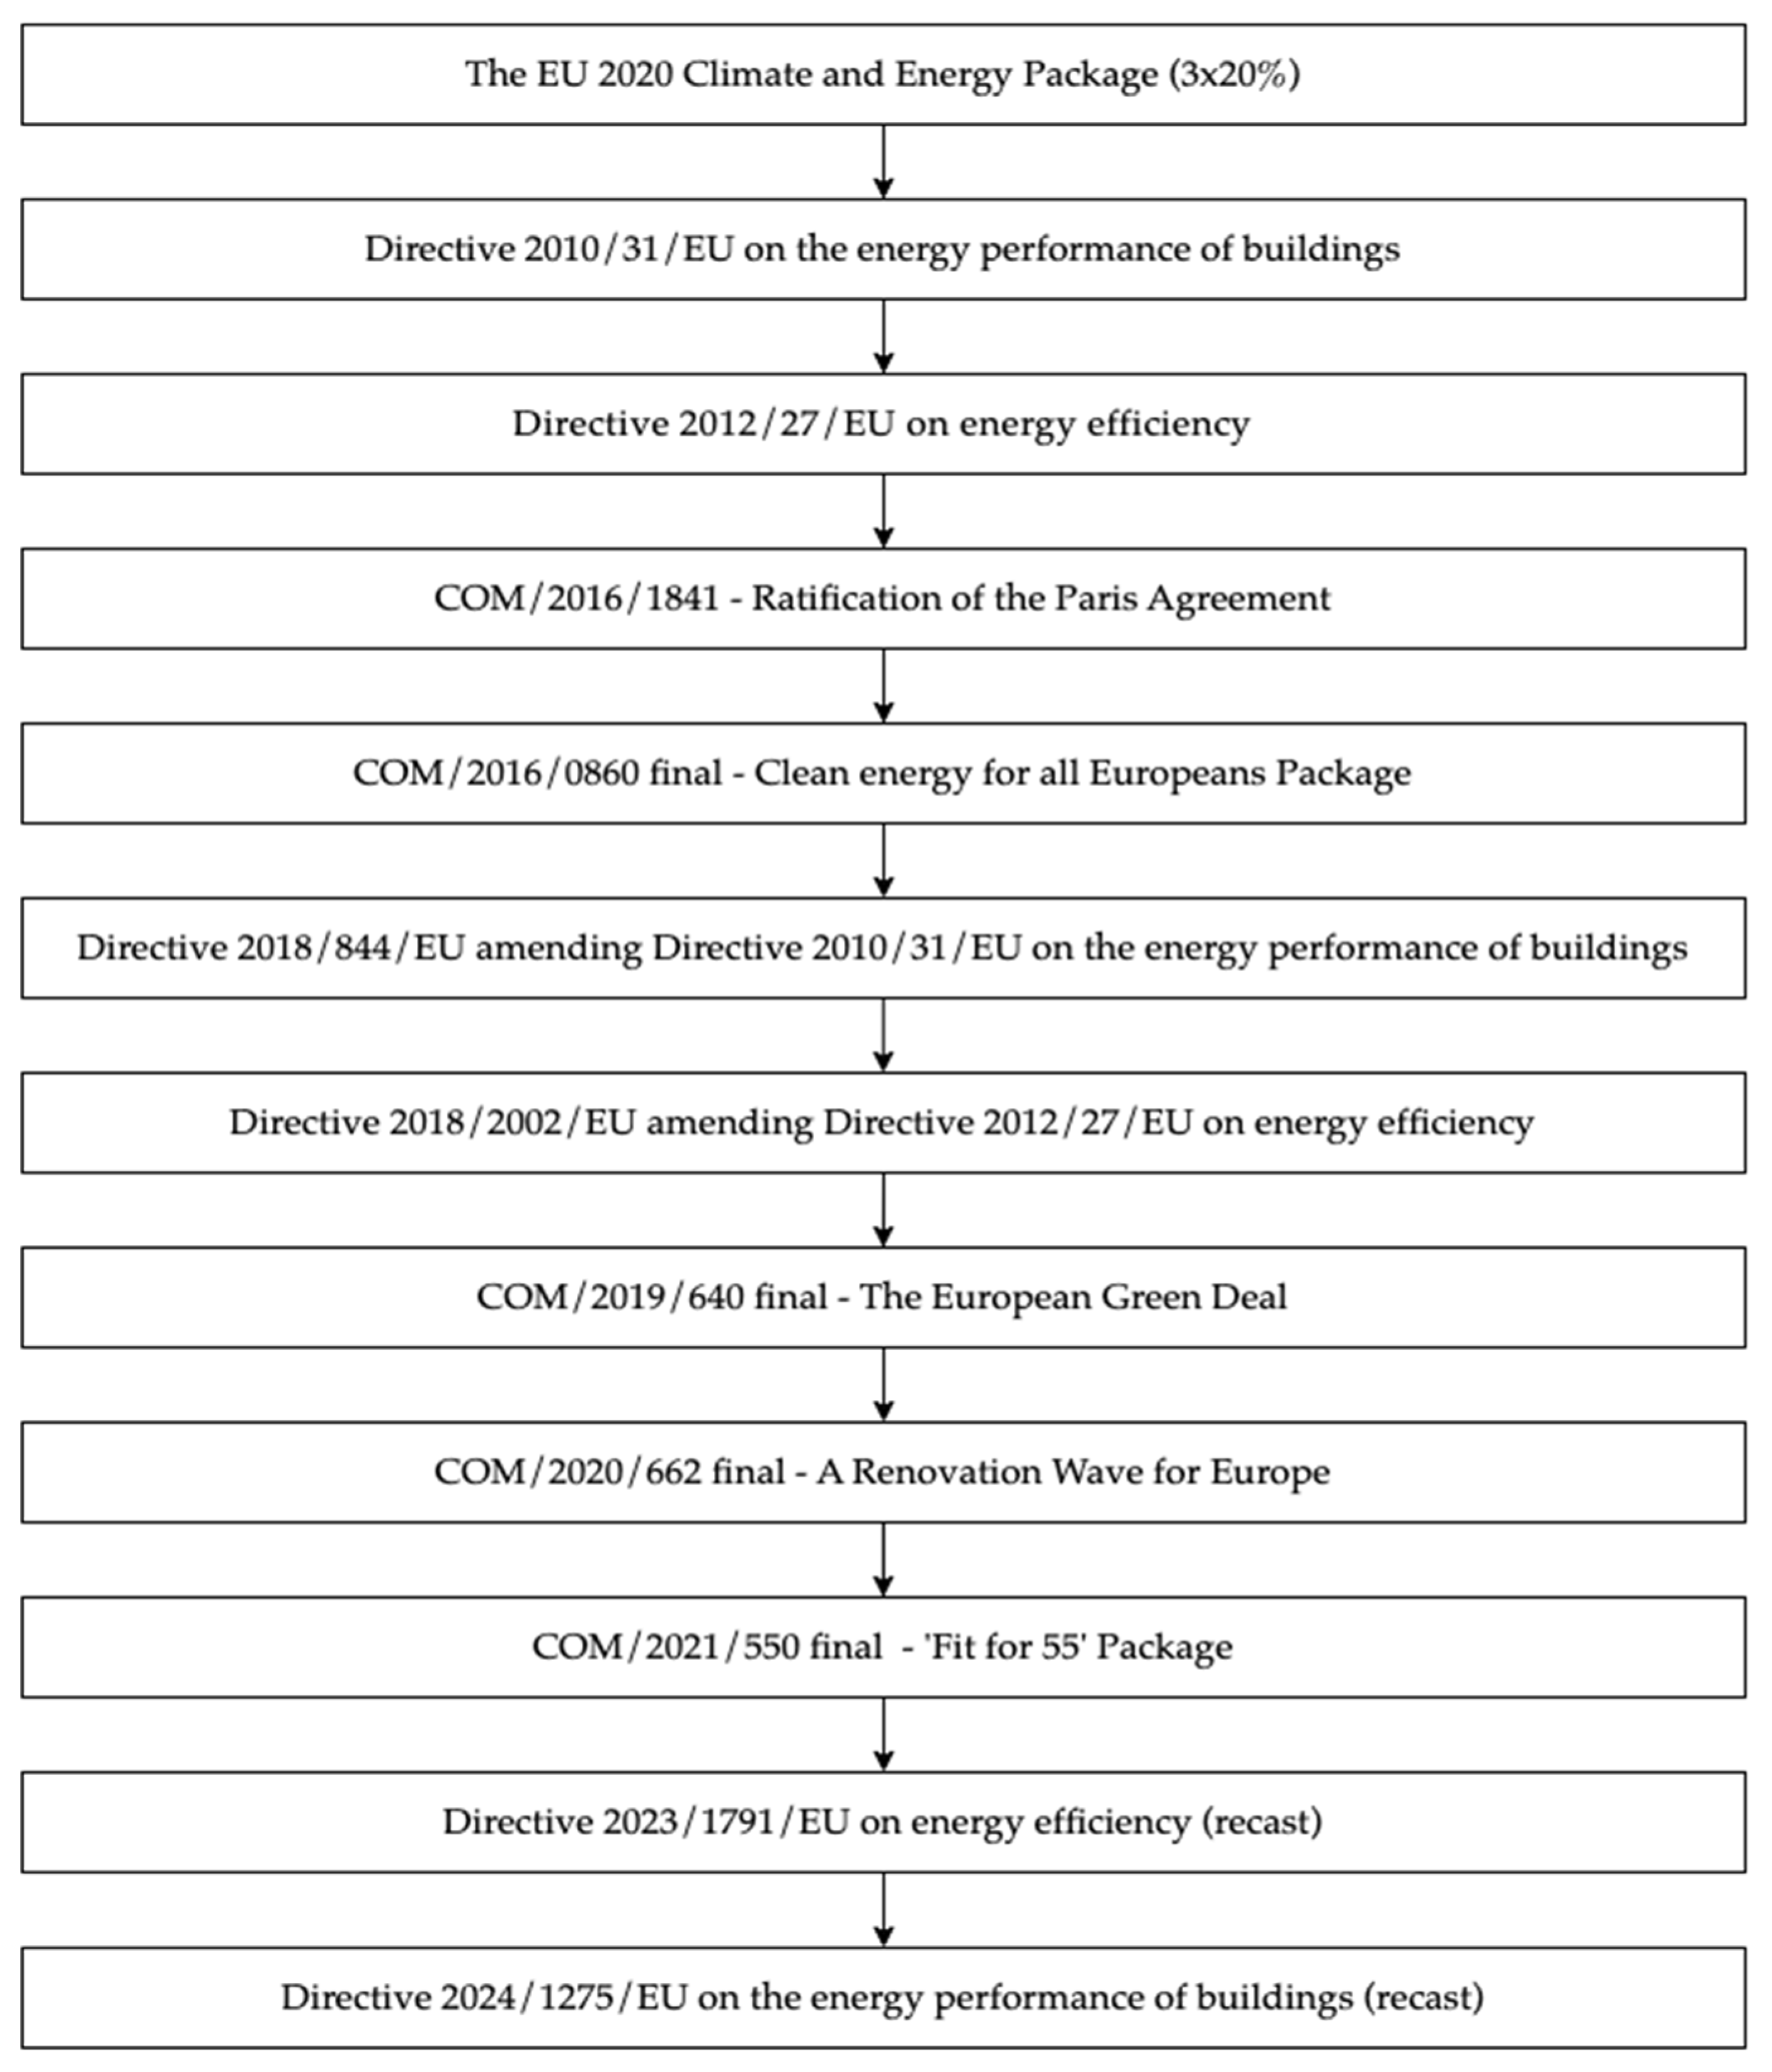
Figure 1. EU legislative efforts for IEEBs.
Energies 17 04417 g001
Figure 2. Dendrogram using Ward’s linkage for beneficiaries.
Energies 17 04417 g002
Figure 3. Dendrogram using Ward’s linkage for investments.
Energies 17 04417 g003
Figure 4. Flowchart of research program.
Energies 17 04417 g004
Table 1. Categories of beneficiaries and investments.
BeneficiaryInvestment
SGU—self-government unitT—thermo-modernization, including the insulation of envelopes, the replacement of windows and door frames, and the installation of measurement systems
R&HC—residential and housing communityT+R—thermo-modernization combined with the installation or replacement of energy and/or heat sources based on RES
PHC—public health serviceT+L—thermo-modernization combined with the replacement of lighting to energy-efficient solutions
NGO—non-governmental organizationT+R+L—thermo-modernization combined with investments in RES and energy-efficient lighting
PES—private enterprise sectorR—investment in RES, such as photovoltaics, solar thermal collectors, heat pumps
FI—financial institutionDB—energy-efficient and passive building, including demonstration building
RI—religious institutionFIS—financial instrument, such as program, subsidy, or grant on IEEBs
OB—other beneficiary, e.g., public administration, universities, police, and fire departmentsOI—other investment, such as the replacement of heat sources based on fossil fuels (e.g., gas or coal furnaces), the connection to a district heating network, the replacement of machinery, the replacement or installation of HVAC systems, or energy audits
Disclaimer/Publisher’s Note: The statements, opinions and data contained in all publications are solely those of the individual author(s) and contributor(s) and not of MDPI and/or the editor(s). MDPI and/or the editor(s) disclaim responsibility for any injury to people or property resulting from any ideas, methods, instructions or products referred to in the content.