1. Introduction
Exploring clean and sustainable energy resources to meet the ever-increasing energy demand and reduce carbon emissions has become one of the major global challenges faced by humanity. Without the development of robust energy systems to efficiently harvest and store renewable energy, the pollution associated with increasing fossil fuel consumption leads to irreversible environmental changes [
1,
2]. In this regard, hydrogen is gradually being adopted as a primary energy carrier and a significant alternative source to prospective energy systems due to its ability to reduce global ecological power challenges with almost zero carbon emissions [
3,
4]. With growing energy demands globally, hydrogen as a flexible source gains significance, promising to minimise emissions and dominate the supply chain of the energy sector [
5,
6]. Although hydrogen is not available freely on the Earth’s crust as a primary energy source, its abundance in natural resources such as water and bioresources offers significant potential for widespread applications using modern water-splitting and pyrolysis processes [
7]. As such, water-splitting technologies through electrolysis play a vital role in handling the variations of renewable energy, providing a way to bridge supply and demand gaps for green hydrogen [
8].
Among various electrolysis technologies for hydrogen production, alkaline water electrolysis and PEM water electrolysis stand out as the most common technologies available at a higher technology readiness level (TRL), with the former extensively utilised on a global scale, marking a collective shift towards environmentally friendly hydrogen production and a successful energy transition [
9]. There are four significant kinds of water electrolysers depending on the electrolyte: alkaline water electrolyser (AWE), solid oxide water electrolyser (SOWE), proton exchange membrane water electrolyser (PEMWE), and anion exchange membrane electrolyser (AEM) [
10]. The PEM electrolyser has various advantages, including the capacity to create hydrogen with high purity, operating at high current densities, and giving significant load flexibility [
11]. A proton exchange membrane water electrolyser (PEMWE) is composed of a selectively permeable membrane (PEM) that separates two electrodes. From an operational perspective, water enters the flow channels of the anode and passes through the porous gas diffusion layer (AGDL) and anode catalyst layer (ACL). Here, it experiences an electrochemical oxidation process, resulting in the separation of protons, oxygen, and electrons. Protons are transported over the membrane to reach the cathode catalyst layer (CCL), where they can be reduced by accepting the electrons provided by the externally linked circuit, as described in the following electrochemical reactions:
Anode half-cell reaction:
Cathode half-cell reaction:
Overall water-splitting reaction:
The design of flow channels inside bipolar plates (BPPs) has a substantial effect on water electrolysis performance. Well-crafted flow channels enable the uniform and constant distribution of pressure and velocity in the fluid, consequently enhancing the stack’s operating capabilities and a higher current density [
12].
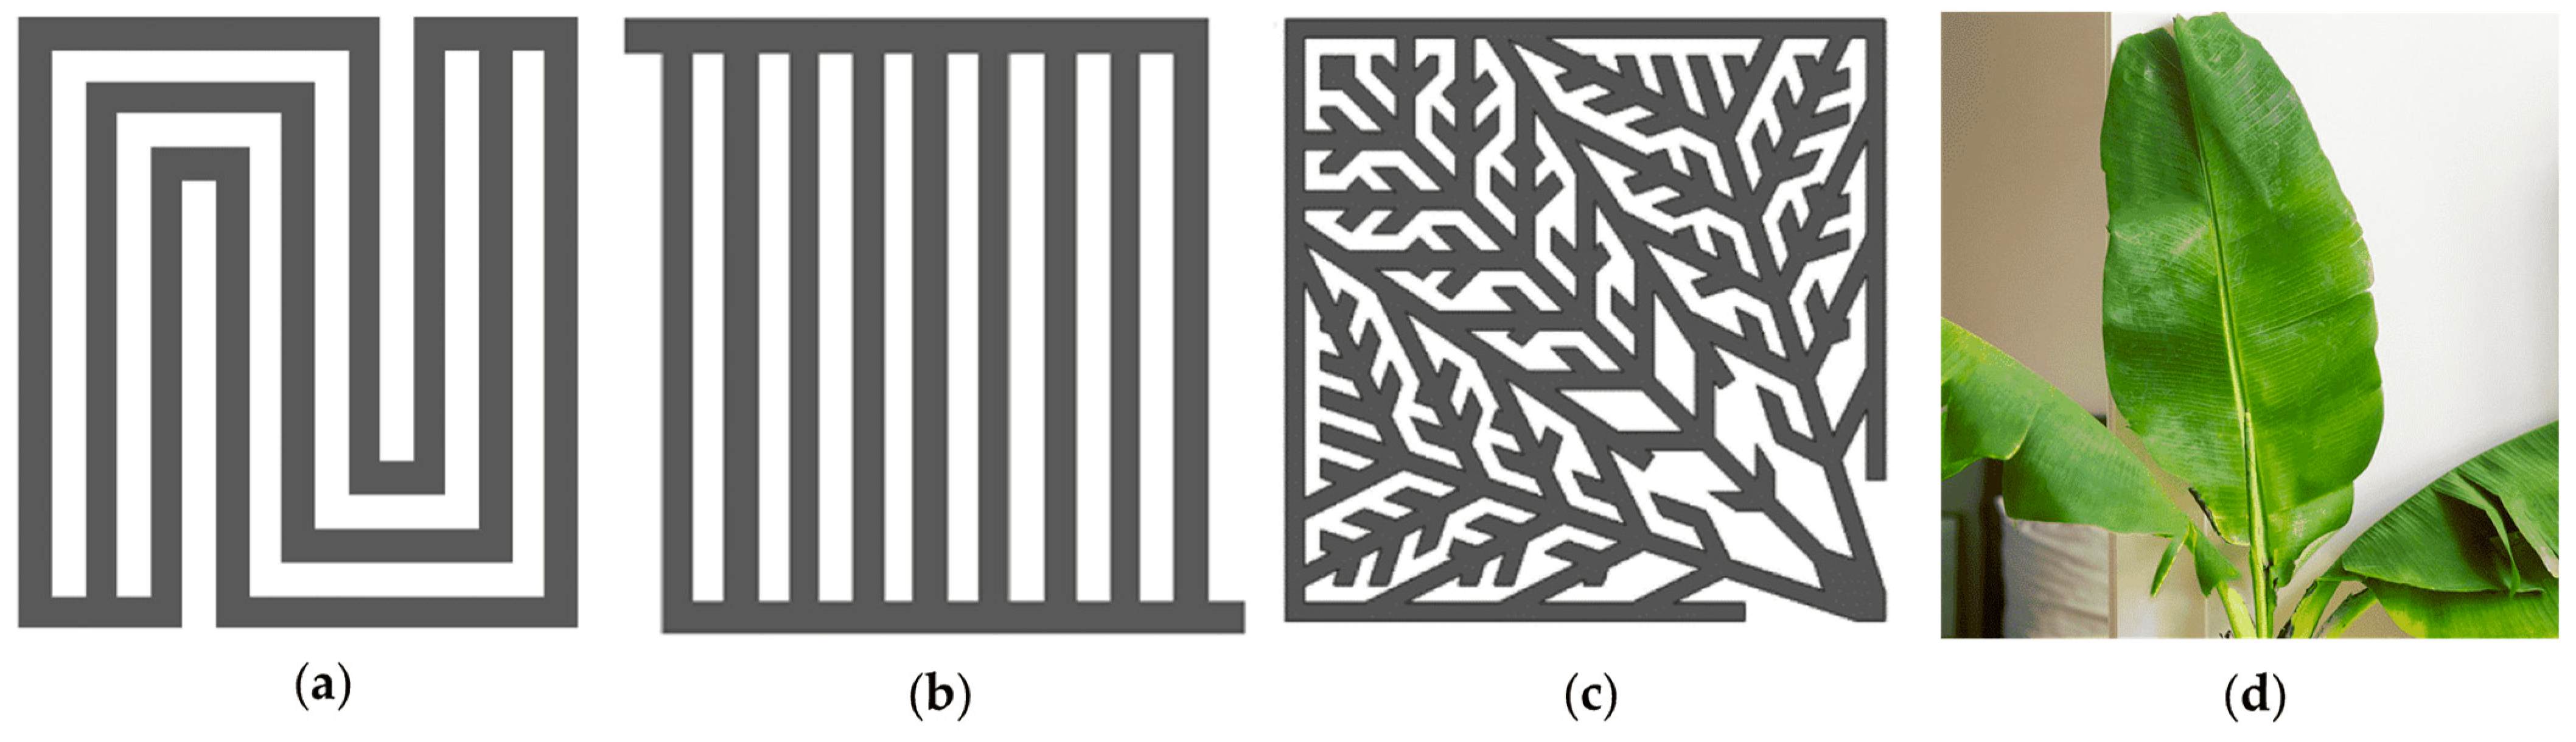
Recently, a few research studies have undertaken numerical and experimental work to enhance the performance of BPPs, as illustrated in
Figure 1a,b. In particular, the numerical studies are capable of developing 3D models to evaluate the electrochemical performance of various types of electrolysers operating under various flow configurations and systematically compare the application of novel porous materials. For example, a recent study demonstrated that the use of a porous material flow channel could improve the PEM cell’s electrochemical performance by reducing voltage demand by 0.062 V and increasing electrolysis efficiency by 4.78% at 2.5
, which enhances gas diffusion from the channel to the porous layer [
13]. In addition, the traditional flow channels usually show nonuniform chemical and electrochemical distributions, resulting in developing gas blockage areas in parallel modes of operation. In this regard, another study numerically evaluated various serpentine, sinuous, and serpentine-sinuous flow channels in PEMFCs and validated the results experimentally [
14]. The result of this study showed that the serpentine-sinuous flow channel could produce a 7.7% higher power density when compared with the pure serpentine flow channel model. Overall, flow channel designs offering a reduced flow channel length and pressure drop could contribute to improving under-rib convection, thereby gaining higher water removal and more rigorous reaction phase distribution.
The performance of a PEM electrolyser system is considerably increased by the proper design of the flow channel pattern. Recently, a study on three-dimensional modelling of gas–liquid flow in the anode bipolar plate of a PEM electrolyser using a parallel pattern with varying channel numbers reveals significant limitations [
15]. The results show non-uniform oxygen consumption, non-homogeneous velocity distribution, and high-pressure drop. Increasing the number of channels is necessary to address these issues. In another study, a three-dimensional model of three flow channel structures has been built to simulate the internal flow velocity and pressure distribution in PEM electrolysis, finding that the parallel flow channel offers advantages such as a large contact area with the membrane electrode assembly and uniform pressure distribution, resulting in low overall impedance. However, its minimal flow rate hinders reactant diffusion, causing flooding and increased mass transfer impedance at high current density. The serpentine flow channel has a higher flow rate and pressure drop, improving reactant diffusion but leading to stagnation areas at channel corners and plunger flow at high speeds, increasing mass transfer impedance. The point flow channel shows uniform pressure in the middle but drastic changes at the inlet and outlet [
16].
Figure 1.
Flow channel patterns: (a) Serpentine flow pattern; (b) Parallel flow pattern; (c) Murray’s law biomimetic flow pattern; (d) Exact leaf bio-inspired flow pattern.
Figure 1.
Flow channel patterns: (a) Serpentine flow pattern; (b) Parallel flow pattern; (c) Murray’s law biomimetic flow pattern; (d) Exact leaf bio-inspired flow pattern.
Furthermore, the convergence accelerator technique is projected to have an outsized influence on developing bio-inspired designs. Recently, it has been employed to increase the performance of PEM electrolysis (
Figure 1c,d). From a literature point of view, a study evaluated 25
PEMFC with flow channels simulating leaf veins. The net leaf flow channel had a maximum power density of 24% higher than that of the parallel flow channel, and the ginkgo flow channel showed better water removal capacity than the parallel flow channel. However, the net leaf flow channel’s power density was found to be 34% lower than the serpentine flow channel, which had the highest water removal capacity, while the net leaf flow channel had the lowest [
17]. Returning to another investigation, a novel bio-inspired flow channel based on Murray’s law shows notable advantages. Compared to the parallel flow channel, the bio-inspired-I increases maximum power by 64.8% and the bio-inspired-II by 114%. These new designs also reduce pressure drop and ensure more uniform distributions of reaction gases and products. However, the conventional bio-inspired flow channels do not perform as well as those based on Murray’s law [
18].
Some research has explored flow channel patterns in Bipolar Plates (BPPs), primarily focusing on traditional designs or bio-inspired configurations derived from Murray’s law. However, to the best of the authors’ knowledge, a noticeable gap exists in the literature concerning numerical investigations into flow channel patterns for PEM water electrolysers inspired by authentic vine leaf patterns found in biomass, which could significantly optimise and improve PEMWE performance and efficiency. This study aims to develop a new three-dimensional, multi-component, single-phase model of BPP for PEM water electrolysers based on authentic vine leaf patterns. For this, five novel leaf patterns are numerically simulated and analysed.
The flow characteristics over the BPP are critical for a better performing PEM and are a strong function of the flow of the fluid, with less pressure losses and more surface area of the flow. This requirement represents a good analogy to form bio-inspired flow fields where there are more channels and hydraulic pathways. Therefore, selection of the leaves as alternative flow field influencers is based on these two main aspects. These bio-inspired models were systematically analysed and compared with traditional flow channel patterns to demonstrate their performance aspects. A parametric study is conducted to determine the optimal performance conditions for the novel designs.
2. Model Development
The implementation of the nonlinear differential equations for a three-dimensional single-half-cell PEMWE is performed using a single-phase-domain technique. The finite element method is employed to simulate the conservation equations for electrochemical reactions, which need to be solved concurrently across seven distinct regions of the cell. These regions include the anode and cathode catalyst layers, GDLs, anode channel, and membrane.
Figure 2 illustrates a schematic diagram of a typical PEMWE. A numerical model of a proton exchange membrane water electrolyser (PEMWE) is created using COMSOL Multiphysics 5.2, a software for computational fluid dynamics (CFD) simulations in three dimensions. The mesh independence of the results is confirmed to ensure that the results are unaffected by changes in the mesh.
Table 1 and
Table 2 display the geometrical parameters, physical characteristics, and operating conditions for the PEMWE.
Various leaf structures have been selected from nature based on their morphologies and performance, specifically focusing on maximising water transport efficiency. This efficiency is determined by the density of veins and the length of the hydraulic channel within the mesophyll [
19,
20,
21]. With the help of the computational method, it is possible to export the exact leaf vein geometry and mesh as represented in
Figure 3.
The modelling studies focus on optimising the anode channel patterns using the leaf-bio-inspired flow-field of five leaf vein patterns (Acalypha Hispida leaf [
22], Kiwi leaf [
23], Nelumbo Nucifera leaf [
24], Soybeans [
25], and Victoria Amazonica Water Lily leaf [
26]) as shown in
Table 3. Three typical flow channel patterns, as indicated in
Table 4, are modelled and simulated. A few assumptions are made in this model to avoid misunderstandings and maintain consistency. It is assumed that the model is operating in a steady state, laminar flow regime with an incompressible fluid, and the flow channels are considered with one or more inlet and outlet ports. Also, the isothermal Newtonian fluid principle could be applied at the atmospheric pressure in the anode flow channels, disregarding gravity potential and kinetic energy changes. The gas mixture would almost behave like an ideal gas under these conditions, neglecting the contact resistance between various layers. In addition, the GDL, catalyst layer, and membrane are expected to be homogeneous and isotropic.
Figure 2.
Flow A typical PEM water electrolyser consists of (ACL, CCL, ACH, AGDL, CGDL, and PEM).
Figure 2.
Flow A typical PEM water electrolyser consists of (ACL, CCL, ACH, AGDL, CGDL, and PEM).
Figure 3.
Model process before the simulation: (
a) The leaf selection (depending on their shapes and hydraulic pathway [
20,
21]); (
b) Design and extract the exact vein geometry; (
c) Mesh the model.
Figure 3.
Model process before the simulation: (
a) The leaf selection (depending on their shapes and hydraulic pathway [
20,
21]); (
b) Design and extract the exact vein geometry; (
c) Mesh the model.
Table 1.
Geometrical parameters of the leaf bio-inspired flow channels.
Table 1.
Geometrical parameters of the leaf bio-inspired flow channels.
| Name | Side | Material | Value | Unit | Source |
|---|
| Cell radius | | | 0.0215 | m | - |
| Cell Area | | | 0.001385 | | - |
| GDL thickness | Anode | Ti mesh | 2 × 10⁻⁴ | | [19] |
| Cathode | Ti mesh | | | [19] |
| CL thickness | Anode | Iridium dioxide () | 1 × 10⁻⁵ | | [27] |
| Cathode | platinum with carbon () | | | [27] |
| Membrane thickness | | Nafion® 117 | 1.78 × 10⁻⁴ | | [19] |
| Channel thickness | | | 0.001 | | [19,28] |
Table 2.
Operational parameters of the leaf bio-inspired flow channels.
Table 2.
Operational parameters of the leaf bio-inspired flow channels.
| Name | Eq. Number | Value | Unit | Source |
|---|
| Cell temperature | | 328.15 | | - |
| Reference temperature | | 298.15 | | [19] |
| Reference pressure | | 1.01 × 10⁵ | | [19,28] |
| Mass flow rate | | 1.9379 × 10⁻⁶ | | [29] |
| Current density | | 0.2 to 1.5 | | - |
| Water stoichiometry Ratio | | 1 | - | [29] |
| Membrane conductivity | | 20.22 | | [30] |
| Stoichiometric coefficient of | | 0.5 | | [28] |
| Stoichiometric coefficient of | | 0.5 | | [28] |
| Stoichiometric coefficient of | | −0.25 | | [28] |
| Number of participating Electrons | | 1 | 1 | [28] |
| PTL conductivity | | 3.78 × 10⁷ | | [28] |
| PTL permeability | | 1 × 10⁻¹¹ | | [19] |
| PTL porosity | | 0.72 | - | [19] |
| Anodic transfer Coefficient | | 0.5 | - | [19,31] |
| Active Specific surface Area | | 10,000 | | - |
| Reference exchange current density, anode | 1 | 0.0075 | | [31] |
| 2 | 5 × 10⁻⁸ | | [19] |
| 3 | 0.01 | | [32] |
| Reference exchange current density, cathode | 1 | 120 | | [31] |
| 2 | 10 | | [19] |
| 3 | 2900 | | [32] |
Table 3.
The leaf bio-inspired flow channel model: (a) L1U Soybeans; (b) L2V Victoria Amazonica Water Lily; (c) L3N nelumbo nucifera; (d) L4K Kiwi; (e) L5A Acalypha Hispida.
Table 4.
The traditional flow channel model: (a) PR6 Parallel; (b) PO7 point; (c) SR8 Serpentine.
Table 4.
The traditional flow channel model: (a) PR6 Parallel; (b) PO7 point; (c) SR8 Serpentine.
Conservation of mass: an open-porous media structure is applied to enable the fluid flow model domains, neglecting the gravity effect. Assuming a zero-velocity condition at the side walls, the mass transfer process taking place at the porous medium could be obtained using the following equations:
where
is the mixture velocity vector (
),
is the mixture density (
),
is the source term or mass source
. Also, assuming a lack of
inside the flow channels, the above equation can be simplified as:
Conservation of momentum: the momentum conservation principle could be applied to the fluid flowing in the porous medium GDL as follows:
where
is the pressure (
),
is the dynamic viscosity of the mixture (
),
is the viscous stress tensor (
),
is the volume force vector (
) and,
is the absolute temperature (
); where
is the GDL porosity (dimensionless),
the permeability of the GDL (
), and
is the drag force coefficient (dimensionless), which is assumed to be zero.
Mass Diffusion (Maxwell–Stefan) equation: the PEMWE comprises
species, gas phase diffusion, and
in the stoichiometric reaction. In order to solve for the fluxes of each species in terms of mass fraction, the whole computational domain of the multispecies mass transports could be described by the Maxwell–Stefan diffusion equation as follows:
where
is the mass-averaged velocity of the mixture
,
is the mass flux relative to the mass-averaged velocity (
),
is the mass fraction (dimensionless),
is the rate expression describing its production or consumption (
),
is the multicomponent Fick’s law diffusivities (
),
is the diffusional driving force (
) acting on species k,
is the mole fraction (dimensionless),
is the total anode pressure (Pa),
is the average molar mass (
), and
partial pressures (
).
Charge transfer equation: the current continuity equations based on the electronic and protonic charge transfer could be expressed using Ohm’s law for the membrane and electrode, as follows:
The and are electrolyte and electronic phase nodes that solve for the electric potential respectively, as the dependent variable, where is the current density in the phase (), and are the effective electrolyte and electronic conductivity (), respectively, and is the sum of a volumetric current density (). The source terms in the electron and proton transport equations originate from the electrochemical reaction, which occurs solely in the catalyst layers of the anode and cathode sides.
Constitutive relations: in this model, the Nernst equation could be used to represent the equilibrium potential with local current density,
, obtained from the kinetics expressions prevailing charge transfer equations at the electrode surface (
). This can be calculated using a combination of the simplified Butler–Volmer equation, mass action law, and Stefan velocity equation, as follows:
where
is the activation overpotential (
,
denotes the equilibrium potential (
),
Electrode potential (
),
is the active specific surface area
,
is the species’ molar mass (
),
is the Faraday constant (
),
is the number of participating electrons (1),
stoichiometric coefficient (1).
where
is the unit normal pointing out of the fluid domain,
and
are the current density vectors in the electrolyte and electrode (
), respectively,
is the electrode thickness (
),
denotes the mass flux (
) of species
relative to the mixture (typically due to diffusion), and
referred to as the Stefan velocity (
).
Inlet condition: with 0.9 mole fraction of
as an initial condition, and the
mass flow rate (
) inlet boundary condition calculated by the following equations [
29]:
where
is the boundary thickness (
) normal to the fluid-flow domain (only present in the 2D Cartesian axis system),
is the stoichiometric ratio of feed water (dimensionless),
is the molar weight of water (
),
is the current density (
), and
is the active area (
).
Outlet condition: the PEMWE outlet condition includes a gas phase diffusion term using
binary diffusivities (
). The outlet condition is subsequently identified as follows:
On the other hand, in the flow fluid model part, a free and porous medium applies the static pressure boundary condition at the outlet, with normal flow where static pressure
is donated by “
” to suppress the backflow condition, as follows:
Wall condition: the symmetry boundary condition could also be applied on the GDL side walls, and the no-slip boundary condition is applied to the rest of the walls using the following equations:
Current density: for electrode current density,
is the inward current density (
) taken as an average from 2000 to 15,000 (
) and integrated over a titanium mesh as the electrode, which can be supported by the following equation:
To verify the simulation model’s prediction capability [
27], the simulated results against experimental data have been represented in
Figure 4 at operating conditions of 1.0 bar and 328.15
. The numerical model predictions are in good agreement with Upadhyay’s study [
20].
3. Result Discussion
The analysis of PEM water electrolyser characteristics entails studying the polarisation curve and establishing the relationship between the electrolyser’s voltage and current density, which is applied as a fundamental checkpoint to run characteristic comparative performance studies among various kinds of electrolysers.
Figure 5. illustrates that the leaf bio-inspired models often have better polarisation curves compared to their standard model counterparts. The L2V, L4K, and L5A models have the most beneficial performance in terms of polarisation curves, respectively. For example, in the case of L2V, a voltage increase from 1.9751 to 2.5173
leads to a change in current density ranging from 200 to 15,000
. This change is observed at an operating temperature of 328.15
and a pressure of 1 bar, with the mass flow rate being controlled by Equation (28). These improvements are primarily due to better flow distribution, enhanced mass transport, efficient electrochemical reactions, effective water and gas management, and lower pressure drops.
Pressure distribution significantly affects the performance of proton exchange membrane water electrolysis (PEMWE) cells. A significant pressure drop across the cell enhances water management capabilities and complicates reactant distribution. Therefore, adjusting the pressure distribution to retain high water removal capabilities while reducing pressure drop is critical.
Figure 6 displays pressure drop profiles among the models, revealing that L2V has the lowest pressure drop across all models. Additionally, the conventional models demonstrate much larger pressure drops, with the multi-serpentine design especially reaching 476.48
compared to the leaf bio-inspired models. Having longer paths in conventional designs leads to a more significant pressure drop, with a noticeably smaller average inlet-to-outlet path length in the leaf bio-inspired models, particularly L2V with an 8.05
pressure drop, showcasing substantially lower pressure drops in the range of 0 to 45
, as opposed to traditional models.
Pressure distribution reveals greater values near channel entrances, reducing along the channel due to friction and local flow redirection.
Figure 7 illustrates static pressure across several flow channel designs, with pressure scales from 0 to 480
with clarification of the pressure distribution for the design itself. The L2V, L4K, and L5A models demonstrate highly interconnected flow channels, which boosts homogeneity and reduces pressure differentials, as illustrated in
Figure 7b,d,e. The spiral route inside channels considerably contributes to the pressure decrease. Additionally, an increased number of connections in the leaf bio-inspired models, especially L2V, L4K, and L5A, provide speedier pressure equalisation, resulting in more uniform pressure distribution and smaller pressure drop profiles.
Mixture Distribution
The distribution of reactant mass fractions ideally aligns with the velocity profile, aiming for higher reactant mass fractions to enhance reaction rates, consequently ensuring more uniform reactant density and consistent current density across the cell.
Figure 8a–c illustrates the distribution of oxygen concentration within the anode compartment and the anode GDL at a specific current density of 15,000
with Mole Fraction scales from 0 to 0.65. The study reveals that leaf bio-inspired models (L2V, L4K, L5A) significantly outperform traditional designs (parallel, point, serpentine) in terms of polarisation curves and reactant distribution, leading by L2V as the best oxygen concentration distribution among all the designs. In selected bio-inspired designs, the alignment of reactant mass fractions with the velocity profile enhances reaction rates and ensures a uniform reactant density, leading to consistent current density across the cell. The increased pressure drops and water consumption along the channel elevate oxygen concentration towards the outlet, with higher water availability at the inlet resulting in lower reactant diffusion rates and oxygen concentration near the inlet. Use of titanium mesh as the GDL anode electrode could further support the effective management of reactant and product gases.
Figure 9 displays water distribution among various flow channel designs, maintaining identical water mole fraction distribution scales for all designs. The water distribution analysis highlights that leaf bio-inspired models achieve a more uniform and homogeneous water distribution compared to traditional designs. This uniformity prevents issues like dry-out or flooding, ensuring consistent membrane hydration and efficient ion transport, which are critical for high-cell performance. The findings underscore the importance of adopting bio-inspired designs to optimise flow channel geometry, thereby enhancing the efficiency, performance, and durability of PEMWE systems.
PEMWE systems derive substantial benefits from uniform and high-velocity profiles. Elevated velocities significantly improve a cell’s ability to remove liquid water and facilitate the extraction of gases evolved, thereby enhancing operational efficiency. Similar reactant residence times and a more even reactant distribution characterise uniform velocity profiles, resulting in a more consistent distribution of hydrogen production.
Figure 10 depicts the velocity magnitude contours of various flow channel designs within the anode channel at a specific current density of 15,000
utilising velocity scales that vary based on the design, which illustrates that leaf bio-inspired models (L2V, L4K, and L5A) exhibit lower maximum velocities while enabling swifter water removal at higher maximum velocities, unlike traditional designs where maximum velocities occur mainly at channel inlets, leading to significant velocity drops along the channel. The leaf models maintain higher and more uniform average velocities, promoting even reactant distribution and enhancing electrochemical reactions. In contrast, traditional designs show high inlet velocities, which decrease across flowing down through the channel, leading to poor reactant distribution and potential stagnation. The nearly homogeneous velocity distribution in leaf models ensures efficient transport and utilisation of reactants, contributing to superior performance and efficiency in PEMWE systems compared to traditional designs. In terms of velocity profiles, the L2V, L4K, and L5A models notably outperform other designs.
A parametric study is conducted to determine optimal performance conditions for the novel designs by studying the effects of mass flow rate, exchange current density, active specific surface area (ASSA), and operation temperature on the voltage, pressure drop, and velocities.
Figure 11a represents that as mass flow rate increases in the L2V, L4K, and L5A models at a current density of 15,000
, 328.15
, and 1.0 bar pressure, the velocity increases, resulting in higher performance, while pressure increases linearly with the mass flow rate, leading to lower performance, though voltage remains unaffected. This is because increasing the mass flow rate enhances the supply of reactants and the removal of products, boosting reaction rates and overall cell performance. However, higher flow rates also cause greater pressure drops due to increased frictional losses within the channels, negatively impacting efficiency. Despite these changes, the voltage remains stable as it primarily depends on the electrochemical reactions, not on the flow dynamics within the cell.
Figure 11b indicates that increasing the anode–cathode reference exchange current density improves polarisation curve performance without affecting pressure drop or velocity. Using Dedigama’s Model [
32], a higher reference exchange current density means that the catalytic activity at the electrodes is more efficient, enhancing the overall reaction rates and improving the polarisation curve. This improvement is achieved without altering the fluid dynamics of the system, explaining why there is no change in pressure drop or velocity with varying exchange current density.
Figure 11c shows that increasing the active specific surface area (ASSA) of the anode and cathode catalysts significantly improves polarisation curve performance by decreasing voltage.
Figure 11d illustrates that this change has no notable effect on pressure drop, O
2 mole fraction, or average velocity at the mass flow rate of 5.43
. A larger ASSA provides more active sites for electrochemical reactions, reducing activation losses and lowering the required voltage, thereby improving the polarisation curve. This enhancement in electrochemical performance does not affect the characteristics of fluid flow or gas distribution within the cell, resulting in an unchanged pressure drop, O
2 mole fraction, and average velocity.
Operation temperature is an important factor affecting the performance of PEMWE.
Figure 11e demonstrates that lower operation temperatures lead to higher polarisation curve performance in the L2V model, while
Figure 11f shows that operating temperature has a minimal effect on O
2 mole fraction and average velocity at a mass flow rate of 1.94
. However, pressure drops slightly with rising temperatures. Lower operation temperatures reduce thermal losses and improve membrane hydration, enhancing cell efficiency and polarisation curve performance. Although changes in temperature have a minimal impact on gas diffusion and flow rates, they do slightly increase the viscosity of the fluids, leading to a minor rise in pressure drop as temperature increases. This indicates that while temperature optimisation is important for cell performance, its impact on fluid dynamics is relatively minor.
While capable of the necessary complexity, producing Bipolar Plates (BPPs) with complex leaf vein patterns requires advanced manufacturing methods such as desktop computerised numerical control (CNC) milling, 3D printing, precision machining, or micro-moulding, which are generally more expensive than conventional techniques like stamping or injection moulding. Particularly when great precision and endurance are required, the materials used graphite, metal alloys, or coated polymers are often very costly. Further research is required to address the complexity of the leaf vein design, which may necessitate greater material quality to assure structural integrity and performance and could also slow down production speed, therefore increasing per-unit prices.
In addition to the manufacturing complexities, the simulation of biomimetic fluid field designs, such as those inspired by leaf vein patterns, presents significant challenges due to their intricate structures and non-linear fluid dynamics, making accurate simulation both computationally intensive and difficult to manage with traditional methods. Ensuring that simulations adequately depict the performance benefits, such as efficient fluid distribution and low pressure drops, adds more complexity. Given these limitations, it is captivating to explore the integration of artificial intelligence (AI) to enhance or simplify the simulation process. AI might optimise design parameters, minimise computational burden, and perhaps produce more integrated and efficient biomimetic fluid field designs, making these solutions more viable and scalable. Future studies could focus on using convolutional neural networks (CNNs) to investigate flooding and water removal potential [
33] and on exploring the applicability of a computationally efficient neural network-driven 3D+1D model for proton exchange membrane fuel cells in the context of biomimetic fluid field design [
34].


