Article

Infrared Image Object Detection Algorithm for Substation Equipment Based on Improved YOLOv8

by
Siyu Xiang
1,2,
Zhengwei Chang
3,
Xueyuan Liu
1,
Lei Luo
1,
Yang Mao
4,
Xiying Du
5,
Bing Li
5,* and
Zhenbing Zhao
6
1
State Grid Sichuan Electric Power Research Institute, Chengdu 610095, China
2
Power Internet of Things Key Laboratory of Sichuan Province, Chengdu 610095, China
3
State Grid Sichuan Electric Power Company, Chengdu 610095, China
4
State Grid SiChuan GuangYuan Electric Power Company, Guangyuan 628033, China
5
Department of Automation, North China Electric Power University, Baoding 071003, China
6
School of Electrical and Electronic Engineering, North China Electric Power University, Baoding 071003, China
*
Author to whom correspondence should be addressed.
Energies 2024, 17(17), 4359; https://doi.org/10.3390/en17174359
Submission received: 2 July 2024 / Revised: 5 August 2024 / Accepted: 28 August 2024 / Published: 31 August 2024

Abstract

:
Substations play a crucial role in the proper operation of power systems. Online fault diagnosis of substation equipment is critical for improving the safety and intelligence of power systems. Detecting the target equipment from an infrared image of substation equipment constitutes a pivotal step in online fault diagnosis. To address the challenges of missed detection, false detection, and low detection accuracy in the infrared image object detection in substation equipment, this paper proposes an infrared image object detection algorithm for substation equipment based on an improved YOLOv8n. Firstly, the DCNC2f module is built by combining deformable convolution with the C2f module, and the C2f module in the backbone is replaced by the DCNC2f module to enhance the ability of the model to extract relevant equipment features. Subsequently, the multi-scale convolutional attention module is introduced to improve the ability of the model to capture multi-scale information and enhance detection accuracy. The experimental results on the infrared image dataset of the substation equipment demonstrate that the improved YOLOv8n model achieves mAP@0.5 and mAP@0.5:0.95 of 92.7% and 68.5%, respectively, representing a 2.6% and 3.9% improvement over the baseline model. The improved model significantly enhances object detection accuracy and exhibits superior performance in infrared image object detection in substation equipment.

1. Introduction

Amidst the rapid development of a new power system, enhancing the intelligence of the power grid has become a critical research priority. Considering their pivotal role in the transmission and transformation processes of the power grid, it is essential to delve into the intelligent operation and maintenance of substations [1,2]. The primary goal of intelligence is to safeguard the stability and safety of the power system. The secure and dependable functioning of substations serves as a critical assurance for the overall stability of the power grid. Over time, substation equipment may develop faults. Failure to promptly detect and address these issues can lead to more serious consequences such as fires or explosions, which can disrupt the normal operation of the power grid. Hence, it is imperative to carry out inspections and fault diagnoses of substation equipment [3]. Substation equipment faults often manifest through abnormal temperatures, and the utilization of infrared thermal imaging technology is commonly the primary method for evaluating the condition of substation equipment. This technology enables inspections to be conducted without direct contact with the equipment and without interrupting the power supply [4]. To alleviate the workload of inspection personnel and enhance inspection efficiency, substations employ inspection robots and surveillance cameras to capture images of equipment for fault diagnosis [5]. Currently, fault diagnosis based on inspection images still requires manual assessment by skilled technicians. This method relies on the expertise of professionals, resulting in reduced accuracy and efficiency. Moreover, it is unable to accommodate the expansion of the substation scale and the increasing volume of data at this stage [6]. Therefore, it is essential to research intelligent image processing techniques to enhance the current situation.
Extracting target devices from substation equipment is a crucial step in diagnosing faults using infrared images. Numerous existing methods rely on object detection algorithms to acquire equipment category information and delineate the equipment area. Subsequently, the positional information of the equipment is leveraged to extract temperature details from the infrared images, which are then combined with the equipment category information to facilitate subsequent fault diagnosis [7]. Enhancing the object detection precision of substation equipment is crucial for improving the accuracy of subsequent fault diagnosis. Therefore, methods to enhance the object detection precision of substation equipment represent a research focus in the field of electric power.
Currently, detecting substation equipment in infrared images is commonly achieved through deep learning methods, with numerous researchers conducting relevant studies in this field. Wang et al. [8] utilized an enhanced version of YOLOv5 for identifying substation equipment in complex backgrounds. Their approach introduced ghost convolution to the backbone network of YOLOv5 to streamline the network. Additionally, they integrated ECA (efficient channel attention) [9] to enhance the target features. Finally, they improved the accuracy and accelerated convergence of the network by enhancing the feature-capturing ability through improvements in NMS (non-maximum suppression) and the loss function. Zhao et al. [10] tackled the challenge of limited complex background samples for substation equipment by employing a denoising diffusion probability model to create samples with intricate backgrounds. Subsequently, they enhanced YOLOv6 by integrating MHSA (multi-head self-attention) [11] and the EVC module (explicit visual center) [12], ultimately leading to a notable improvement in the detection accuracy of substation equipment. Deng et al. [13] enhanced YOLOv7-tiny by incorporating GhostNetV2 BottleNeck [14]. They further strengthened the feature extraction capability by introducing the coordinate attention mechanism. In addition, they replaced the CIOU Loss with SIoU Loss to accelerate model convergence and improve localization accuracy. These improvements not only achieved a lightweight design but also significantly enhanced the recognition accuracy of the substation equipment. Zheng et al. [15] made improvements to the FSSD (Feature Pyramid Single Shot MultiBox Detector) [16] object detection model. The feature enhancement module is introduced into the shallow layer of the model, and the feature mapping obtained from the feature extraction network is used to reconstruct the feature fusion network. Additionally, they utilized clustering algorithms to enable adaptive changes in the aspect ratios of anchor boxes, facilitating the detection of two types of substation equipment. Ou et al. [17] employed an enhanced Faster R-CNN model to automatically detect five types of substation equipment. They simplified the feature extraction network, VGG16, by removing certain deep convolutional layers and proposed two novel anchor boxes specifically designed for lengthening devices to improve detection accuracy. These enhancements led to improved detection precision and speed for the model. Zheng et al. [18] employed the Iresgroup [19] structure as the backbone network for CenterNet [20] to enhance the feature extraction capability of the model. In addition, they further enhanced the feature learning ability of the model by using group convolution structure and hyperparameter optimization, thus improving the detection ability of substation equipment in infrared images. Wu et al. [21] proposed ISE-YOLO to solve the problem of poor detection of small target devices, designed a global–local fusion feature extraction module based on YOLOv5, proposed a multi-granularity subsampler, and introduced heavy parameter decoupling to improve model detection accuracy. They obtained a map@0.5 of 80.6 with a parameters (Params) of 27.3 M. Wu et al. [22] upgraded the feature extraction network of Faster R-CNN from a ResNet to an InResNet structure to enhance feature extraction capability. In addition, they upgraded activation functions and data normalization methods and introduced a dense join structure in ResNet. These improvements allow the model to better identify and locate substation equipment. Sheng et al. [23] proposed a detection method for substation electrical equipment based on MobileNet. They enhanced the data set by clipping and flipping and introduced an ROI selection method based on infrared image hotspot sensitivity to improve the accuracy of equipment identification. Lu et al. [24] introduced coordinate attention in YOLOv8 to improve the feature fusion capability of the network, replaced the CIoU loss function with SIoU to reduce the misjudgment rate of the model, and finally added a small target detection head to improve the detection accuracy of the model for small targets.
The above works employ deep learning models for object detection in infrared images of substation equipment, aligning with the theme of substation automation. All the aforementioned studies have enhanced detection performance, with the majority achieving a detection accuracy (mAP@0.5) exceeding 90%. Nevertheless, there are underlying issues that warrant further attention and resolution. In practical applications, there is a desire for the algorithm complexity (Params, FLOPs) to strike a good balance while ensuring the detection accuracy of the algorithm. Unfortunately, many studies do not provide explanations about the complexity of the algorithm, creating hindrances to its practical application and deployment. In this paper, the complexity of the algorithm is explained, kept at a low level, and the detection accuracy is improved, addressing the following two problems:
(1)
There is the challenge of high similarity between classes because the main structure of different substation equipment is often similar, which can lead to false detection.
(2)
The scale of substation equipment in infrared images varies greatly because of the different sizes of substation equipment and the shooting distance. Insufficient extraction of multi-scale information will result in missing detection.
Aiming at the above problems, this paper proposes an infrared image object detection algorithm for substation equipment based on an improved YOLOv8n, which can effectively improve the accuracy of substation equipment detection. The unique contributions of this paper are as follows:
(1)
To solve the problem of false detection caused by high similarity between different classes of substation equipment, a DCNC2f module was established with deformable convolution to improve the feature extraction capability of the model, and to enhance the integrity and effectiveness of the extracted features. The degree of differentiation between the features of different devices is increased, alleviating the problem of false detection.
(2)
Aiming at the missing detection caused by the scale change in the substation equipment in infrared images, a multi-scale attention mechanism is introduced to improve the detection ability of the model for multi-scale equipment and reduce the occurrence of missing detection.
(3)
The proposed algorithm is compared with other advanced object detection algorithms, demonstrating superior performance in detecting substation equipment in infrared images.

2. Materials and Methods

2.1. The Principle of YOLOv8

YOLOv8 is an optimized algorithm based on YOLOv5, which currently supports multiple tasks in object detection, image classification, and instance segmentation [25]. YOLOv8 comprises three main components: the backbone network, the neck network, and the head network. The YOLOv8n structural diagram is shown in Figure 1.
The backbone network comprises the CBS module, the C2f module, and the SPPF module. The CBS module integrates convolution, batch normalization, and SiLU activation functions to aid in down-sampling and feature extraction. Inspired by the ELAN module of YOLOv7, the C2f module utilizes the bottleneck module to extract features and then concatenates these features to generate more comprehensive feature representations. The SPPF module initially employs 1 × 1 Conv to reduce the feature map dimension, followed by three maximum pooling operations for features at various scales. Subsequently, the results are merged to achieve the fusion of local and global features.
The neck network is responsible for processing the feature maps extracted by the backbone at different scales. The left branch fuses the high features into the shallow features through a top–down approach, while the right branch transmits the more accurate position signals from the shallow layer of the network into the deep features through the introduction of a bottom–up path. This structure achieves the fusion and complementation of deep and shallow features and enhances the integrity of the features.
The head network employs a decoupled head structure, which consists of three detection layers with different-sized feature maps. Each detection layer is equipped with two branches, respectively, for object classification and target detection. The object classification is measured by varifocal loss, and the target detection is measured by CIoU and distributed focus loss. This design allows for more accurate detection by leveraging multiple scales and branches for predicting both the targets and their corresponding categories.
At present, YOLO series algorithms are the mainstream object detection algorithms, among which YOLOv5, YOLOv7 [26], YOLOv8, and YOLOv9 [27] are more typical algorithms. However, the YOLOv5 algorithm is inferior to YOLOv8 in terms of detection accuracy. YOLOv7 and YOLOv9 require more computing resources than YOLOv8. In this paper, YOLOv8 is selected as the baseline model for the research into substation equipment detection.

2.2. Improved YOLOv8 Algorithm

At present, there are many improved versions of the object detection algorithm YOLOv8. Hao et al. [28] introduced a transformer into the YOLOv8 backbone, replaced the neck with an attention-directed bidirectional feature pyramid network, and used RIoU to improve the loss function. This improved target detection algorithm has a better detection effect on the remote sensing of small targets than YOLOv8. Wang et al. [29] introduced BiFormer and the focal FasterNet into YOLOv8 to upgrade the backbone and introduced Wise-IoUv3 to achieve better results in object detection of UAV aerial shooting scenes. Yang et al. [30] replaced part of the C2f module with an LW-Swin transformer in the neck part and proposed the LS-YOLOv8s model, which has a better detection effect than YOLOv8 in strawberry ripeness detection. All these variant algorithms have improved YOLOv8 structurally and obtained better results than YOLOv8 in their respective application scenarios. However, similar experiments and applications are lacking in infrared image detection of substation equipment. Therefore, a unique upgraded version of the YOLOv8 algorithm should be designed for the application of infrared image object detection of substation equipment.
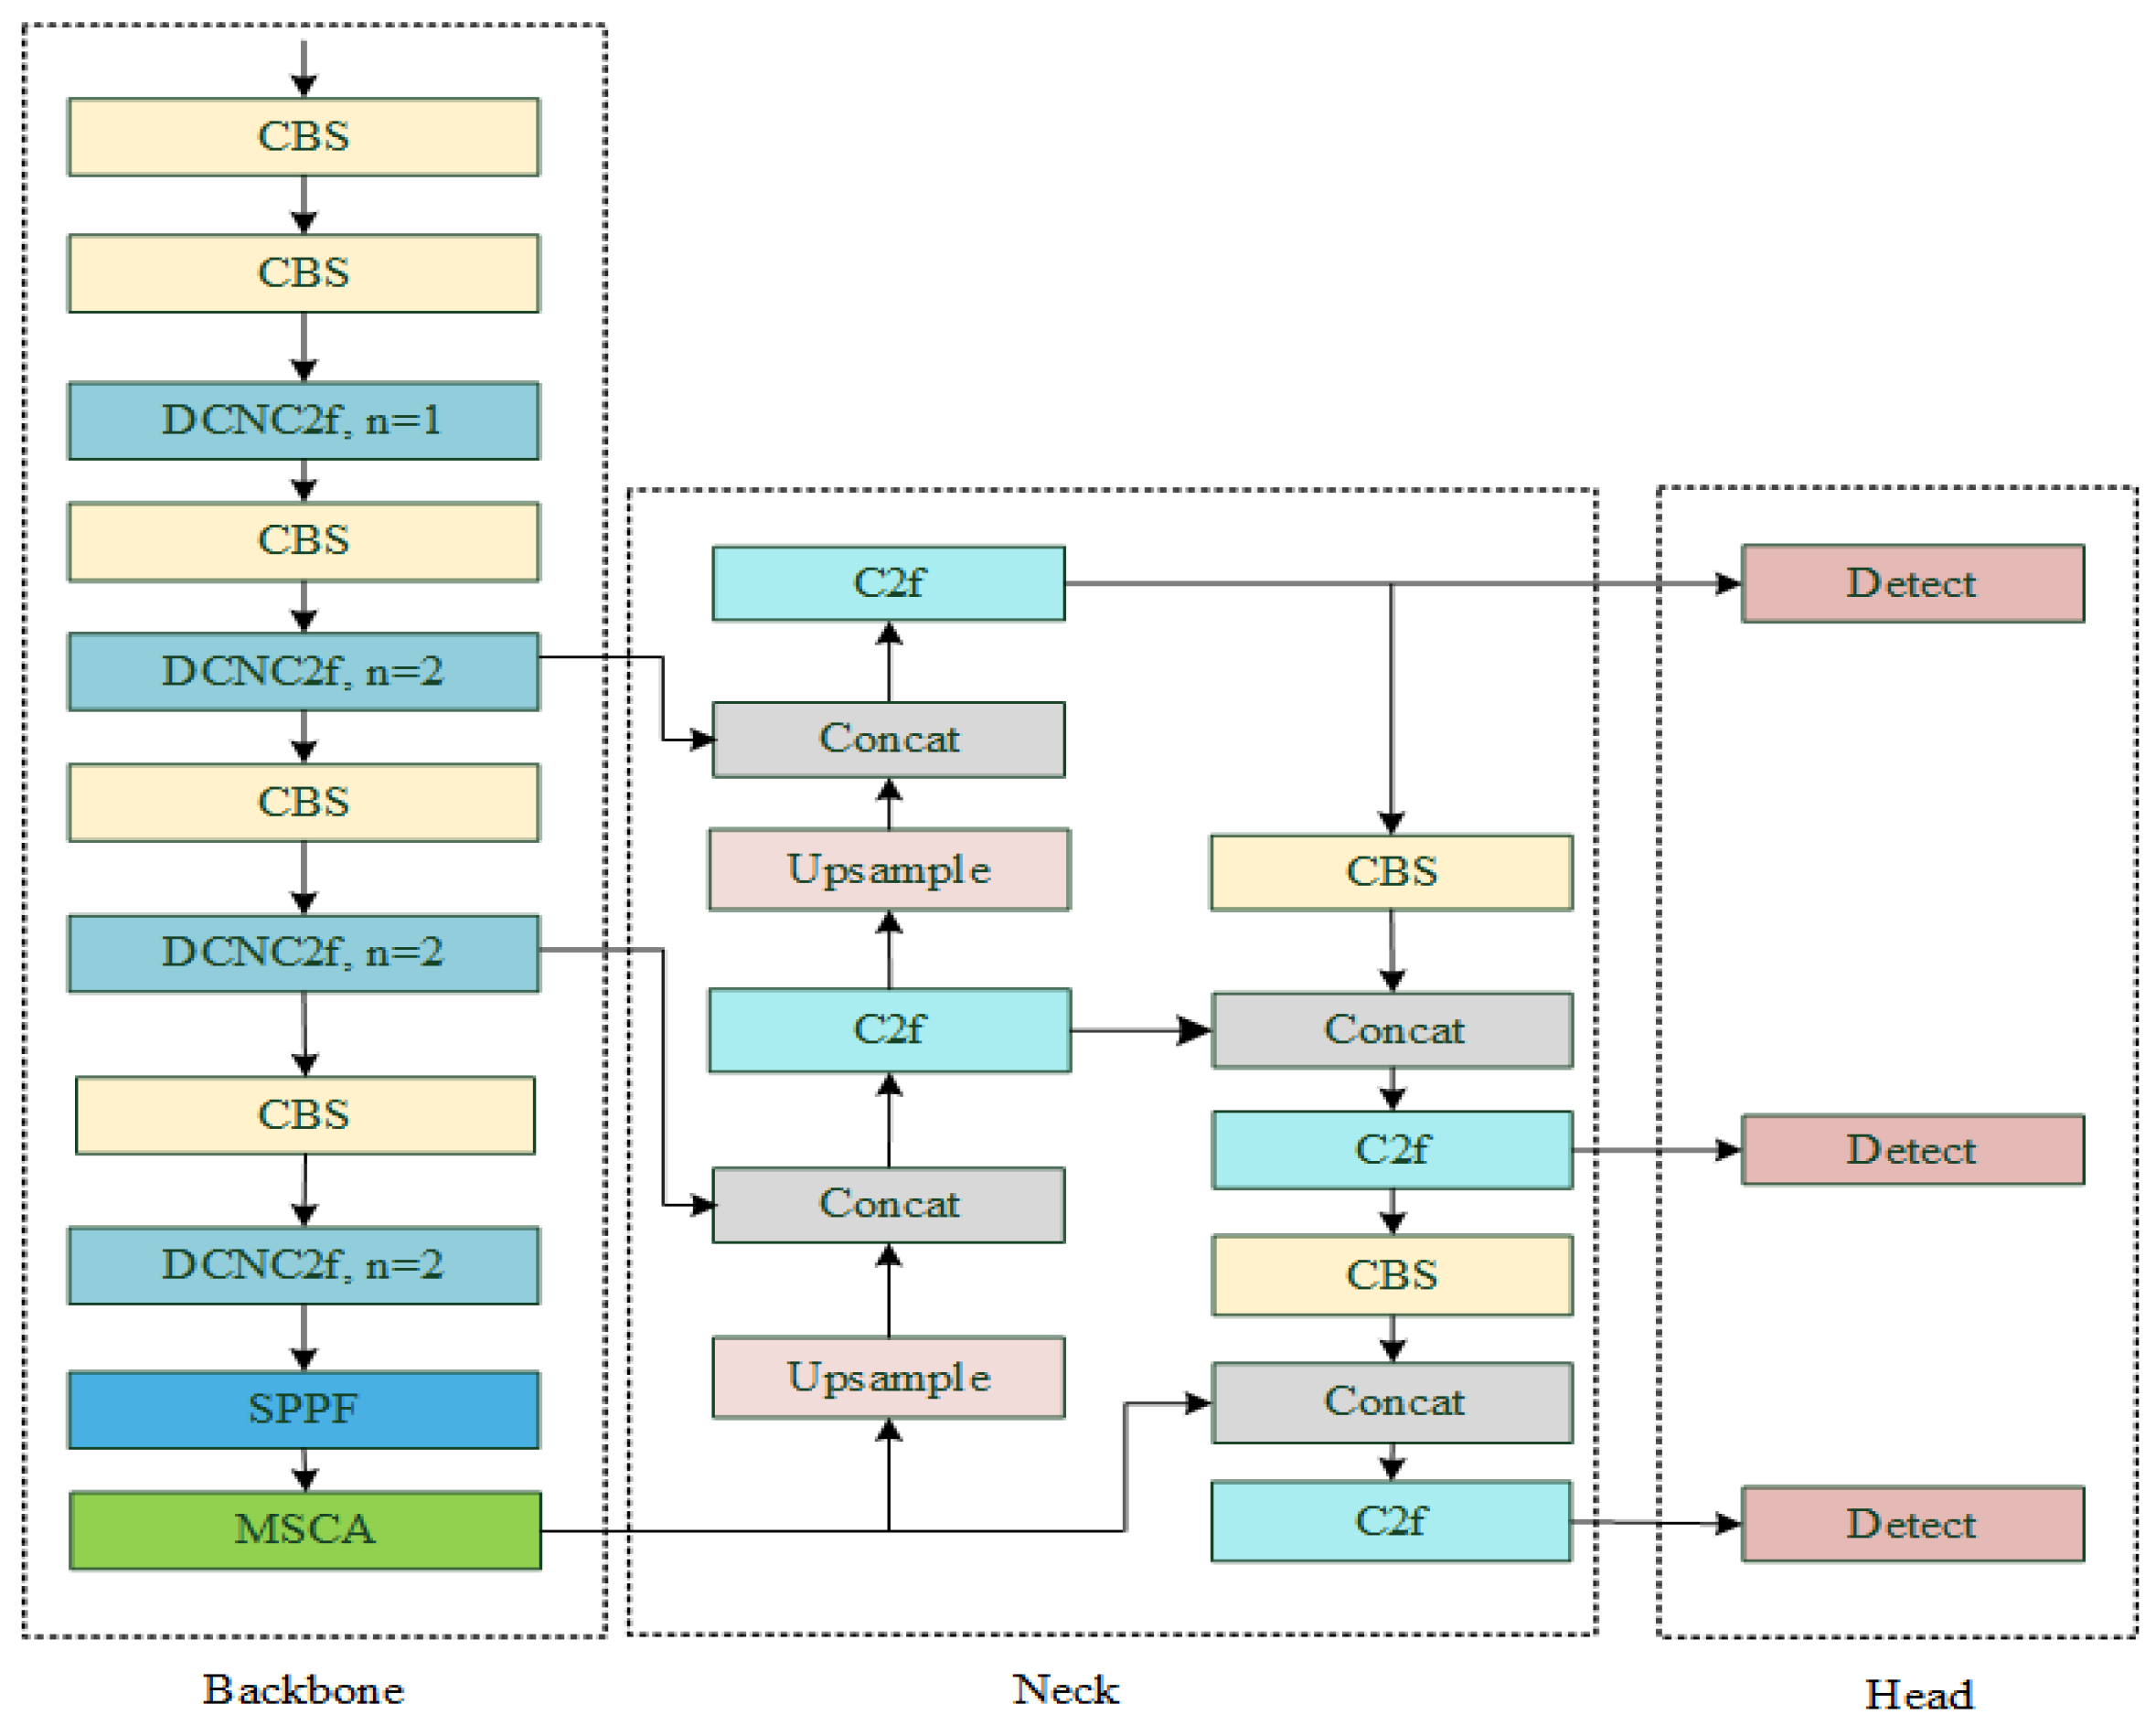
Due to the presence of complex backgrounds, high inter-class similarity, and significant scale variations in infrared images of substation equipment, YOLOv8n faces challenges such as missed detection, false detection, and low accuracy. To address the aforementioned challenges, this paper proposes improvements to YOLOv8n. Initially, deformable convolution is incorporated to create a DCNC2f module, which replaces all the C2f modules in the backbone with the upgraded DCNC2f module. This enhancement is designed to enhance the model’s capability to extract target features, thereby improving its ability to recognize highly similar devices. Furthermore, the proposed approach strengthens the extraction of multi-scale information by incorporating the multi-scale convolutional attention mechanism behind the SPPF module. This mechanism enhances the ability of the model to capture features at different scales, thereby improving its detection accuracy for substation equipment. Moreover, this mechanism enhances the strip feature extraction capability tailored for strip substation equipment, thereby further improving the model’s accuracy in detecting this specific type of equipment. The structure of the improved YOLOv8n model is illustrated in Figure 2.
The detailed operational process of the enhanced YOLOv8n is outlined as follows: Initially, the infrared image of the equipment, sized at 640 × 640, is input into the backbone network. Subsequently, a feature map of 320 × 320 is derived after down-sampling by the CBS module. Then, a CBS module and n DCNC2f modules are used for down-sampling and feature extraction, and the process is repeated four times to obtain feature maps with the sizes of 160 × 160, 80 × 80, 40 × 40, and 20 × 20, respectively. Upon entering the 20 × 20 feature map into the SPPF module, a feature map with enriched semantic features is obtained through pooling and feature fusion. Subsequently, an MSCA module is incorporated to enhance the extraction of multi-scale information, completing the feature extraction process. The feature maps of sizes 20 × 20, 40 × 40, and 80 × 80 extracted by the backbone are then forwarded to the neck for the fusion of feature information at different scales. The 20 × 20 feature map is upsampled to generate a 40 × 40 feature map. This feature map is then fused with the 40 × 40 feature map extracted by the backbone. The C2f module is used to enhance the feature representation capability. After that, the feature map is again upsampled to obtain a feature map of size 80 × 80, which is fused with the backbone-extracted feature map of size 80 × 80 and sent to the C2f module to further enhance the feature representation capability. The above process completes the top–down fusion of multi-scale features. Similarly, the feature fusion from bottom to top is accomplished through the right branch of the neck. Finally, three output branches of the neck are sent to the detection head for loss calculation and result prediction.

2.2.1. Improvement of the C2f Module

To address the issue of high similarity between classes of substation equipment and the potential false detection caused by insufficient feature extraction [31], this paper proposes the integration of deformable convolution in constructing a DCNC2f module to replace the C2f module in the backbone stage. This enhancement effectively improves the feature extraction capability of the model. Traditional convolutional operations have fixed sizes and shapes for the receptive field when extracting target features [32]. This limitation prevents the full extraction of features from devices with irregular contour shapes. In contrast, deformable convolution [33] introduces additional bias to flexibly adjust the shape and size of the receptive field. As a result, the extracted features can more accurately match the real shape and size of the target device, leading to its improved representation.
Deformable convolution introduces an offset to the conventional convolution calculation to extract more pertinent features and expand the receptive field. The formula for deformable convolution is as follows:
y ( p 0 ) = n = 1 N w ( p n ) x ( p 0 + p n + Δ p n )
where x and y are the input feature map and output feature map, respectively, N and n are the total numbers of sampling points and sampling position points, p 0 is the current position of the output feature map, p n and w ( p n ) are the nth sampling position and its corresponding weight, respectively, and Δ p n is the offset corresponding to the nth position.
However, the above version of deformable convolution has the problem that the receptive field exceeds the target range. To solve this problem, Zhu et al. proposed deformable convolution DCNv2 [34], which reduces the extraction of irrelevant regional features and strengthens the target-related feature extraction capability. Its formula is:
y ( p 0 ) = n = 1 N w ( p n ) x ( p 0 + p n + Δ p n ) Δ m n
where Δ m n is the modulation scalar at the nth position, taking values in the range [0, 1].
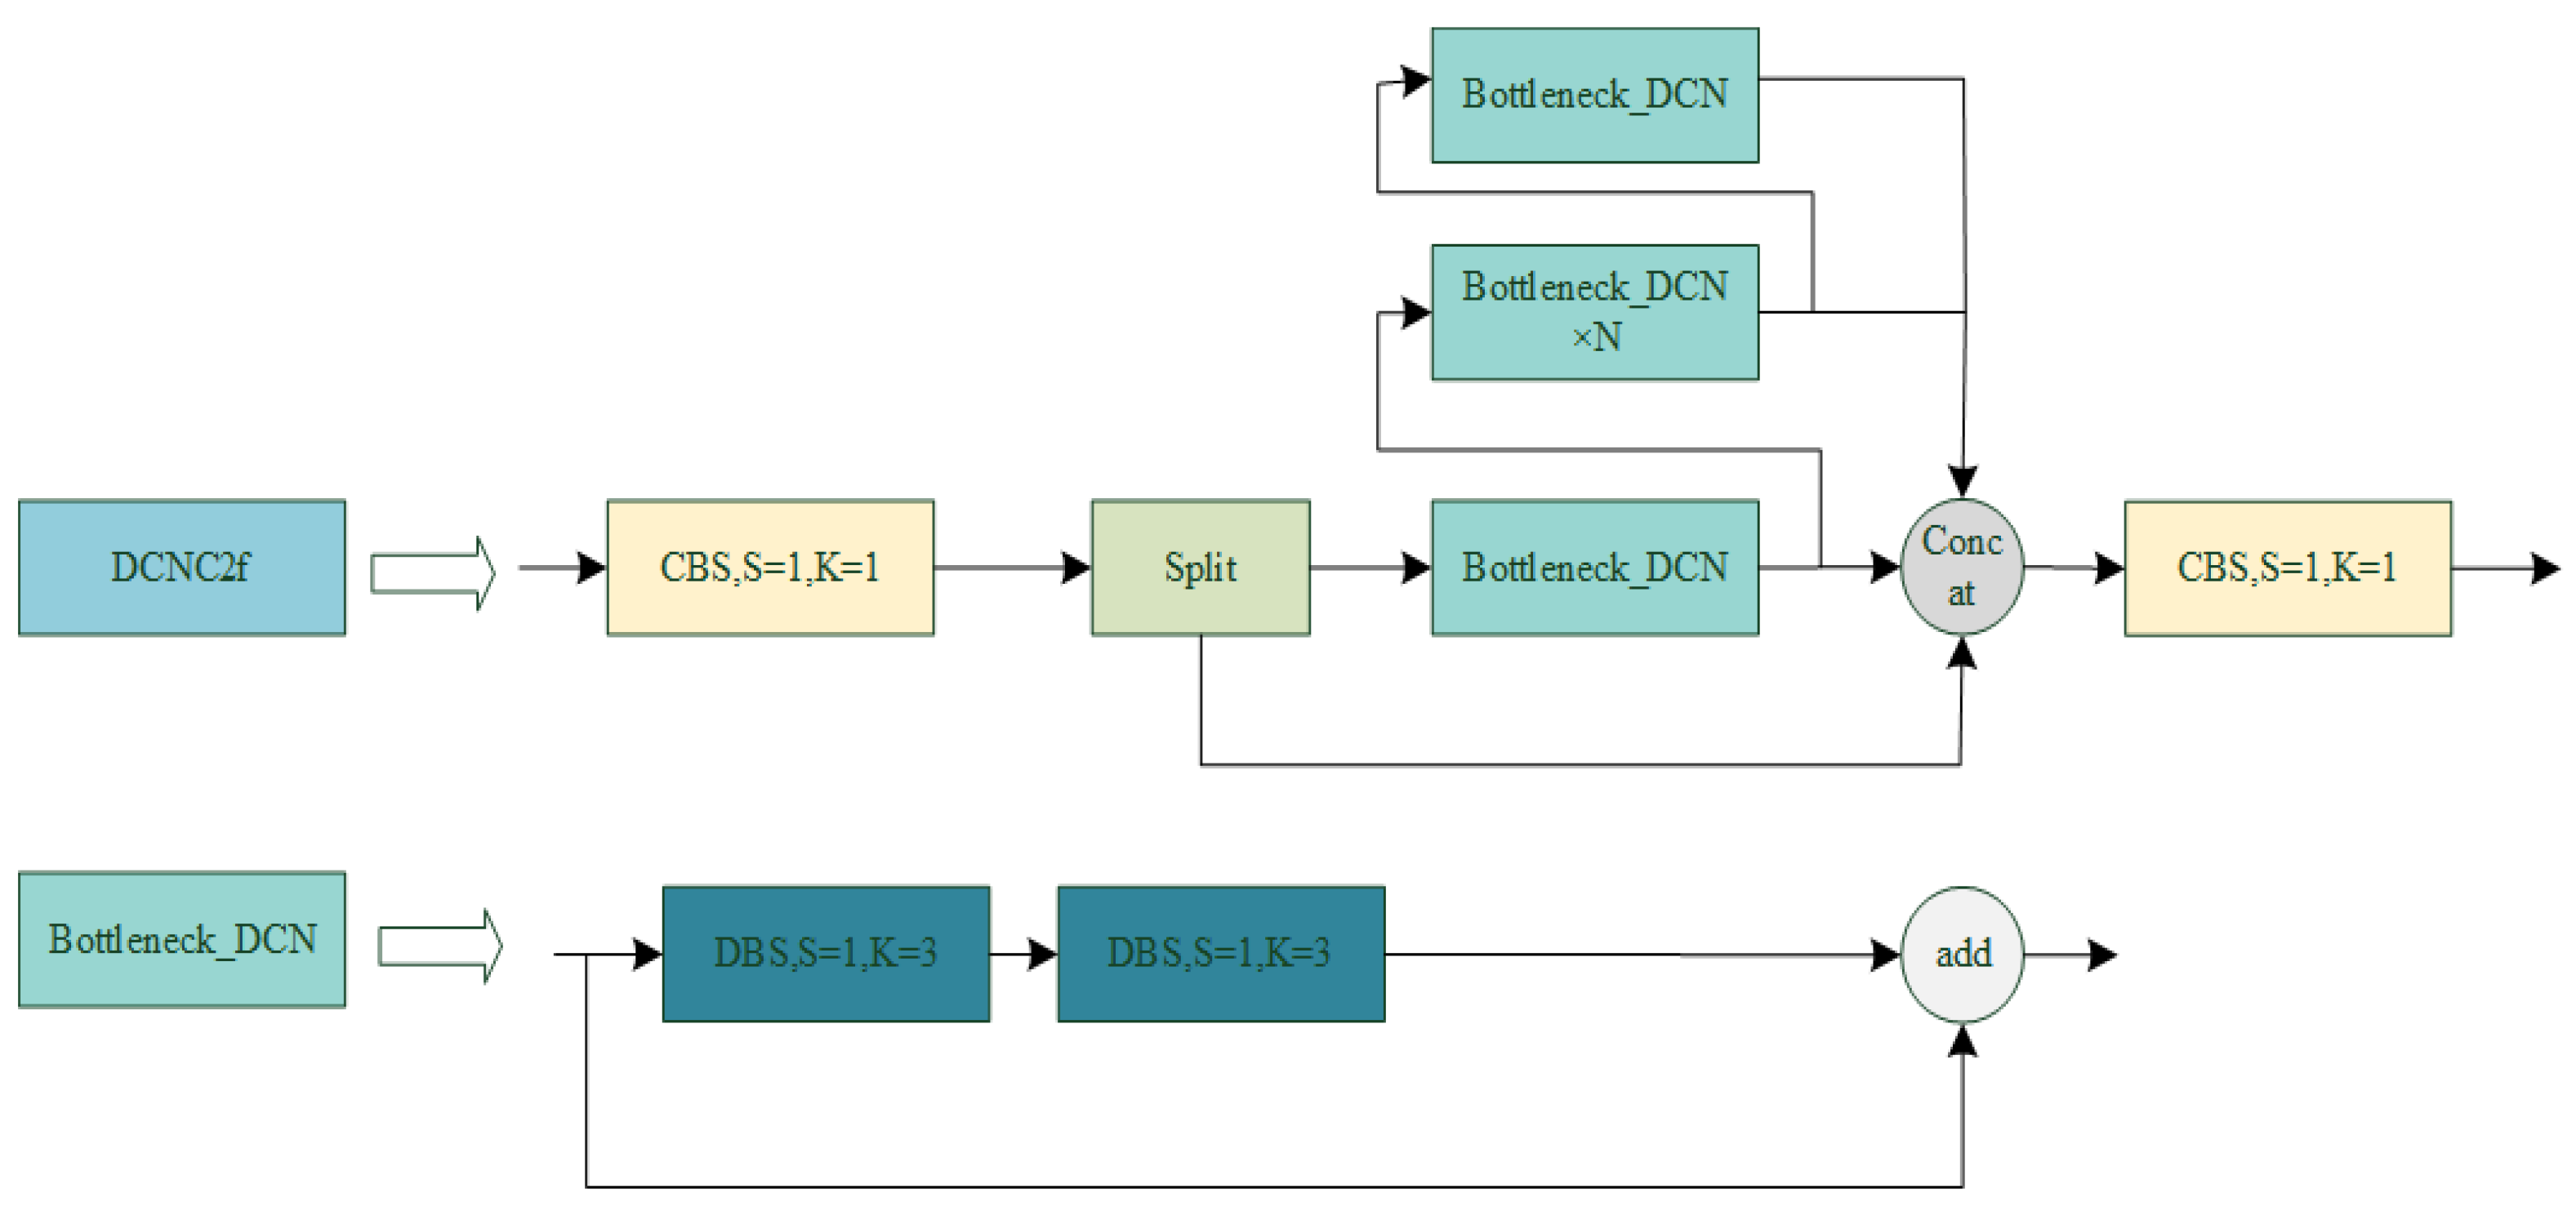
Replacing the standard convolution in the bottleneck of the C2f module with DCNv2 to form the DCNC2f module, and subsequently upgrading all the C2f modules in the backbone to DCNC2f, can enhance the ability of the model to extract features from the device. This enhancement leads to the extraction of more relevant features, thereby increasing the differentiation between different features of various devices. The implementation process of the DCNC2f is as follows:
y 0 , 1 = Split ( SilU ( BN ( Conv ( x ) ) ) )
First, the input image, x, is aggregated by convolution, BatchNorm, and the SiLU activation function, and then split into y 0 and y 1 in the channel dimension.
B D ( f ) = SilU ( BN ( DCNv 2 ( SilU ( BN ( Dcnv 2 ( f ) ) ) ) ) ) f { y 2 = B D ( y 1 ) y 3 = B D ( y 2 ) y n = B D ( y n 1 )
Then, y 1 is sent to the n bottleneck for further feature extraction. The feature extraction process of the bottleneck is reduced to function BD (f), and the input f is added to itself after two DCNV2-BatchNorm-SiLU operations; DCNV2 has a stronger feature extraction ability than Conv, so the introduction of DCNV2 enhances the feature extraction ability of the model. In addition, n is the setting parameter, and it can be seen from the DCNC2f module in Figure 2.
y = Silu ( BN ( Conv ( Concat ( y 0 , y 1 , y 2 , , y n ) )
Finally, { y 0 , y 1 ,..., y n } is connected, and the final output feature graph, y, is obtained by aggregating the information through Conv-BatchNorm-SiLU.
The structure of the DCNC2f module is depicted in Figure 3.

2.2.2. Multi-Scale Convolutional Attention

To mitigate the issue of missed detection caused by the significant scale variation in substation equipment, a multi-scale convolutional attention (MSCA) mechanism [35] is introduced to capture more effective multi-scale information and enhance the feature expression capability. This improvement aims to enhance detection accuracy in multi-scale targets.
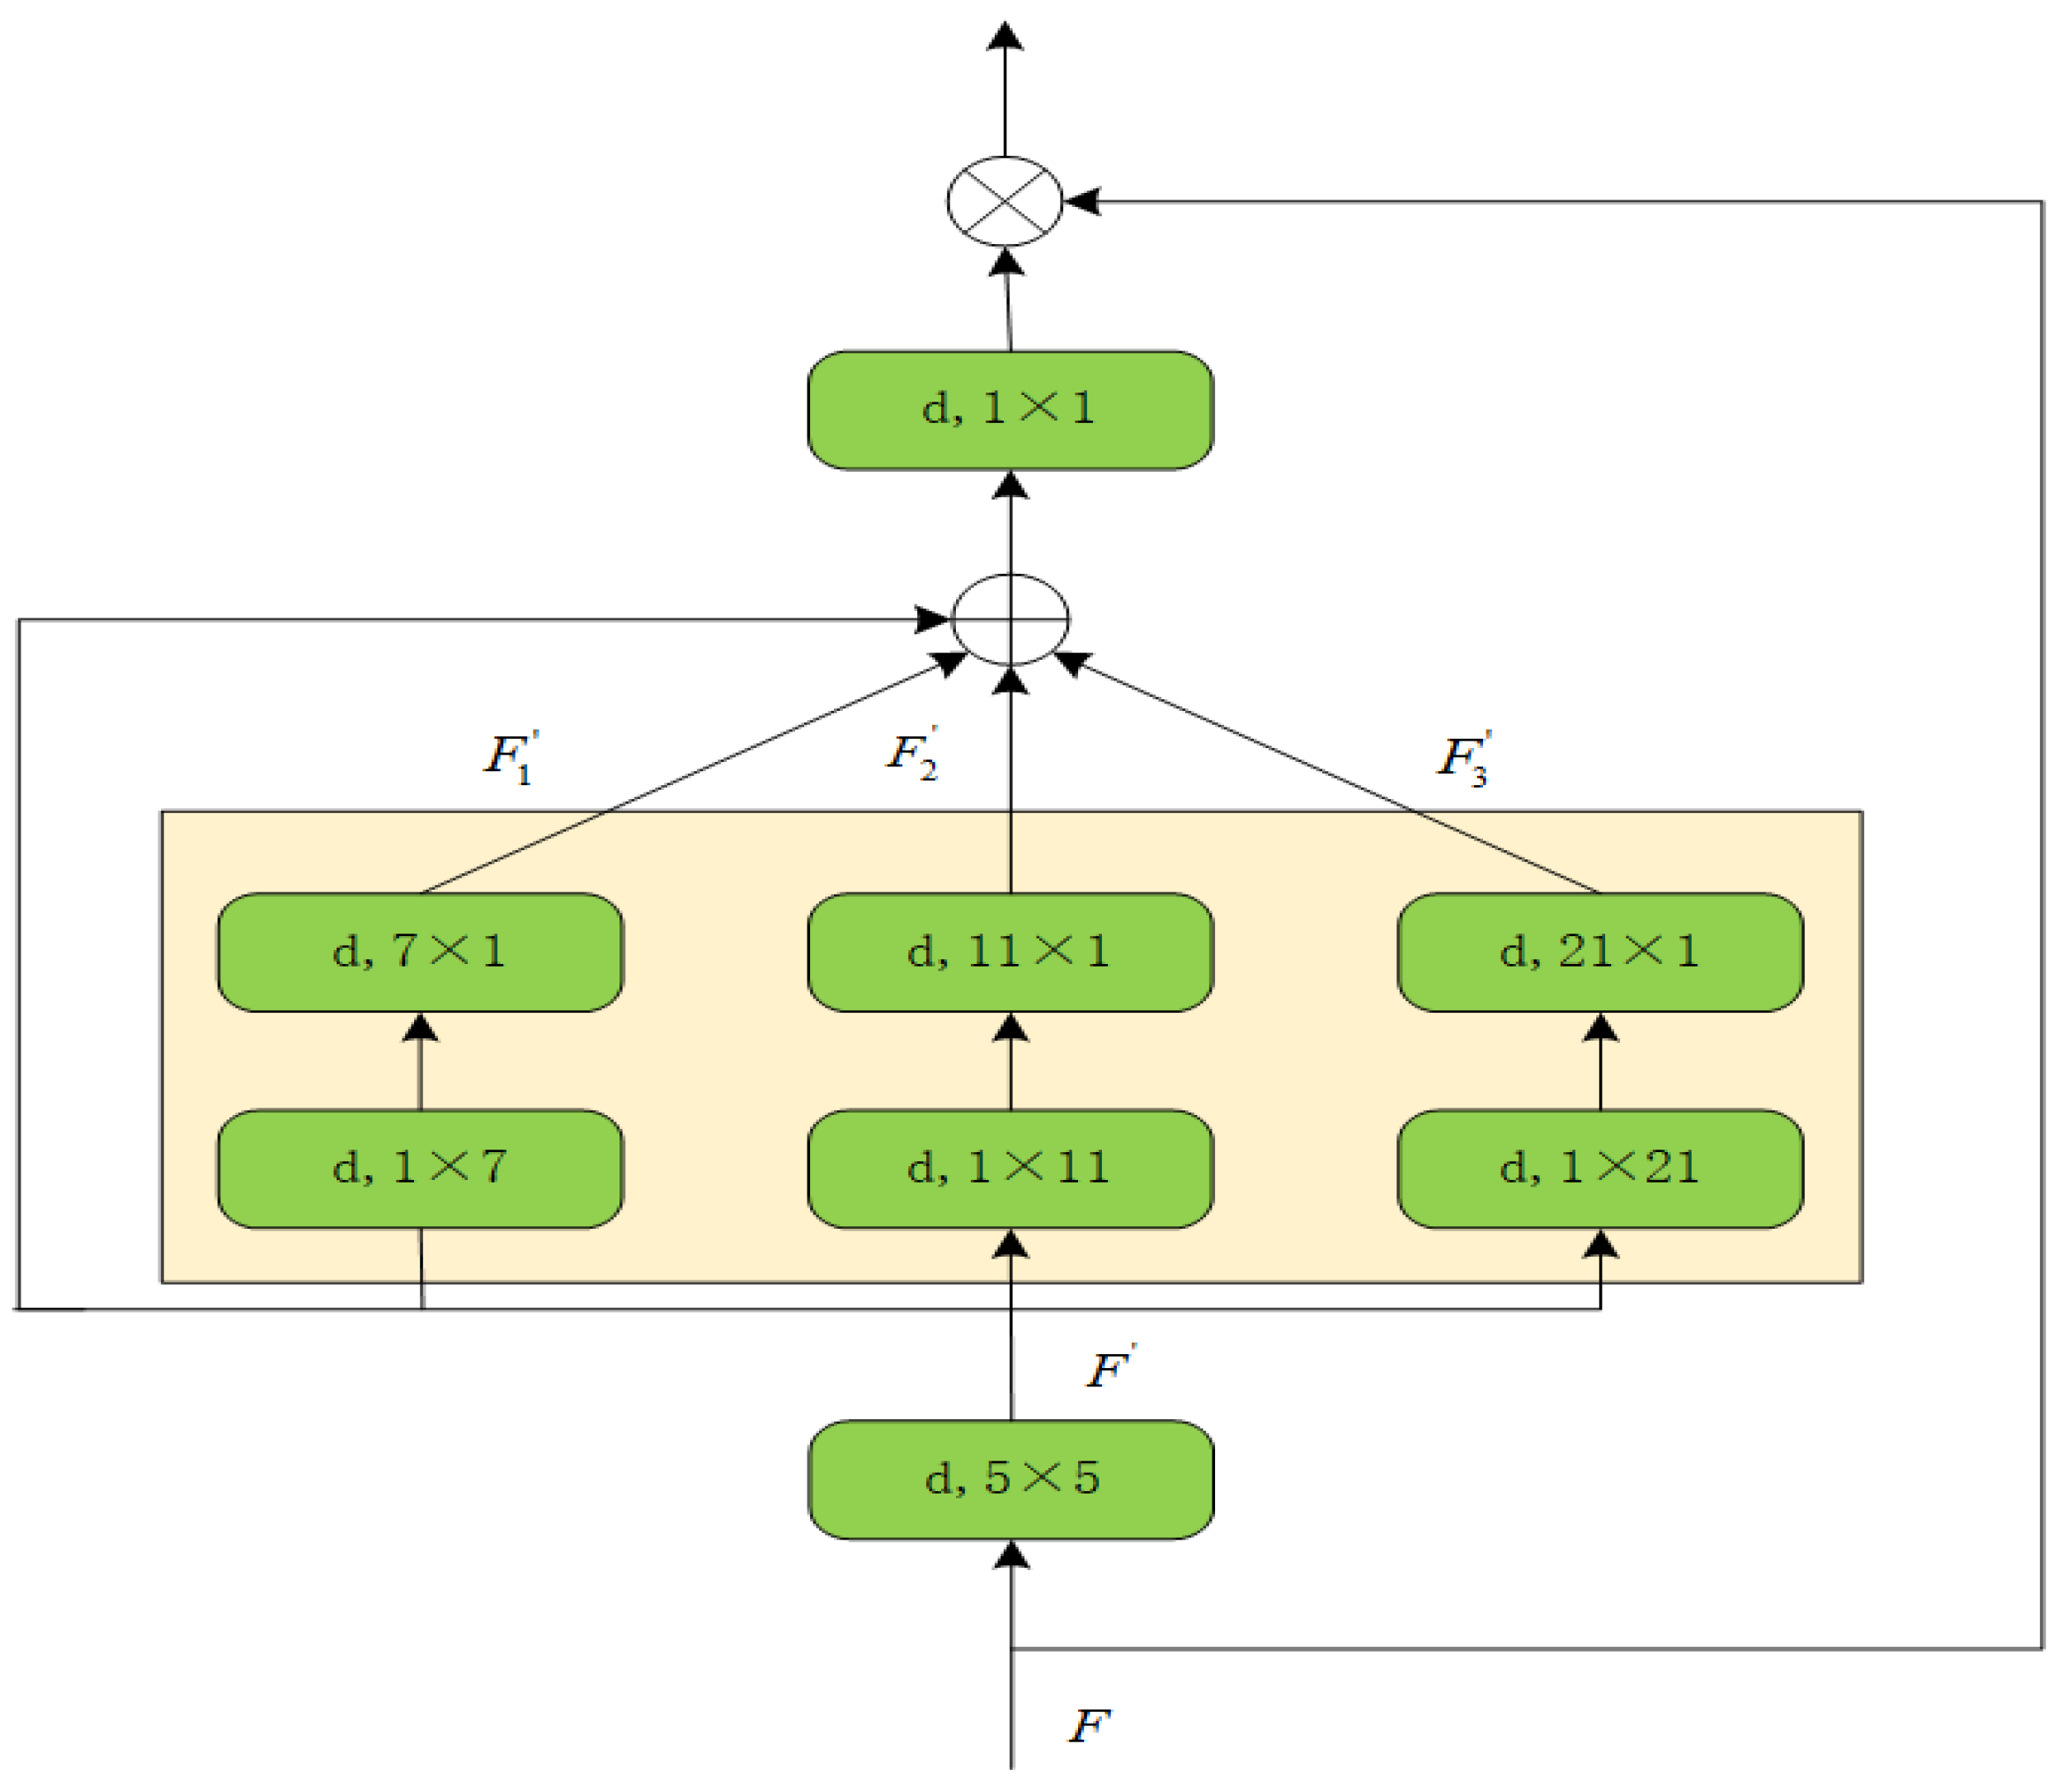
The MSCA mechanism primarily consolidates local information through a deep convolutional module, then utilizes a multi-branch deep convolutional module to capture multi-scale information, and finally employs a 1 × 1 convolutional module to represent the relationship between different channels. The mathematical formula for the MSCA is as follows:
A t t = Conv 1 × 1 ( i = 0 3 Scale i ( DW - Conv ( F ) ) F = A t t F
where F is the input feature map, Att and F are the attention weight and output, respectively, DW-Conv represents the deep convolution operation, Scale i indicates the i-th branch, Scale 0 is an identity connection, and the remaining three branches are depthwise separable convolutions. Conv 1 × 1 represents 1 × 1 convolution. ⊗ is element-by-element matrix multiplication.
Firstly, the input feature, F, undergoes a depthwise convolution with a 5 × 5 convolutional kernel for local information aggregation. This operation helps capture the local structure and detailed features, resulting in the generation of the feature map, F .
Secondly, the feature map, F , undergoes multi-scale context information extraction using a multi-branch depth strip convolution structure. This process generates multi-scale feature maps F 1 , F 2 , and F 3 . The multi-branch depthwise convolutional structure employs three different sizes of depth-separable convolutional kernels, specifically 21 × 21, 11 × 11, and 7 × 7, to capture feature information at different scales, respectively. Each of the three convolutional kernels is decomposed into two strip convolutional kernels. For example, a 21 × 21 convolutional kernel is decomposed into 1 × 21 and 21 × 1 convolutional kernels. The strip convolutional kernel serves the dual purpose of extracting the strip features and reducing the computational load. Lastly, the feature maps of the three different scales and feature, F, are summed and superimposed before information aggregation by 1 × 1 convolution. The output of the convolution is then utilized as the attention weights to reweight the input F, thereby extracting multi-scale information and enhancing the feature expression capability. The structure of the MSCA is depicted in Figure 4.

3. Experimental Results and Analysis

The dataset utilized for the experiment comprises five types of substation equipment: insulators, bushings, lightning arresters, current transformers, and voltage transformers, totaling 1519 substation equipment images. The dataset is divided into a training set with 1064 images, a validation set with 227 images, and a test set with 228 images. An example of five types of transformer equipment is shown in Figure 5.
In the experimental process, the input image size set in this paper is 640 × 640, the training batch size is 4, and the training period spans a total of 100 epochs. The model is optimized using the SGD optimizer, with the initial learning rate set to 0.01, the momentum set to 0.937, and the weight decay rate set to 0.0005. The parameters of the experimental platform are detailed in Table 1.

3.1. Evaluation Indicators

The experiments utilize mean average precision (mAP), number of model parameters (Params), and floating point of operations (FLOPs) as evaluation metrics for assessing object detection performance. Mean average precision is calculated based on precision (P) and recall (R), as follows:
P = T P T P + F P × 100 %
R = T P T P + F N × 100 %
A P = 0 1 P ( R ) d R
m A P = 1 n i = 1 n A P ( i ) × 100 %
In the evaluation metrics formula, n represents the number of categories, TP represents the number of successfully detected targets, FP represents the number of incorrectly detected targets, and FN represents the number of correct targets not detected.
Specifically, mAP@0.5 calculates the average precision (AP) for each class at an IoU of 0.5 and then computes the average of these AP values. On the other hand, mAP@0.5:0.95 calculates the average mAP across different IoU thresholds ranging from 0.5 to 0.95, with a step size of 0.05.

3.2. Ablation Experiments

To validate the effectiveness of the proposed improvement scheme, this section conducts a series of ablation experiments to verify the impact of the DCNC2f module and the MSCA module, respectively, using YOLOv8n as the baseline. The experimental results are presented in Table 2.
From the experimental results presented in Table 2, it can be observed that after upgrading the C2f module to the DCNC2f module in YOLOv8n, there is a 1.5% increase in mAP@0.5 and a 3.5% increase in mAP@0.5:0.95 in terms of detection accuracy. Additionally, in terms of algorithmic complexity, a 0.17 M increase in Params implies that the spatial complexity of the algorithm increases, whereas a 0.4 G reduction in FLOPs suggests that the computational complexity of the algorithm decreases. The incorporation of deformable convolutions enhances the ability of the model to extract relevant features and reduces the issue of false detection caused by the high similarity between different classes of substation equipment.
By incorporating the MSCA module alone into the baseline model, there was an enhancement in the capability of the model to extract multi-scale feature information and improve the representation of important features. This improvement strategy resulted in a 1.4% increase in mAP@0.5 and a 2.9% increase in mAP@0.5:0.95, which means that the model has a stronger ability to detect objects.
After incorporating the two enhanced strategies into the improved YOLOv8n, compared to the baseline model YOLOv8n, there is a 2.6% increase in mAP@0.5 and a 3.9% increase in mAP@0.5:0.95. This means that the improved YOLOv8n in the paper has a more powerful capability to detect objects, and the improved YOLOv8 can detect and identify target devices from infrared images more accurately. Additionally, the 0.4 G reduction in FLOPs means that the computational complexity of the model is reduced, signifying an improvement in the computational efficiency of the model. The 0.26 M increase in Params indicates a slight increase in the spatial complexity of the model, which theoretically results in higher demands on GPU memory during training. The primary task in the detection of substation equipment is to enhance the detection accuracy, and Params and FLOPs need to maintain a relatively balanced value, thus, a minor increase in Params is acceptable. In conclusion, the improved algorithm proposed in this paper is effective, which effectively improves the accuracy of substation equipment detection and has reference value for the development of online detection tasks for substation equipment.
To verify the statistical significance of the improved results, the minimum confidence thresholds were set to 0.001, 0.01, 0.1, and 0.5, respectively, and the experiments and analyses were carried out at different confidence intervals. The experimental results are shown in Table 3. In all subsequent tables, “Ours” indicates the improved YOLOv8n.
In Table 3, with a minimum confidence threshold of 0.001, the proposed algorithm exhibits an increase of 2.6% in mAP@0.50 and 3.6% in mAP@0.50:0.95 compared to the baseline model. When the minimum confidence threshold is set to 0.01, the proposed algorithm shows an increase of 2.6% in mAP@0.50 and 3.9% in mAP@0.50:0.95. Similarly, for a minimum confidence threshold of 0.1, the proposed algorithm achieves a 2.5% increase in mAP@0.50 and 3.0% in mAP@0.50:0.95. Furthermore, at a minimum confidence threshold of 0.5, the proposed algorithm demonstrates a 4.4% increase in mAP@0.50 and a 4.0% increase in mAP@0.50:0.95 compared to the baseline model. These results indicate the effectiveness of the proposed algorithm across various confidence intervals, underscoring its validity and improvement.

3.3. Comparative Experiments

In this subsection, a series of comparison experiments are conducted with the current mainstream object detection algorithms to further verify the effectiveness and advancement of the proposed algorithm. The main comparison algorithms include YOLOv5n, YOLOv7-tiny, YOLOv8n, YOLOv9, the literature [13], the literature [24], and YOLOv10n [36]. The experimental results are presented in Table 4.
The following conclusions can be derived from the analysis presented in Table 4. Compared to YOLOv5n, the proposed algorithm in this paper achieves a 6.7% improvement in mAP@0.5 and a 12.1% improvement in mAP@0.5:0.95, demonstrating significant advantages in detection accuracy. Compared with YOLOv7-tiny, the proposed algorithm achieved a 7.0% and 13.8% increase in mAP@0.5 and mAP@0.5:0.95, with a reduction of 2.76 M Params and 5.3 G FLOPs. The detection accuracy of YOLOv7-tiny was lower than that of the proposed algorithm, while the model complexity was much higher. Compared with YOLOv9, the proposed algorithm demonstrates a 2.1% advantage in mAP@0.5 and a 0.9% advantage in mAP@0.5:0.95. The Params and FLOPs decreased by 57.24 M and 256.1 G, respectively. Overall, the proposed algorithm exhibits higher accuracy and lower complexity in substation equipment detection compared to YOLOv9. Compared with YOLOv8n, the mAP@0.5 and mAP@0.5:0.95 of the proposed algorithm improve by 2.6% and 3.9%, respectively, while maintaining similar model complexity. In comparison to the latest algorithm, YOLOv10n, mAP@0.50 and mAP@0.50:0.95 of YOLOv10n are 11.0% and 12.9% lower than the algorithms proposed in this paper, indicating that YOLOv10n is not suitable for target detection in infrared images of substation equipment.
Furthermore, the proposed algorithm is compared with existing substation equipment detection algorithms. In comparison to the enhanced YOLOv7-tiny algorithm proposed in the literature [13], the proposed algorithm achieves significantly higher detection accuracy, with mAP@0.5 and mAP@0.5:0.95 being 9.5% and 20.9% higher, respectively. The proposed algorithm exhibits reduced algorithm complexity, with Params and FLOPs decreased by 1.24 M and 5 G, respectively. The overall complexity of the proposed algorithm is lower. Compared to the enhanced YOLOv8s algorithm proposed in the literature [24], the proposed algorithm demonstrates advantages of 1.5% and 1.8% in mAP@0.5 and mAP@0.5:0.95, respectively. Additionally, the Params and FLOPs decrease by 7.37 M and 28.9 G. The detection accuracy and complexity of the proposed algorithm are superior to those of the literature [24]. In comparison to these two algorithms, the proposed algorithm not only outperforms them in terms of detection accuracy but also exhibits lower algorithm complexity, rendering it more suitable for practical applications.
In summary, the algorithm proposed in this paper is advanced in infrared image target detection in substation equipment.

3.4. Visualisation of the Results of Different Methods

To further validate the effectiveness and advancement of the algorithm proposed in this paper, this subsection visualizes the detection results of YOLOv5n, YOLOv7-tiny, YOLOv8n, YOLOv9, YOLOv10n, the literature [13], the literature [24], and the algorithm presented in this paper.
Figure 6 shows the detection results of various algorithms on insulators. YOLOv5n, YOLOV9, YOLOv10n, the literature [13], the literature [24], and YOLOv8n all miss one insulator, whereas the proposed algorithm achieves accurate detection of all the insulators in the infrared images.
As shown in Figure 7, in the detection of voltage transformers, YOLOv7-tiny, YOLOv9, YOLOv10n, the literature [13], the literature [24], and YOLOv8n display missed detection phenomena, while the proposed algorithm successfully detects all the voltage transformers in the image.
As shown in Figure 8, when the distinction between the arrester and the background is very low, YOLOv9 and YOLOv8n detect part of the lightning arrester structure as an insulator. YOLOv5, YOLOv7-tiny, YOLOv10n, and the literature [13] did not detect a lightning arrester in the infrared image. However, the algorithm proposed in this paper achieves the correct detection results and has high confidence.
Figure 9 shows the detection results of bushing by various algorithms. YOLOv7-tiny, YOLOv9, YOLOv10n, the literature [13], and YOLOv8n produce false detection. In addition, YOLOv5n and the literature [24] fail to detect the target device. Conversely, the proposed algorithm achieves the correct detection of the target device.
As shown in Figure 10, for current transformer detection, YOLOv10n, the literature [13], and YOLOv8n encounter missed detection problems, whereas the algorithm proposed in this paper successfully detects all the target devices in the infrared image with the highest confidence level.

4. Conclusions

This paper presents an infrared image detection algorithm based on an improved YOLOv8n for substation equipment detection in infrared images. The algorithm incorporates the DCNv2 module into the C2f module in the backbone to enhance the feature extraction capability of the network. Additionally, the MSCA module is added after the SPPF module to improve the detection performance of the model for multi-scale targets. The experiments were conducted on an infrared image dataset of substation equipment, resulting in a mAP@0.5 of 92.7% and a mAP@0.5:0.95 of 68.5% for the proposed improved YOLOv8n algorithm. Compared to the baseline model, there was a 2.6% and 3.9% improvement in mAP@0.5 and mAP@0.5:0.95. The Params of the improved YOLOv8n algorithm was 3.26 M, an increase of 0.26 M compared with the baseline model, and the FLOPs was 7.8 G, a decrease of 0.4 G compared with the baseline model. This algorithm surpasses the baseline model and several mainstream detection algorithms in terms of detection accuracy while maintaining relatively low algorithm complexity. These attributes collectively offer a novel approach for detecting substation equipment in infrared images. In practical application and deployment, it is generally desired for the model to have a small number of parameters and low computational complexity to minimize hardware requirements. The algorithm proposed in this paper requires further research and improvement. While maintaining the accuracy of the model, future research will focus on reducing the number of model parameters and computational workload to minimize the demand for computing resources, thus further enhancing its practical applicability.

Author Contributions

Conceptualization, S.X., Z.C., B.L., and Z.Z.; methodology, S.X., Z.C., and Z.Z.; software, S.X., X.L., and X.D.; validation, L.L. and X.L.; formal analysis, Y.M. and L.L.; investigation, S.X., Y.M., and L.L.; resources, X.L. and B.L.; data curation, S.X. and Z.C.; writing—original draft preparation, S.X., Z.C., and X.D.; writing—review and editing, B.L.; visualization, X.L, Y.M., and X.D.; supervision, L.L. and B.L.; project administration, Z.Z.; funding acquisition, Z.Z. All authors have read and agreed to the published version of the manuscript.

Funding

This research received no external funding.

Data Availability Statement

We regret that the power data cannot be disclosed due to its particularity and confidentiality; further inquiries can be directed to the corresponding authors.

Conflicts of Interest

Authors Siyu Xiang, Xueyuan Liu and Lei Luo were employed by the State Grid Sichuan Electric Power Research Institute, Author Zhengwei Chang was employed by the State Grid Sichuan Electric Power Company, Author Yang Mao was employed by the State Grid SiChuan GuangYuan Electric Power Company. The remaining authors declare that the research was conducted in the absence of any commercial or financial relationships that could be construed as a potential conflict of interest.

References

  1. Han, X.; Guo, J.B.; Pu, T.J.; Fu, K.; Qiao, J.; Wang, X.Y. Theoretical Foundation and Directions of Electric Power Artificial Intelligence (I): Hypothesis Analysis and Application Paradigm. Proc. CSEE 2023, 8, 2877–2891. [Google Scholar]
  2. Zhang, Y.H.; Qiu, C.M.; Yang, F.; Xu, S.W.; Shi, X.; He, X. Overview of Application of Deep Learning with Image Data and Spatio-temporal Data of Power Grid. Power Syst. Technol. 2019, 6, 1865–1873. [Google Scholar]
  3. Zeng, Z.P. On the Maintenance and Common Fault Handling Methods of Substation Operating Equipment. China Plant Eng. 2024, 5, 53–55. [Google Scholar]
  4. Liu, Y.P.; Pei, S.T.; Wu, J.H.; Ji, X.X.; Liang, L.H. Deep Learning Based Target Detection Method for Abnormal Hot Spots Infrared Images of Transmission and Transformation Equipment. South. Power Syst. Technol. 2019, 2, 27–33. [Google Scholar] [CrossRef]
  5. Zhou, J.H.; Huang, T.C.; Xie, X.Y.; Fan, W.J.; Yi, T.T.; Zhang, Y.J. Review of Application Research of Video Image Intelligent Recognition Technology in Power Transmission and Distribution Systems. Electr. Power 2021, 1, 124–134+166. [Google Scholar]
  6. Liu, J.W.; Yan, Y.; Lin, G.K.; Gao, P. Research on Approaches to Improve the Automation Technology of Power Systems in Substations. China Plant Eng. 2023, 20, 231–233. [Google Scholar]
  7. Zhao, Z.B.; Feng, S.; Xi, Y.; Zhang, J.L.; Zhai, Y.J.; Zhao, W.Q. The era of large models: A new starting point for electric power vision technology. High Volt. Eng. 2024, 50, 1813–1825. [Google Scholar]
  8. Wang, Y.B.; Li, Y.Y.; Duan, Y.; Wu, H.Y. Infrared Image Recognition of Substation Equipment Based on Lightweight Backbone Network and Attention Mechanism. Power Syst. Technol. 2023, 10, 4358–4369. [Google Scholar]
  9. Wang, Q.; Wu, B.; Zhu, P.; Li, P.; Zuo, W.; Hu, Q. ECA-Net: Efficient channel attention for deep convolutional neural networks. In Proceedings of the IEEE/CVF Conference on Computer Vision and Pattern Recognition, Seattle, WA, USA, 13–19 June 2020; pp. 11534–11542. [Google Scholar]
  10. Zhao, Z.B.; Feng, S.; Zhao, W.Q.; Zhai, Y.J.; Wang, H.T. A thermal image detection method for substation equipment incorporating knowledge migration and improved YOLOv6. CAAI Trans. Intell. Syst. 2023, 6, 1213–1222. [Google Scholar]
  11. Vaswani, A.; Shazeer, N.; Parmar, N.; Uszkoreit, J.; Jones, L.; Gomez, A.N.; Kaiser, Ł.; Polosukhin, I. Attention is all You need. In Proceedings of the 31st International Conference on Neural Information Processing Systems, Long Beach, CA, USA, 4–9 December 2017; pp. 6000–6010. [Google Scholar]
  12. Quan, Y.; Zhang, D.; Zhang, L.; Tang, J. Centralized feature pyramid for object detection. IEEE Trans. Image Process. 2023, 32, 4341–4354. [Google Scholar] [CrossRef]
  13. Deng, C.Z.; Liu, M.Z.; Fu, T.; Gong, M.Q.; Luo, B.J. Infrared Image Recognition of Substation Equipment Based on Improved YOLOv7-Tiny Algorithm. Infrared Technol. 2024, 46, 1–8. Available online: http://kns.cnki.net/kcms/detail/53.1053.tn.20240228.1725.002.html (accessed on 2 March 2024).
  14. Tang, Y.; Han, K.; Guo, J.; Xu, C.; Xu, C.; Wang, Y. GhostNetv2: Enhance cheap operation with long-range attention. Adv. Neural Inf. Process. Syst. 2022, 35, 9969–9982. [Google Scholar]
  15. Zheng, H.; Sun, Y.; Liu, X.; Djike, C.L.T.; Li, J.; Liu, Y.; Ma, J.; Xu, K.; Zhang, C. Infrared image detection of substation insulators using an improved fusion single shot multibox detector. IEEE Trans. Power Deliv. 2020, 36, 3351–3359. [Google Scholar] [CrossRef]
  16. Li, Z.; Yang, L.; Zhou, F. FSSD: Feature fusion single shot multibox detector. arXiv 2017, arXiv:1712.00960. [Google Scholar]
  17. Ou, J.; Wang, J.; Xue, J.; Wang, J.; Zhou, X.; She, L.; Fan, Y. Infrared image target detection of substation electrical equipment using an improved faster R-CNN. IEEE Trans. Power Deliv. 2022, 38, 387–396. [Google Scholar] [CrossRef]
  18. Zheng, H.; Cui, Y.; Yang, W.; Li, J.; Ji, L.; Ping, Y.; Hu, S.; Chen, X. An infrared image detection method of substation equipment combining Iresgroup structure and CenterNet. IEEE Trans. Power Deliv. 2022, 37, 4757–4765. [Google Scholar] [CrossRef]
  19. Duta, I.C.; Liu, L.; Zhu, F.; Shao, L. Improved residual networks for image and video recognition. In Proceedings of the 2020 25th International Conference on Pattern Recognition (ICPR), Milan, Italy, 10–15 January 2021; pp. 9415–9422. [Google Scholar]
  20. Zhou, X.; Wang, D.; Krähenbühl, P. Objects as points. arXiv 2019, arXiv:1904.07850. [Google Scholar]
  21. Wu, T.; Zhou, Z.K.; Liu, J.F.; Zhang, D.D.; Fu, Q.; Ou, Y.; Jiao, R.N. ISE-YOLO: A Real-time Infrared Detection Model for Substation Equipment. IEEE Trans. Power Deliv. 2024, 39, 2378–2387. [Google Scholar] [CrossRef]
  22. Wu, C.D.; Wu, Y.L.; He, X. Infrared image target detection for substation electrical equipment based on improved faster region-based convolutional neural network algorithm. Rev. Sci. Instrum. 2024, 95, 043702. [Google Scholar] [CrossRef]
  23. Han, S.; Yang, F.; Yang, G.; Gao, B.; Zhang, N.; Wang, D.W. Electrical equipment identification in infrared images based on ROI-selected CNN method. Electr. Power Syst. Res. 2020, 188, 106534. [Google Scholar] [CrossRef]
  24. Lu, L.; Li, M.L.; Xiong, W.; Gong, K.; Ma, H.; Zhang, X. Infrared Image Detection of Substation Equipment Based on Improved YOLOv8. Infrared Technol. 2024, 46, 1–7. Available online: http://kns.cnki.net/kcms/detail/53.1053.TN.20240508.1504.002.html (accessed on 10 May 2024).
  25. Fu, J.Y.; Zhang, Z.J.; Sun, W.; Zou, K.X. Improved YOLOv8 Small Target Detection Algorithm in Aerial Images. Comput. Eng. Appl. 2024, 60, 100–109. [Google Scholar]
  26. Wang, C.Y.; Bochkovskiy, A.; Liao, H.Y.M. YOLOv7: Trainable bag-of-freebies sets new state-of-the-art for real-time object detectors. In Proceedings of the IEEE/CVF Conference on Computer Vision and Pattern Recognition, Vancouver, BC, Canada, 17–24 June 2023; pp. 7464–7475. [Google Scholar]
  27. Wang, C.Y.; Yeh, I.H.; Liao, H.Y.M. YOLOv9: Learning What You Want to Learn Using Programmable Gradient Information. arXiv 2024, arXiv:2402.13616. [Google Scholar]
  28. Hao, Y.; Liu, B.; Zhao, B.; Liu, E.H. Small object detection algorithm based on improved YOLOv8 for remote sensing. IEEE J. Sel. Top. Appl. Earth Obs. Remote Sens. 2023, 17, 1734–1747. [Google Scholar]
  29. Wang, G.; Chen, Y.F.; An, P.; Hong, H.Y.; Hu, J.H.; Huang, T.G. UAV-YOLOv8: A small-object-detection model based on improved YOLOv8 for UAV aerial photography scenarios. Sensors 2023, 23, 7190. [Google Scholar] [CrossRef]
  30. Yang, S.Z.; Wang, W.; Gao, S.; Deng, Z.P. Strawberry ripeness detection based on YOLOv8 algorithm fused with LW-Swin Transformer. Comput. Electron. Agric. 2023, 215, 108360. [Google Scholar] [CrossRef]
  31. Min, L.T.; Fan, Z.M.; Dou, F.Y.; Lv, Q.Y.; Li, X. Nearshore Ship Object Detection Method Based on Appearance Fine-grained Discrimination Network. J. Telem. Track. Command. 2024, 45(2), 1–9. [Google Scholar]
  32. Deng, Z.G.; Dai, G.; Wu, X.G.; Deng, Y.J.; Wang, W.; Chen, M.; Tu, Y.; Zhang, F.; Fang, H. An image recognition model for minor and irregular damage on metal surface based on attention mechanism and deformable convolution. Comput. Eng. Sci. 2023, 45, 127–135. [Google Scholar]
  33. Dai, J.; Qi, H.; Xiong, Y.; Li, Y.; Zhang, G.; Hu, H.; Wei, Y. Deformable convolutional networks. In Proceedings of the 2017 IEEE International Conference on Computer Vision (ICCV), Venice, Italy, 22–29 October 2017; pp. 764–773. [Google Scholar]
  34. Zhu, X.; Hu, H.; Lin, S.; Dai, J. Deformable convnets v2: More deformable, better results. In Proceedings of the 2019 IEEE/CVF Conference on Computer Vision and Pattern Recognition (CVPR), Long Beach, CA, USA, 15–20 June 2019; pp. 9308–9316. [Google Scholar]
  35. Guo, M.H.; Lu, C.Z.; Hou, Q.; Liu, Z.; Cheng, M.M.; Hu, S.M. Segnext: Rethinking convolutional attention design for semantic segmentation. Adv. Neural Inf. Process. Syst. 2022, 35, 1140–1156. [Google Scholar]
  36. Wang, A.; Chen, H.; Liu, L.H.; Chen, K.; Lin, Z.J.; Han, J.G.; Ding, G.G. YOLOv10: Real-Time End-to-End Object Detection. arXiv 2024, arXiv:2405.14458. [Google Scholar]
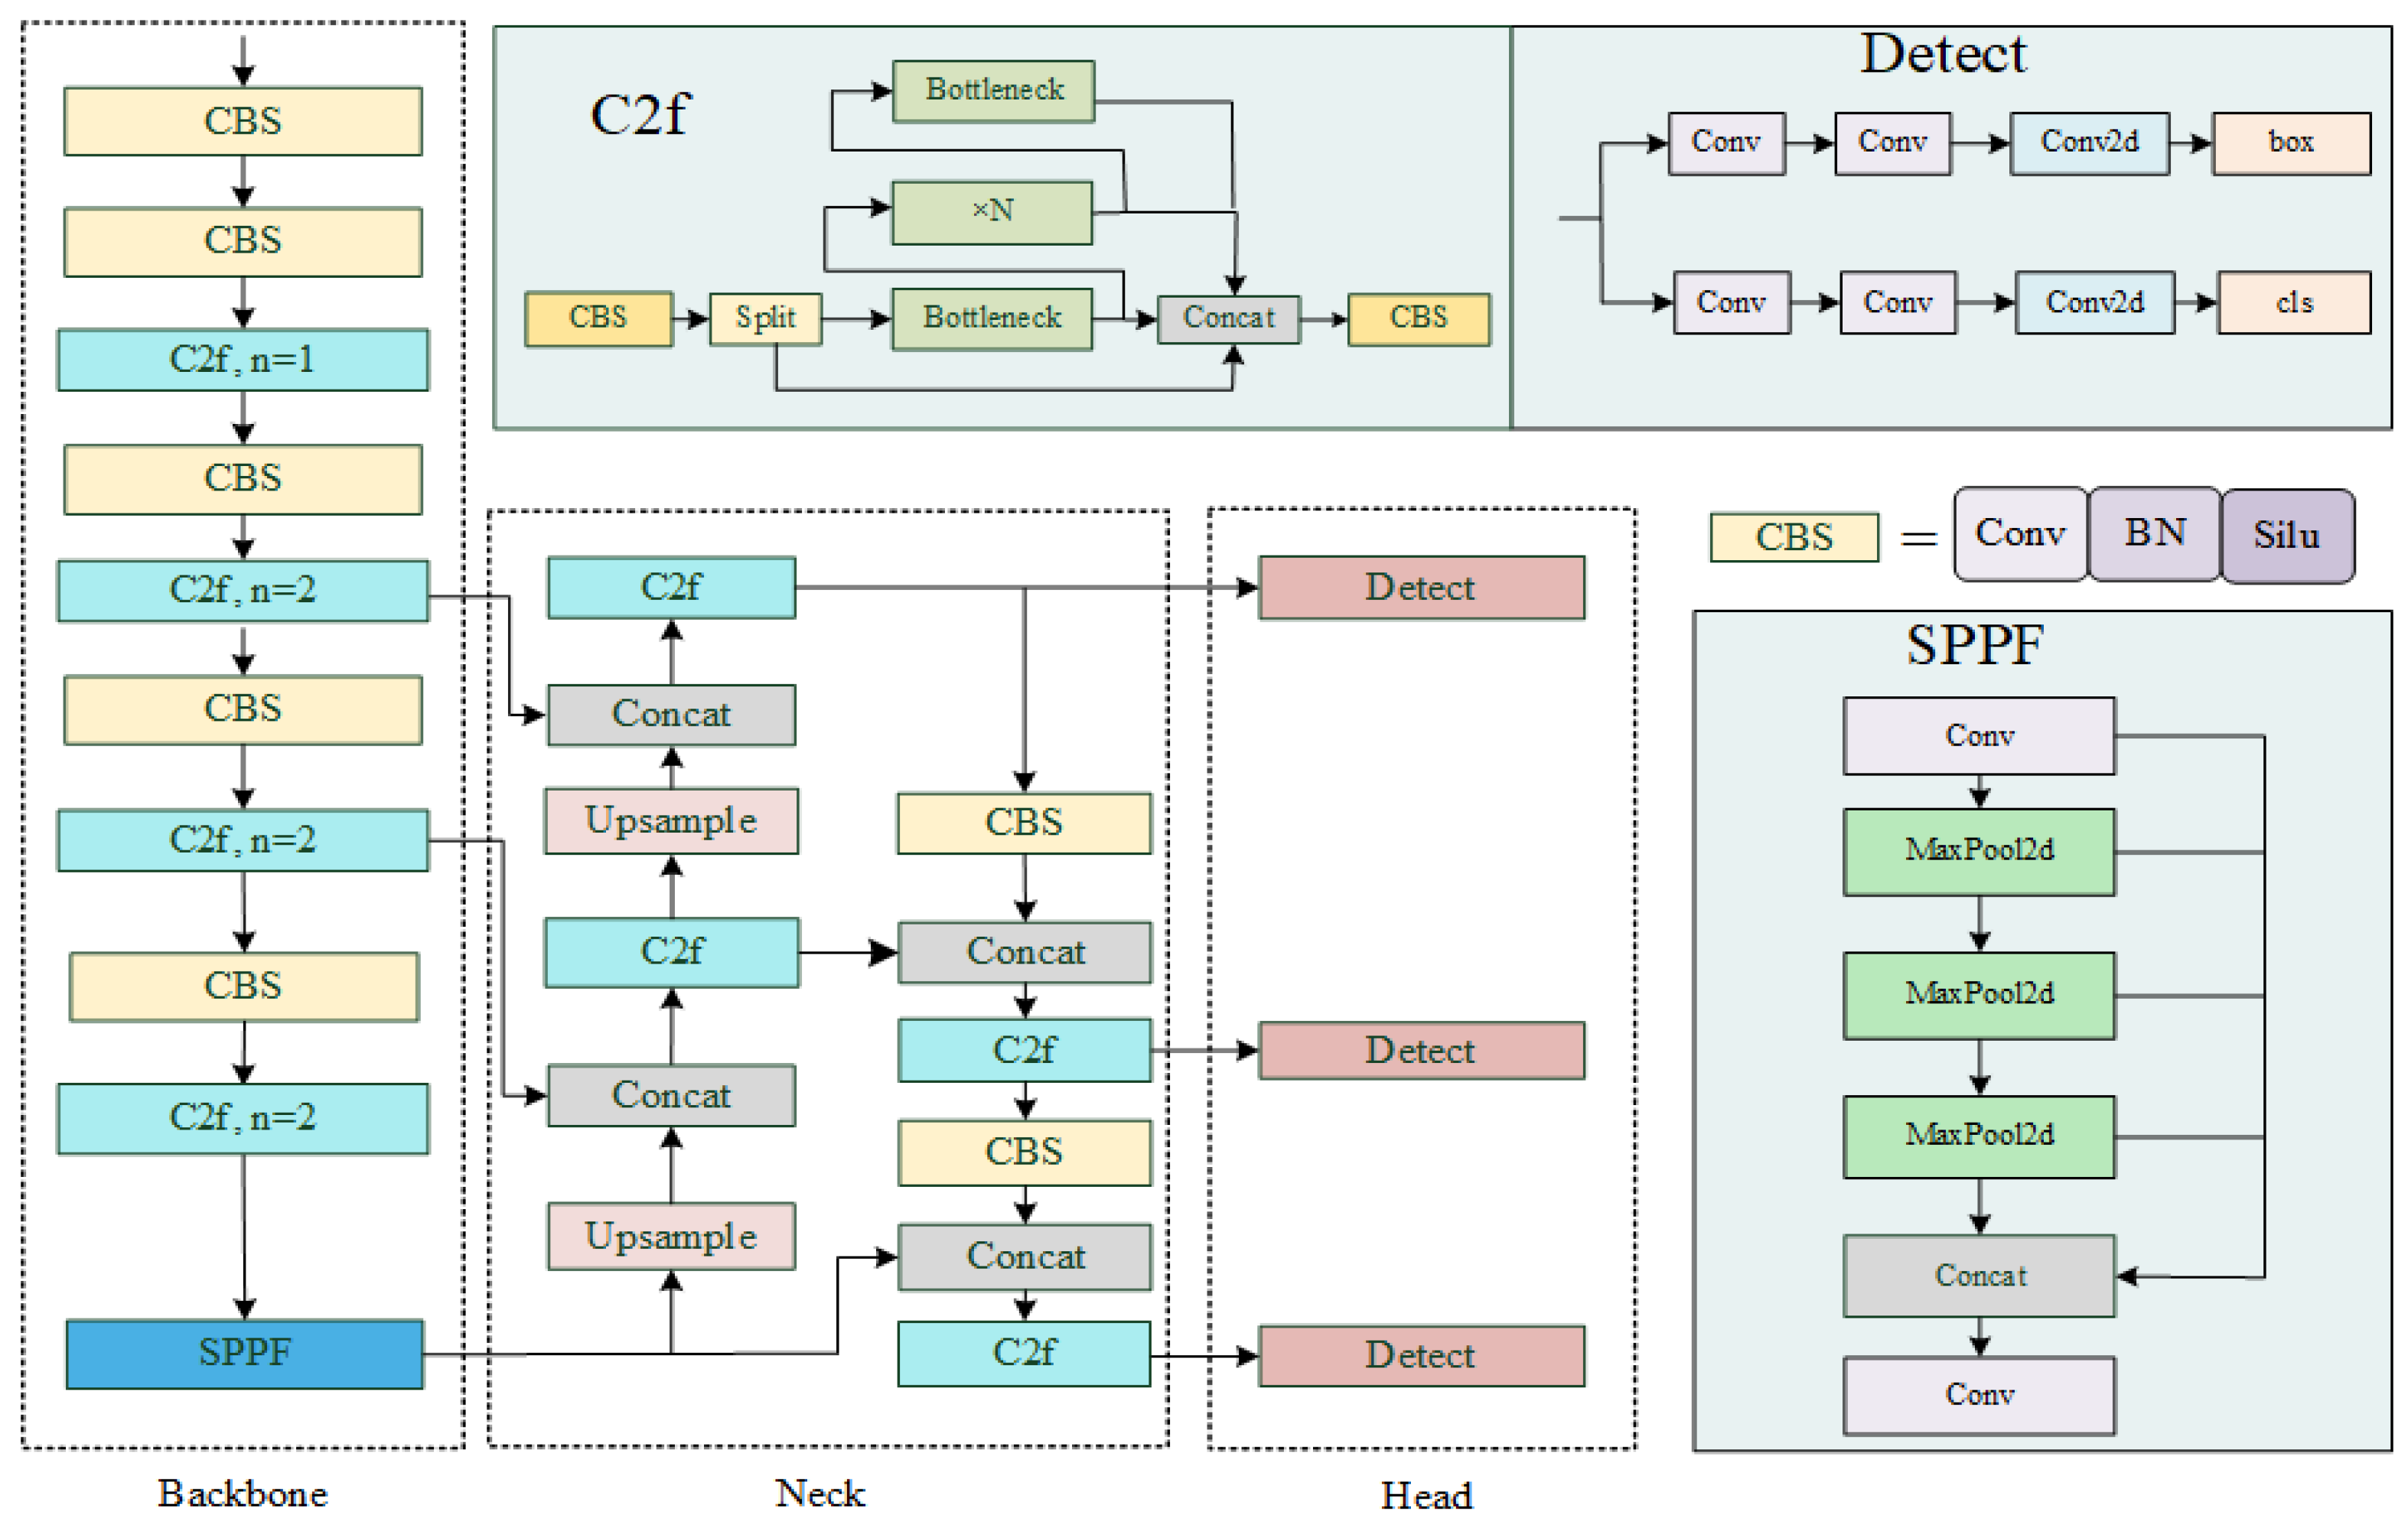
Figure 1. The structure of the YOLOv8n.
Energies 17 04359 g001
Figure 2. The structure of the improved YOLOv8n.
Energies 17 04359 g002
Figure 3. The structure of the DCNC2f module.
Energies 17 04359 g003
Figure 4. The structure of the MSCA.
Energies 17 04359 g004
Figure 5. (a) Insulator. (b) Bushing. (c) Lightning arrester. (d) Current transformer. (e) Voltage transformer.
Energies 17 04359 g005
Figure 6. Visualization of the results of different methods. (a) Original images. (b) YOLOv5n. (c) YOLOv7-tiny. (d) YOLOv9. (e) YOLOv10n. (f) The literature [13]. (g) The literature [24]. (h) YOLOv8n. (i) Ours.
Energies 17 04359 g006
Figure 7. Visualization of the results of different methods. (a) Original images. (b) YOLOv5n. (c) YOLOv7-tiny. (d) YOLOv9. (e) YOLOv10n. (f) The literature [13]. (g) The literature [24]. (h) YOLOv8n. (i) Ours.
Energies 17 04359 g007
Figure 8. Visualization of the results of different methods. (a) Original images. (b) YOLOv5n. (c) YOLOv7-tiny. (d) YOLOv9. (e) YOLOv10n. (f) The literature [13]. (g) The literature [24]. (h) YOLOv8n. (i) Ours.
Energies 17 04359 g008
Figure 9. Visualization of the results of different methods. (a) Original images. (b) YOLOv5n. (c) YOLOv7-tiny. (d) YOLOv9. (e) YOLOv10n. (f) The literature [13]. (g) The literature [24]. (h) YOLOv8n. (i) Ours.
Energies 17 04359 g009
Figure 10. Visualization of the results of different methods. (a) Original images. (b) YOLOv5n. (c) YOLOv7-tiny. (d) YOLOv9. (e) YOLOv10n. (f) The literature [13]. (g) The literature [24]. (h) YOLOv8n. (i) Ours.
Energies 17 04359 g010
Table 1. The parameters of the experimental platform.
ParameterConfigure
Operating SystemUbuntu 18.04
Deep Learning FrameworkPytorch 1.11.3
CPU Intel(R) Xeon(R) Gold 6148 CPU
GPUNVIDIA GeForce RTX 3090, 24 GB
Graphics Card Memory24 G
Programming LanguagePython 3.8
Table 2. Results of the ablation study. The symbol "√" indicates that the module is selected.
YOLOv8nDCNC2fMSCAmAP@0.5/%mAP@0.5:0.95/%Params/MFLOPs/G
90.164.63.008.2
91.668.13.177.8
91.567.53.108.2
92.768.53.267.8
Table 3. Statistical significance verification experiment.
Confidence ModelmAP@0.50/%mAP@0.50:0.95/%Params/MFLOPs/G
0.001YOLOv8n89.863.13.008.2
Ours92.466.73.267.8
0.01YOLOv8n90.164.63.108.2
Ours92.768.53.267.8
0.1YOLOv8n90.066.63.008.2
Ours92.569.63.267.8
0.5YOLOv8n85.365.63.008.2
Ours89.769.63.267.8
Table 4. The comparison results.
ModelmAP@0.5%mAP@0.5:0.95%Params/MFLOPs/G
YOLOv5n86.056.41.764.1
YOLOv7-tiny85.754.76.0213.1
YOLOv990.667.960.50263.9
YOLOv8n90.164.63.008.2
YOLOv10n81.755.62.698.2
Literature [13]83.247.64.5012.8
Literature [24]91.266.710.6336.7
Ours92.768.53.267.8
Disclaimer/Publisher’s Note: The statements, opinions and data contained in all publications are solely those of the individual author(s) and contributor(s) and not of MDPI and/or the editor(s). MDPI and/or the editor(s) disclaim responsibility for any injury to people or property resulting from any ideas, methods, instructions or products referred to in the content.