1. Introduction
The monitoring and control of the combustion development in a reciprocating internal combustion engine is a topic of great interest in the context of the increasingly stringent standards relating to the environmental impact of engines. Via monitoring of the combustion process, its optimization may be possible during engine real operation, thus allowing increased engine performance as well as fuel saving. Moreover, it is feasible to achieve a reduction in pollutant species since combustion causes discharge into the atmosphere of primary pollutants and emissions responsible for secondary pollution due to their chemical reaction with other compounds in the atmosphere.
The monitoring of the combustion process in compression ignition engines can be achieved via an in-cylinder pressure sensor: the direct measure of the pressure trace in the chamber is characterized by high signal reliability. Constant exposure to high values of temperature and pressure during combustion is responsible for the limited durability and the high cost of the sensor. This is why engine makers are reluctant to place in-cylinder pressure sensors in their engines. Many efforts are dedicated to developing reliable, durable, and cheap sensors that are able to resist the hostile environment where they must be installed during the vehicle’s lifetime. Of course, the requirement for the minimum size of the sensor allows for mounting in any kind of engine without any modification of its structure [
1,
2].
Aimed at overcoming the difficulties in carrying out direct measurements of cylinder pressure, much activity has been dedicated to developing methodologies in which the combustion status is monitored via indirect measure. Vibration-based techniques have been proven to be very attractive due to the advantages related to the non-intrusive nature of the sensors, their cost-effectiveness, and their easy installation and maintenance. The steep pressure rise in the cylinder, due to the auto-ignition during the initial phase of combustion, causes a gas resonance. The resonance is transmitted on the chamber wall as a vibration. It has been demonstrated that direct combustion vibration correlates with the combustion essential parameters (i.e., the maxima values of pressure, rate of heat release, and pressure rise rate).
In recent years, different approaches have been proposed to extract the combustion characteristics from accelerometer signals, and many papers have been published in which the obtained results provide evidence that data acquired via non-intrusive measurements may be used to monitor engine behavior.
Lee et al. [
3] performed an analysis to individuate, within the accelerometer spectrum, the causes responsible for the overall signal, in which a contribution directly linked to the combustion is combined with the contribution of harmonics due to indirect combustion vibrations and other sources (crankshaft vibration, piston slap, and injector). Xiuliang et al. [
4] developed a methodology to remove non-combustion-related components from the measured vibration signal to extract the combustion parameters from the acquired data.
Frequency analysis has been used to extract from the accelerometer signals the main properties of the combustion development: Hunicz et al. [
5] proposed a methodology to evaluate peak heat release rate (HRR) data from the cylinder head vibration during naturally aspirated homogeneous charge compression ignition combustion. Amezcua et al. [
6] mounted a tri-axial transducer on the block of a high-speed four-cylinder compression ignition engine and found a high correlation between the vibration signals in the initial phases of combustion and the second derivative of in-cylinder pressure. They discovered that the start of combustion correlates with the vibration first derivative with respect to crank angle; the angular location of the fifty-percent heat release was obtained via the integral of the square of the vibration signal derivative. Gao et al. [
7] presented a methodology to evaluate the output power from the combustion vibration.
The block vibration trace was used by Nguyen et al. [
8] as input data for a neural network model to reconstruct the pressure development in the cylinder.
Engine vibration was also used to identify abnormal combustion events by detecting high-frequency components via Fourier analysis [
9].
Within this context, previous experimentation was performed by the authors aimed at developing an algorithm to extract from the engine block vibration the combustion-related components. At first, it was applied to estimate the indicators widely used in combustion control applications for one cylinder of the engine [
10]. Then, the methodology was extended to obtain information on the combustion status in more than one cylinder in a multi-cylinder compression ignition engine by using one single sensor [
11].
The above summary highlights the use of engine block vibration in combustion control algorithms based on different techniques; the idea behind this research is to instead use the vibration of the compressor case to extract the turbocharger velocity trend. The employment of the vibration sensor on the compressor case represents a further advance in the use of accelerometers since, in multi-cylinder engines, the monitoring of block vibration may require the employment of more sensors, thus resulting in expenses from both the economic and the data processing points of view.
The idea takes root from some works from the literature, in which it has been demonstrated that the turbocharger velocity is closely related to the engine operation. The temporal variation of the turbocharger velocity is correlated to the pressure waves caused by the cylinder exhaust phases. These waves get into the turbine, and since their profile depends on the combustion process, the turbine speed can be used as a key parameter for tracking the combustion status.
The literature presents research activities on the use of direct measurement of turbocharged velocity for engine operation monitoring. Becciani et al. [
12] analyzed the signals from an eddy current sensor installed on the compressor case to track down the blade passage and evaluate the fuel delivered in each cylinder during its running. Vichi et al. [
13] performed simulations to investigate the correlation between turbocharger behavior and engine operation. The results confirmed the existence of a direct link between the turbocharger speed and the engine torque. Macian et al. [
14] presented an algorithm to detect injection failures based on the measurement of the turbocharger instantaneous speed and its analysis in the frequency domain. An alternative to direct measurement of the turbocharger velocity was proposed by Aretakis et al. [
15], who experimentally investigated the possibility of detecting unstable operating conditions of the turbocharger based on vibration signals. Ascanio et al. [
16] used the vibration signal to evaluate the physical characteristics of a turbocharger. Crescenzo et al. [
17] evaluated the turbocharger velocity through the accelerometer signal of a heavy-duty diesel engine.
Based on these findings, the present work aims to present the results of a processing technique in which the accelerometer signal is used to indirectly estimate the turbocharger velocity.
Previous experimental activity was devoted to highlighting the relation between the unsteady exhaust flow and the turbocharger velocity. The processing of the vibration was based on the bandpass filtering of the vibration traces to extract data related to the turbocharger velocity, for what concerns its mean value and fluctuation [
18,
19].
In the present work, a novel approach to measure the turbocharger mean velocity is proposed based on a combination of the Empirical Mode Decomposition (EMD) Technique, Independent Component Analysis (ICA), and Short Time Fourier Transform (STFT) applied to the accelerometric signals and implemented by in-house software in a MATLAB (R2023b) environment. EMD was selected since it has been highlighted to allow the decomposition of complex signals into a set of Intrinsic Mode Functions (IMFs) through the signal local characteristics time scales. It has been demonstrated to be highly efficient in the diagnosis of fault events when applied to the accelerometer data measured from a large number of faulty engines by decomposition into several IMFs (each function corresponds to a specific range of the frequency components embedded in the vibration trace) [
20].
The literature presents some works in which the EMD method is used to individuate combustion-induced vibration components from the cylinder head vibration to compute the crank angles of the start and center of the combustion process [
21]. Bi et al. [
22] applied an EMD algorithm for extracting knock features from the vibration signals of a direct-injection gasoline engine. In comparison with other knock sensing techniques, the above-mentioned algorithm reduces the computational cost, ensuring high reliability of the results.
For the first time, to the authors’ knowledge, in the present work, the combination of EMD with INCA and STFT aims at increasing the robustness of the component analysis in turbocharged diesel engine monitoring, carried out by a non-invasive measurement approach. Testing was performed by the authors on a light-duty multi-cylinder diesel engine; the activity was carried out in steady-state conditions, fixing engine speed and load conditions in the engine’s complete operative field. To select the optimal position of the sensor, different orientations of the accelerometer have been tested, and predicted values have been compared to direct measurements. The results demonstrate the ability of the methodology to evaluate the turbocharger mean velocity in the range of its variability from about 90,000 to 150,000 rpm and highlight the potentiality of the approach to be employed within control algorithms to determine if cylinder-by-cylinder inhomogeneity arises and, if necessary, take corrective action via the engine electronic control.
2. Experimental Set-Up and Tests
2.1. Test Apparatus
The experimentation was performed on a four-cylinder compression ignition engine;
Table 1 presents its main data. The engine has been specifically designed for light commercial vehicles and is equipped with an electronically controlled variable geometry turbo compressor. Thanks to the after-treatment system (it is made up of an oxidation catalyst, a particulate filter, and a selective catalysis reactor-clean-up catalyst), the engine fulfills Euro 6 standards.
The engine is coupled with a dynamometer and set up to emulate its operation during real conditions (
Figure 1 shows the experimental set-up:
Figure 1a presents the lateral view of the engine, with a detail on the turbocharger and the exhaust system;
Figure 1b shows the front view of the engine, with a detail on the intake system). The electronic unit allows the management of the engine+after-treatment operations via INCA V7.2 software ETAS.
The engine is equipped with an AVL balance for fuel consumption measurements (accuracy of 0.12%); temperature and pressure transducers are installed, thus allowing the complete monitoring of the engine operative conditions.
A pressure probe (GH13P, AVL, Graz, Austria) is installed via a modified preheating plug in one cylinder; pressure transducers are installed in the intake and exhaust systems to measure the instantaneous pressure. Two water-cooled pressure transducers are installed upstream and downstream of the turbine (EWCTV-312, Kulite, Leonia, NJ, USA) to characterize its operation. A pressure transducer (4067A2000, Kistler, Milano, Italy) is also mounted to measure the in-line injection pressure. AVL Indimodul is used to acquire the instantaneous pressure signals; an optical encoder (365C, AVL, Graz, Austria) is employed for the crankshaft position.
Thermocouples K are installed for temperature measurement in the intake and exhaust systems.
An eddy current transducer (Hermes 5.1 DSE0805.01, Jaquet, Berwyn, PA, USA) is mounted on the compressor via a hole made in its case (the position is highlighted in the center of
Figure 2) to measure the instantaneous velocity of the turbo compressor.
Table 2 presents the main data of the transducer. It provides both a mean value of the compressor velocity and a square trace, which presents a transition in the passing of each blade of the compressor (12 blades).
Two monoaxial accelerometers (7240C, Endevco, Halifax, NC, USA) are installed on the compressor case via threaded pins (bottom right and top left of
Figure 2): one is radially oriented, and the other is axially oriented.
The accelerometer’s main specifications are listed in
Table 2. The acquired signals are conditioned by a Nexus instrument (amplifier and low-pass filter at 22.4 kHz, Brüel & Kjær, Milano, Italy) and are acquired in sync with the turbocharger instantaneous speed signal via a code developed by the authors in Labview 2024 Q1 software by using NI board types 6110 for analog signals and 6533 for digital signals [
18]. In the code, the sampling frequency and the acquisition duration can be varied. This guarantees a fixed angular resolution of the collected signals, no matter what the engine speed value is.
2.2. Tests
Engine steady-state testing was performed.
Table 3 shows the matrix of experiments; engine speed values are in the range of 1600–3500 rpm; load condition varies from 50% to full load.
The data acquisition was performed once the warmed-up phase was completed and the engine reached a steady state running for each condition, resulting in a temperature of 18 °C and 36% humidity in the air intake; the cooling water temperature was 88 °C, and the lubricating oil temperature was 98 °C. An angular resolution of 0.125 deg CA was imposed for all tests.
3. Data Processing
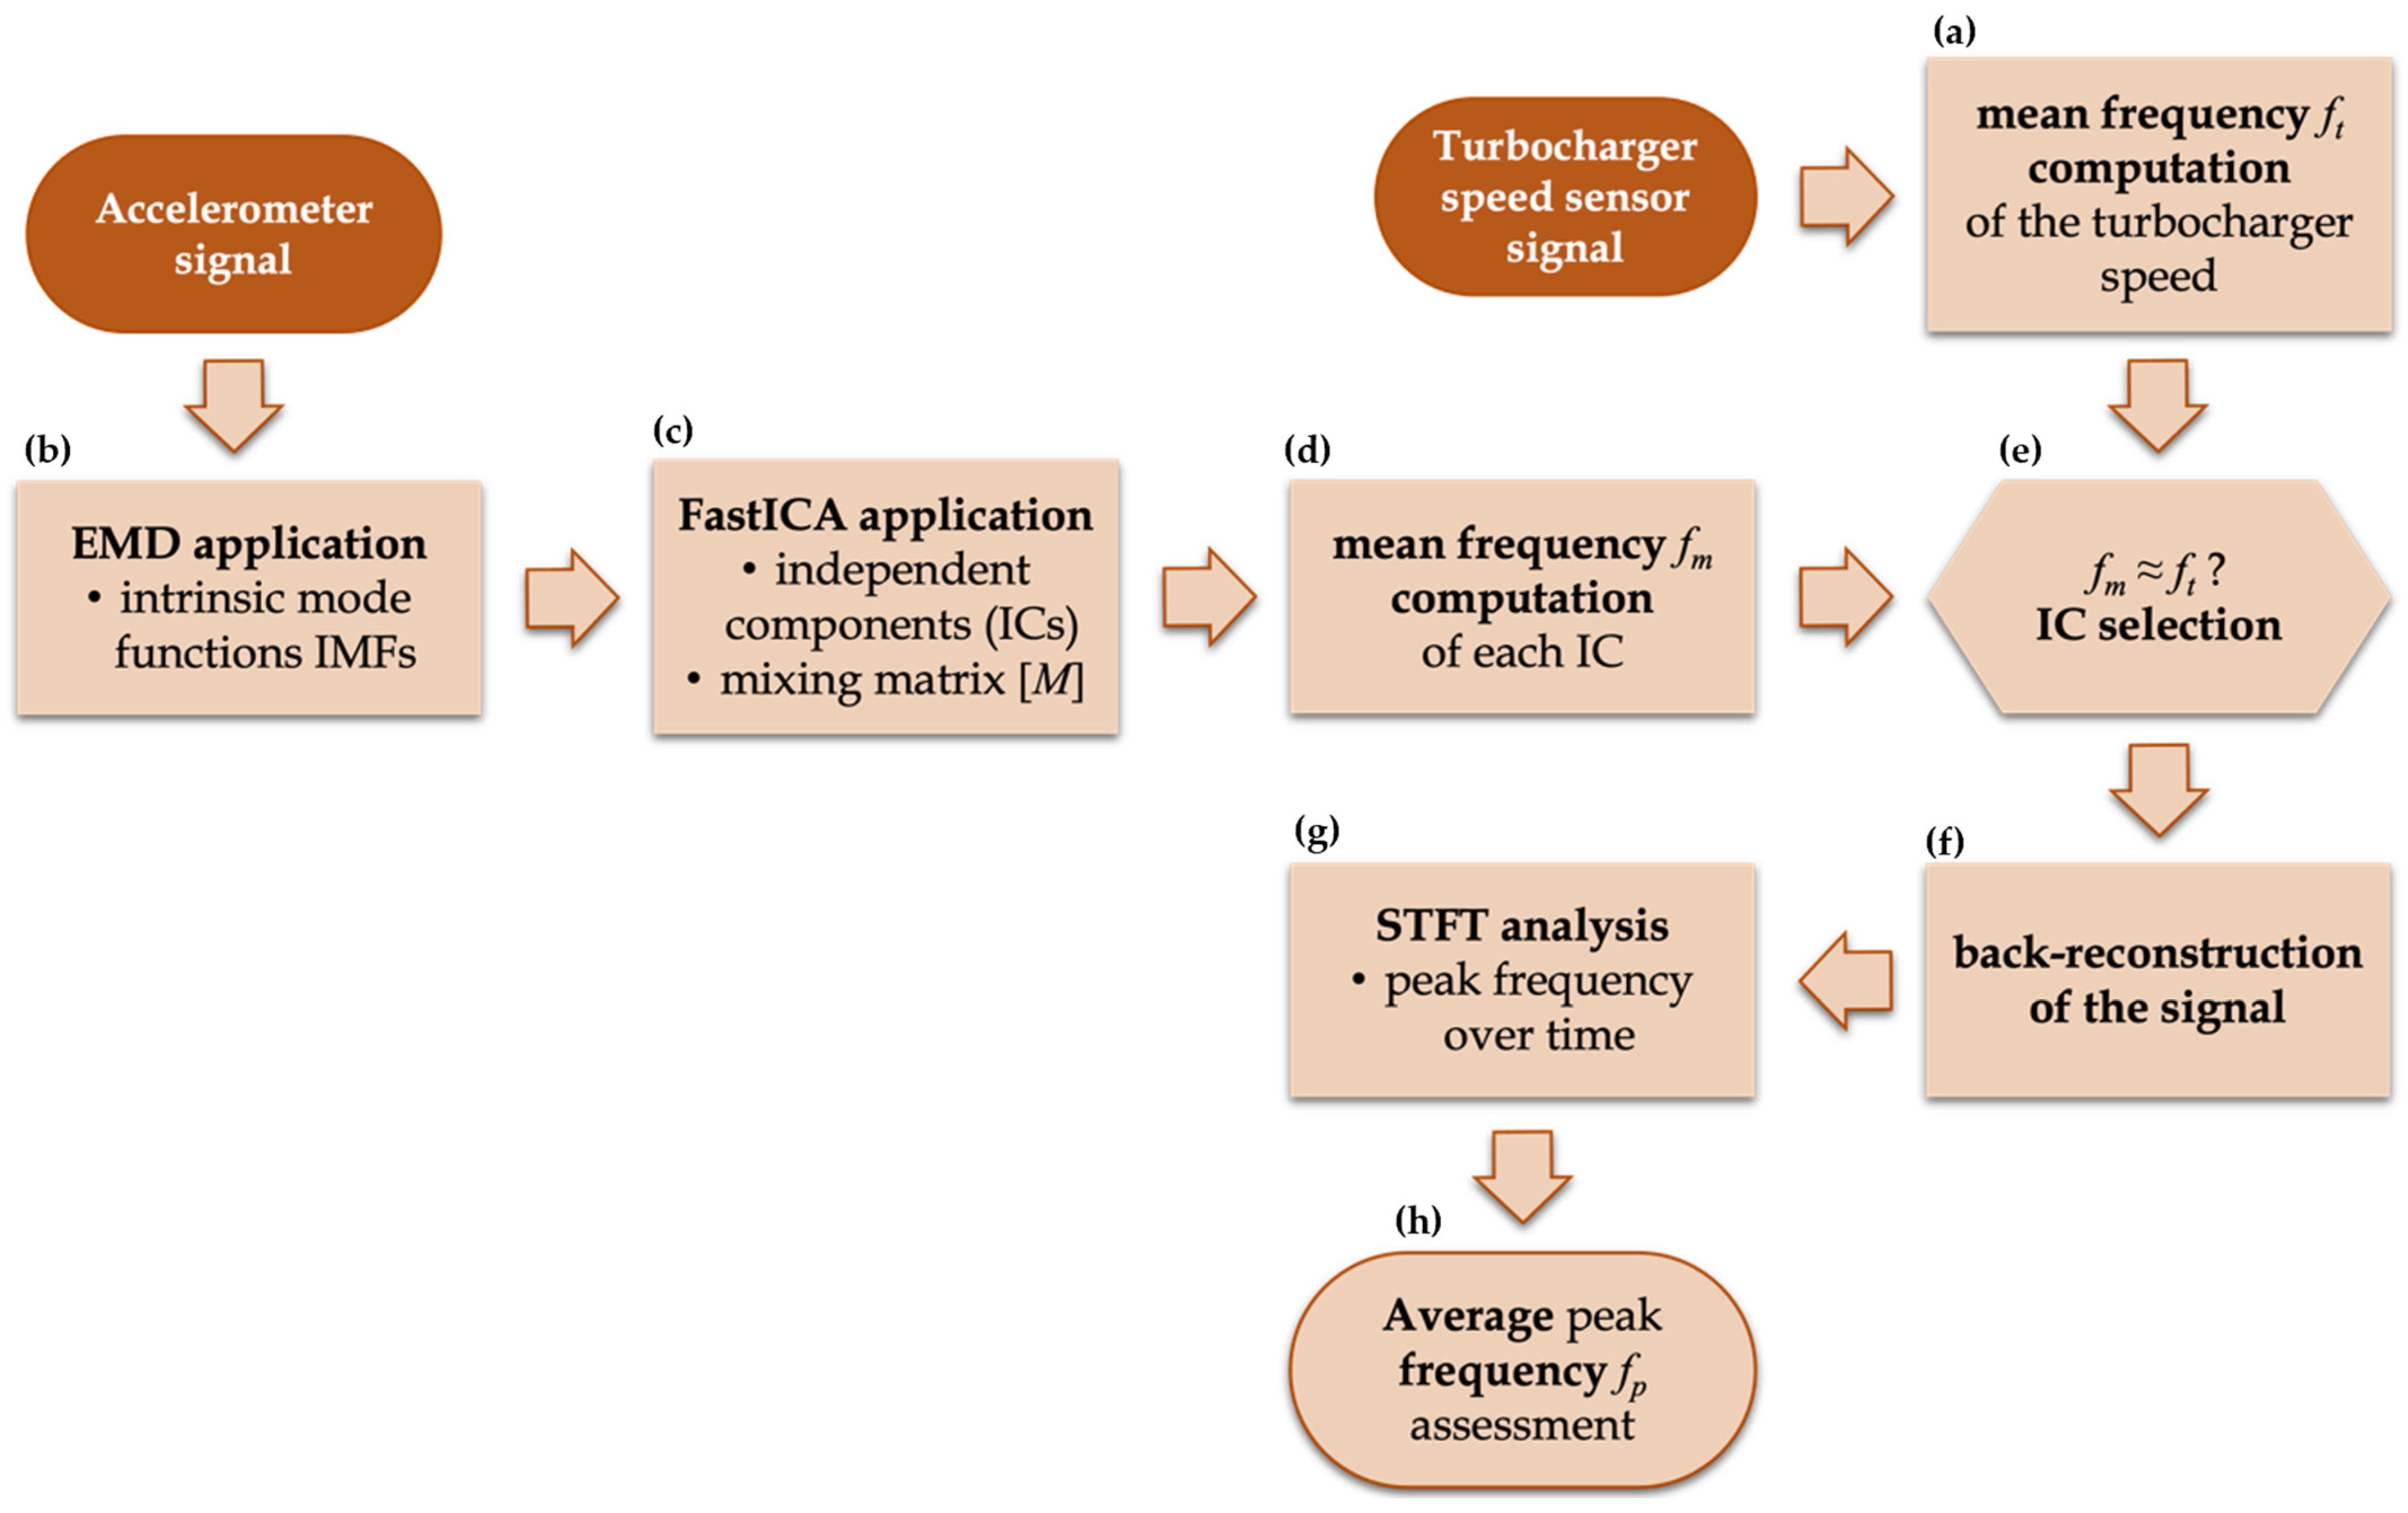
Both axial and radial accelerometer signals were processed through an ad hoc procedure based on the combination of Empirical Mode Decomposition (EMD), Independent Component Analysis (ICA), and Short Time Fourier Transform (STFT). The processing procedure was implemented within the MATLAB environment; its main steps are depicted in
Figure 3. Since the axial
sa(
t) and radial
sr(
t) accelerometer signals underwent the same processing steps, the following description refers to a generic accelerometer signal
s(
t).
Firstly, the square wave of the turbocharger speed trace measured through the Jaquet sensor was processed for the automatic detection of the first maximum of each flat region. This allowed the computation of the mean frequency ft corresponding to the turbocharger angular velocity, which was assumed to be the theoretical mean frequency. The direct measurement of the velocity was used to obtain a reference value and evaluate the accuracy of the predictions based on the accelerometer trace processing.
The accelerometer signal
s(
t) was at first processed via EMD to decompose it into a finite set of Intrinsic Mode Functions (IMFs) and a residual
R(
t) [
23], as follows:
Each IMF is an oscillatory function with zero mean value and contains only one frequency, referred to as instantaneous frequency, which is different from that of the other functions [
23].
At this point, the Independent Component Analysis was applied to the IMFs. ICA is useful for time series data, where signals from various sources are mixed over time, as it may occur in the analysis of the engine behavior studied here. Moreover, the combination of EMD and ICA makes the estimation of a single signal component more robust and less operator-dependent than other approaches [
24,
25,
26]. In particular, it expresses the IMFs as a linear combination of unknown sources
ui(
t), named independent components (ICs), under the assumption of statistical independence:
where [
M] is an unknown matrix, named mixing matrix. In this study, a computationally improved ICA method was adopted, i.e., FastICA [
27].
Consequently, the mean frequency fm of each IC was computed, and the closest one to the expected frequency, i.e., the one in the same order of magnitude of ft, was selected. The independent component identified was then multiplied for the mixing matrix [M] to back-reconstruct the oscillatory mode.
Since the method extracted the same number of ICs for both accelerometer signals, the extracted modes correspond to reconstructed signals that contain the following fundamental frequencies:
Exhaust signal’s frequency, fe, corresponding to 116 Hz when the engine speed is equal to 3500 rpm;
Compressor’s frequency, fc, which corresponds to approximately 2490 Hz (149,226 rpm) for full load condition;
Compressor’s blade frequency, ft, approximately 15 kHz, according to ft = 6fc; since the compressor has 12 blades, 6 of them are longer than the others.
Moreover, through the decomposition into independent modes, it was possible to isolate and exclude the very high-frequency components (e.g., 85 kHz), probably due to the electronic noise.
Finally, STFT [
28] was applied to the back-reconstructed oscillatory mode only to estimate through a translating window the frequency content over time of the reconstructed signal derived from
s(
t), whose frequency content was the closest to
ft. The spectral window chosen was the Hanning window without overlapping and zero-padding.
The peak frequency of each temporal segment was estimated, and the average value fp was compared with ft to check whether the combination of EMD, ICA, and STFT techniques successfully detects the mean frequency of the turbocharger speed from the accelerometer signals.
4. Results
The first part of this section presents the temporal variation of some of the signals acquired under different operational conditions to highlight the role of the engine running status on the in-cylinder pressure, the exhaust traces, and the turbocharger speed. The second part of this section shows some results of the data processing. To limit the number of plots, two values of engine speed representative of the engine running have been selected; the following plots refer to the conditions of 2500 and 3500 rpm.
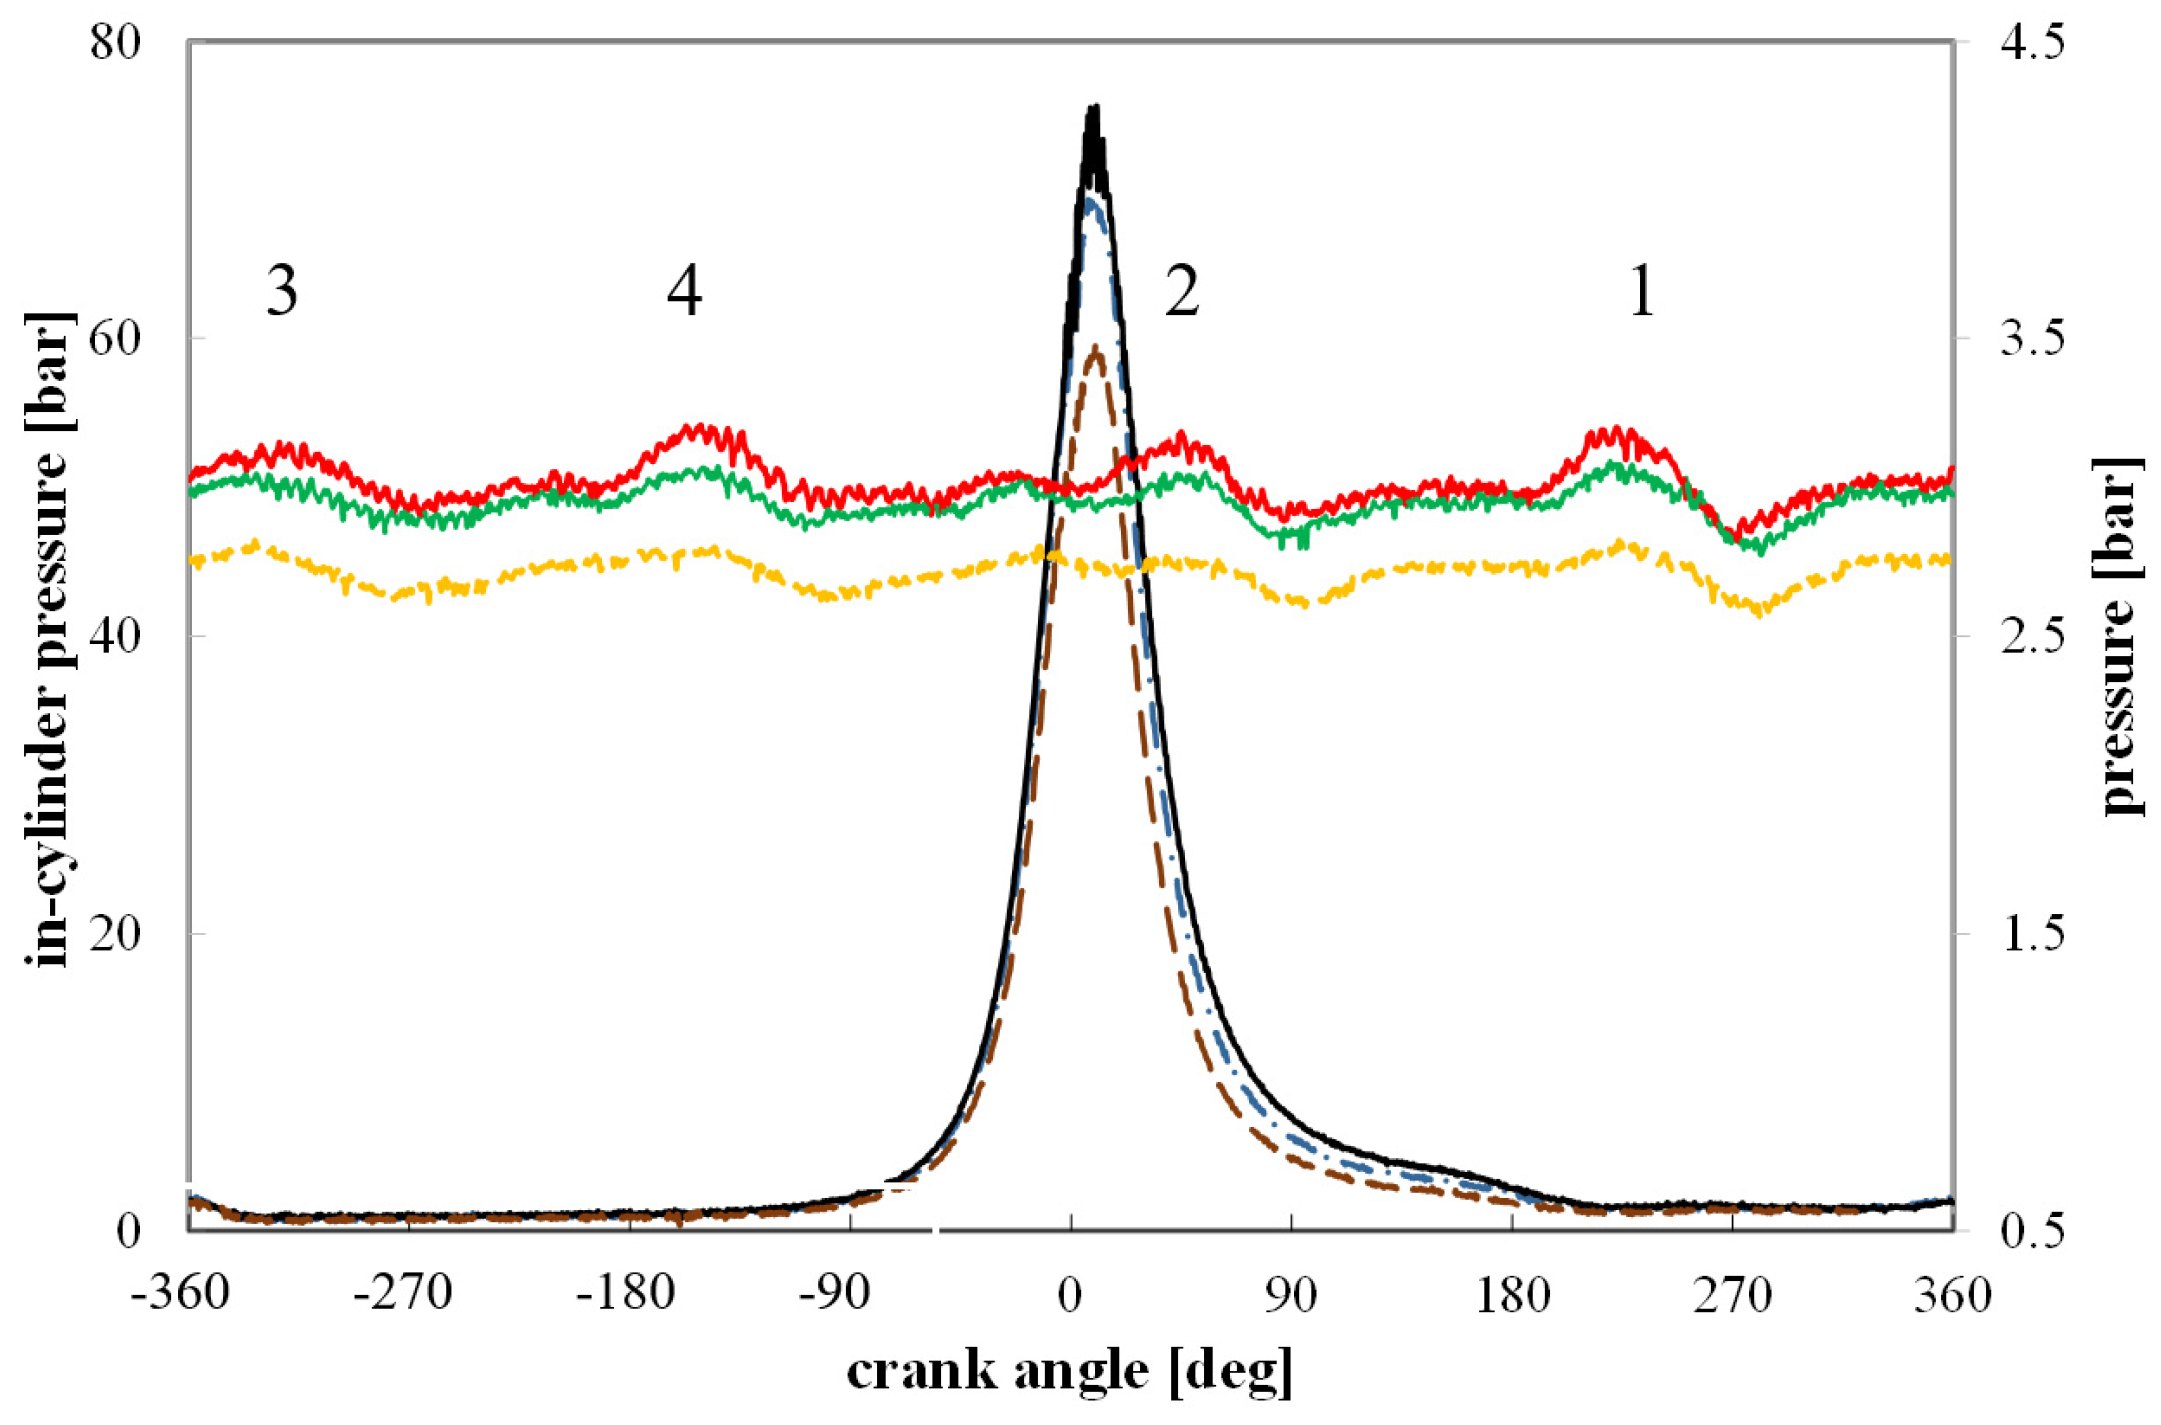
Figure 4 highlights the effect of load conditions on the pressure in the cylinder and in the exhaust trace recorded upstream of the turbine. At the exhaust valve opening, a pressure perturbation is produced, whose amplitude is linked to the amount of fuel that is burned in the cylinder. The monitoring location, which is placed just downstream of the two-branch junction connecting the cylinders to the turbine, experiences the contribution of all cylinders’ exhaust phases, as shown in the figure, where numbers are used to identify the responsible specific cylinder (firing order 1-3-4-2).
In the figure, the exhaust valve opening can be detected by raising the pressure profile to a peak value (in-cylinder pressure drops rapidly, and a compression wave is discharged in the exhaust). The in-cylinder pressure decreases when the exhaust valve opens wider, and the piston keeps moving toward BDC. Once the piston moves toward TDC, the displacement phase occurs, in which exhaust gas is pushed out by the piston movement; a second peak is thus produced in the exhaust trend.
The comparison among the curves highlights the different amplitude of the signals in the exhaust as a consequence of the variation in the in-cylinder pressure, while their shape always remains the same since it is caused by the subsequent exhaust processes of the four cylinders.
The effect of a variation in engine speed is shown in
Figure 5 (all traces are related to full load condition). The decrease in velocity determines the reduction in the pressure values upstream of the turbine while the signal’s shape remains unchanged.
Figure 6 highlights how the engine load condition impacts the turbocharger speed. All curves are characterized by fluctuations due to the exhaust process of the cylinders (the figure shows an interval of 0.1 s that corresponds to approximately three engine cycles, then about 12 fluctuations are shown). For each cylinder, at the exhaust valve opening, a compression pressure perturbation is produced, which propagates in the exhaust toward the turbine inlet. Therefore, its velocity increased to a value whose average and fluctuation are directly related to the engine’s specific running condition. The acquired data highlight that the decrease in load value is responsible for a decrease in turbocharger speed; both the mean values and the fluctuations are affected. The reduction in delivered fuel quantity causes a pressure drop inside the cylinder, and therefore, a decreased pressure perturbation reaches the turbine during the exhaust process. This information could be profitably used to detect any variation in the engine running regarding the target condition that can be caused by different fuel properties or anomalous behavior of the injection system, thus allowing corrective actions to ensure optimal engine operation in real running conditions.
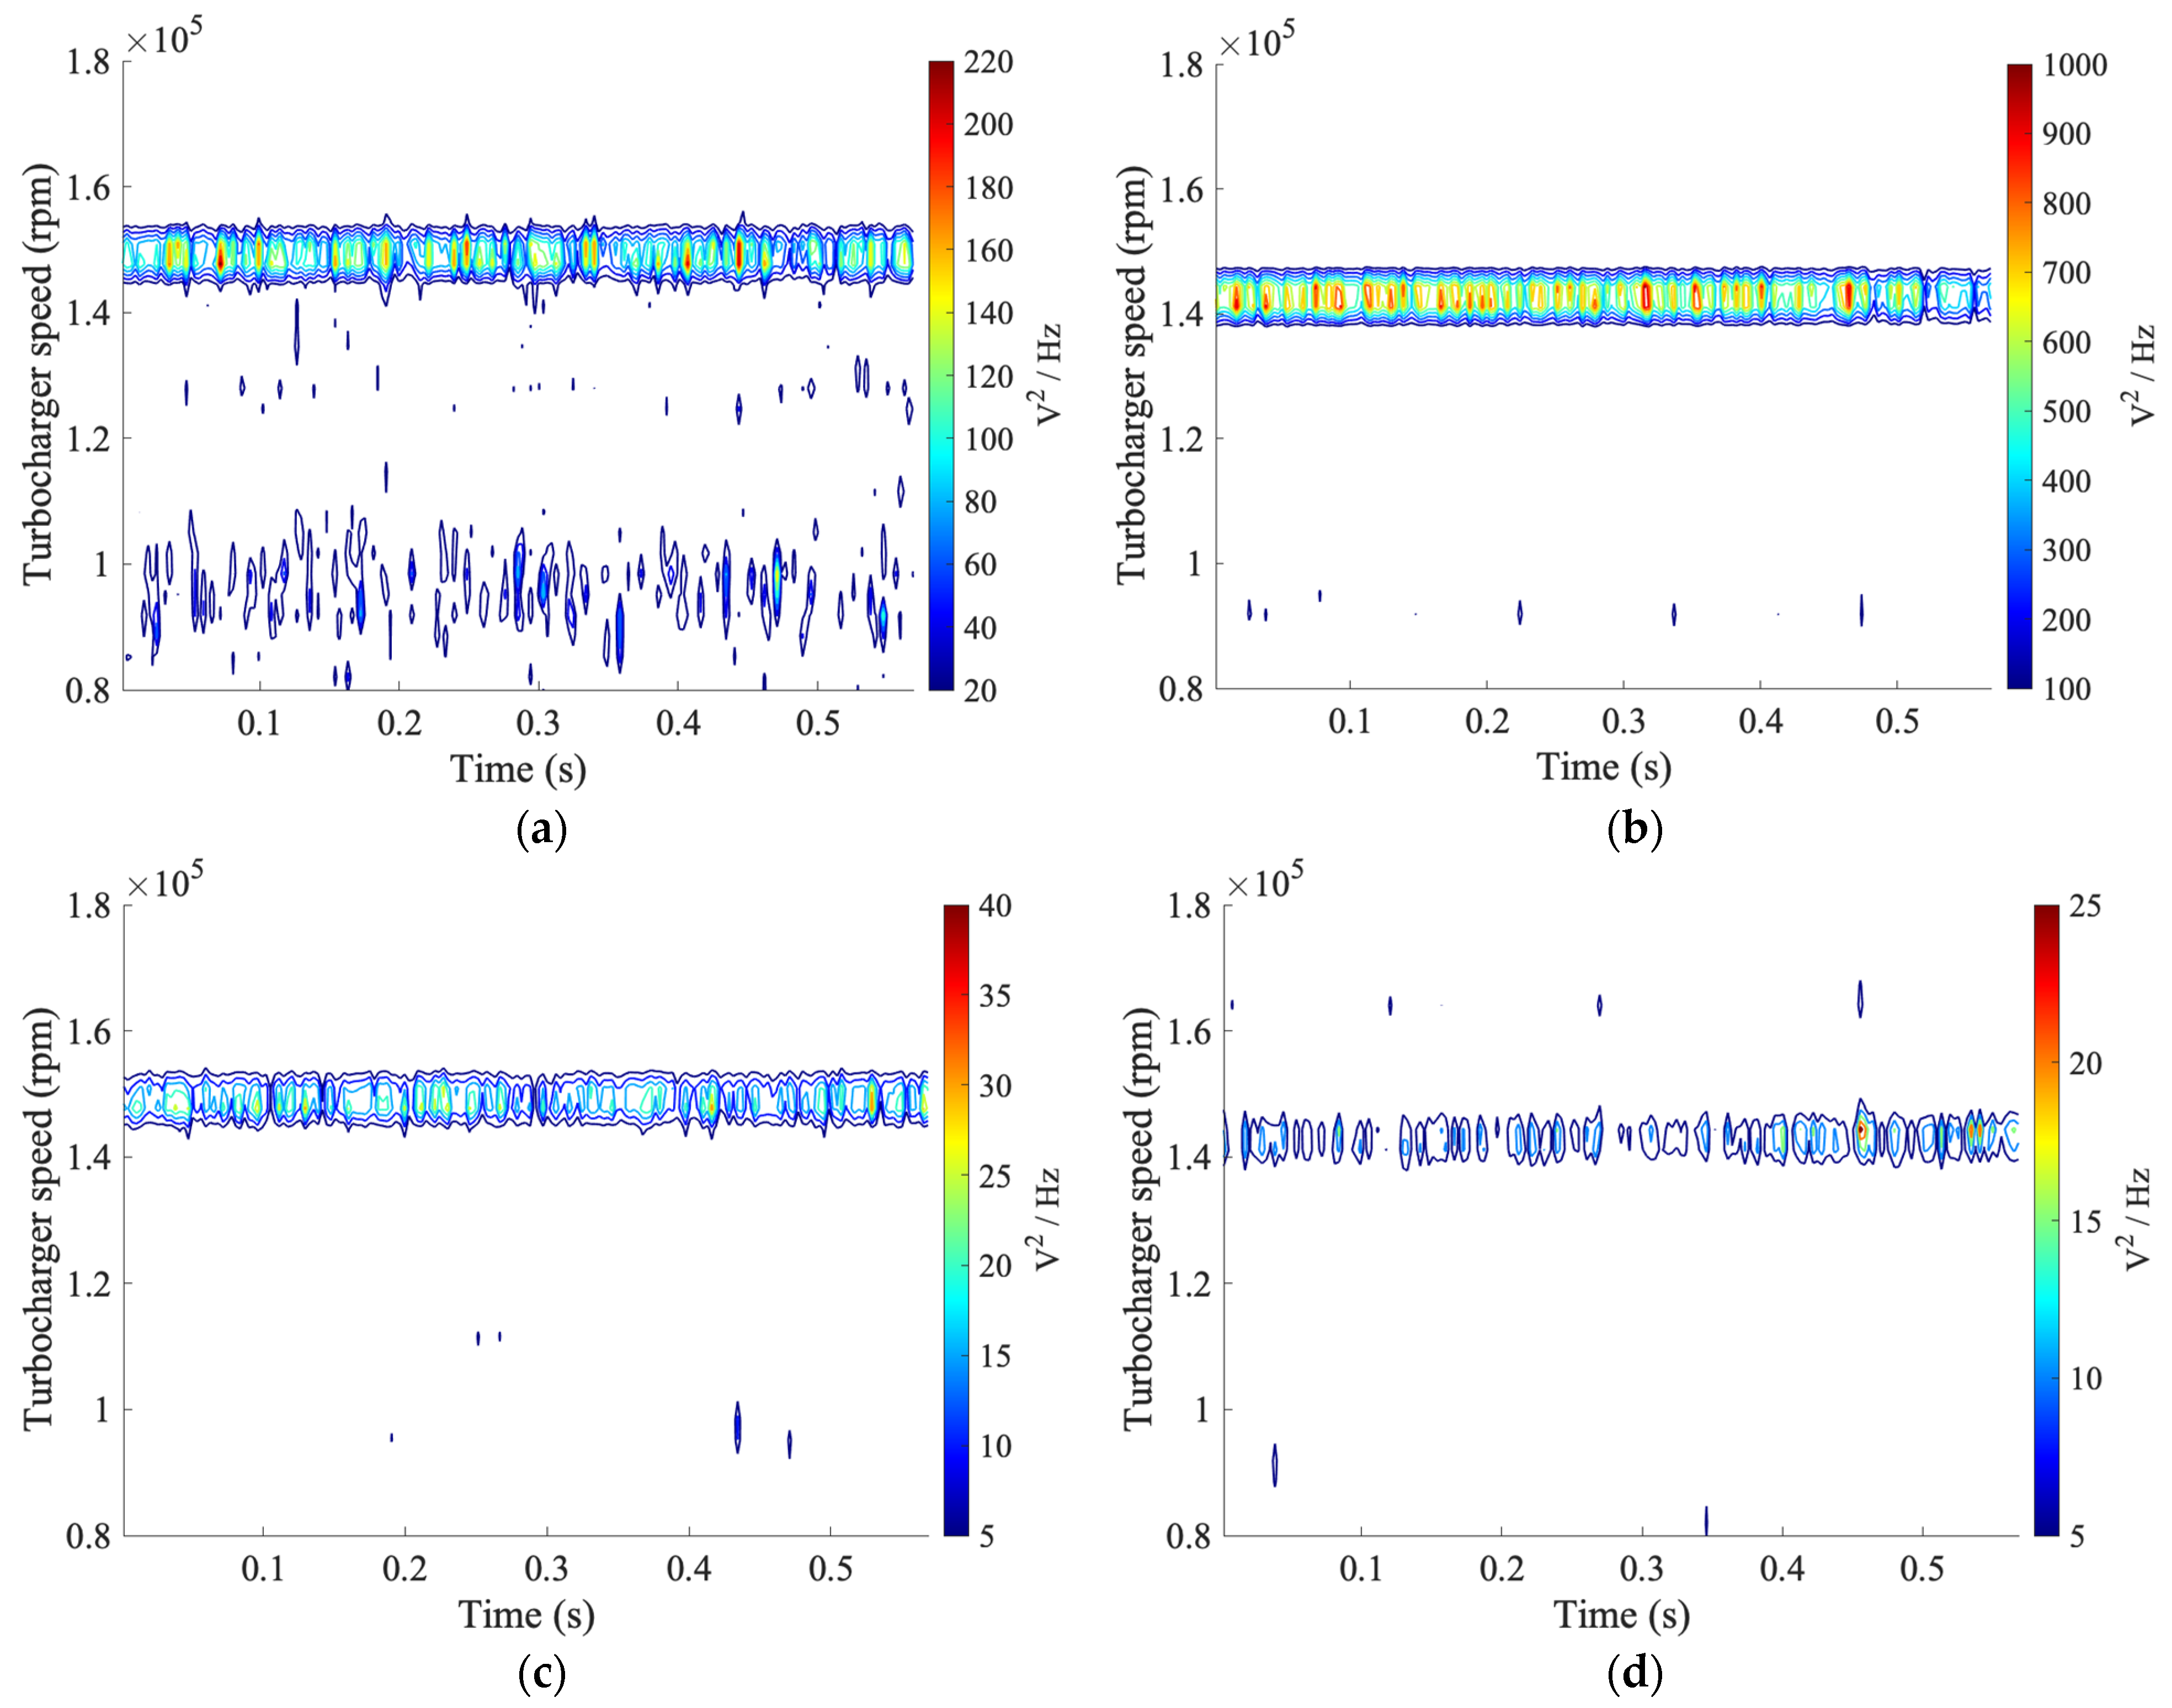
Figure 7 presents the spectrograms computed via the processing of the axial and radial-oriented accelerometer signals to obtain the turbocharger velocity.
The plots refer to the selected representative conditions of the engine running and show the variation in turbocharger speed (in terms of mean value and fluctuation) as a function of the engine speed and load. At 3500 rpm, 100% of the load of the mean value of the velocity is in the range of 150,000 rpm for both estimations; that is reduced to 142,800 when the engine load value is decreased. The spectrograms highlight that the signals obtained from both radially and axially oriented accelerometers are characterized by a predominant contribution of frequency components related to the turbocharger rotation, which depends in terms of its mean value and oscillation on the specific condition of engine speed and load value. Such a relation can thus be profitably used to extract information on the turbocharger speed from the accelerometer trace to detect any variation regarding the values corresponding to the set point, thus diagnosing an irregular engine condition or failure.
The following figures present the experimental results obtained by processing the measurements using the developed method based on the combination of Empirical Mode Decomposition, Independent Component Analysis, and Short Time Fourier Transform.
Figure 8 and
Figure 9 show the measurement data from the accelerometers (with axial and radial orientation, respectively) related to the condition of 3500 rpm, full load for the engine, and 149,226 rpm for the turbocharger (accelerometer with axial and radial orientation, respectively). After the acquisition, the signal was decomposed and processed into its main independent modes: low-frequency components containing the engine’s fundamental frequency (116 Hz), the components with the compressor’s fundamental frequency (approximately 2500 kHz), and the components with the compressor’s blade frequency (it has 12 blades; 6 of them are longer, then 15 kHz and 30 kHz).
In both figures, the low-frequency component region shows the presence of the engine’s harmonics; the region in which the compressor’s fundamental frequency appears is characterized by the presence of many components whose energy contribution is quite high. In the field of frequencies around the blade frequency, the components have very small amplitudes in comparison with those belonging to the other fields. In this region, the blade frequency corresponding to six blades is highlighted, whose amplitude is more than three times bigger than the others in the field. The component related to 12 blades can be detected, as well.
The comparison between the spectral content of the axial and radial acceleration signals emphasizes the fact that the same components are present in the frequency domains, even if they are characterized by differences: radial trace presents a greater contribution of the compressor’s fundamental frequency, while the blade frequency has a smaller amplitude compared to the axial signal, but in both cases, it is easily distinguished from the other components in the specific domain. The spectra indicate that by processing the accelerometer traces in the blade frequency range, it is possible to extract an estimation of the turbocharger mean velocity, thus indirectly obtaining information on the engine condition and detecting any anomaly.
Figure 10 and
Figure 11 present the data obtained by the processing of the traces (axial and radial, respectively) acquired at the engine operation at 3500 rpm, 75% of load, and 142,835 rpm for the turbocharger.
Axial trace exhibits a greater contribution in the field of the compressor’s fundamental frequency, regarding the full load case, even if the component at 2380 Hz is not relevant in the spectrum. The blade frequency exhibits an increase in its amplitude compared to the one related to 100% of the load. This feature also characterizes the radial trace, where the blade frequency component is observable in the spectrum even though its amplitude is reduced compared to the one related to the full load condition.
As previous plots demonstrate, in all signal spectra, the compressor’s blade frequency is distinguishable both in terms of magnitude and frequency from the other components, and for this reason, it was used to compute the mean turbocharged velocity. The plots in
Figure 12 summarize the effect of the engine speed and load value on the components of the axial and radial signals related to the compressor’s blade frequency range. The comparison among the traces highlights that the peak frequency is the same for both orientations, either 100% load or 75% load. Some variations in the amplitude are exhibited; axial orientation has a greater amplitude than the radial one.
Starting from the compressor’s blade frequency identified in the accelerometer signals, the mean value of the turbocharger speed was estimated; it was then used to evaluate the accuracy of the methodology by comparing the obtained values with the direct measure provided by the eddy current sensor.
Table 4 presents the results in the complete engine operative field. The column ‘turbocharger speed’ shows the values provided by the direct measure via the Jaquet transducer and the estimations from axial and radial accelerometer signals. The column ‘percentage error’ reports the values obtained by comparing direct and indirect measurements. The mean relative uncertainty is below 1% for the eddy current transducer, while it reaches 12% for the two accelerometers up to a maximum value of 25%.
The values in
Table 4 highlight that the percentage error seems to increase for both accelerometers as the percentage load decreases. It is worth noting that the proposed processing method did not always produce robust results when applied to the axially oriented accelerometer signals related to the conditions 3000 rpm, 50% of the load, and 2000 rpm, 75% of the load. The same problem occurred for the radially oriented accelerometer signals during the tests at 2000 rpm, 75% of the load, and 1600 rpm, 50% of the load. This limitation is likely due to improper signal-to-noise ratio and sampling flaws in the data acquisition of the accelerometer signals.
Although the results from the two accelerometers are mostly compatible, the reduced values of percentage errors of the radial accelerometer in the complete engine operation seem to suggest that this orientation is the one to prefer in the proposed methodology. However, this issue deserves to be further investigated in future studies.
Based on these results, a combustion control algorithm could thus be implemented in which the mean speed of the turbocharger estimated via the non-intrusive measurement allows the detection of any variation in the engine running condition regarding the regular functioning stored in the ECU.
5. Conclusions
A methodology for the optimization of the combustion process in compression ignition engines via non-intrusive measurements was proposed, exploiting the relationship between the turbocharger velocity and the engine operation:
- −
Accelerometer sensors were installed on the compressor case to indirectly estimate the turbocharger speed;
- −
Accelerometric data processing was based on a combination of Empirical Mode Decomposition and Independent Component Analysis to estimate the turbocharger speed.
The comparison between the obtained traces and the direct turbocharger velocity measures allowed the evaluation of methodology percentage errors and the selection of the radially oriented accelerometer as the optimal placement for the sensor.
The results represent a first step toward the development of a methodology in which any cylinder-by-cylinder inhomogeneity is detected via the processing of the accelerometer data, thus obtaining the turbocharger velocity in terms of its mean value and fluctuating component. The velocity can be used as a feedback signal in the engine electronic control unit to set up appropriate correcting actions for restoring the regular running condition.


 100% load,
  75% load,
  50% load (3500 rpm); pressure upstream the turbine:
  100% load,
  75% load,
  50% load (3500 rpm).
 3500 rpm,
  2500 rpm (100% load); pressure upstream the turbine:
  3500 rpm,
  2500 rpm (100% load).

 100% load,
  75% load,
  50% load (3500 rpm).


