
Technology Selection of High-Voltage Offshore Substations Based on Artificial Intelligence


Abstract
1. Introduction
1.1. Literature Review
1.2. Objectives and Contributions
1.3. Paper Organization
2. Materials
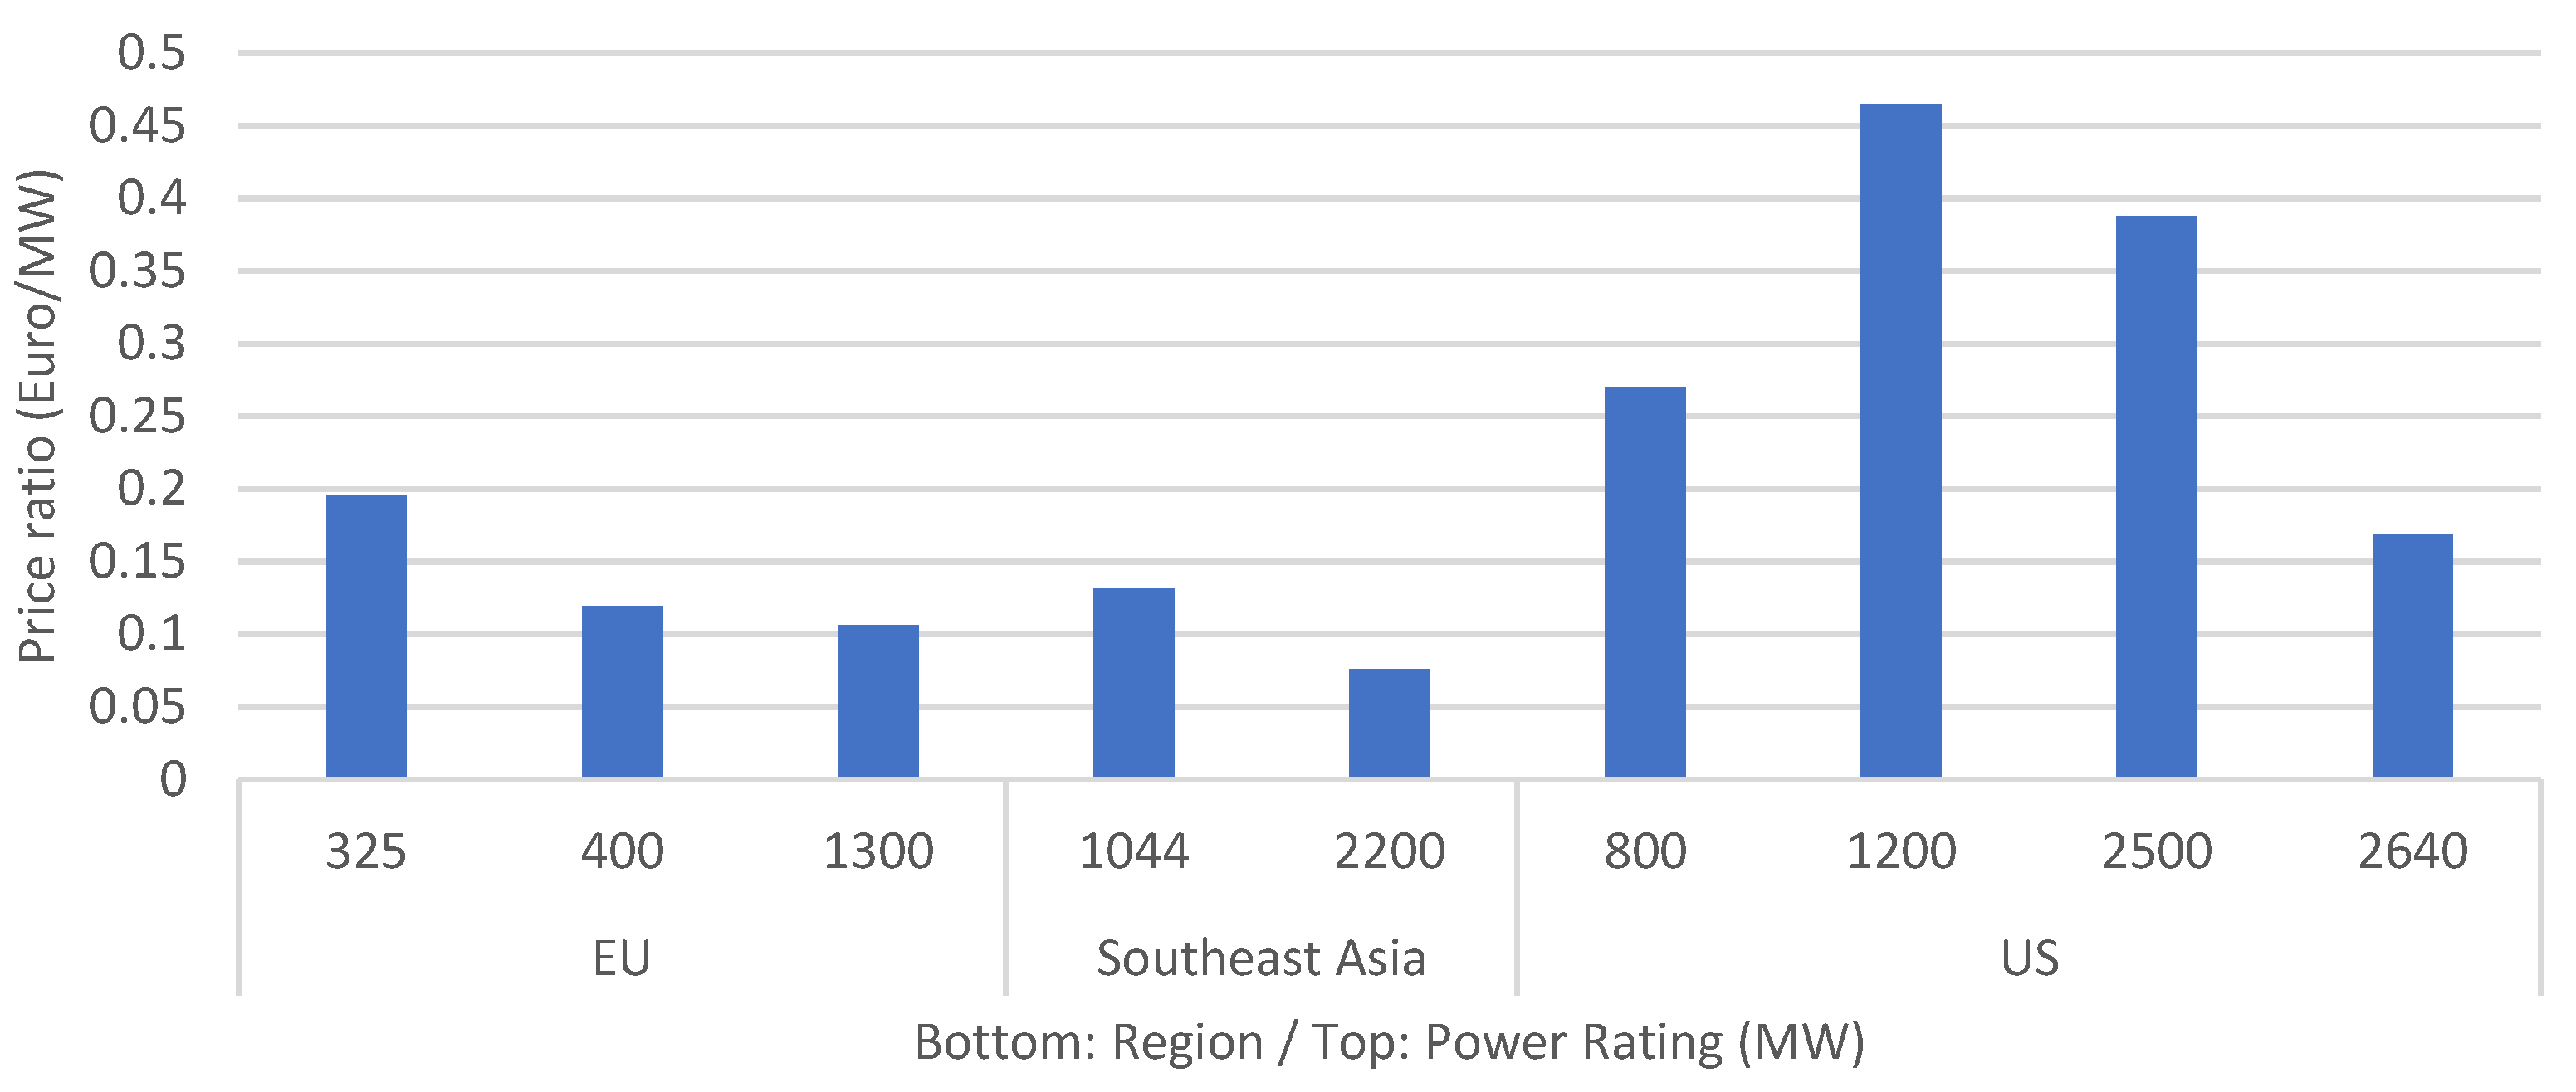
2.1. General Considerations and Market Review
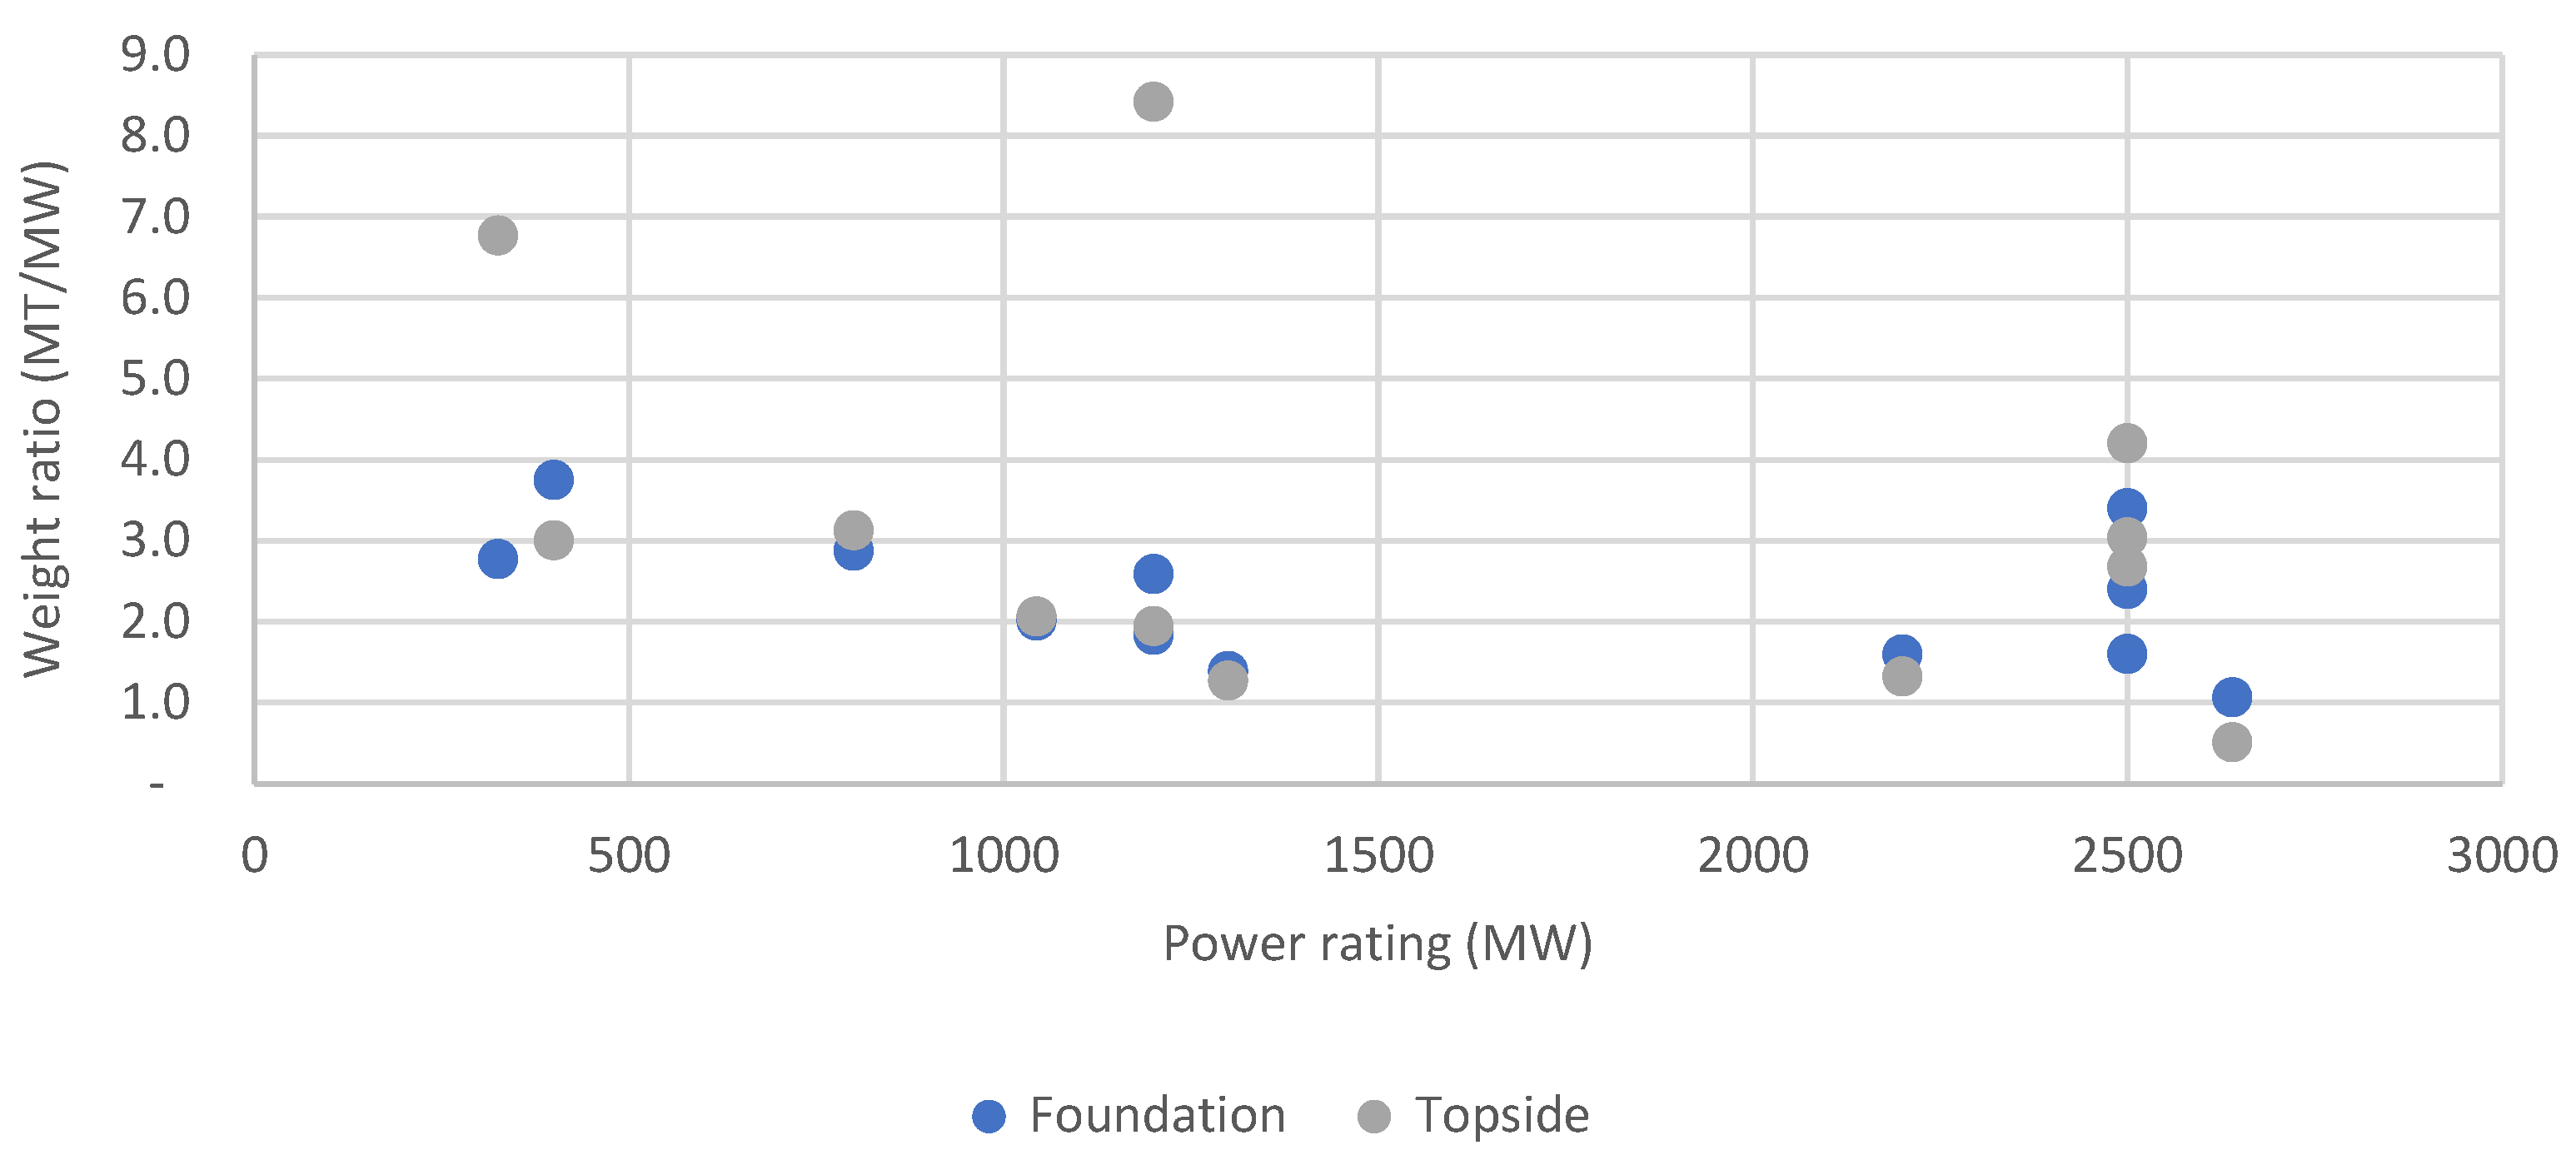
2.2. Foundations
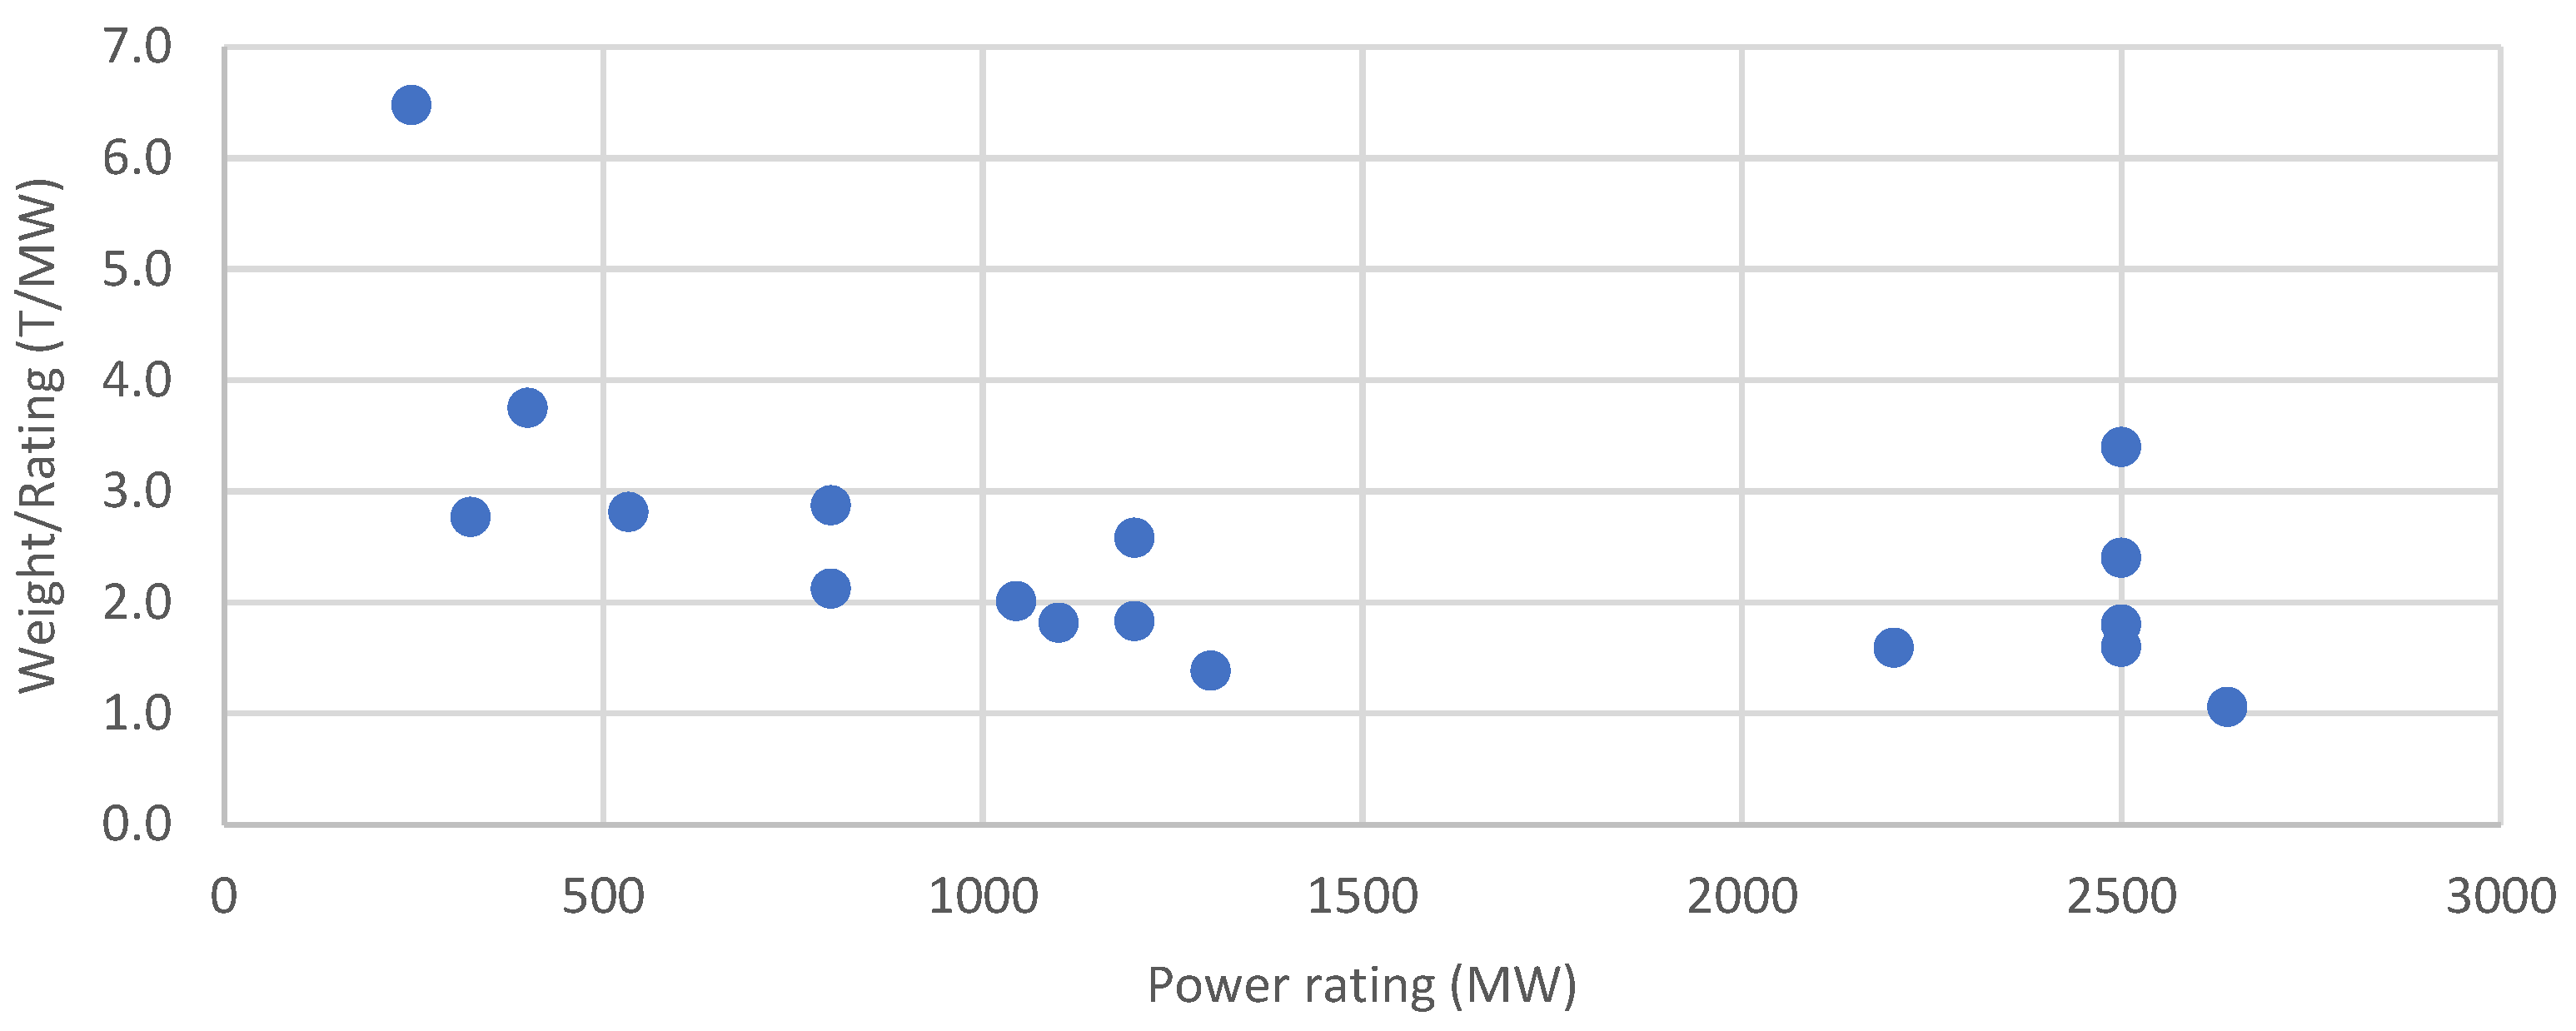
2.3. Topsides
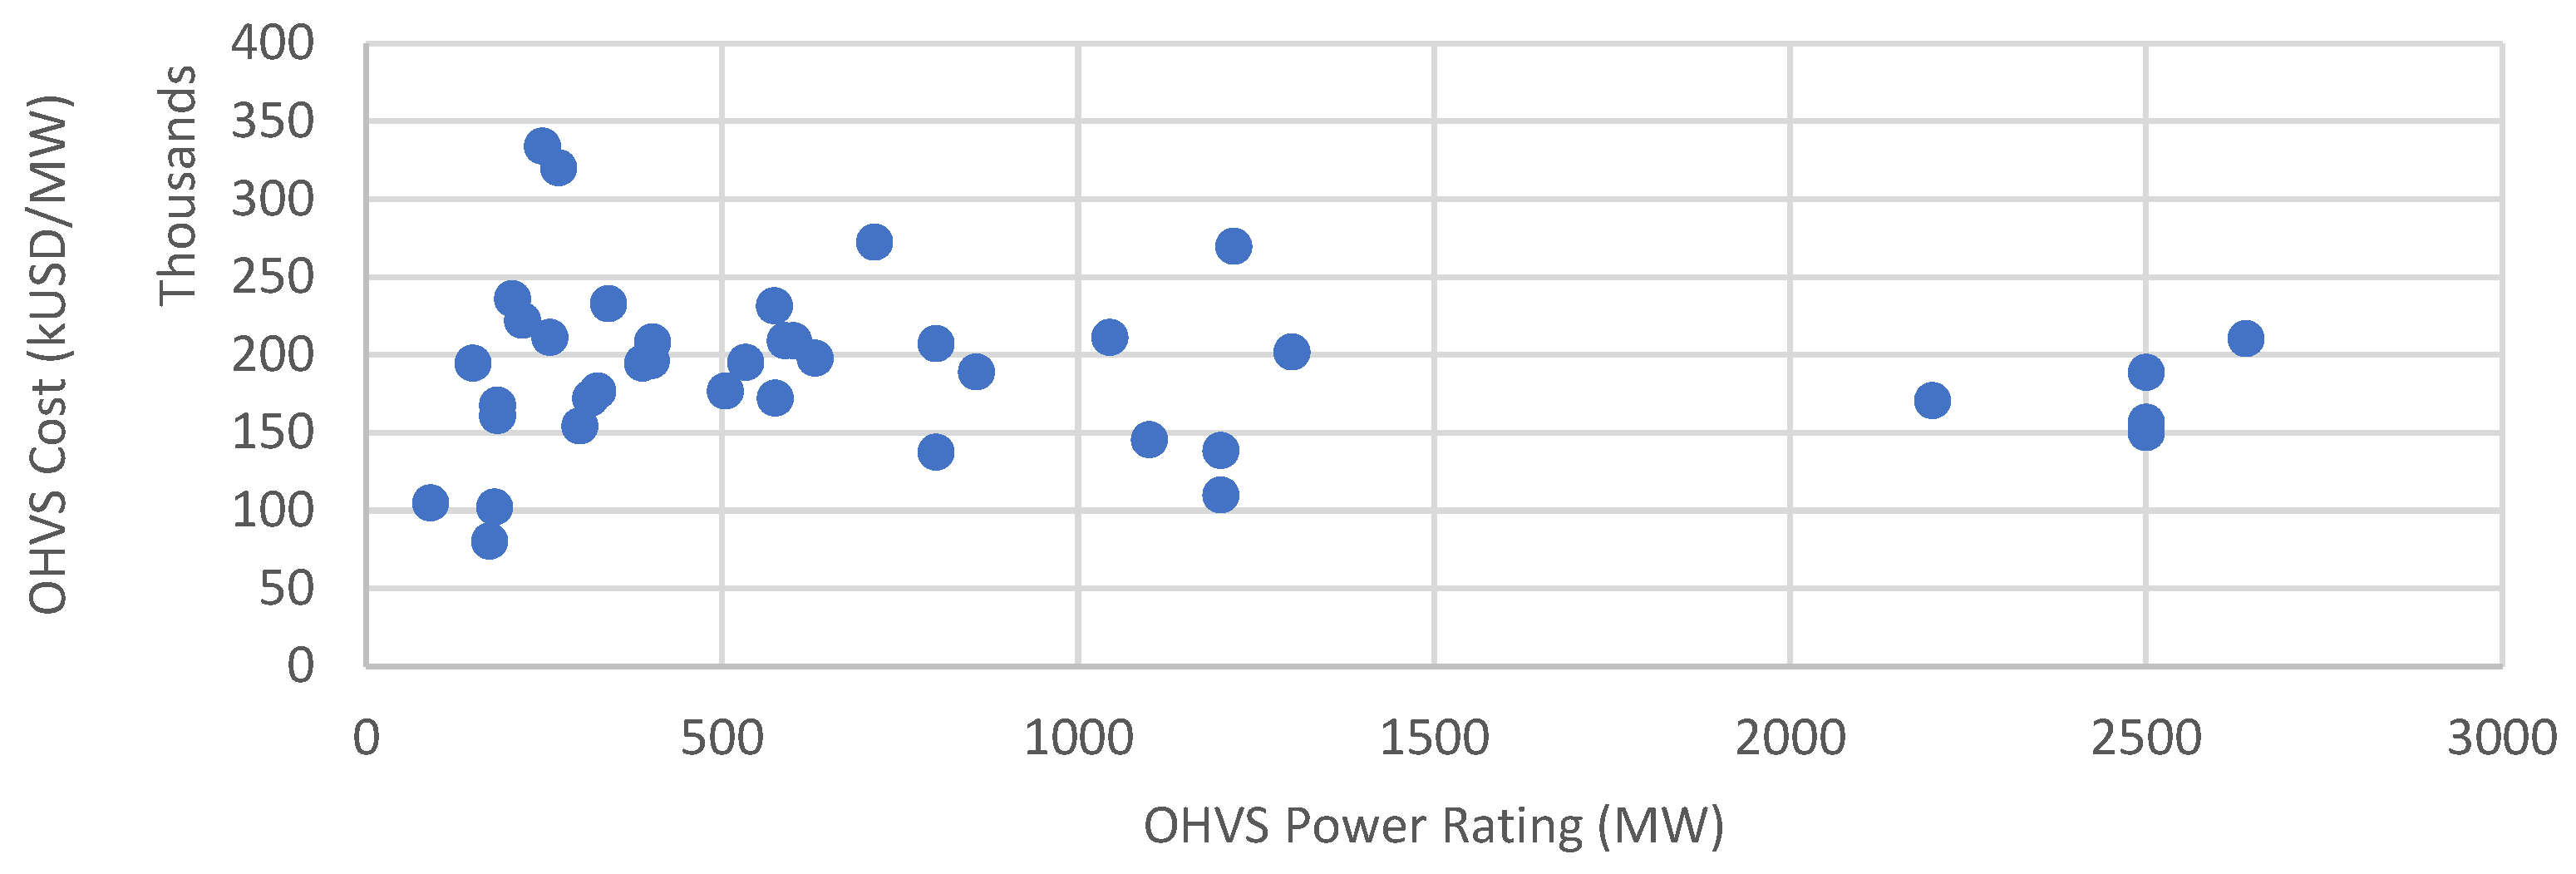
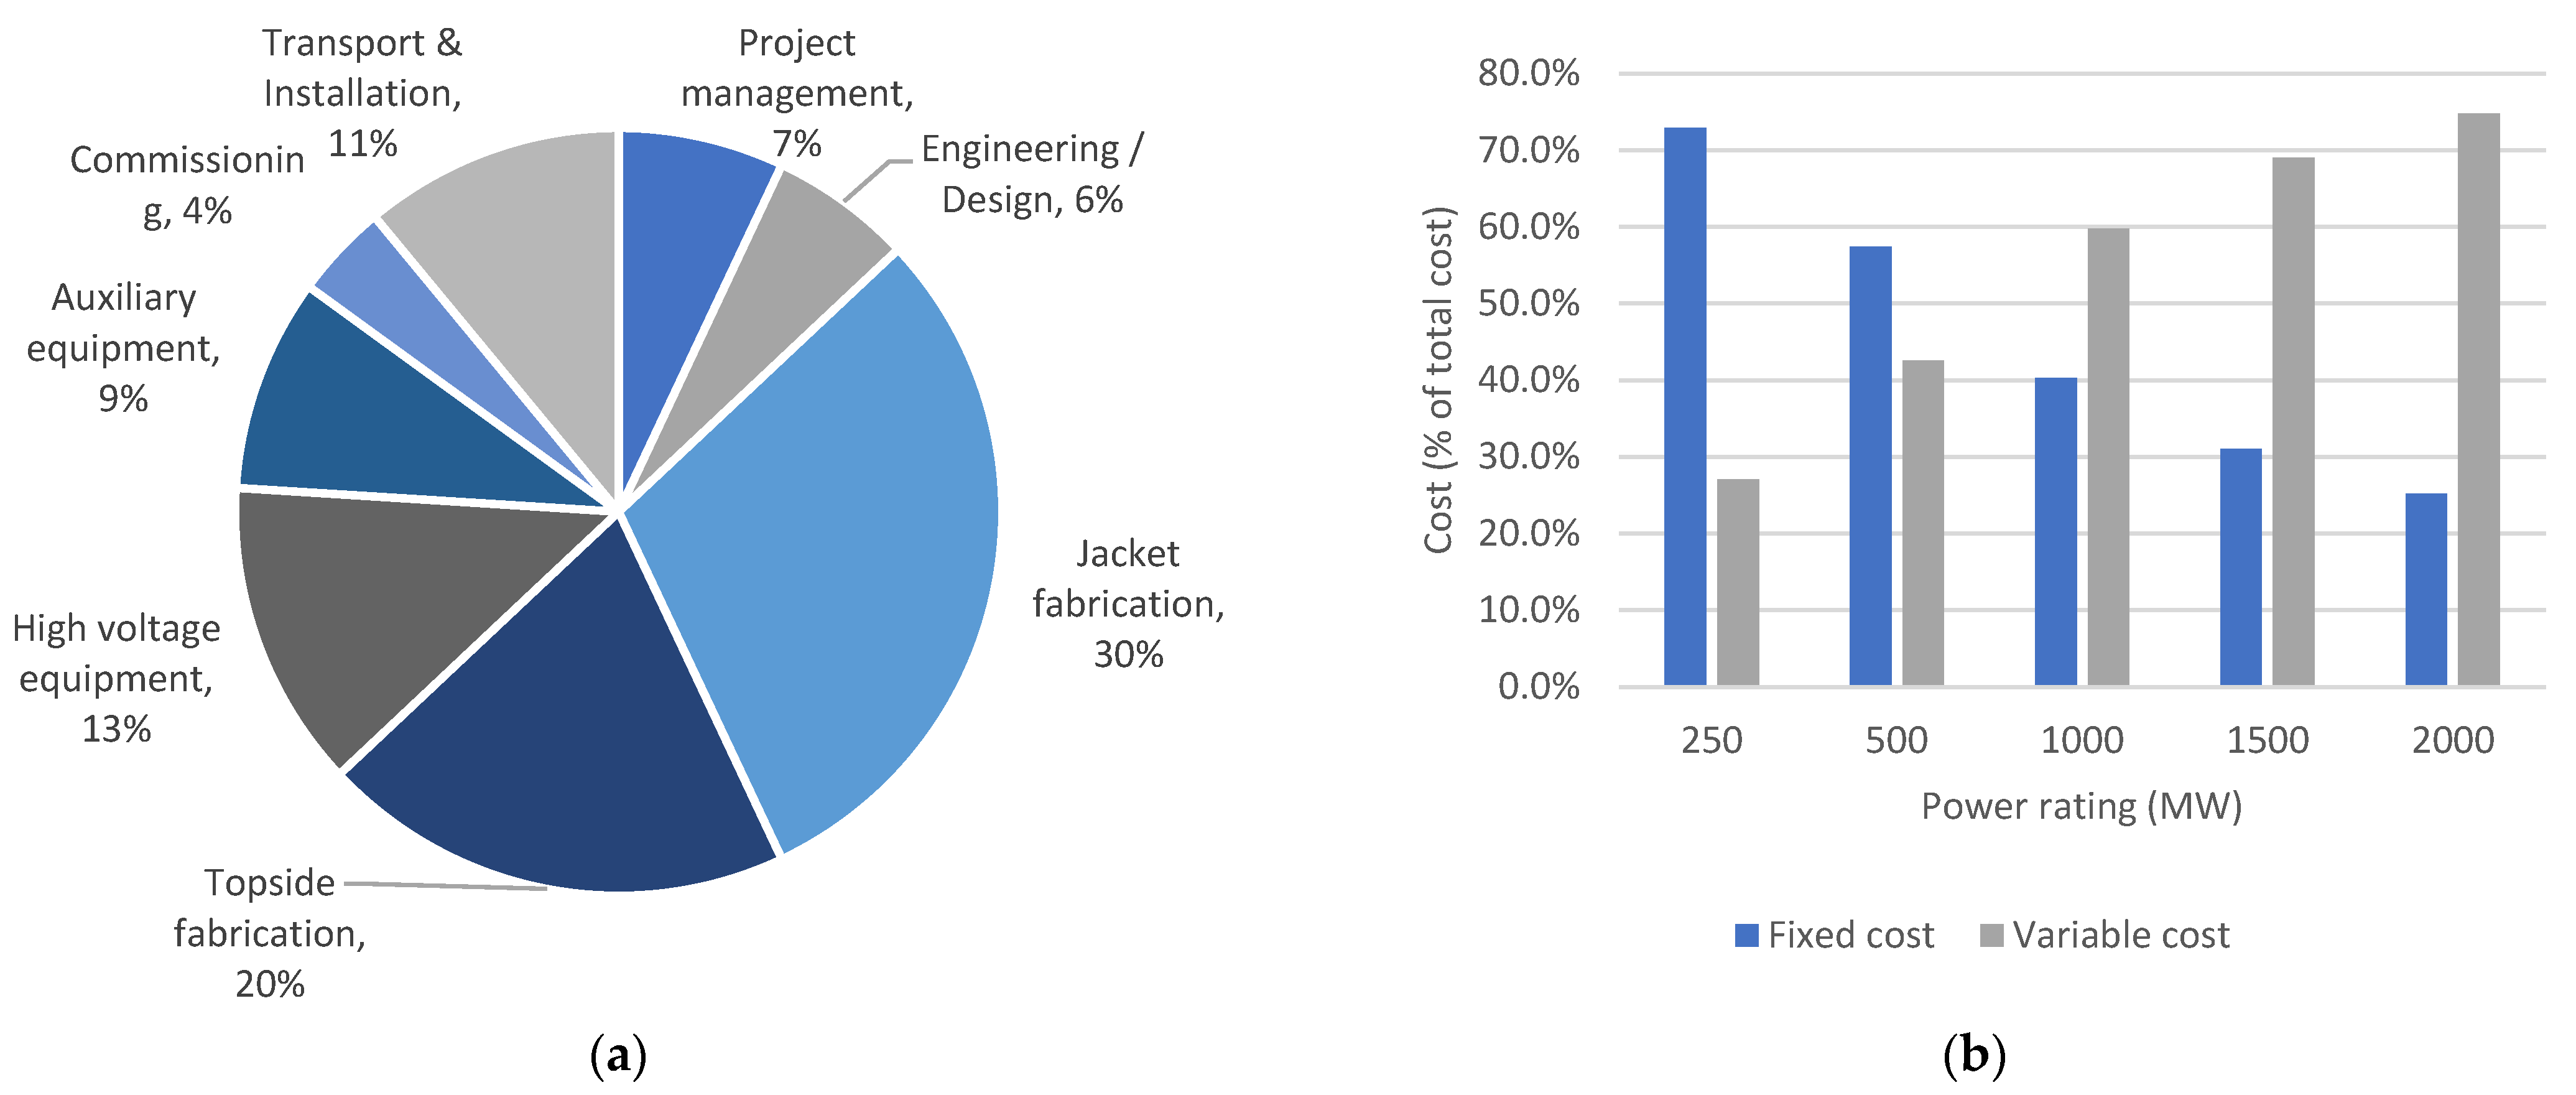
2.4. HVAC OHVS Benchmarking
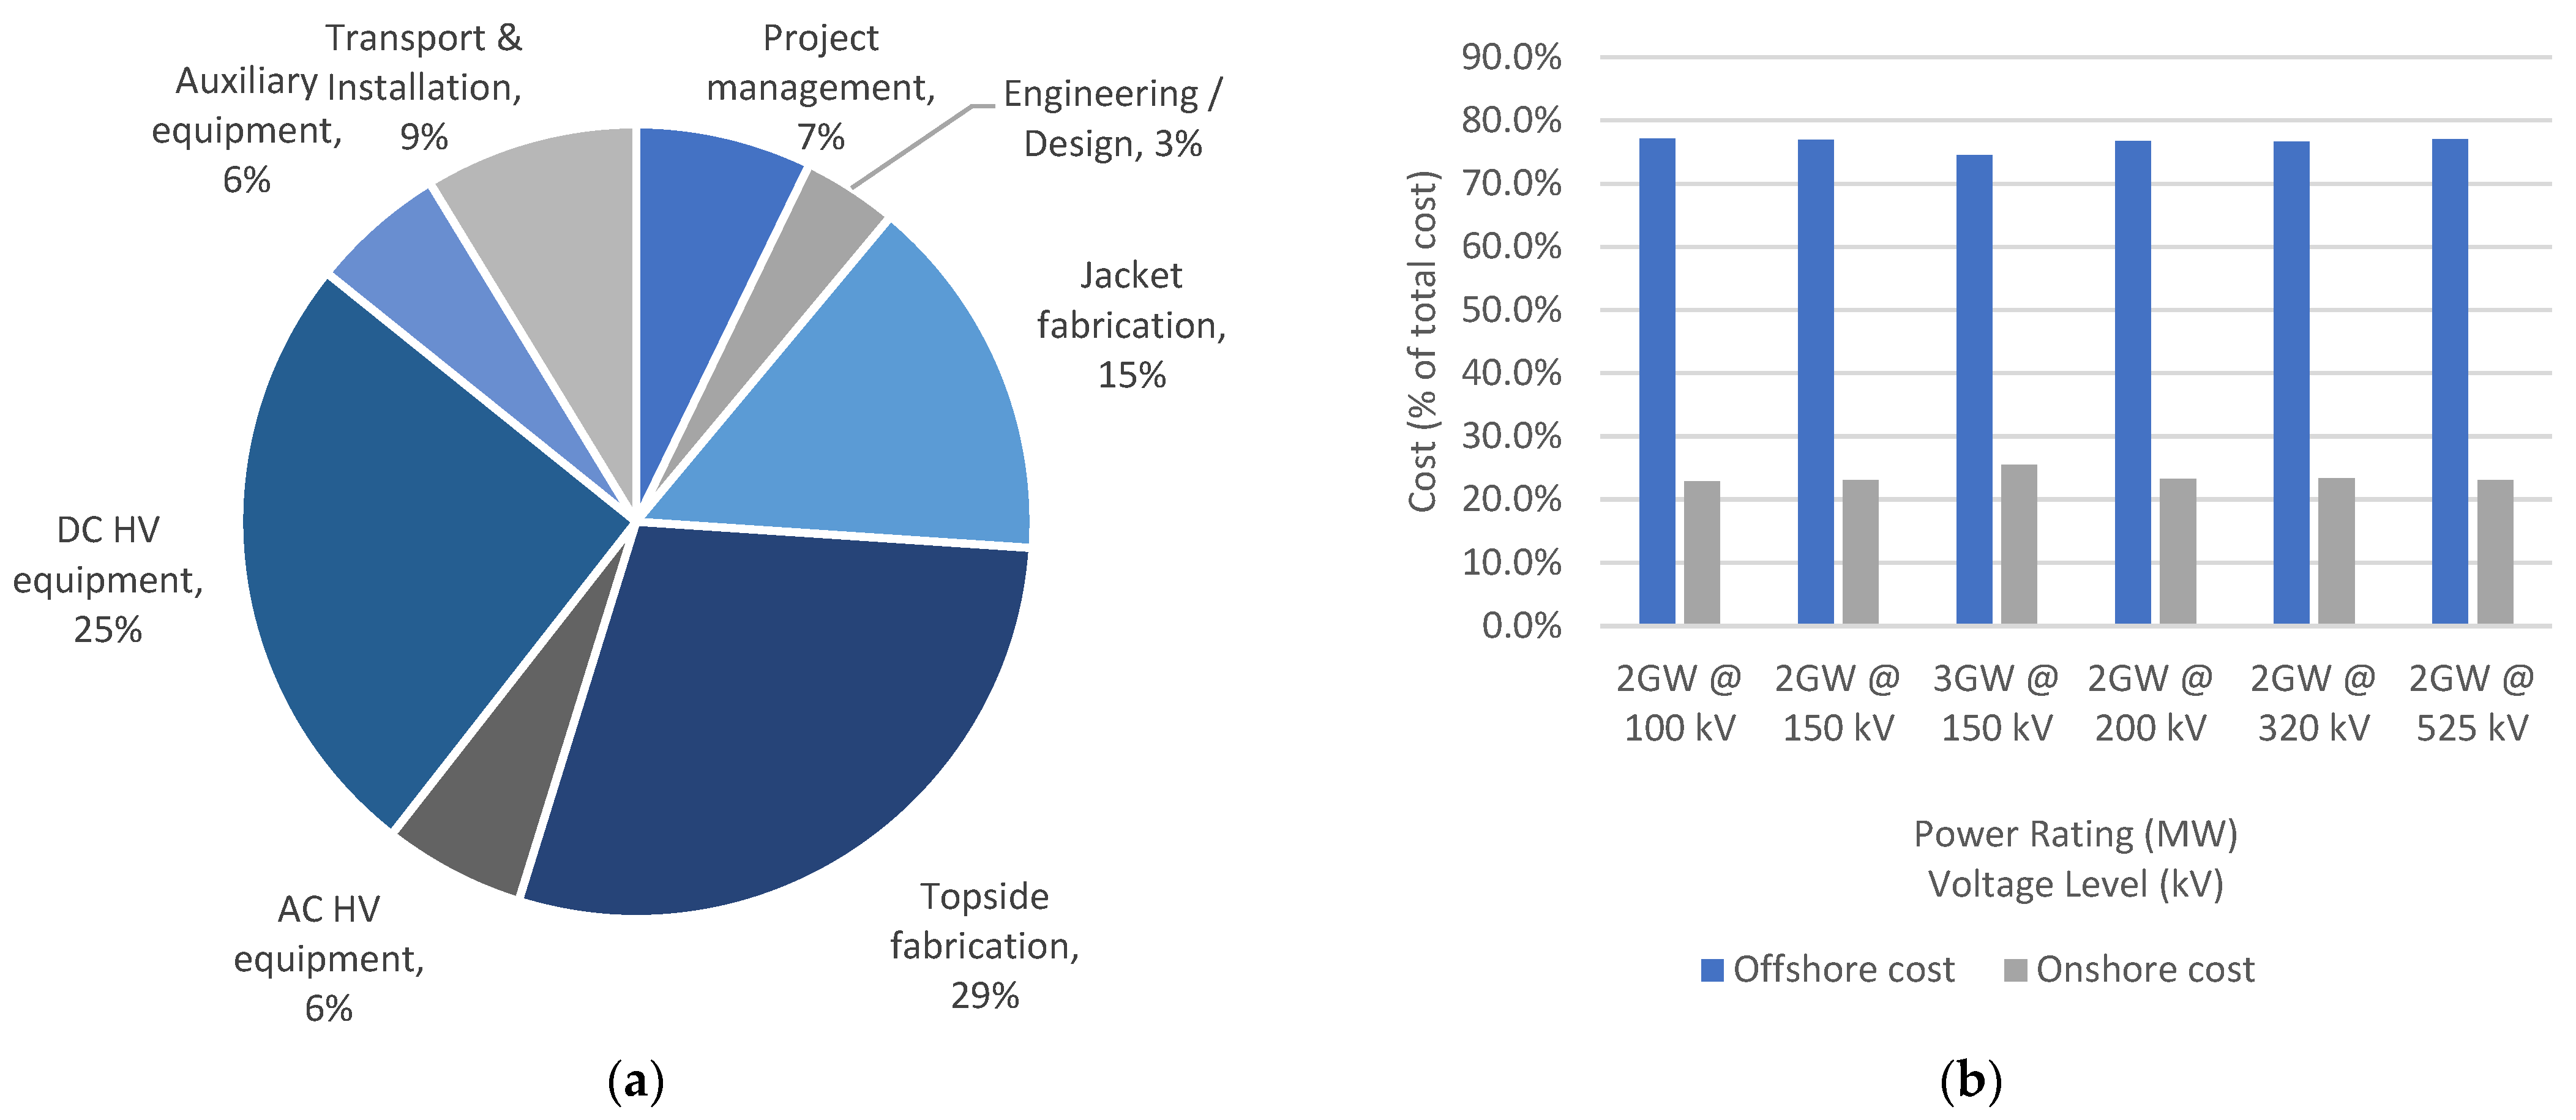
2.5. HVDC OHVS Benchmarking
2.6. System Efficiency, Resilience and Reliability
3. Methods
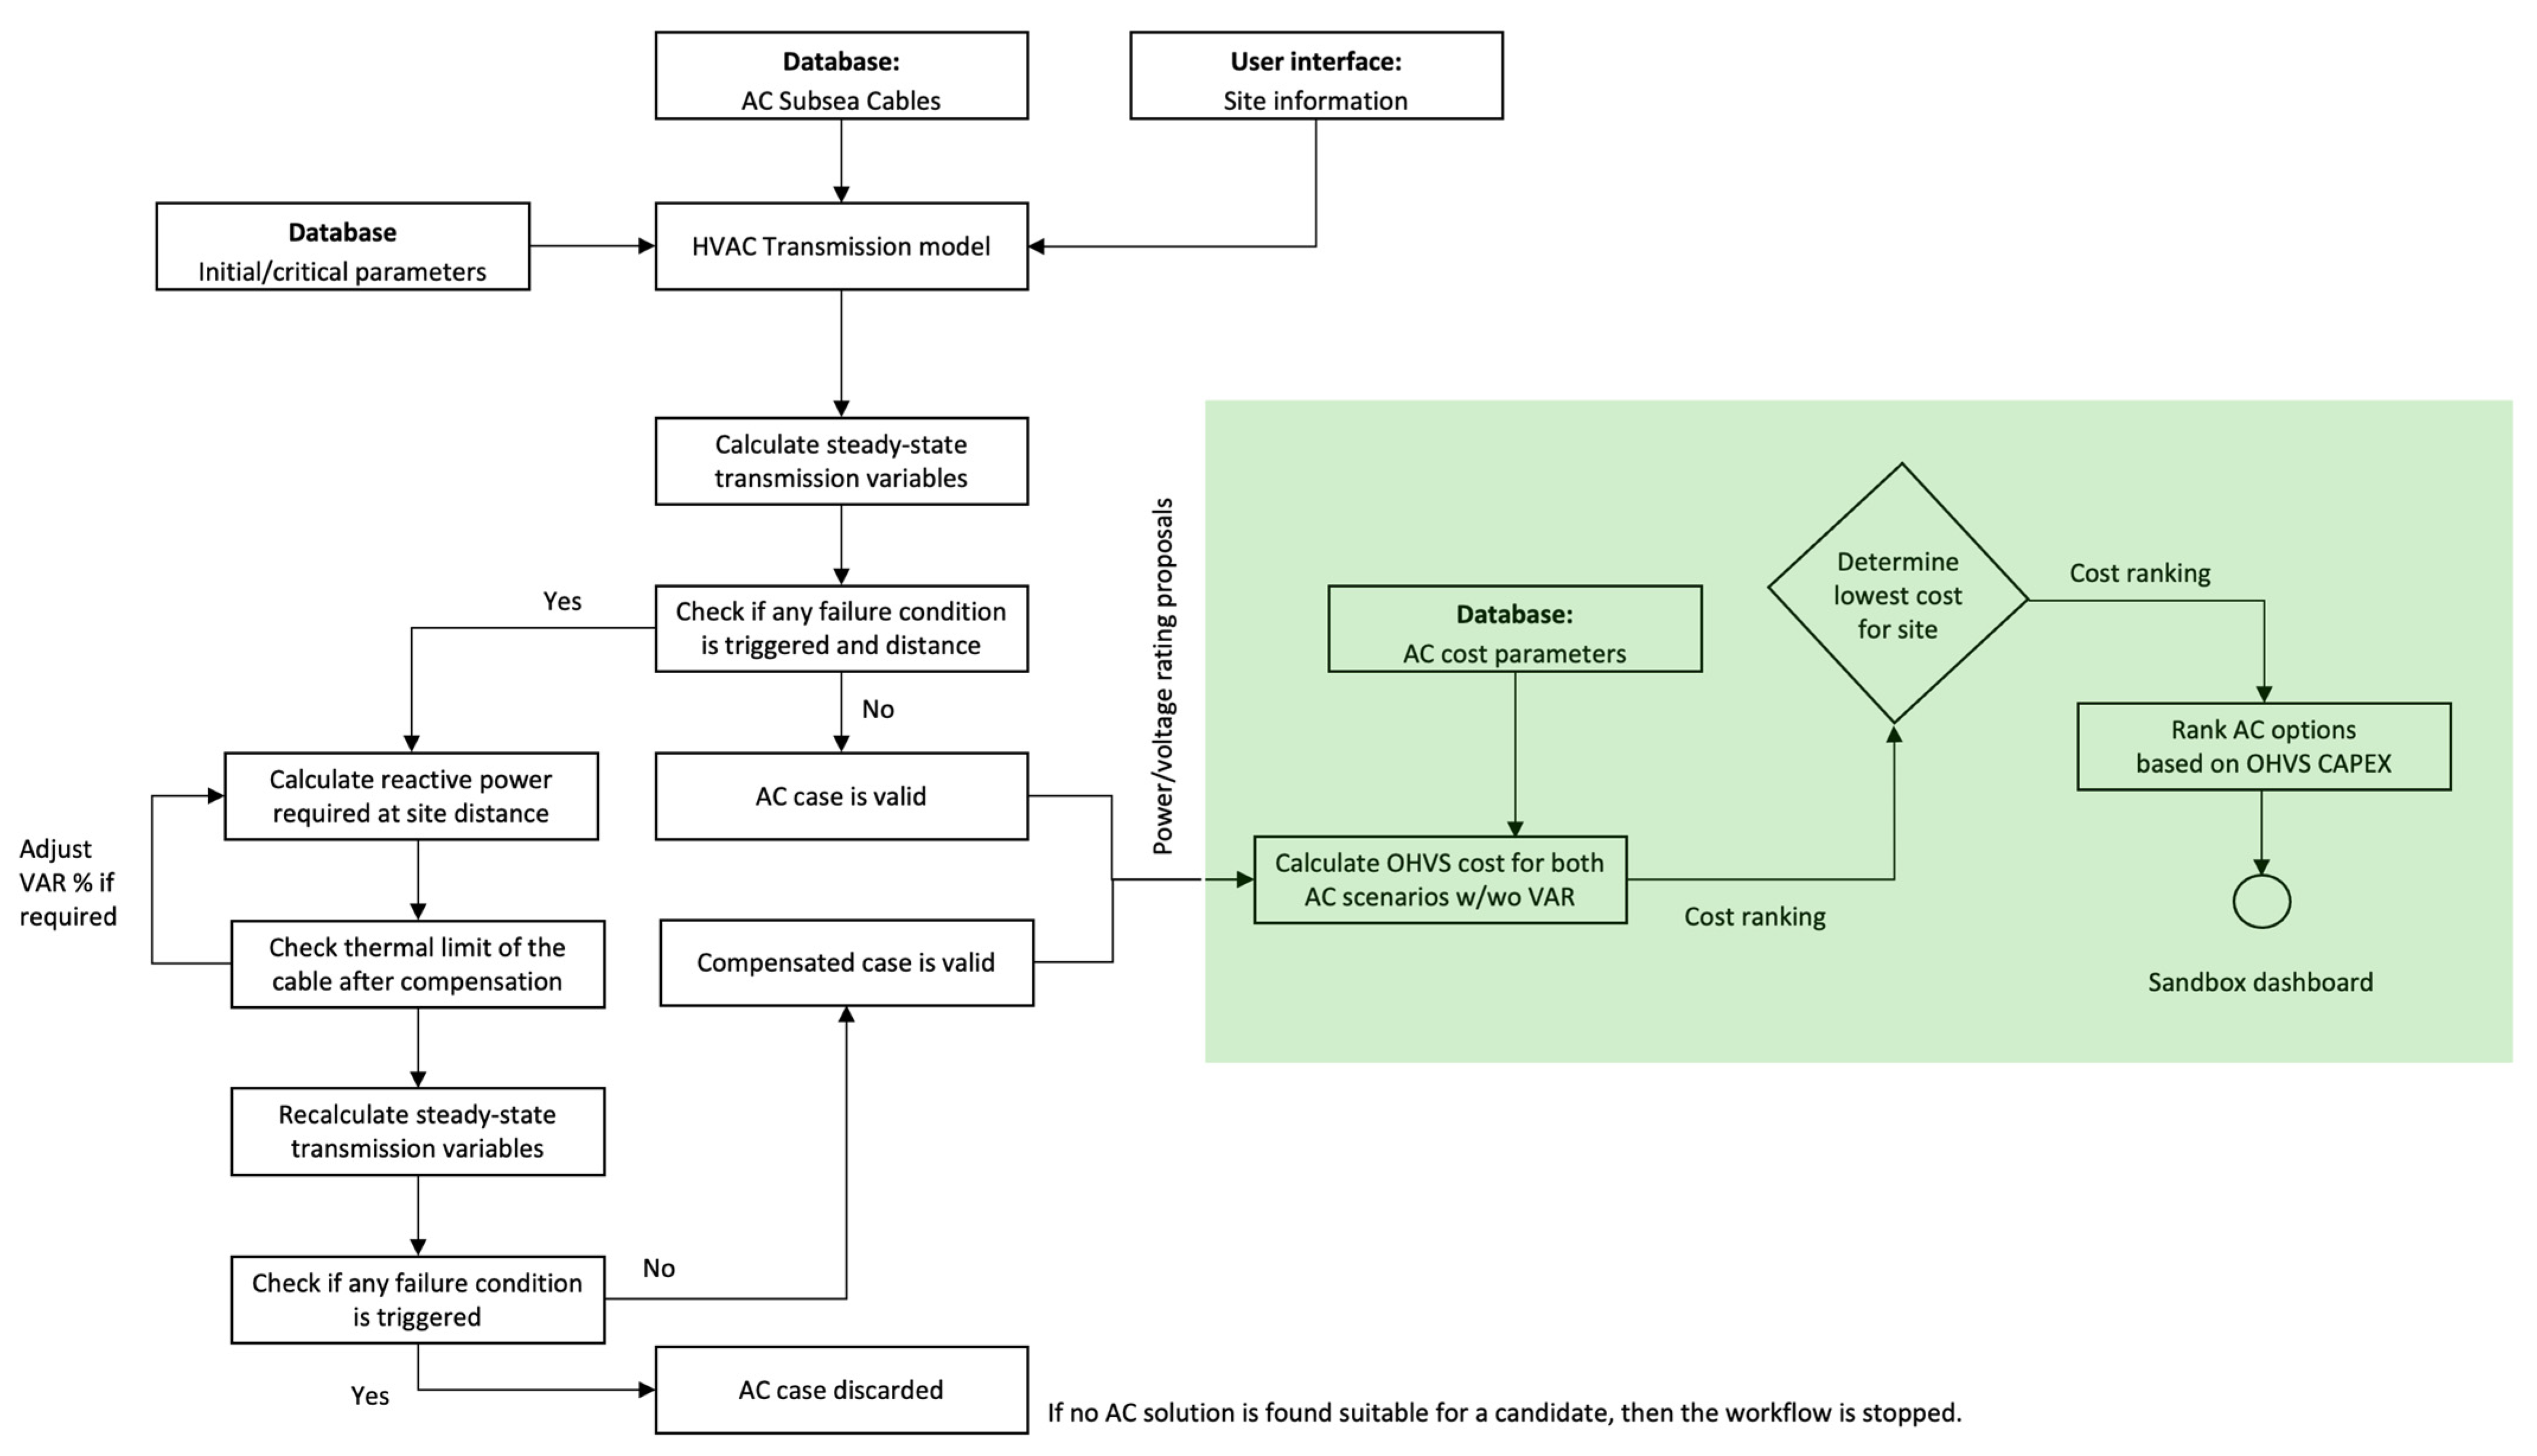
- Knowledge base: Technical and commercial benchmarking of AC OHVS
- Interface engine: Optioneering algorithm, interfacing the database and user input
- User interface: Technology selection dashboard for input/output engineering
3.1. Interface Engine (Cost Model)
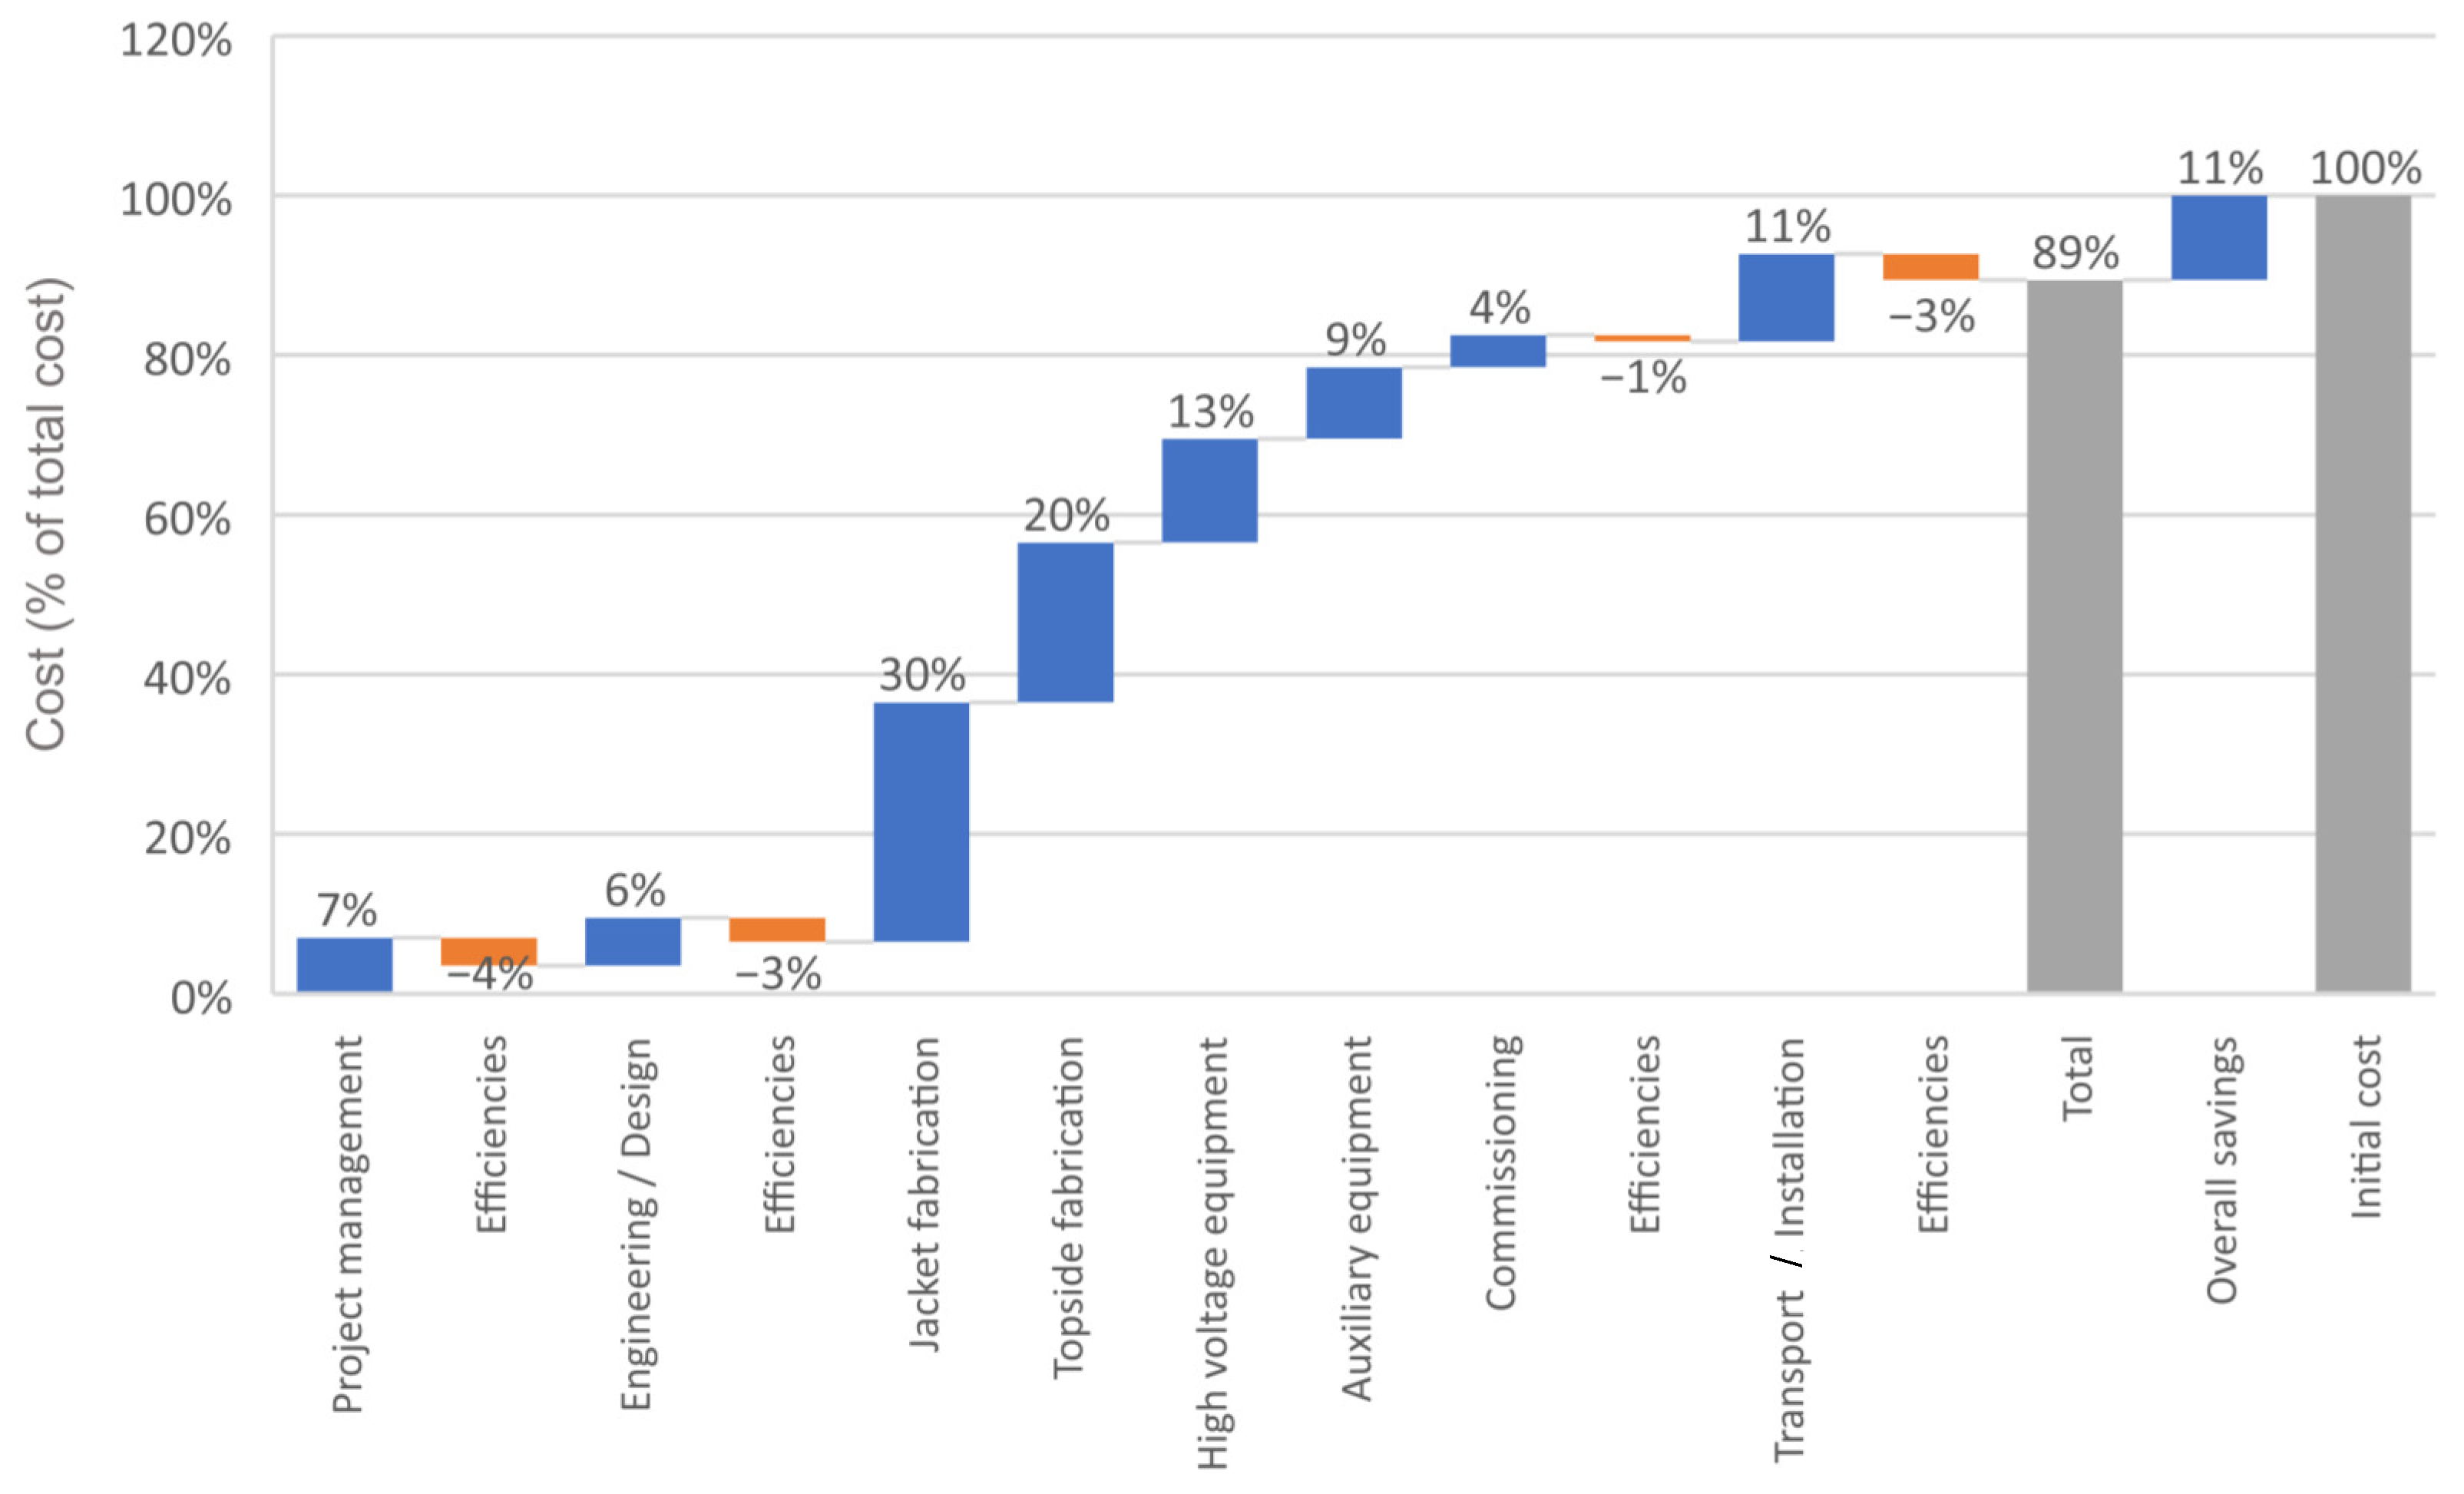
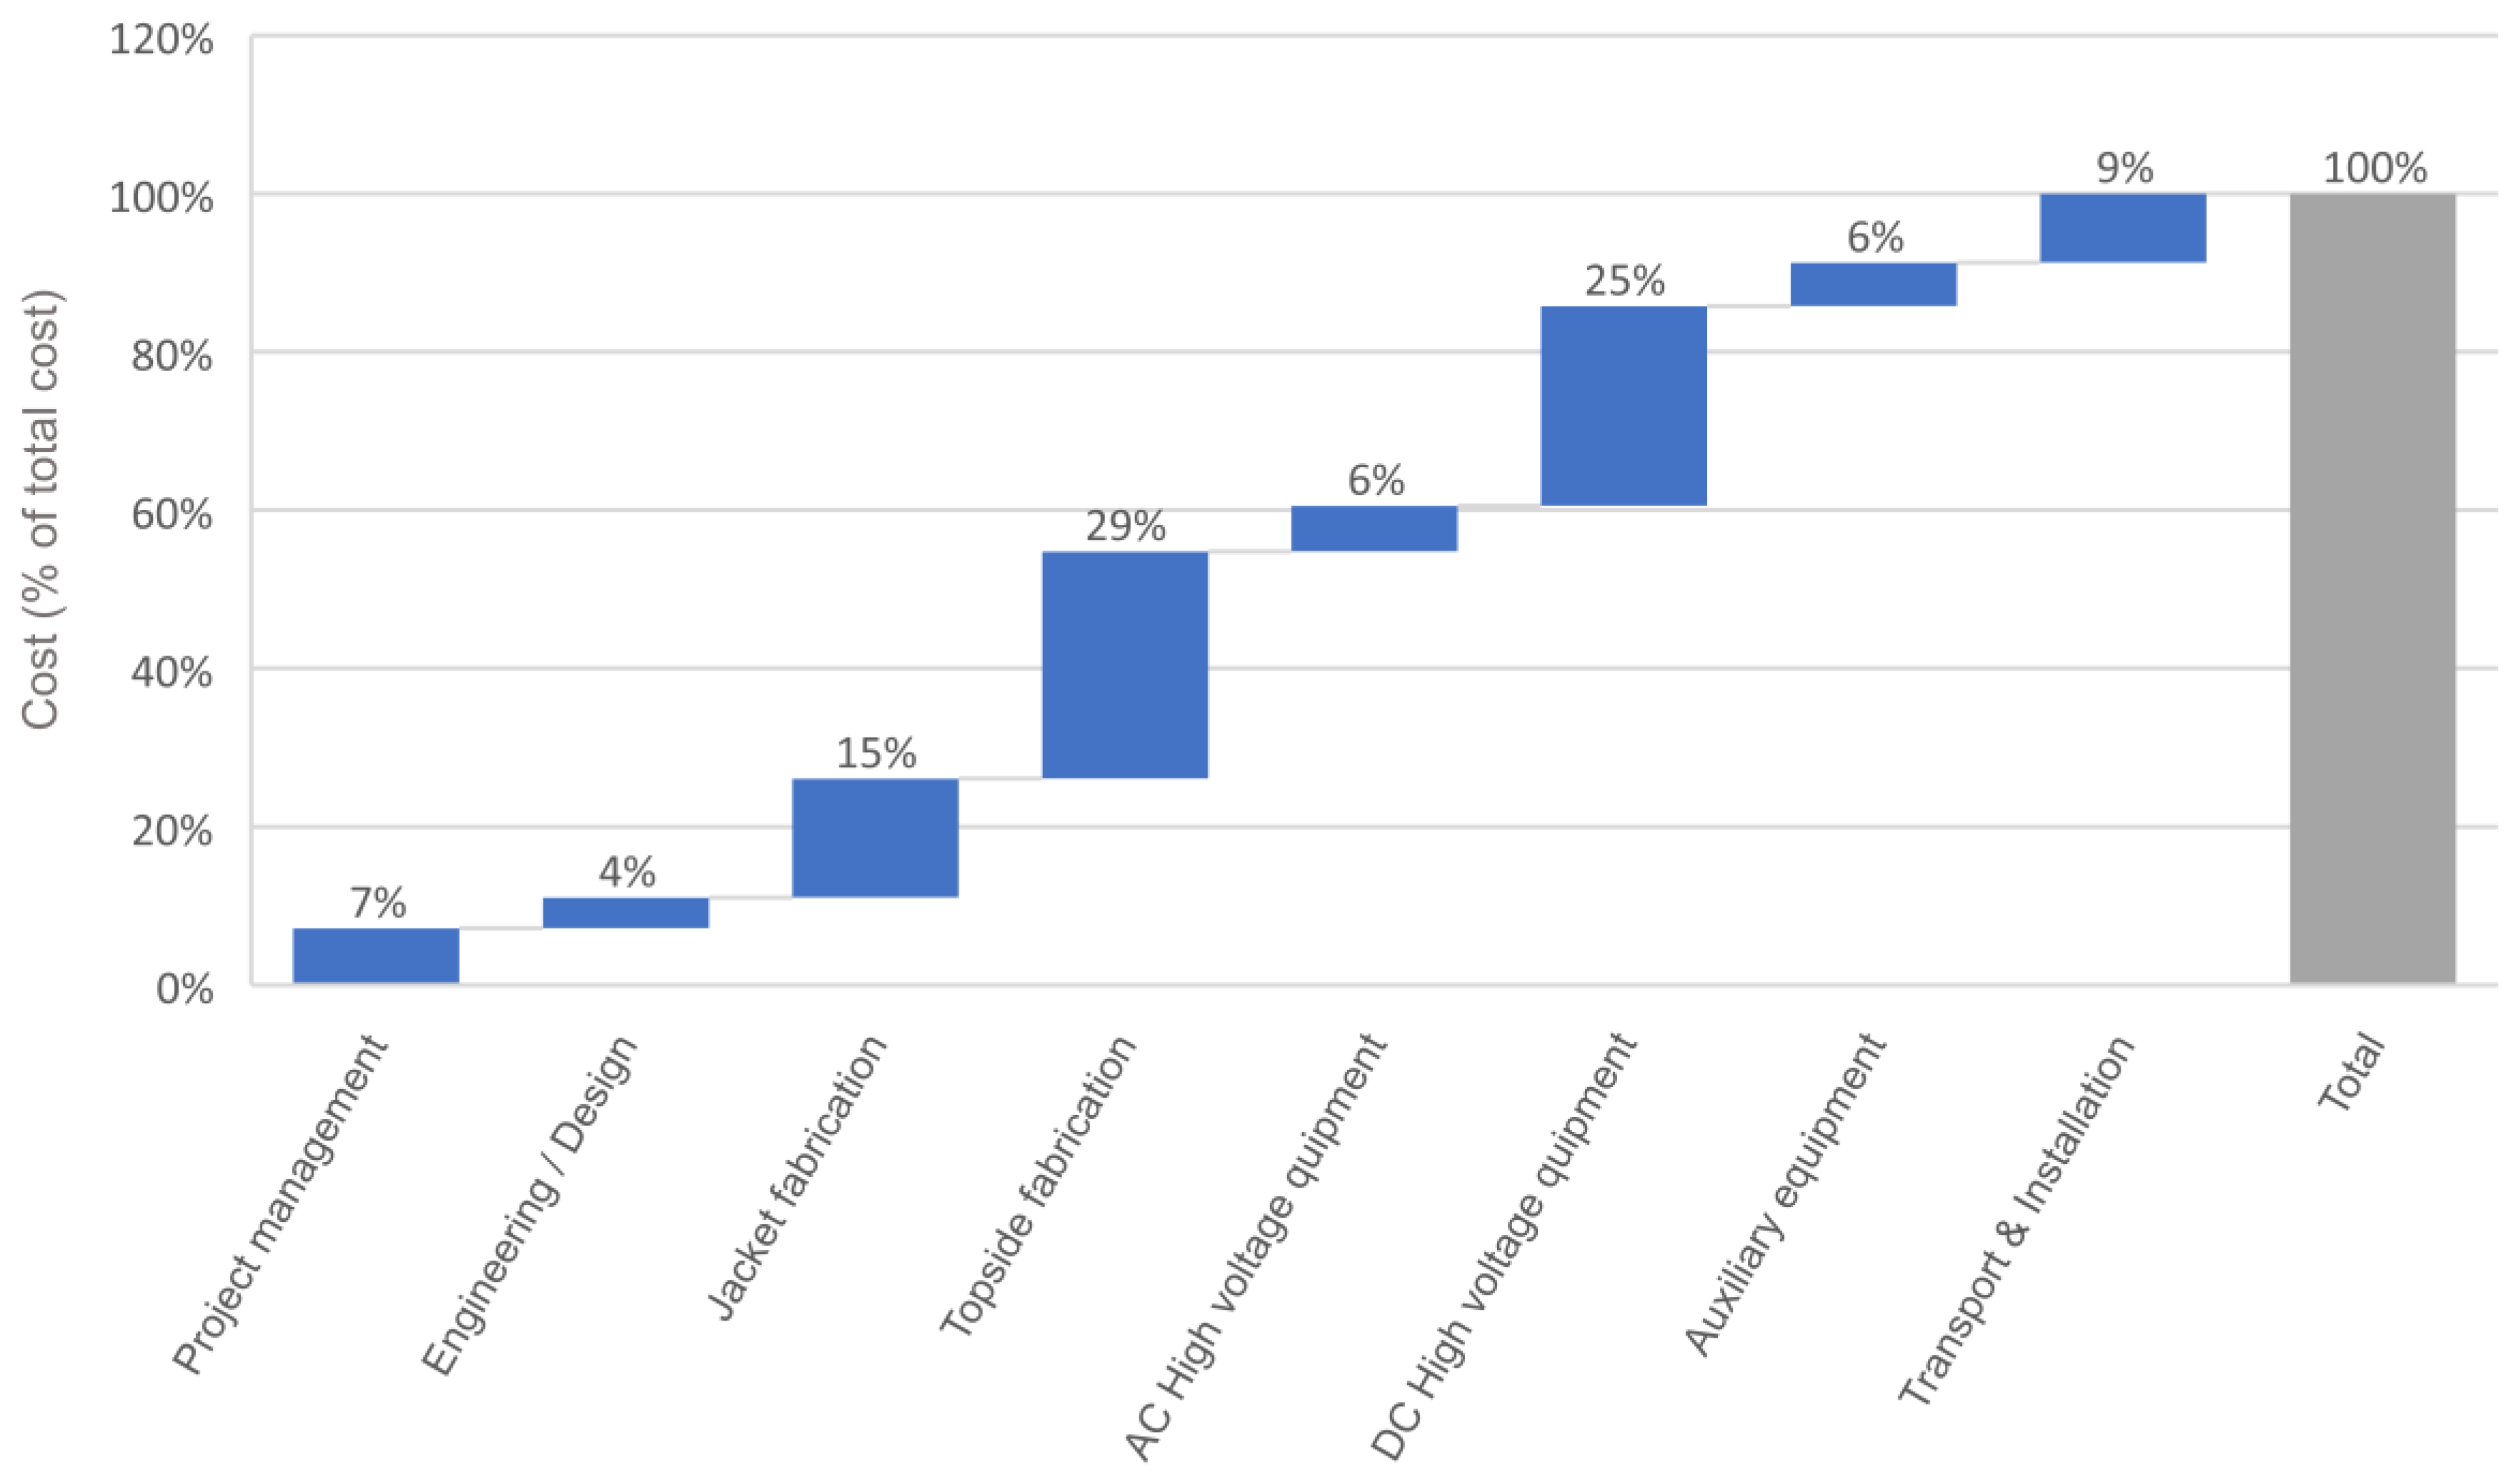
3.2. Cost Model
3.3. User Interface
4. Results
- Validate existing PFS interconnections made in HVAC
- Cross-validate with OWF projects connected in AC
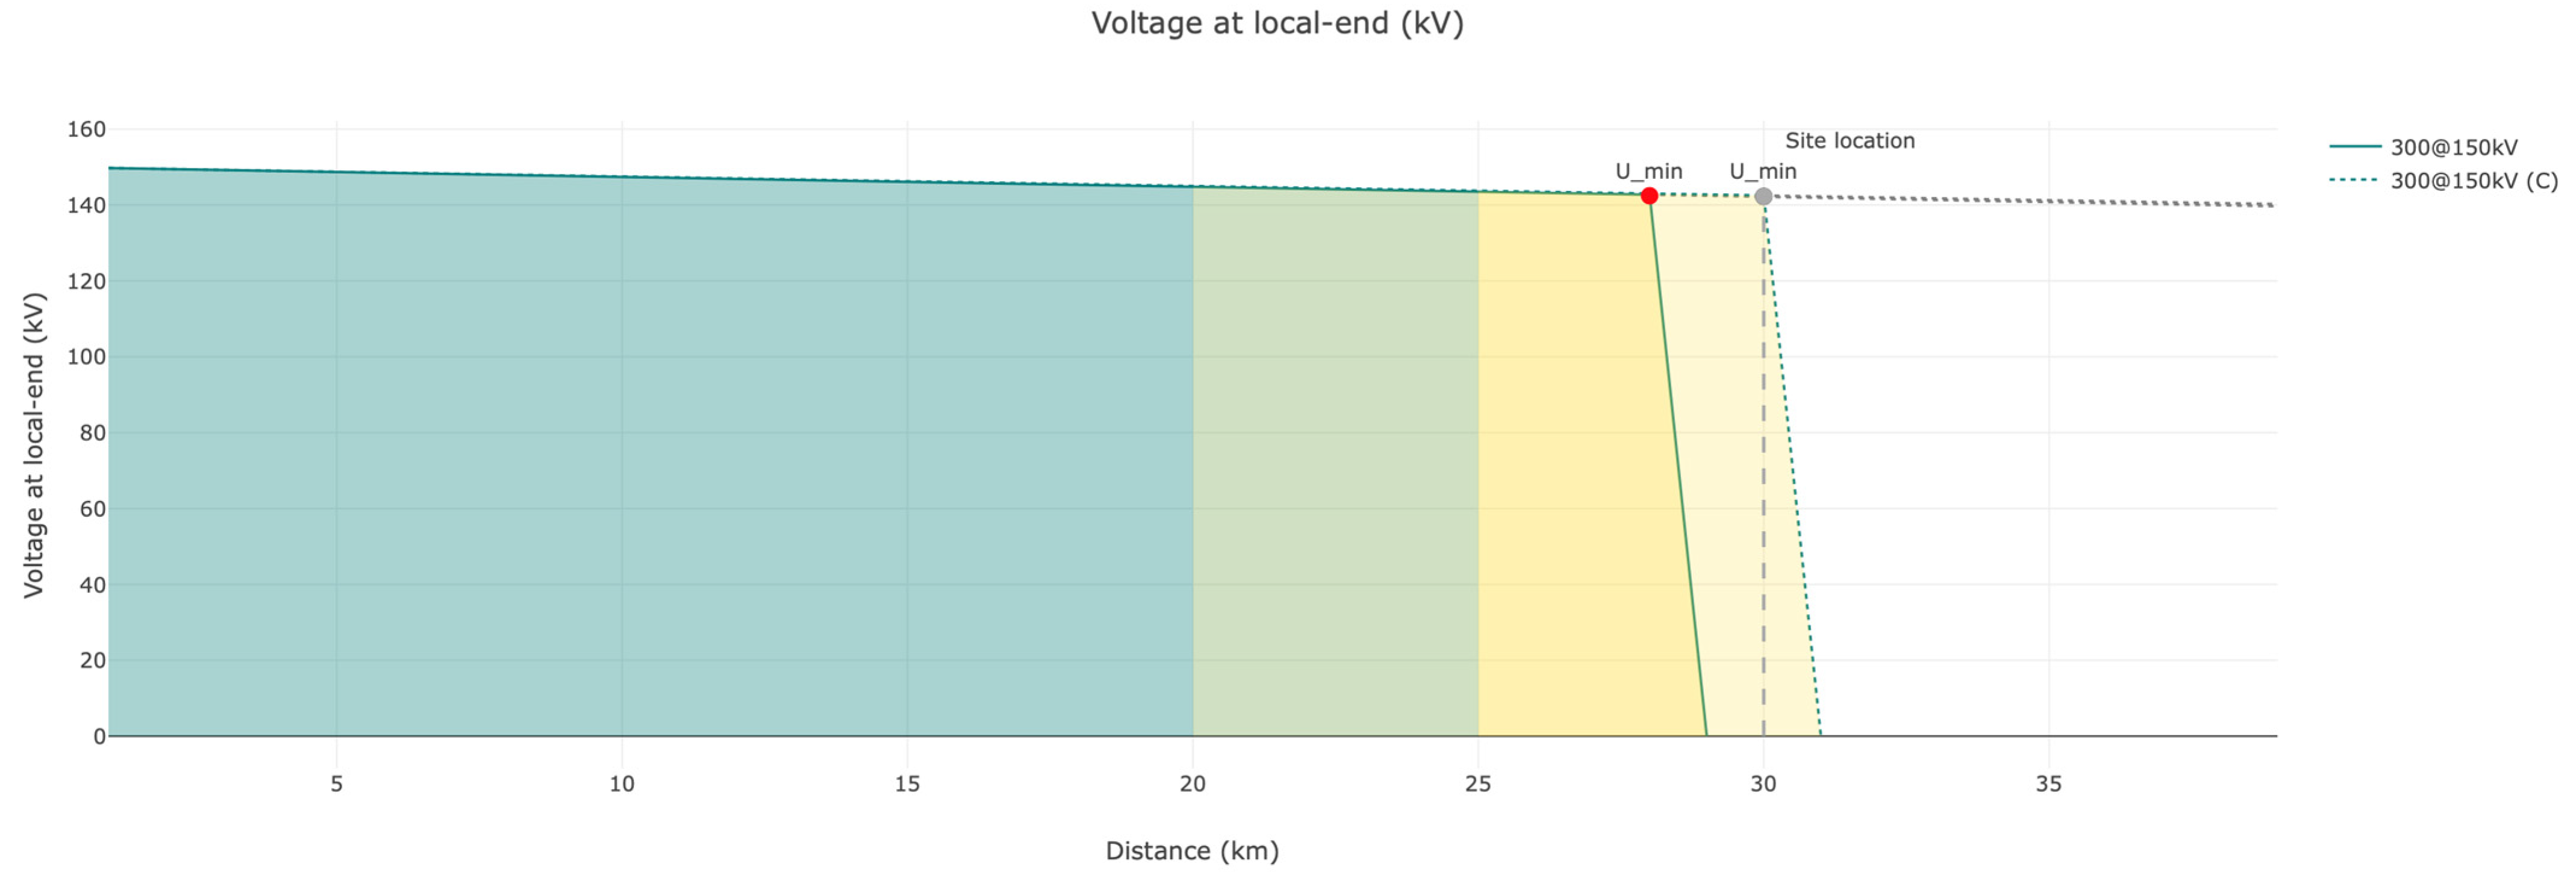
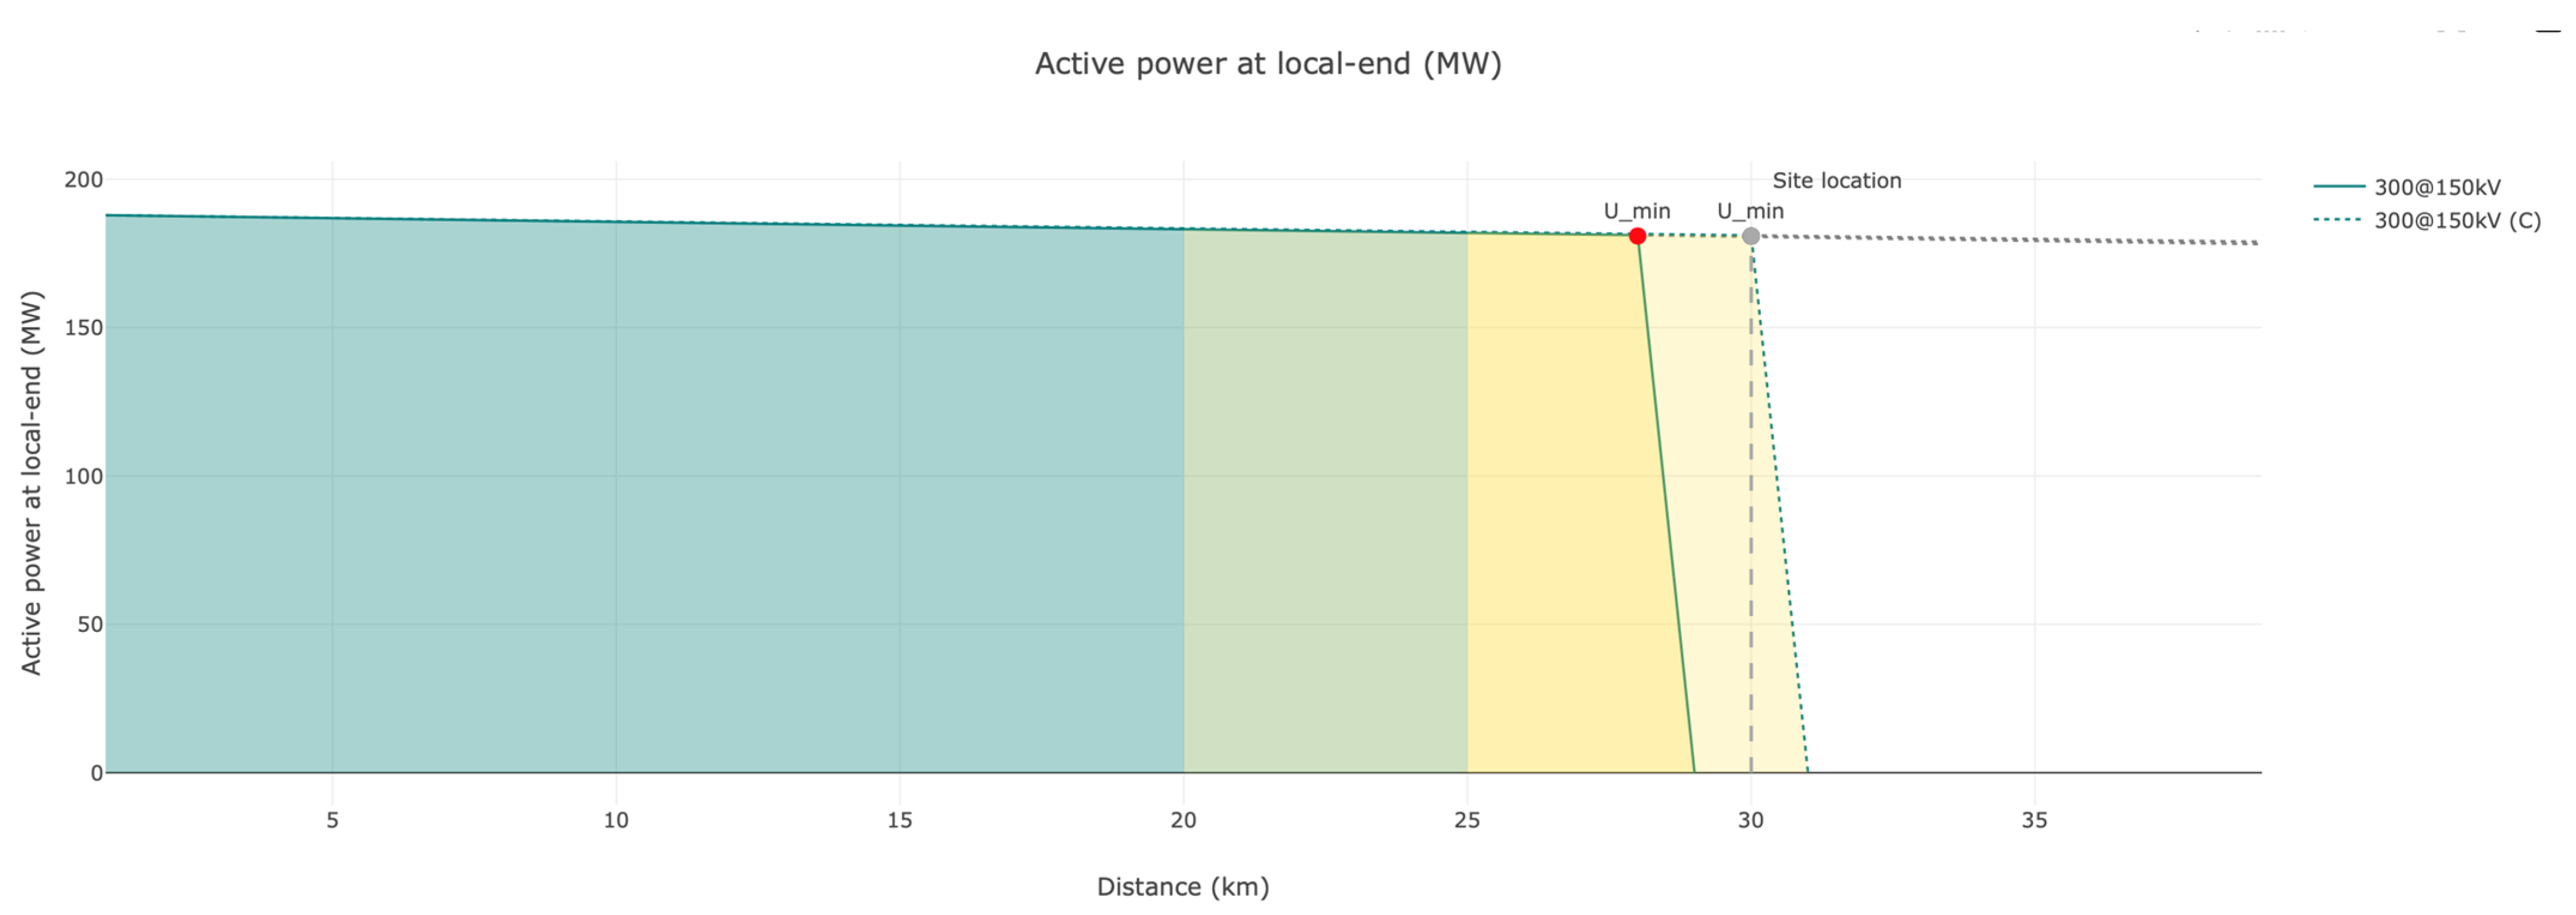
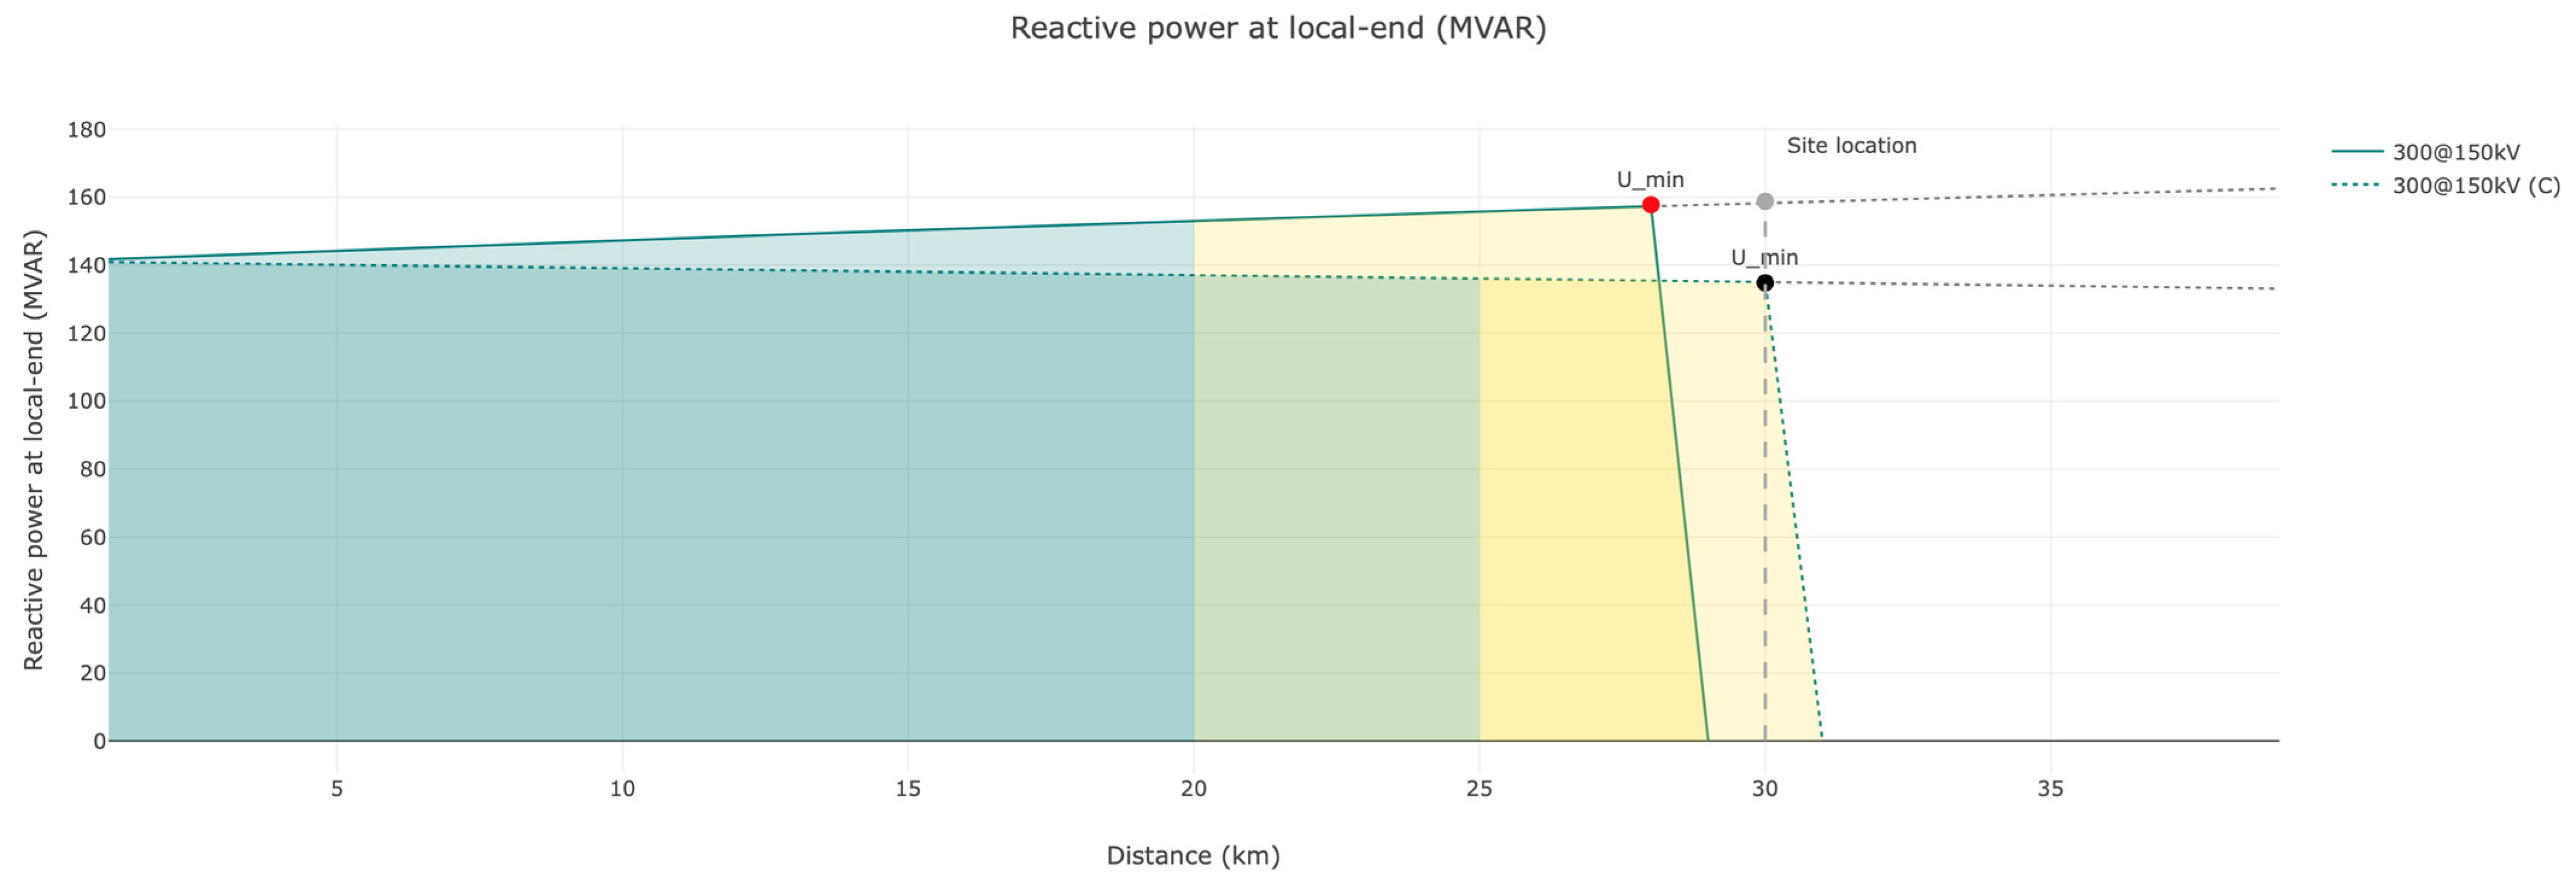
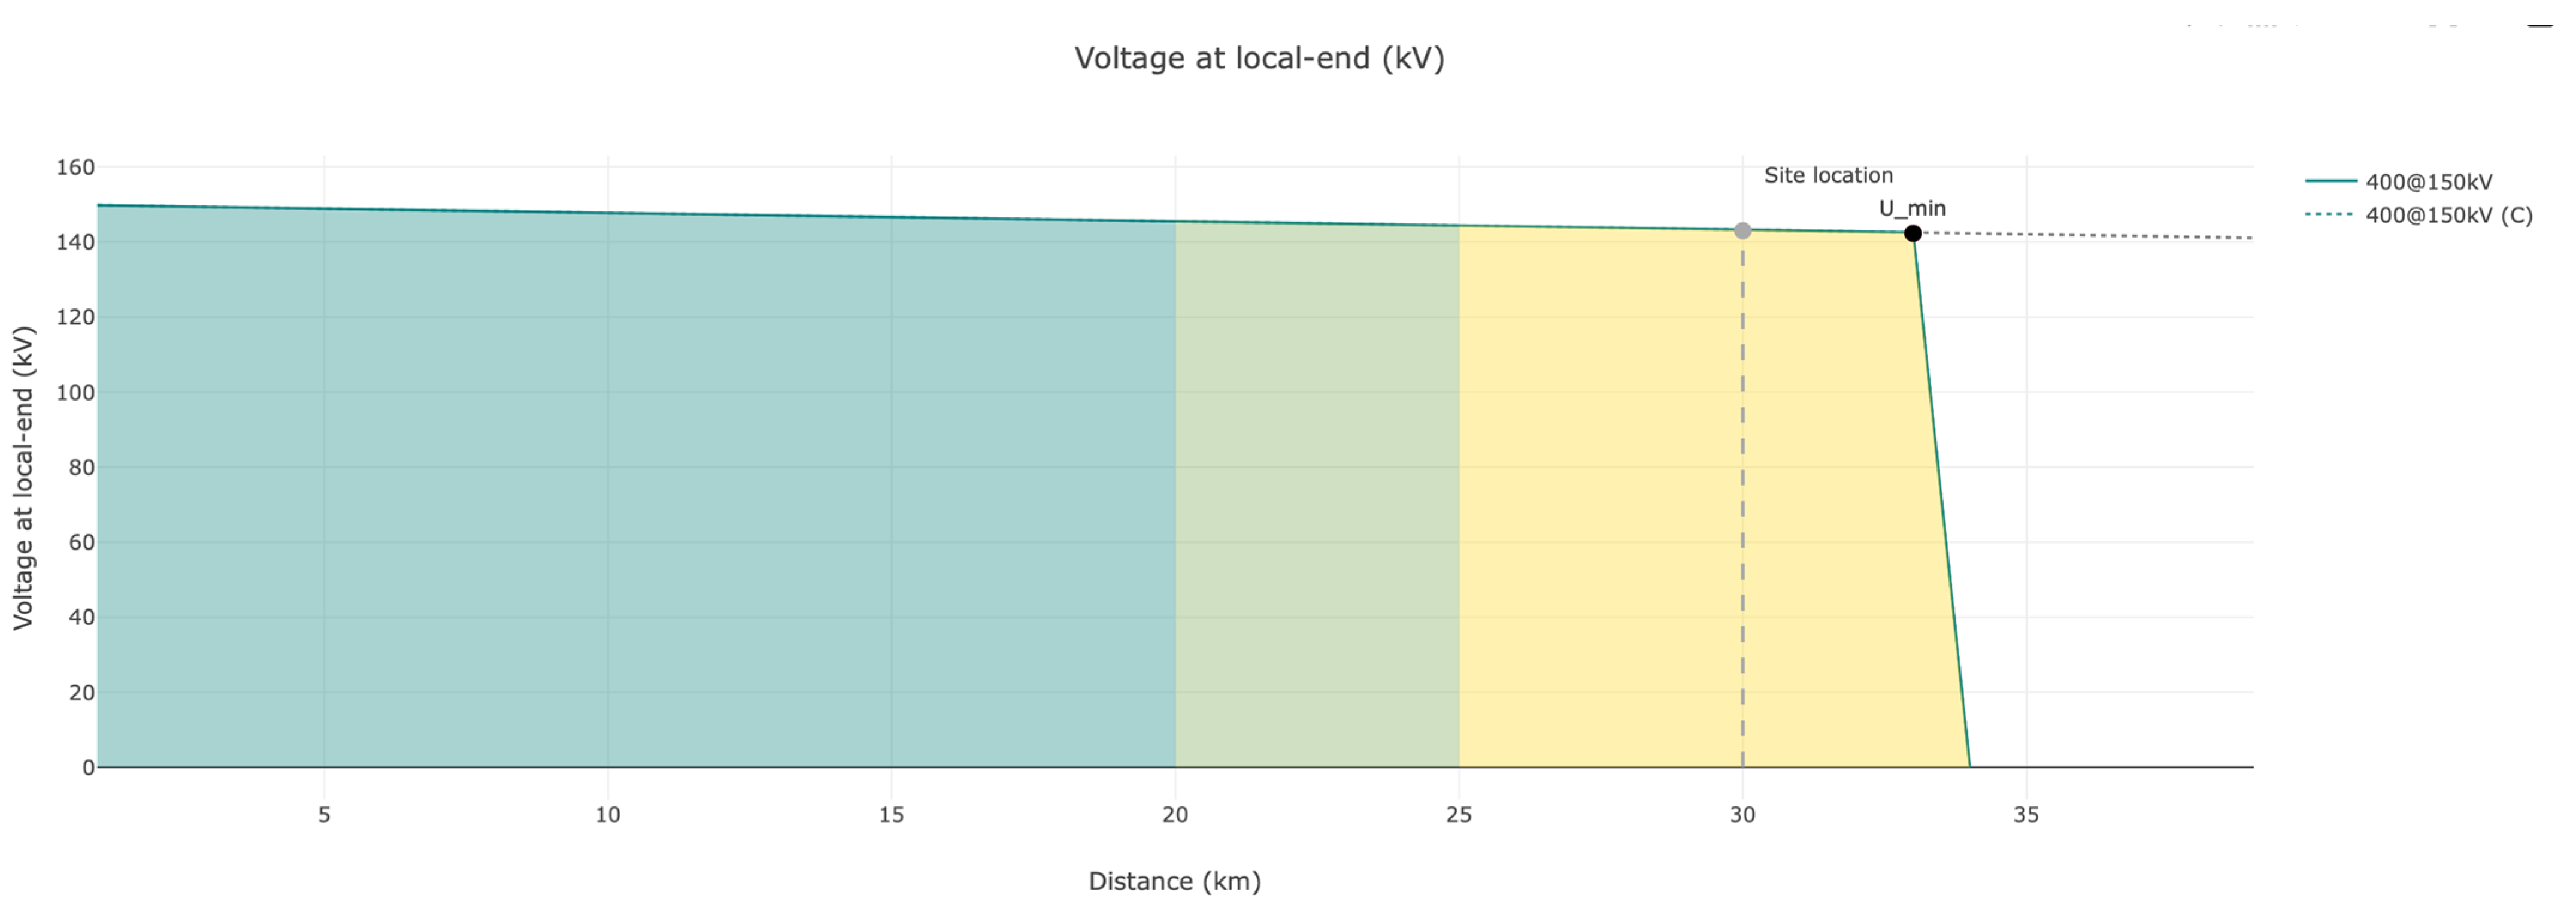
4.1. Model Validation for OWF (Case #1)
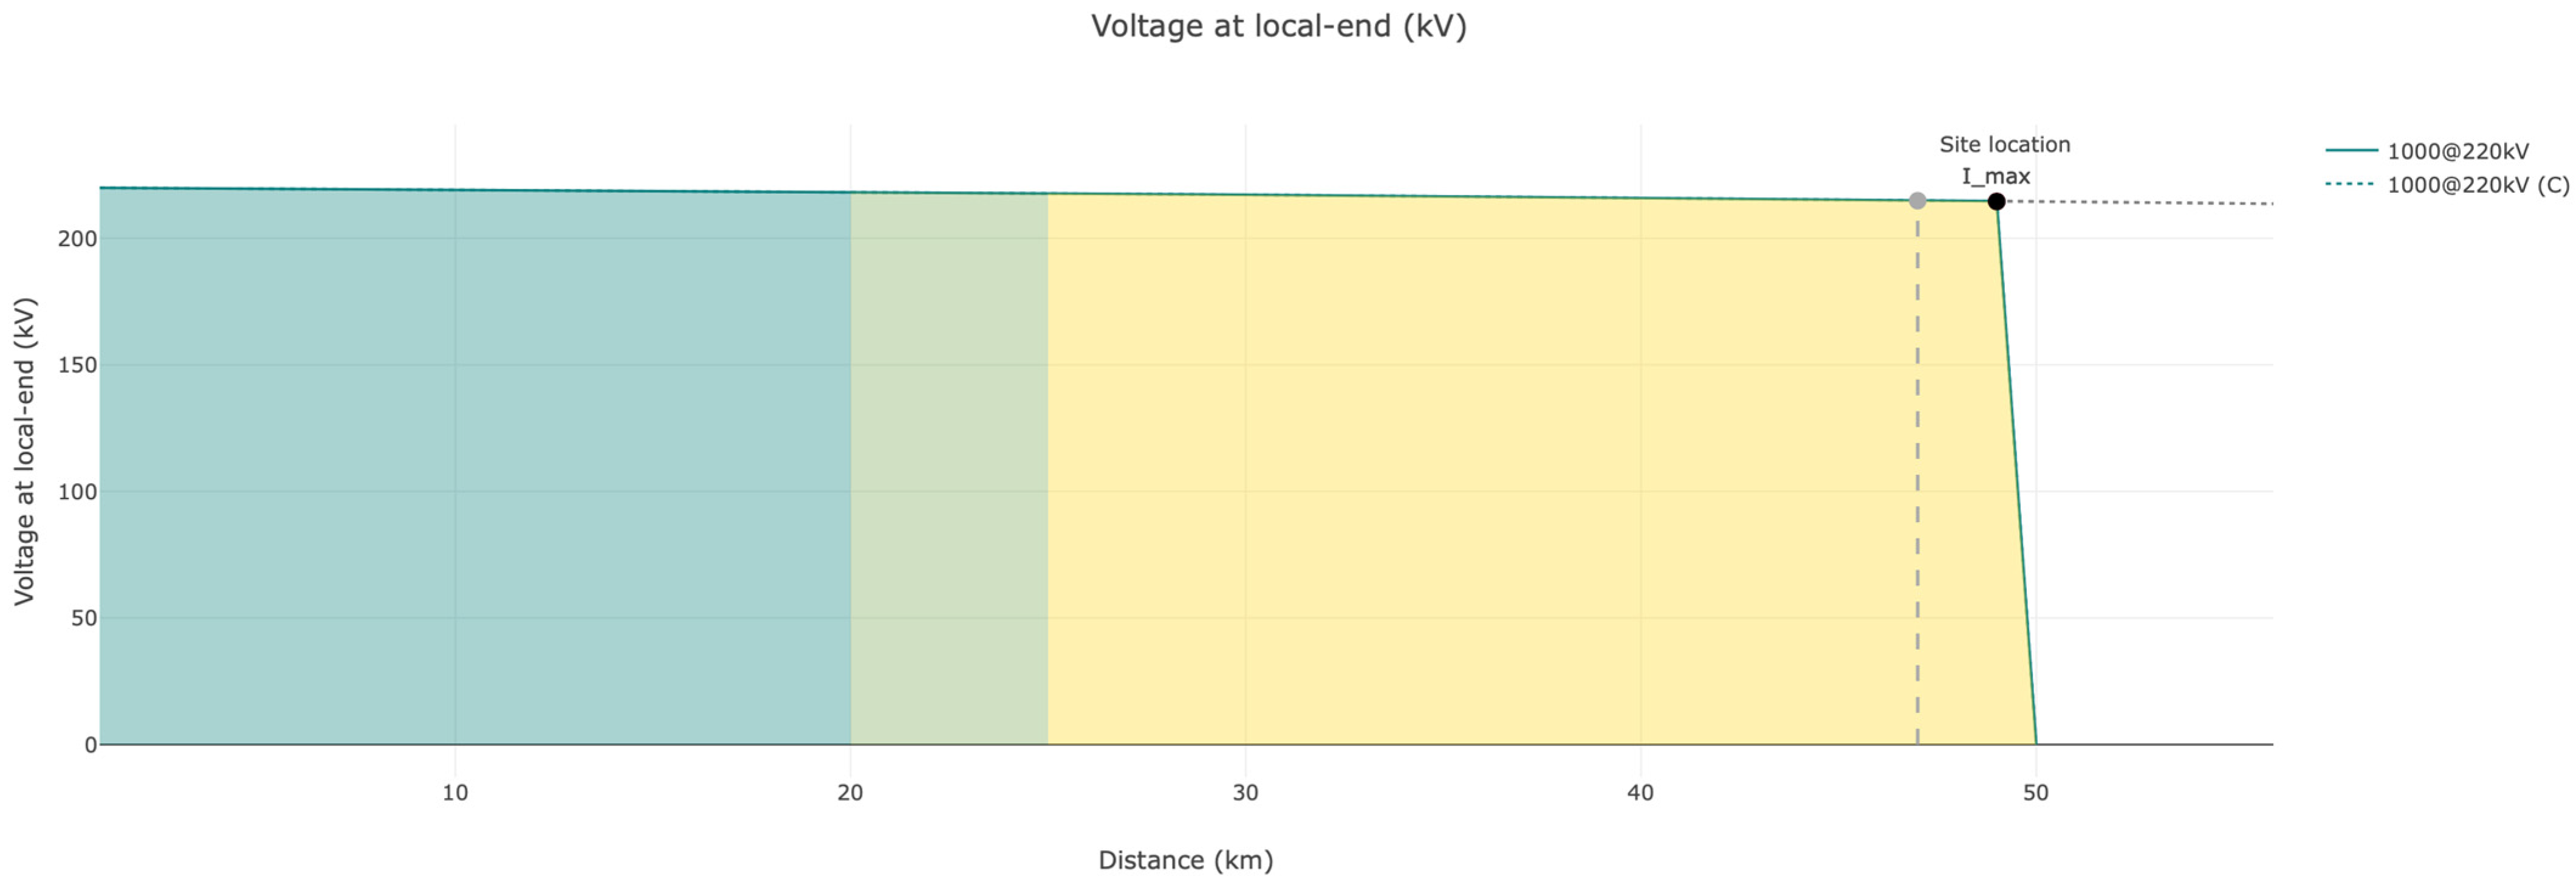
4.2. Model Validation for OWF (Case #2)
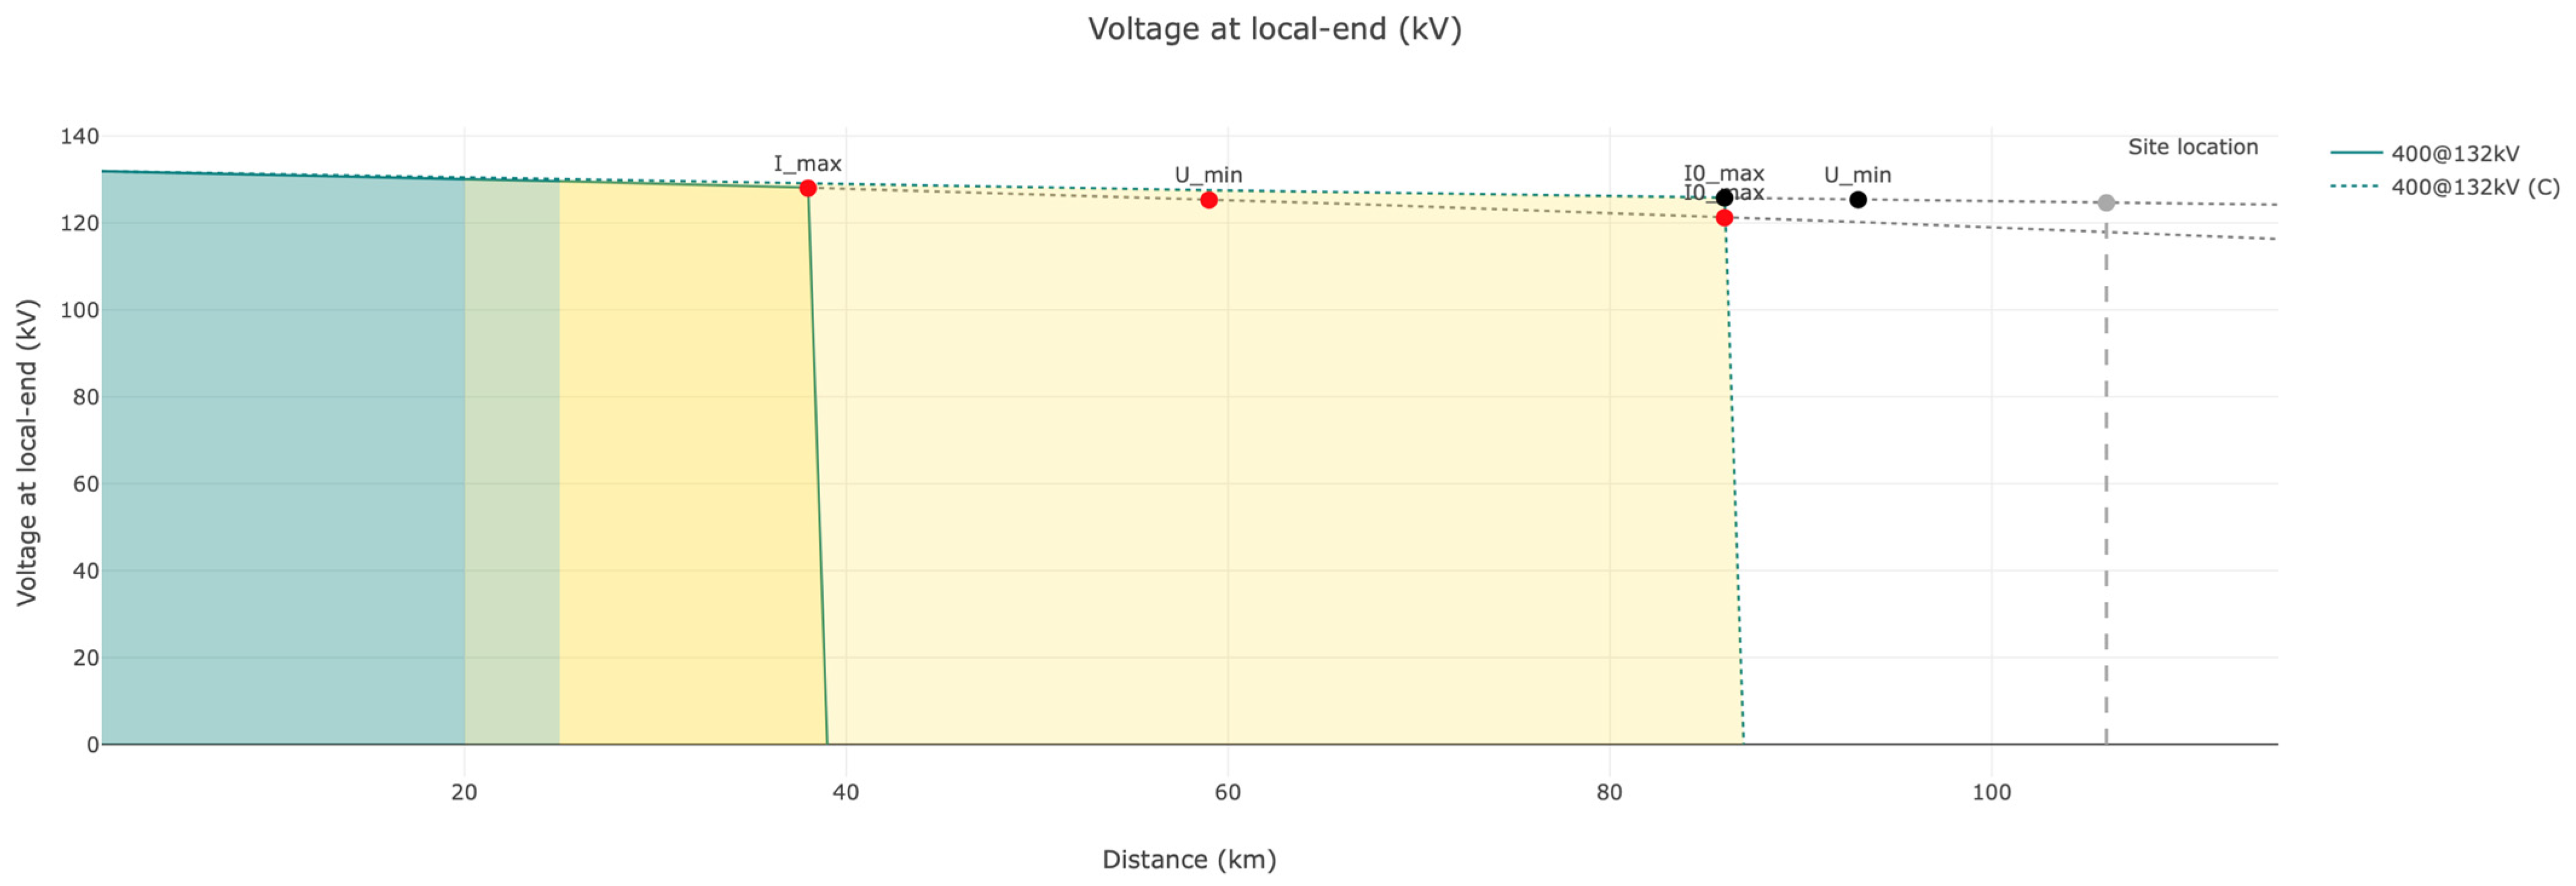
4.3. Model Validation for OWF (Case #3)
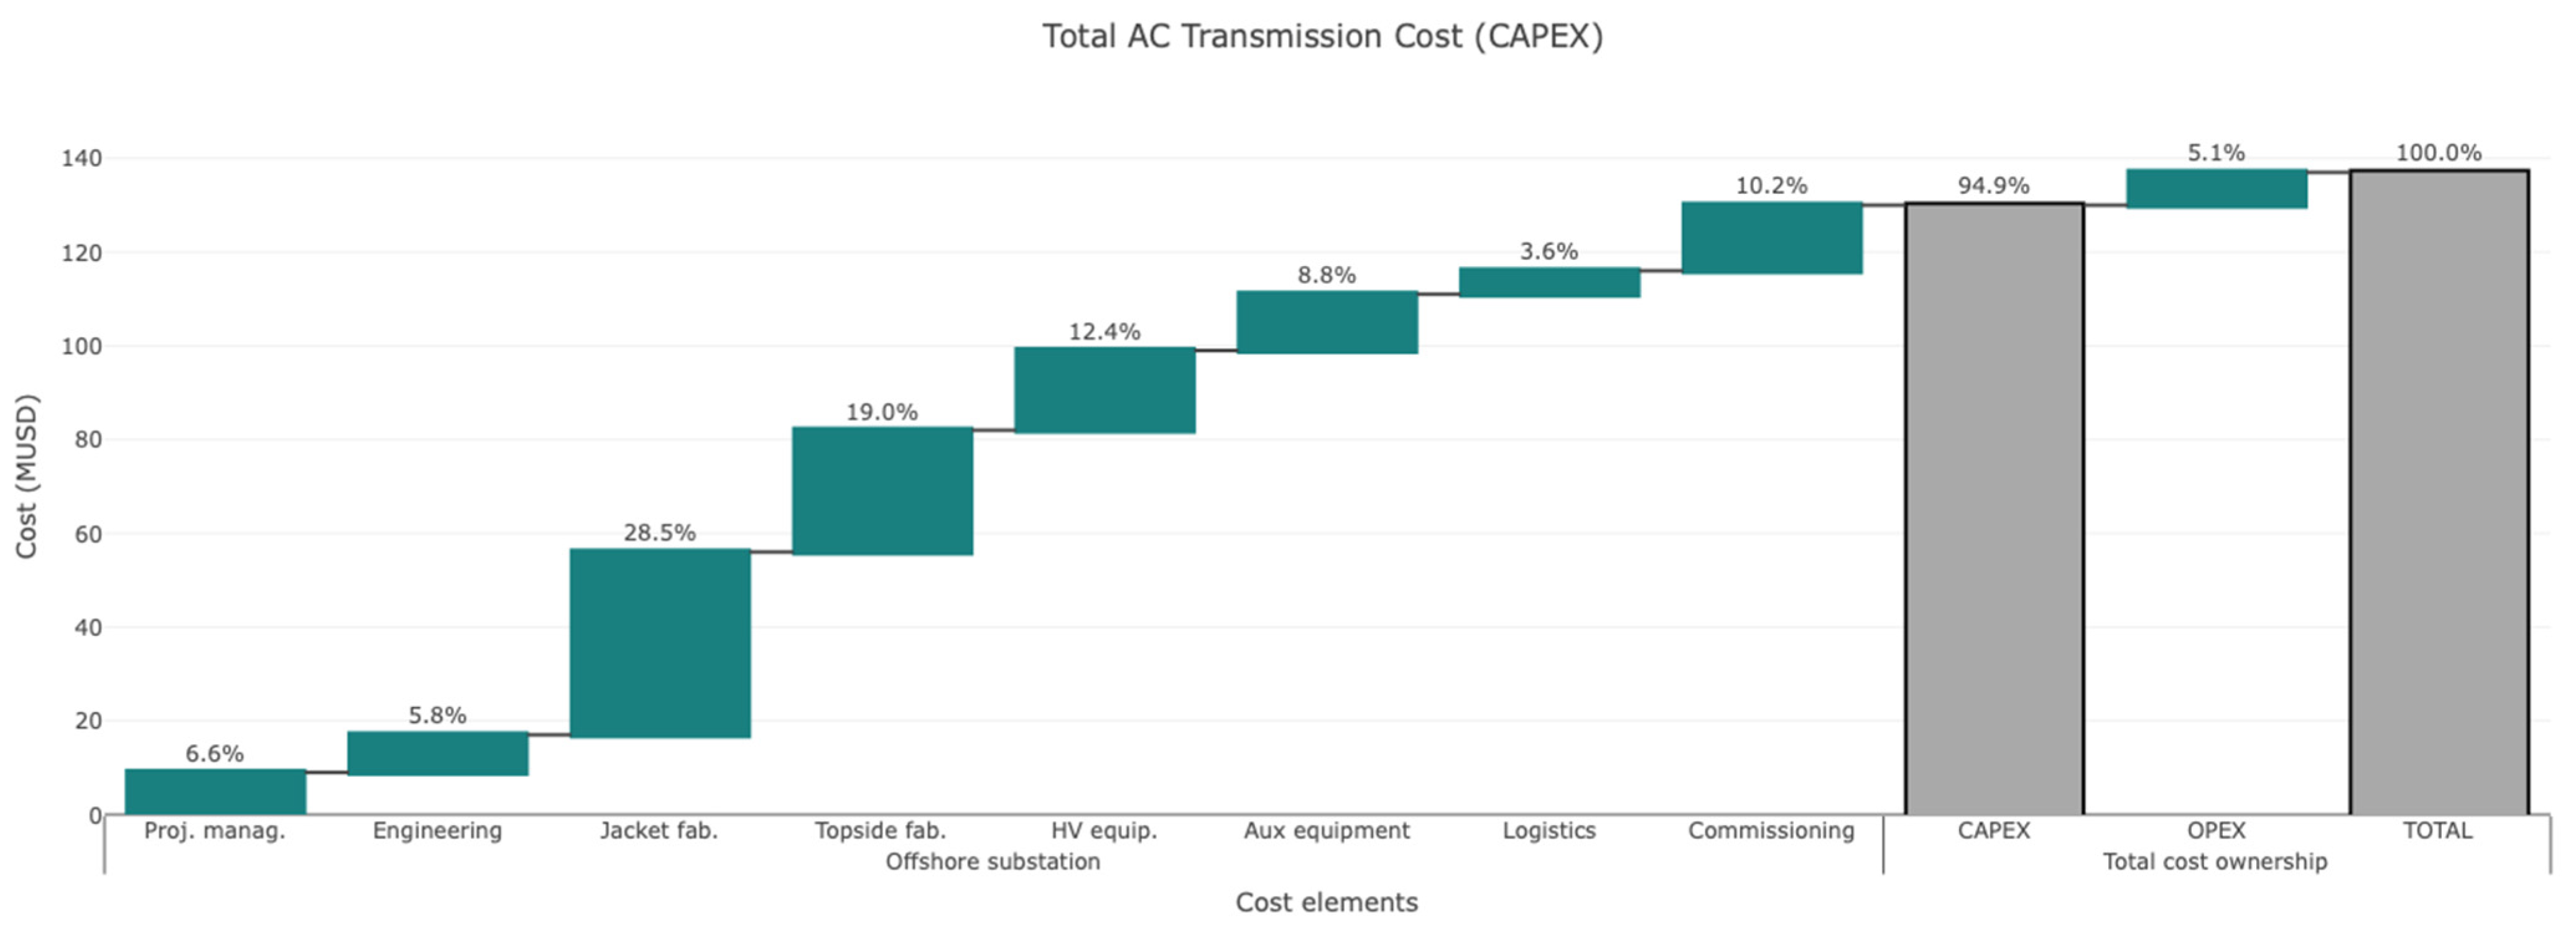
4.4. Model Validation for CAPEX
4.5. Future Development
5. Conclusions
Author Contributions
Funding
Data Availability Statement
Conflicts of Interest
List of Abbreviations
| AC | Alternating Current |
| AEP | Annual Energy Production |
| AI | Artificial Intelligence |
| CAPEX | Capital Expenditure |
| DC | Direct Current |
| DEVEX | Development Expenditure |
| EPCI | Engineering, Procurement, Construction and Installation |
| FCM | Fuzzy Clustering Method |
| GA | Genetic Algorithm |
| HV | High Voltage |
| HVAC | High Voltage Alternating Current |
| HVDC | High Voltage Direct Current |
| IEA | International Energy Agency |
| IRENA | International Renewable Energy Association |
| KBS | Knowledge-Based Systems |
| LCOE | Levelized Cost of Energy |
| MST | Minimum Spanning Tree |
| O&G | Oil and Gas |
| OEM | Original Equipment Manufacturer |
| OHVS | Offshore High Voltage Substation(s) |
| OPEX | Operational Expenditure |
| OWF | Offshore Wind Farm |
| PFS | Power from Shore |
| PSA | Particle Swarm Algorithm |
| RC | Reactive Compensation |
| SSA | Simulated Annealing Algorithm |
| TOM | Transmission Optioneering Model |
| UK | United Kingdom |
List of Variables
| Variable | Description | Units |
| Total cost of the offshore substation | MUSD | |
| Fixed cost of the offshore substation | MUSD | |
| Variable cost of the offshore substation | MUSD | |
| Rated power of the offshore candidate | MW |
References
- International Energy Agency (IEA). Oil 2023. p. 117. 2023. Available online: https://www.iea.org/reports/oil-2023/executive-summary (accessed on 23 February 2024).
- International Renewable Energy Agency (IRENA). Offshore Renewable Energy: Fostering a Blue Economy. 2020. Available online: https://www.irena.org/-/media/Files/IRENA/Agency/Publication/2020/Dec/IRENA_Fostering_Blue_Economy_2020.pdf (accessed on 23 February 2024).
- International Renewable Energy Agency (IRENA). Record Growth in Renewables, but Progress Needs to Be Equitable. 2024. Available online: https://www.irena.org/News/pressreleases/2024/Mar/Record-Growth-in-Renewables-but-Progress-Needs-to-be-Equitable (accessed on 23 February 2024).
- Rystad Energy. Enable or Inhibit: Power Grids, Key to the Energy Transition, Require $3.1 Trillion in Investments by 2030. 2024. Available online: https://www.rystadenergy.com/news/power-grids-investments-energy-transition-permitting-policies (accessed on 23 February 2024).
- International Energy Agency (IEA). Lack of Ambition and Attention Risks Making Electricity Grids the Weak Link in Clean Energy Transitions. 2023. Available online: https://www.iea.org/news/lack-of-ambition-and-attention-risks-making-electricity-grids-the-weak-link-in-clean-energy-transitions (accessed on 23 February 2024).
- Antunes, T.; Castro, R.; Santos, P.; Pires, A. Standardization of Power-from-Shore Grid Connections for Offshore Oil & Gas Production. Sustainability 2023, 15, 5041. [Google Scholar] [CrossRef]
- Financing Offshore Wind, World Forum Offshore Wind e.V. (WFO), September 2022. Available online: https://wfo-global.org/wp-content/uploads/2022/09/WFO_FinancingOffshoreWind_2022.pdf (accessed on 23 February 2024).
- Juristo, N.; Morant, J.L. Common framework for the evaluation process of KBS and conventional software. Knowl.-Based Syst. 1998, 11, 145–159. [Google Scholar] [CrossRef]
- Guerrero, J.I.; León, C.; Monedero, I.; Biscarri, F.; Biscarri, J. Improving Knowledge-Based Systems with statistical techniques, text mining, and neural networks for non-technical loss detection. Knowl.-Based Syst. 2014, 71, 376–388. [Google Scholar] [CrossRef]
- Shishavan, A.P.; Razi-Kazemi, A.A. A practical knowledge-based ranking approach to identify critical circuit breakers in large power systems. Knowl.-Based Syst. 2021, 227, 107237. [Google Scholar] [CrossRef]
- Traini, E.; Antal, G.; Bruno, G.; De Maddis, M.; Lombardi, F.; Panza, L.; Spena, P.R. Hybrid knowledge based system supporting Digital Twins in the Industry 5.0. Procedia Comput. Sci. 2024, 232, 1471–1480. [Google Scholar] [CrossRef]
- Su, C.; Han, Y.; Tang, X.; Jiang, Q.; Wang, T.; He, Q. Knowledge-based digital twin system: Using a knowlege-driven approach for manufacturing process modelling. Comput. Ind. 2024, 159–160, 104101. [Google Scholar] [CrossRef]
- Micarelli, A.; Airllo, L. A knowledge-based system for the analysis of electrical networks. Expert Syst. Appl. 1996, 11, 41–51. [Google Scholar] [CrossRef]
- Teo, C.Y.; Gooi, H.B. Restoration of electrical power supply through an algorithm and knowledge based system. Electr. Power Syst. Res. 1994, 29, 171–180. [Google Scholar] [CrossRef]
- Poon, H.L. A knowledge-based condition monitoring system for electrical machines. Comput. Ind. 1991, 16, 159–167. [Google Scholar] [CrossRef]
- Mohamed, A.; Celik, T. Knowledge based-system for alternative design, cost estimating and scheduling. Knowl.-Based Syst. 2002, 15, 177–188. [Google Scholar] [CrossRef]
- Sørensen, J.N.; Larsen, G.C. A Minimalistic Prediction Model to Determine Energy Production and Costs of Offshore Wind Farms. Energies 2021, 14, 448. [Google Scholar] [CrossRef]
- Associates, B. Guide to an Offshore Wind Farm. 2019. Available online: https://www.thecrownestate.co.uk/media/2861/guide-to-offshore-wind-farm-2019.pdf (accessed on 3 March 2024).
- Energy, W.E.R. The State of the European Wind Energy Supply Chain. 2023. Available online: https://www.review-energy.com/fileuploads/user/20230413%20Rystad%20Energy%20-%20Wind%20Supply%20Chain%20Report-PRINT.pdf (accessed on 3 March 2024).
- Reliable Business Insights. Global High Voltage Direct Current (HVDC) Transmission Market Growth (Status and Outlook) 2023–2028. 2023. Report ID: LPI-759-1645719271365. Available online: https://www.thebusinessresearchcompany.com/report/high-voltage-direct-current-hvdc-transmission-system-global-market-report (accessed on 3 March 2024).
- DNV. 2023 Was a Pivotal Year for HVDC. What Can We Expect Next? DNV Articles, 2024. Available online: https://www.dnv.com/article/2023-was-a-pivotal-year-for-HVDC/ (accessed on 3 March 2024).
- Europacable. Demand and Capacity for HVAC and HVDC Underground and Submarine Cables. 2019. Available online: https://doi.org/2021/01/Europacable-Communication-Demand-and-Capacity-for-HVAC-and-HVDC-cables-24-Sept-2019.pdf (accessed on 3 March 2024).
- Stan, A.; Costinaș, S.; Ion, G. Overview and Assessment of HVDC Current Applications and Future Trends. Energies 2022, 15, 1193. [Google Scholar] [CrossRef]
- Smailes, M.; Ng, C.; Mckeever, P.; Shek, J.; Theotokatos, G.; Abusara, M. Hybrid, Multi-Megawatt HVDC Transformer Topology Comparison for Future Offshore Wind Farms. Energies 2017, 10, 851. [Google Scholar] [CrossRef]
- Offshore Renewable Energy Catapult. Offshore Transmission Benchmarking and Cost Monitoring; Offshore Renewable Energy Catapult: Blyth, UK, 2016. [Google Scholar]
- Hou, P.; Hu, W.; Chen, Z. Offshore substation locating in wind farms based on prim algorithm. In Proceedings of the 2015 IEEE Power & Energy Society General Meeting, Denver, CO, USA, 26–30 July 2015; pp. 1–5. [Google Scholar] [CrossRef]
- Wei, S.; Zhang, L.; Xu, Y.; Fu, Y.; Li, F. Hierarchical Optimization for the Double-Sided Ring Structure of the Collector System Planning of Large Offshore Wind Farms. IEEE Trans Sustain. Energy 2017, 8, 1029–1039. [Google Scholar] [CrossRef]
- El Mokhi, C.; Addaim, A. Optimization of Wind Turbine Interconnections in an Offshore Wind Farm Using Metaheuristic Algorithms. Sustainability 2020, 12, 5761. [Google Scholar] [CrossRef]
- Wang, L.; Wu, J.; Han, R.; Wang, T. Minimizing Energy Loss by Coupling Optimization of Connection Topology and Cable Cross-Section in Offshore Wind Farm. Appl. Sci. 2019, 9, 3722. [Google Scholar] [CrossRef]
- Baptista, J.; Jesus, B.; Cerveira, A.; Pires, E.J.S. Offshore Wind Farm Layout Optimisation Considering Wake Effect and Power Losses. Sustainability 2023, 15, 9893. [Google Scholar] [CrossRef]
- Antunes, T.A.; Castro, R.; Santos, P.J.; Pires, A.J. Power-from-Shore Optioneering for Integration of Offshore Renewable Energy in Oil and Gas Production. Energies 2023, 17, 151. [Google Scholar] [CrossRef]
- OFGEM. Offshore Electricity Transmission (OFTO); Offshore Transmission Electronic Tendering Portal. Offshore Transmission Electronic Tendering Portal. Available online: https://www.ofgem.gov.uk/energy-policy-and-regulation/policy-and-regulatory-programmes/offshore-electricity-transmission-ofto/tender-rounds-and-projects (accessed on 16 March 2024).
- OGFEM. Offshore Transmission Cost Assessment Workshop. 2013. Available online: https://www.ofgem.gov.uk/sites/default/files/docs/2013/12/13_dec_workshopslides.pdf (accessed on 16 March 2024).


| Case | Site Name | Purpose | Connection Rating (MW) | Voltage Rating (kV) | Distance to Shore (km) | Technology |
|---|---|---|---|---|---|---|
| 1 | Horns Rev 2 OWF | OWF | 209 | 150 | 30 | HVAC |
| 2 | Nobelwind OWF | OWF | 165 | 220 | 47 | HVAC |
| 3 | Goliat | O&G | 75 | 132 | 106 | HVAC |
| Case | Site Name | Cable Size mm2 | Arrangement | Reactive Compensation (% of Active Power) |
|---|---|---|---|---|
| 1 | Horns Rev 2 OWF | 300 | 3 Ph | 85% |
| 1* | Horns Rev 2 OWF | 400 | 3 Ph | - |
| 2 | Nobelwind OWF | 1000 | 3 Ph | 0% |
| 3 | Goliat | 1000 | 3 Ph | 90% |
| Case | Site Name | No. OHVS | Fixed Cost (USD) | Variable Cost (USD) | Total CAPEX (USD) |
|---|---|---|---|---|---|
| 1 | Horns Rev 2 OWF | 1 | 100,000,000 | −286,230 | 99,713,770 |
| 2 | Nobelwind OWF | 1 | 100,000,000 | −339,725 | 99,660,275 |
| 3 | Goliat | 1 | 100,000,000 | −518,152 USD | 99,481,848 |
Disclaimer/Publisher’s Note: The statements, opinions and data contained in all publications are solely those of the individual author(s) and contributor(s) and not of MDPI and/or the editor(s). MDPI and/or the editor(s) disclaim responsibility for any injury to people or property resulting from any ideas, methods, instructions or products referred to in the content. |
© 2024 by the authors. Licensee MDPI, Basel, Switzerland. This article is an open access article distributed under the terms and conditions of the Creative Commons Attribution (CC BY) license (https://creativecommons.org/licenses/by/4.0/).
Share and Cite
Antunes, T.A.; Castro, R.; Santos, P.J.; Pires, A.J. Technology Selection of High-Voltage Offshore Substations Based on Artificial Intelligence. Energies 2024, 17, 4278. https://doi.org/10.3390/en17174278
Antunes TA, Castro R, Santos PJ, Pires AJ. Technology Selection of High-Voltage Offshore Substations Based on Artificial Intelligence. Energies. 2024; 17(17):4278. https://doi.org/10.3390/en17174278
Chicago/Turabian StyleAntunes, Tiago A., Rui Castro, Paulo J. Santos, and Armando J. Pires. 2024. "Technology Selection of High-Voltage Offshore Substations Based on Artificial Intelligence" Energies 17, no. 17: 4278. https://doi.org/10.3390/en17174278
APA StyleAntunes, T. A., Castro, R., Santos, P. J., & Pires, A. J. (2024). Technology Selection of High-Voltage Offshore Substations Based on Artificial Intelligence. Energies, 17(17), 4278. https://doi.org/10.3390/en17174278