Article

Numerical Investigations into the Homogenization Effect of Nonlinear Composite Materials on the Pulsed Electric Field

1
State Key Laboratory of Electrical Insulation and Power Equipment, School of Electrical Engineering, Xi’an Jiaotong University, Xi’an 710049, China
2
TBEA Electrical Equipment Group Co., Ltd., Xi’an 710068, China
*
Author to whom correspondence should be addressed.
Energies 2024, 17(17), 4252; https://doi.org/10.3390/en17174252
Submission received: 25 July 2024 / Revised: 14 August 2024 / Accepted: 22 August 2024 / Published: 26 August 2024
(This article belongs to the Section F: Electrical Engineering)

Abstract

Pulsed power equipment is often characterized by high energy density and field intensity. In the presence of strong electric field intensity, charge accumulation within insulators exacerbates electric field non-uniformity, leading to potential insulation breakdown, thereby posing a significant threat to the safe operation of pulsed power equipment. In this manuscript, we introduce nonlinear composite materials with field-dependent conductivity and permittivity to adaptively regulate the distribution of the pulsed electric field in insulation equipment. Finite-element modeling and analysis of the needle-plate electrodes and high-voltage bushing are carried out to comprehensively investigate the non-uniformity of the distribution of the electric field and the homogenization effect of various nonlinear materials in the presence of pulsed excitations of different timescales. Numerical results indicate that the involvement of nonlinear composite materials significantly improves the electric field distribution under pulse excitations. In addition, variations in the rising time of the pulses affect the maximum electric field intensity within the insulators considerably, but for pulses of nanosecond and microsecond scales, the tendencies are the opposite. Finally, via the simulations of the bushing, we illustrate that some measures proposed for improving the uniformity of the electric field under low frequencies, e.g., increasing the length of the electric field equalization layer and the distance of the underside of the electric field equalization layer from the grounding screen, are still effective for the homogenization of pulsed electric field.

1. Introduction

With the rapid development of pulsed power technology, its applications continue to expand into fields including the environment, energy, defense, material processing, and medical treatment [1]. In general, pulsed power equipment is characterized by extremely high energy density and strong field intensity, which are likely to induce insulation breakdown, raising severe reliability and safety issues. Therefore, the distribution and homogenization of the electric field intensity under pulse excitation have received extensive attention.
In the presence of pulsed excitations, the distribution of the electric field intensity in insulators can be highly nonuniform [2,3], leading to potential surface flashover [4,5] and space charge accumulation [6,7,8,9,10,11,12]. The resultant insulation failure poses a severe threat to pulsed power equipment. Therefore, homogenization of the pulsed electric field, or in other words, to keep the spatial distribution of the electric field intensity uniform throughout the duration of the pulse, has been a major concern in pulsed power technology. Traditionally, the homogenization is achieved via improved design of the insulation structures [13,14]. Involvement of additional fan-shaped structures, equipotential rings, and optimization of the shapes of the spacers [15] or electrodes [16] are widely adopted measures to improve the uniformity of the electric field distribution. However, these approaches increase the difficulty of manufacture and maintenance of the equipment, and the effect of field homogenization is limited.
An alternative to the above measures is to employ composite materials with deliberately designed properties. In fact, research on material property modifications of composite materials to address flashover issues in insulation equipment has long been underway [17]. Initially, researchers employed composites with constant high electrical conductivity or permittivity to improve electric field distribution. In reference [18], the material parameters (permittivity, dielectric loss, surface resistivity, and volume resistivity) of insulation materials were extracted under different temperatures and frequencies via experiments, while in [19], an intuitive and accurate approach for modelling the electric conductivity of multiphase materials is proposed, making it possible to obtain and manipulate the effective material parameters of composites at very low costs. Compared to the traditional “shape control” methods, insulation by this “material-parameter control” method is simpler and more flexible. However, the homogenization effect by using composites with linear permittivity or electric conductivity are severely influenced by the temperature and frequency stabilities of the material parameters, and limited by the geometrical structure of the pulsed power equipment; thus, it is not completely satisfying. To overcome this bottleneck, some researchers involve nonlinear composites with field-dependent permittivity [20] or conductivity [21,22,23] rising with the increase in the electric field intensity. This adjustment achieves a match between the material parameters of insulation media and the local electric field intensity, thereby adaptively improving the uniformity of the electric field. Representative of such efforts is [24], in which a nonlinear conductive composite synthesized from a polymer matrix and inorganic fillers is proposed to improve the uniformity of electric field distribution. It is shown that nonlinear composite materials with field-dependent permittivity can adaptively homogenize the distribution of the electric field intensity, which is beneficial for insulation reliability.
It is worth noting that the available literature mainly focuses on the homogenization effect of merely nonlinear permittivity or conductivity under direct current (DC) condition or power frequencies. To the best of the authors’ knowledge, a comprehensive investigation on the joint effect of nonlinear electric conductivity and permittivity on the homogenization of the pulsed electric field is still lacking.
The contribution of this manuscript is twofold. First, finite element models for two typical scenarios, namely the needle-plate electrodes and the high-voltage bushing, are established. Through numerical results, the collaborative effect of nonlinear permittivity and electric conductivity on the homogenization of pulsed electric field intensity is illustrated. Second, based on the simulation results of the high-voltage bushing, we discuss the influence of the length and position of the grounding shield on the electric field distribution. Results indicate that measures to enhance electric field uniformity under low-frequency or DC conditions, such as increasing the length of the grounding shield, remain effective for improving uniformity under pulse excitations. The paper delves into the adaptive homogenization effect of field-dependent materials with nonlinear conductivity and permittivity, providing a theoretical basis for the design and optimization of the insulation of pulsed power equipment.
The remainder of this manuscript is structured as follows. In Section 2, the governing equations of the electromagnetic field in the insulator as well as the dependence of the nonlinear permittivity and conductivity are presented. A brief explanation on why field-dependent permittivity and electric conductivity are beneficial for yielding more uniform distribution of the electric field intensity is also included. In Section 3, finite element simulations for the needle-plate electrodes and the high-voltage bushing are carried out. The sensitivity analysis in terms of the mesh density and time-step size is first provided to validate the numerical results. Then, the impact of nonlinear material parameters, the time profiles of the pulse excitations, and geometrical parameters of the bushing on the electric field distribution are discussed in detail. The main conclusions of this research are summarized in Section 4.

2. Theory and Formulations

The electromagnetic field in the insulator in the presence of pulse excitations is governed by Maxwell’s equations:
{ × E = B t × H = J + D t D = ρ B = 0 ,
along with the constitutive law
{ D = ε E B = μ H J = σ E ,
where E is the electric field intensity, D the electric flux density, H the magnetic field intensity, B the magnetic flux density, J the electric current density, ε the permittivity, μ the permeability, and σ the electric conductivity. As mentioned before, ε and σ of nonlinear composite materials should be field-dependent:
{ σ ( | E | ) = σ 0 exp ( α 1 | E | ) ( | E | ) = ε 0 ε r 0 exp ( α 2 | E | ) ,
where | E | is the absolute value of E, σ 0 the reference electric conductivity under | E | = 0, ε 0 the permittivity of the vacuum, and ε r 0 the relative permittivity under | E | . The units of nonlinear coefficients α 1 and α 2 are both m/V, so that α 1 | E | and α 2 | E | are dimensionless.
It is worth emphasizing that the values of α 1 and α 2 are usually small positive numbers, such that when | E | increases, ε ( | E | ) and σ ( | E | ) rise accordingly. The permittivity ε is a measure of the materials’ capability to store energy and resist the variation in the electric field intensity via polarization. Therefore, in the presence of large | E | , enlarged ε ( | E | ) helps to weaken the local field to make the overall distribution of E more uniform. As for the electric conductivity, consider a small volume portion of the insulator. When local | E | is large, σ ( | E | ) defined by Equation (3) increases to reduce the effective resistance of this portion, such that the ratio of the overall voltage borne by this portion decreases, resulting in diminished local field and homogenization of the electric field intensity.
In summary, field-dependent ε ( | E | ) and σ ( | E | ) , rising with the increase in | E | , are both favorable for making the distribution of E more uniform. Though the nonlinear dependence of ε ( | E | ) and σ ( | E | ) on | E | can be fitted with many functions, including the linear function and high-order polynomials, in our context, exponential dependence of ε ( | E | ) [25] and σ ( | E | ) [26] is assumed. By varying the coefficients α 1 and α 2 , the strength of nonlinearity in terms of ε and σ of the investigated materials can be easily adjusted.

3. Numerical Simulations of the Homogenization Effect of Nonlinear Composite Materials

This section carries out finite element (FEM) simulations in the presence of pulse excitations of nanosecond and microsecond scales for two models, i.e., needle-plate electrodes and high-voltage bushing. The FEM discretization of the governing equations is realized with the commercial FEM solver COMSOL Multiphysics version 6.0, and we choose the built-in backward difference method for time-domain solution to the governing equations.
The discussion in this section will focus on the homogenization effect of nonlinear composite material coefficients on the pulsed electric field inside insulators.

3.1. Configurations of the FEM Simulations

For convenience, we start with some parameters and definitions shared by both simulations.
In both simulations, the excitations are pulse voltages of different timescales imposed on the metallic electrodes. According to the IEC 61000-2-9 standard, the reference time profile of the nanosecond pulse voltage is
V ns ( t ) = 26 × ( e 4 × 10 7 t e 6 × 10 8 t ) ,
which corresponds to a front time tpr = 5 ns, a peak value of 20 kV, and a half-width of 22 ns. In Equation (4), the units of time t and nanosecond pulse voltage V ns ( t ) are second (s) and kilovolt (kV), respectively. Similarly, according to the GB/T 3048.13-2007 standard, the reference time profile of the microsecond pulse voltage is set to be a lightning surge waveform given by
V μ s ( t ) = 20.76 × ( e 1.4 × 10 4 t e 2.7 × 10 6 t ) ,
which corresponds to a pulse front time of tpr = 5 ns, a peak value of 20 kV, and a half-width of 50 ns. In Equation (5), the units of time t and microsecond pulse voltage Vμs(t) are second (s) and kilovolt (kV), respectively. Note that by adjusting the coefficients in Equations (4) and (5), it is straightforward to yield pulse waveforms of various front times tpr.
The key indicator observed in the two simulations is the electric field non-uniformity, which is the ratio of the maximum magnitude of the field intensity Emax to the spatially averaged magnitude of the field intensity over the entire region Eav, denoted by P:
P = E max / E av .
Note that the non-uniformity P defined by Equation (6) is a dimensionless ratio.
The parameters of the linear materials involved in our simulations are listed in Table 1. Three types of nonlinear composite materials, referred to as S1, S2, and S3, respectively, are defined in Table 2. The three nonlinear composite materials mainly differ in the strength of nonlinearity, or more specifically, S1 has the weakest nonlinearity, while S3 exhibits the strongest nonlinearity.
Figure 1 and Figure 2, respectively, present the nonlinear conductivity curves and nonlinear permittivity curves of the three composite materials. Note that the “1” in the bracket indicates that the relative permittivity is a dimensionless quantity. It is worth noting that though the investigated nonlinear materials S1, S2, and S3 with nonlinear properties do not correspond to any real-world material, the magnitudes are close to the reported values in [26] or determined by fitting Equation (3) using the experimental data in [27].

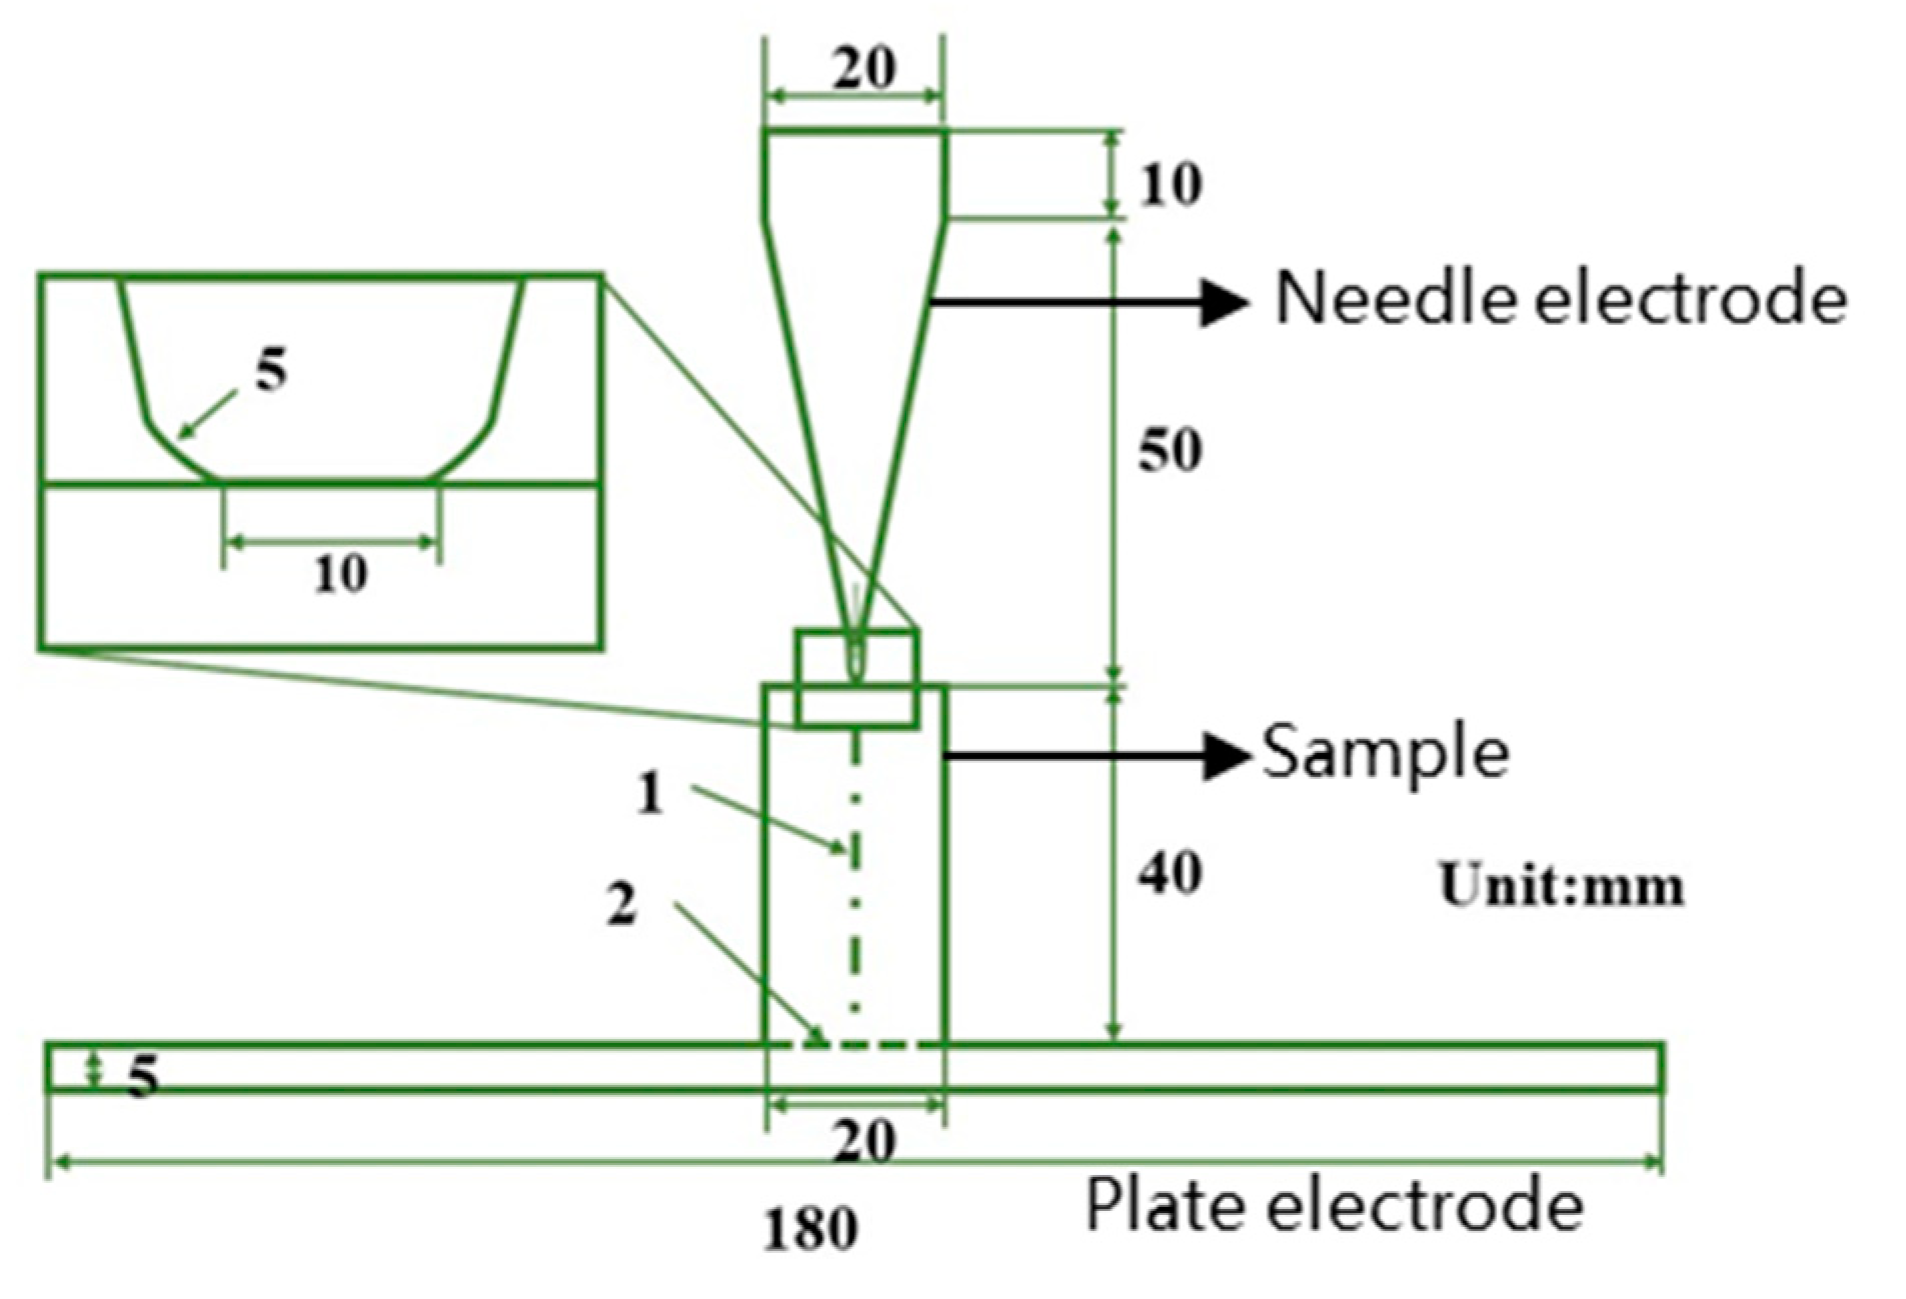
3.2. Needle-Plate Electrode Model

The needle-plate electrode model is a typical structure with an extremely uneven electric field distribution. As shown in Figure 3, a cylindrical sample with a thickness of 40 mm and a diameter of 20 mm [20,28] is placed between the needle and plate electrodes. To ensure good contact between the electrodes and the sample, the tip of the needle electrode is designed with a flat end of 10 mm width, with radii of 5 mm on both sides. Reference line 1 is set along the axis of the sample, and reference line 2 is placed along the bottom surface of the sample. Pulse excitations are applied at the tip electrode, while the plate electrode is grounded. The electrodes are made of copper.
Figure 4 illustrates the axial electric field distribution of the needle-plate electrode configuration with nonlinear composite material insulators under pulse voltage of microsecond scale, observed at the time instant when the pulse reaches its peak. It is evident that the electric field intensity is primarily concentrated near the tip electrode.
For validation of the numerical results, sensitivity tests of the FEM model of the needle-plate electrodes are conducted to exclude the interference of mesh density and time-step size.
In terms of mesh density, when compared with the pulsed field of the microsecond scale, phenomena of the nanosecond scale require a denser grid; thus, only the sensitivity test in the presence of the nanosecond pulse needs to be carried out, and the same mesh can be trusted for the pulsed field of the microsecond scale. Table 3 presents the results of Emax and P excited by a nanosecond-scale pulse of tpr = 5 ns under various numbers of tetrahedron elements. It can be seen that as the number of elements exceeds 9210, Emax and P both converge to their respective grid-independent values. For balance between accuracy and efficiency, the number of mesh elements is set to 17,725 in our context.
When it comes to the determination of the time-step size, we conduct sensitivity tests under both nanosecond and microsecond scales for different time-stepping methods, as shown in Table 4 and Table 5. It is worth noting that the two built-in time-domain solvers, i.e., the backward difference method and generalized Alpha method, are both implemented with adaptive time-step size. In each time advance, these solvers conduct a posterior error estimation and adjust the time-step size accordingly. Therefore, the time-step sizes are not fixed, but we can control the maximum time-step sizes. It can be seen that the results via the two time-stepping methods agree very well. For nanosecond-scale analysis, a maximum time-step size of 2 ns combined with the backward difference solver is sufficient regarding accuracy, while for microsecond-scale simulations, the maximum time-step size is chosen to be 2 μs.
To demonstrate the homogenization effect of the nonlinear composite materials, the evolution of the electric field non-uniformity P under pulse excitations of microsecond and nanosecond scales is depicted in Figure 5a,b, respectively. In Figure 5 and Figure 6, the considered nonlinear permittivity ε ( | E | ) and electric conductivity σ ( | E | ) are
{ ε ( | E | ) = 4.3 ε 0 exp ( 10 7 | E | ) σ ( | E | ) = 10 14 exp ( 10 5 | E | ) .
Note that the units of ε ( | E | ) and σ ( | E | ) are F/m and S/m, respectively. When nonlinear ε ( | E | ) and σ ( | E | ) are both involved, the considered material is S1, defined in Table 2.
It can be seen in Figure 5a that under pulse excitations of microsecond scale, non-uniformities P in the silicone rubber sample are almost invariant. Involvement of nonlinear ε r can homogenize the field distribution a little, but at the time instants when the pulse voltages reach their peaks, the improvement of non-uniformities P is approximately 10%, which is not significant. For comparison, field-dependent σ exhibits an enhanced homogenization effect, but the loss is also increased due to the rising σ . When the sample material has both nonlinear ε r and σ , the distribution of E can be further optimized. During the pulse front time (t < 20 μs), P can be reduced by 25%, demonstrating the benefit of nonlinearity in both ε r and σ . Similar conclusions can be drawn from Figure 5b.
Figure 5. Time evolution of P (non-uniformity of the distribution of E) under pulsed excitations. (a) Microsecond pulse. (b) Nanosecond pulse.
Energies 17 04252 g005
The results in Figure 6 indicate that under pulse excitations of nanosecond scale, the influence of the pulse front time tpr is crucial. It can be seen that the proposed material with nonlinear ε r and σ can still homogenize the distribution of E at the beginning of the duration. However, for tpr = 20 ns, it can be seen that P of the proposed material can even exceed that of the silicone rubber sample. Nevertheless, this does not mean that the joint effect of nonlinear ε r and σ is unfavorable. In Figure 7, the maximum electric field intensities E max in the presence of nanosecond excitations corresponding to various tpr are presented. It is obvious that the sample material with nonlinearity in both ε r and σ exhibits the smallest Emax, leading to minimum risk of insulation breakdown as well as lower loss when compared against the sample with merely nonlinear σ .
Figure 6. Time evolution of P (non-uniformity of the distribution of E) under excitations of various tpr. (a) Microsecond pulse. (b) Nanosecond pulse.
Energies 17 04252 g006
Another point is that the silicone rubber, as a linear material with constant permittivity and electric conductivity, exhibits almost invariant behavior under both timescales and various tpr, because the distribution of the internal physical field is determined mostly by its material properties.
On the other hand, tpr has much more obvious influences on the behavior of the proposed nonlinear materials. A possible explanation is that the nonlinear variations in the material properties are in fact a reflection of the charge relaxation process [27]; thus, tpr and the resultant time profiles of pulsed excitations have significant influence on the non-uniformity P of the insulators made of nonlinear materials with field-dependent permittivity and electrical conductivity, especially when the timescale of the pulsed field is comparative or shorter than the time-constant of the relaxation process. From Figure 6, it can be seen that the influence of tpr is more obvious for nanosecond-scale pulses, which is consistent with the above discussion.
Then, we discuss the influence of the strength of nonlinearity on the homogenization effect of sample materials. Table 6 provides the maximum electric field intensity and field non-uniformity along axis 1. For a more intuitive summarization of the simulation results, we also include Figure 8 to present Emax corresponding to various tpr under excitations of both timescales.
It can be concluded that for the needle-plate model, whether excited by microsecond or nanosecond pulses, stronger nonlinearity, or in other words, larger nonlinear coefficients α 1 and α 2 , can help to achieve better field uniformity. Additionally, as the pulse front time tpr increases, the maximum electric field intensity Emax within the sample excited by microsecond pulses gradually increases, whereas for excitations of nanosecond scale, roughly the opposite tendency can be observed.
Figure 9 and Figure 10 depict the temporal variation in electric field non-uniformity P inside the sample under pulse excitations of nanosecond and microsecond scales. It can be concluded that throughout the pulse rising stage of the ns pulse, as the nonlinear coefficients increase, P gradually decreases, which is favorable. However, during the falling stage corresponding to the tails of the waveforms, an unignorable increase in the electric field non-uniformity P appears for sample materials with stronger nonlinearity. However, the pulse excitations as well as the maximum electric field intensity have decayed to small values; hence, the insulating performance of the nonlinear materials may not be affected. As for the cases with pulse excitations of microsecond scale, throughout the rising stage of the μs pulses, the electric field non-uniformities P of nonlinear samples made of S1, S2, and S3 remain consistently lower than that of the silicone rubber sample.

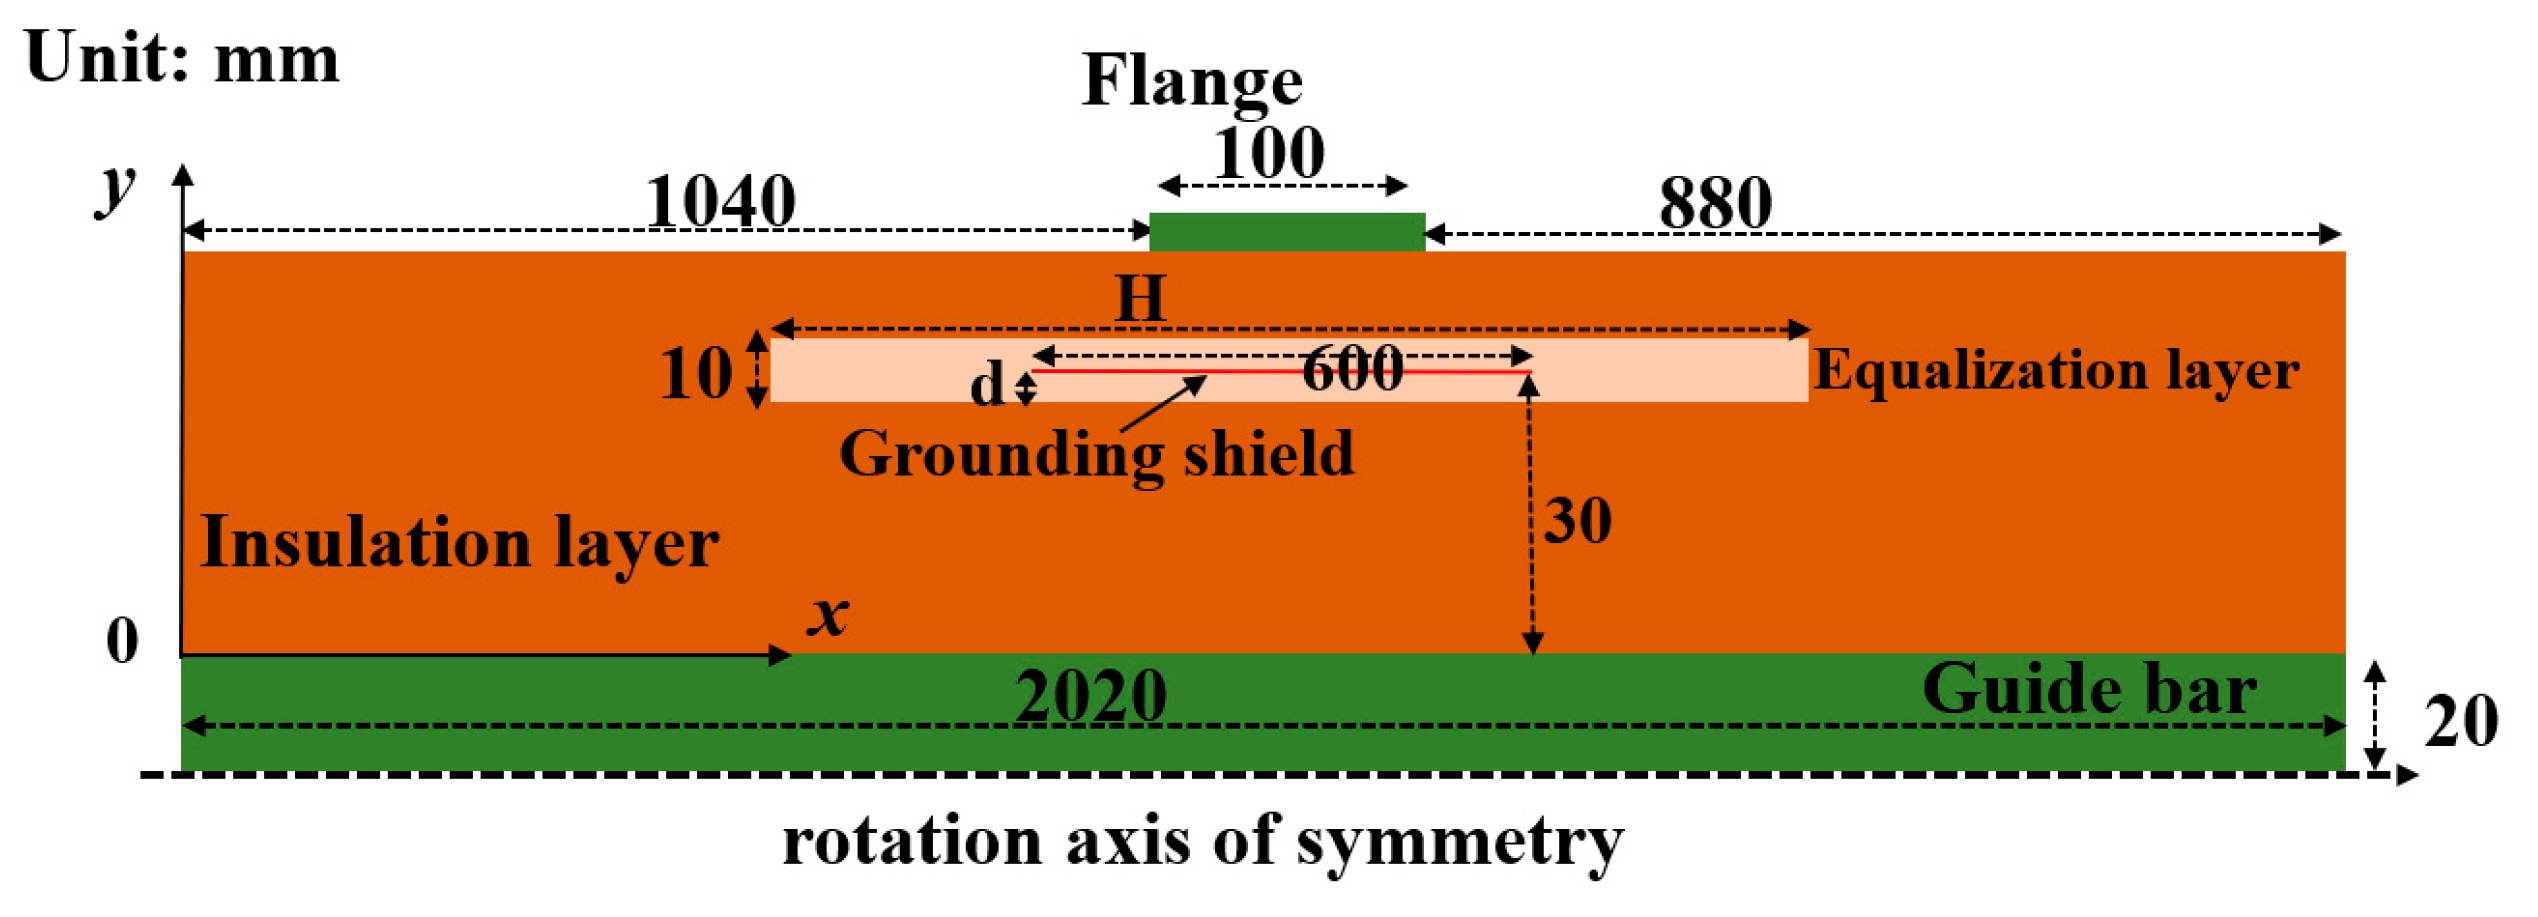
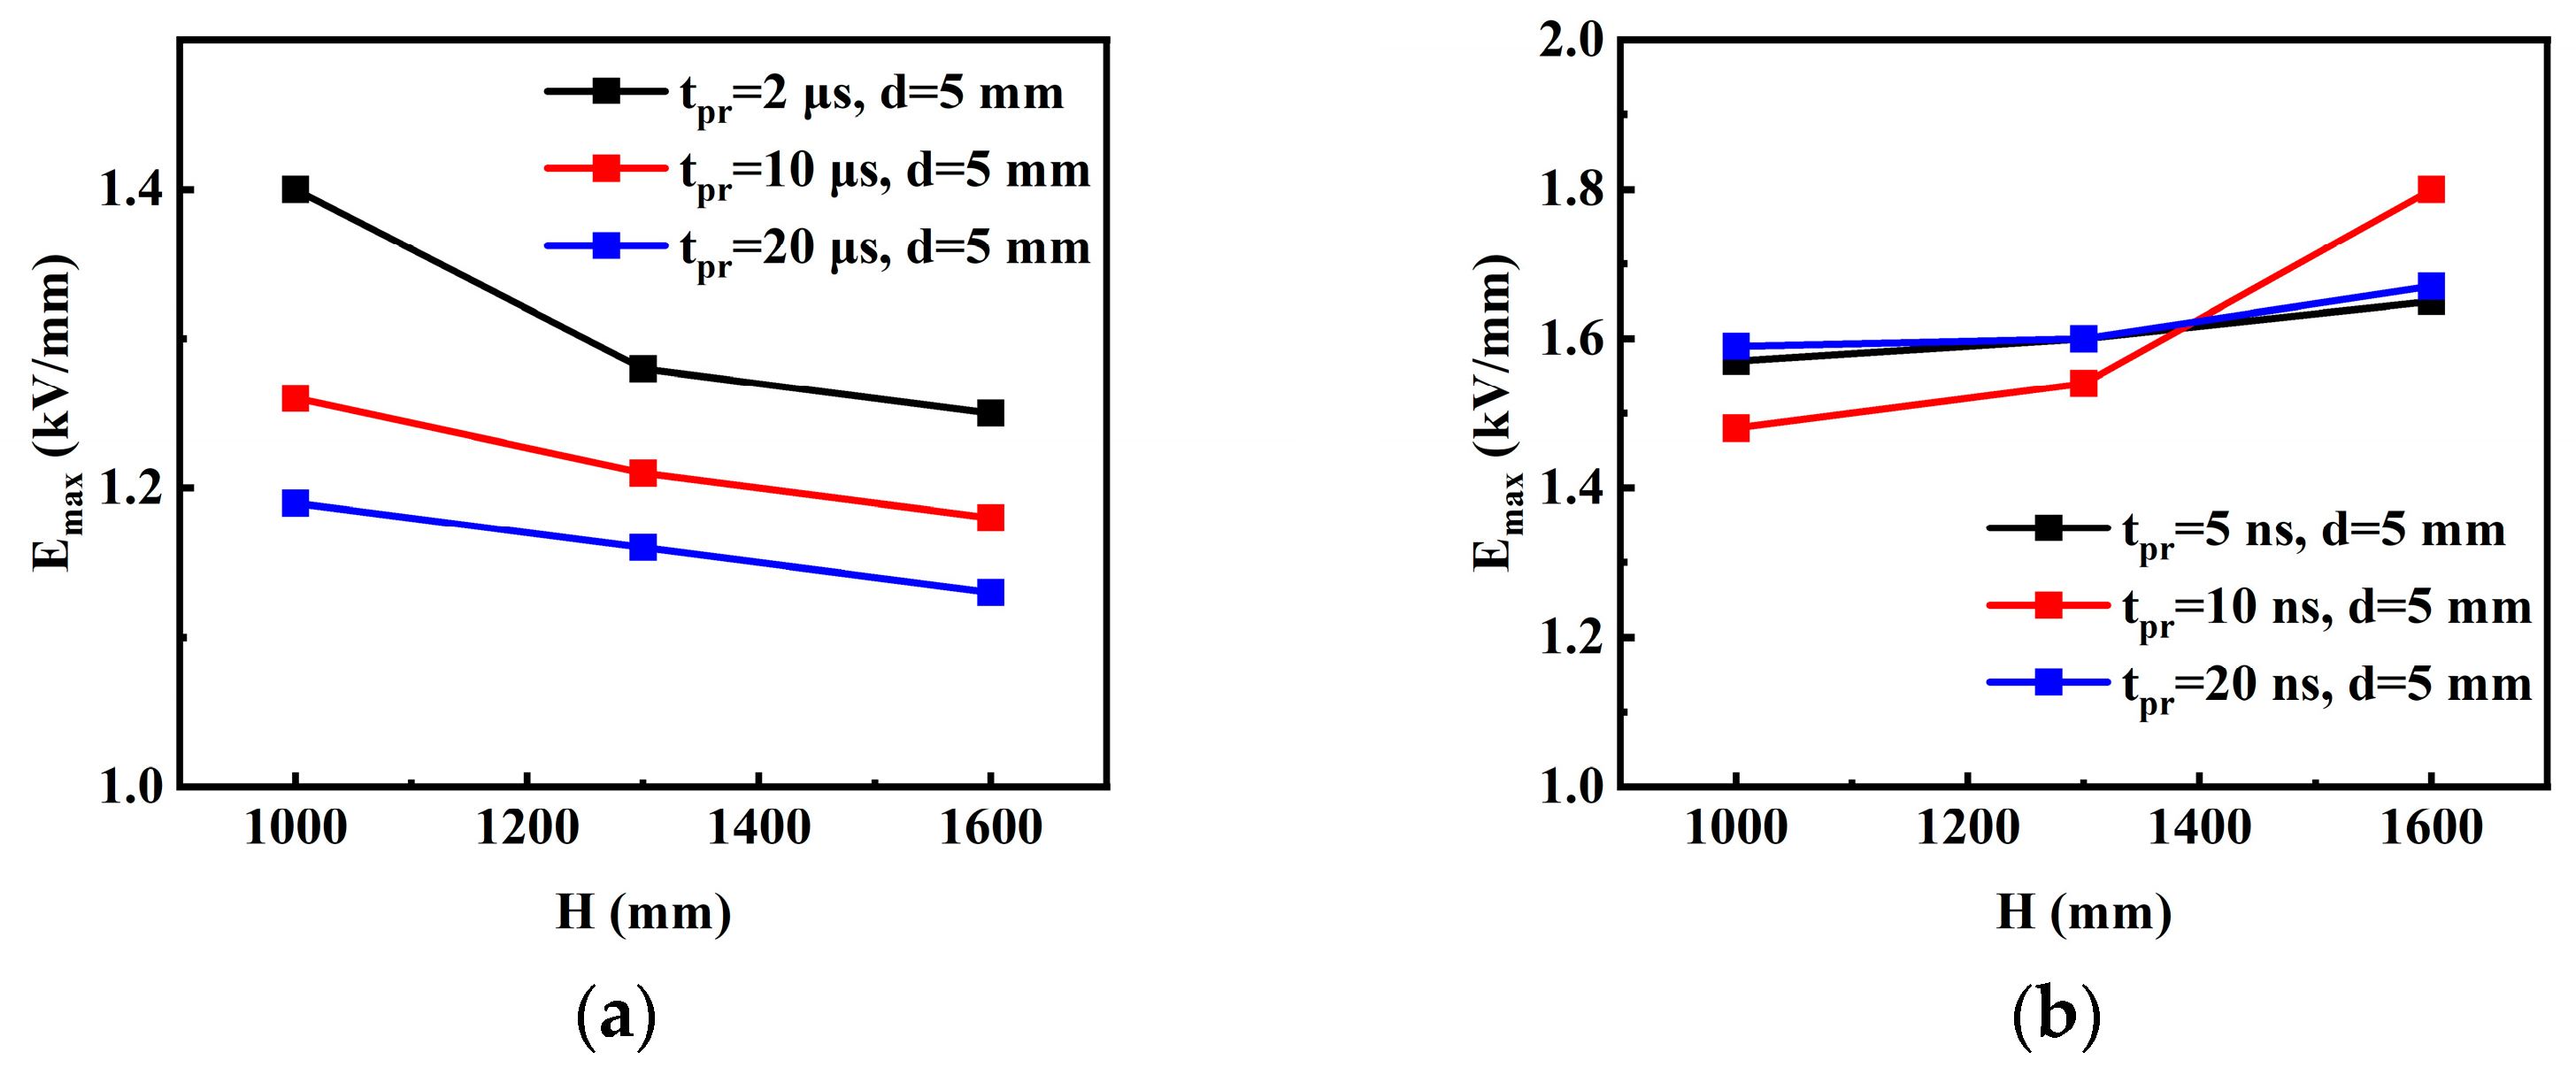
3.3. High-Voltage Bushing Model

In this subsection, the distribution of electric field intensity in a high-voltage bushing [20] is investigated. The geometry of the bushing is shown in Figure 11, where the reference values for H and are H = 1000 mm and d = 5 mm, respectively. The structure of the bushing consists of the flange, guide bar, insulation layer, grounding screen, and an electric field equalization layer made of silicone rubber or nonlinear composite materials. The electric field distribution in the insulation layer is plotted in Figure 12, at the time instant when the pulse excitation of microsecond scale reaches its peak. It can be observed that the electric field intensity is mainly concentrated between the grounding shield and the guide bar.
The key indicators of this simulation are still the non-uniformity P and maximum amplitude of the electric field intensity Emax in the bushing. Similar to the process in Section 3.1, sensitivity tests of the FEM model of the bushing are first carried out to validate the simulation results. From the results in Table 7, Table 8 and Table 9, the number of mesh elements is set to be 11,234 in the following discussions, and the maximum time-step sizes in the presence of nanosecond and microsecond pulses are 2 ns and 2 μs, respectively. The adopted time-stepping method is the backward difference method.
Then, we consider the equalization layer made of silicone rubber and nonlinear materials S1, S2, and S3. Figure 13 presents the maximum electric field intensity Emax in the high-voltage bushing corresponding to various tpr and excitations of both timescales. It is found that regardless of the timescales of the pulse excitations, the introduction of nonlinear materials is still effective for reducing Emax, and enhancing the strength of nonlinearity improves the homogenization of the distribution of electric field intensity.
Figure 14 and Figure 15 depict the temporal variation in the electric field non-uniformity P in response to nanosecond and microsecond pulses, respectively. It can be observed that P can be significantly reduced by involving nonlinear materials, and stronger nonlinearity is generally beneficial to yield more uniform distribution of the electric field intensity. It is notable that during the latter half of the simulated duration, P seems to increase, and in some cases, P can even exceed those corresponding to the linear material, i.e., silicone rubber. However, at the end of the simulated duration, the excitations as well as Emax have decayed to very low levels, roughly 20% of the peak values; thus, the risk of insulation failure is limited.
The above conclusions are similar to those obtained in Section 3.2. However, for this model, we extend our discussion to investigate whether some common approaches for electric field homogenization under power frequency or direct current (DC) conditions are still effective for pulse excitations of microsecond and nanosecond scales. In [26], it is demonstrated that the variation in length and position of the electric field equalization layer in bushings also affects the maximum electric field intensity and field non-uniformity within the insulation layer. S2, defined in Table 2, is chosen as the nonlinear material for the electric field equalization layer. Define three possible lengths of the layer H1= 1000 mm, H2 = 1300 mm, and H3 = 1600 mm, as well as three possible distances of the grounding shield from the bottom of the layer, i.e., d1 = 0 mm, d2 = 5 mm, and d3 = 10 mm.
Table 10 presents detailed simulation results regarding the impact of varying lengths and positions of the electric field equalization layer on the maximum electric field intensity Emax and field non-uniformity P within the insulation layer under various excitations.
Figure 16 intuitively summarizes the variation in Emax under fixed H = 1000 mm while varying positions and tpr. It can be seen that there seems to be an optimal position for the grounding shield, since the curves are not monotonous, which agrees well with the conclusions for DC and power frequency scenarios in [26]. Denser sampling of the parameter d may help to determine the optimal position of the grounding shield. In addition, the influences of d under both microsecond and nanosecond excitations are almost identical; thus, unified experience can be applied to the design of bushing under both timescales.
Figure 17 depicts the variation in Emax under fixed d = 5 mm while varying H and tpr. It is obvious that under excitations of microsecond scale, increase in the length H of the equalization layer can reduce Emax, which is also consistent with the results in [26]. However, given excitations of nanosecond scale, the experience is not valid anymore. Exactly the opposite tendency is observed. Therefore, determination of the length H of the equalization layer in the presence of high-frequency excitations requires deliberate investigation.
In summary, previous experience for homogenization of the electric field intensity under DC or power frequencies is still trustworthy in the presence of pulse excitations of microsecond scale. Nevertheless, faced with pulse excitations of nanosecond scale, some abnormal phenomena appear; thus, measures for homogenizing DC or power frequency electric field cannot be directly inherited. Deliberate validation of existing homogenization approaches is required prior to applications to nanosecond-scale scenarios.

4. Conclusions

In this manuscript, the homogenization effect of nonlinear composite materials with field-dependent permittivity ε and conductivity σ on the distribution of pulsed electric field intensity is thoroughly investigated numerically. Two key conclusions are obtained. The findings and limitations of this manuscript are briefly summarized in Table 11, and detailed interpretations are as follows.
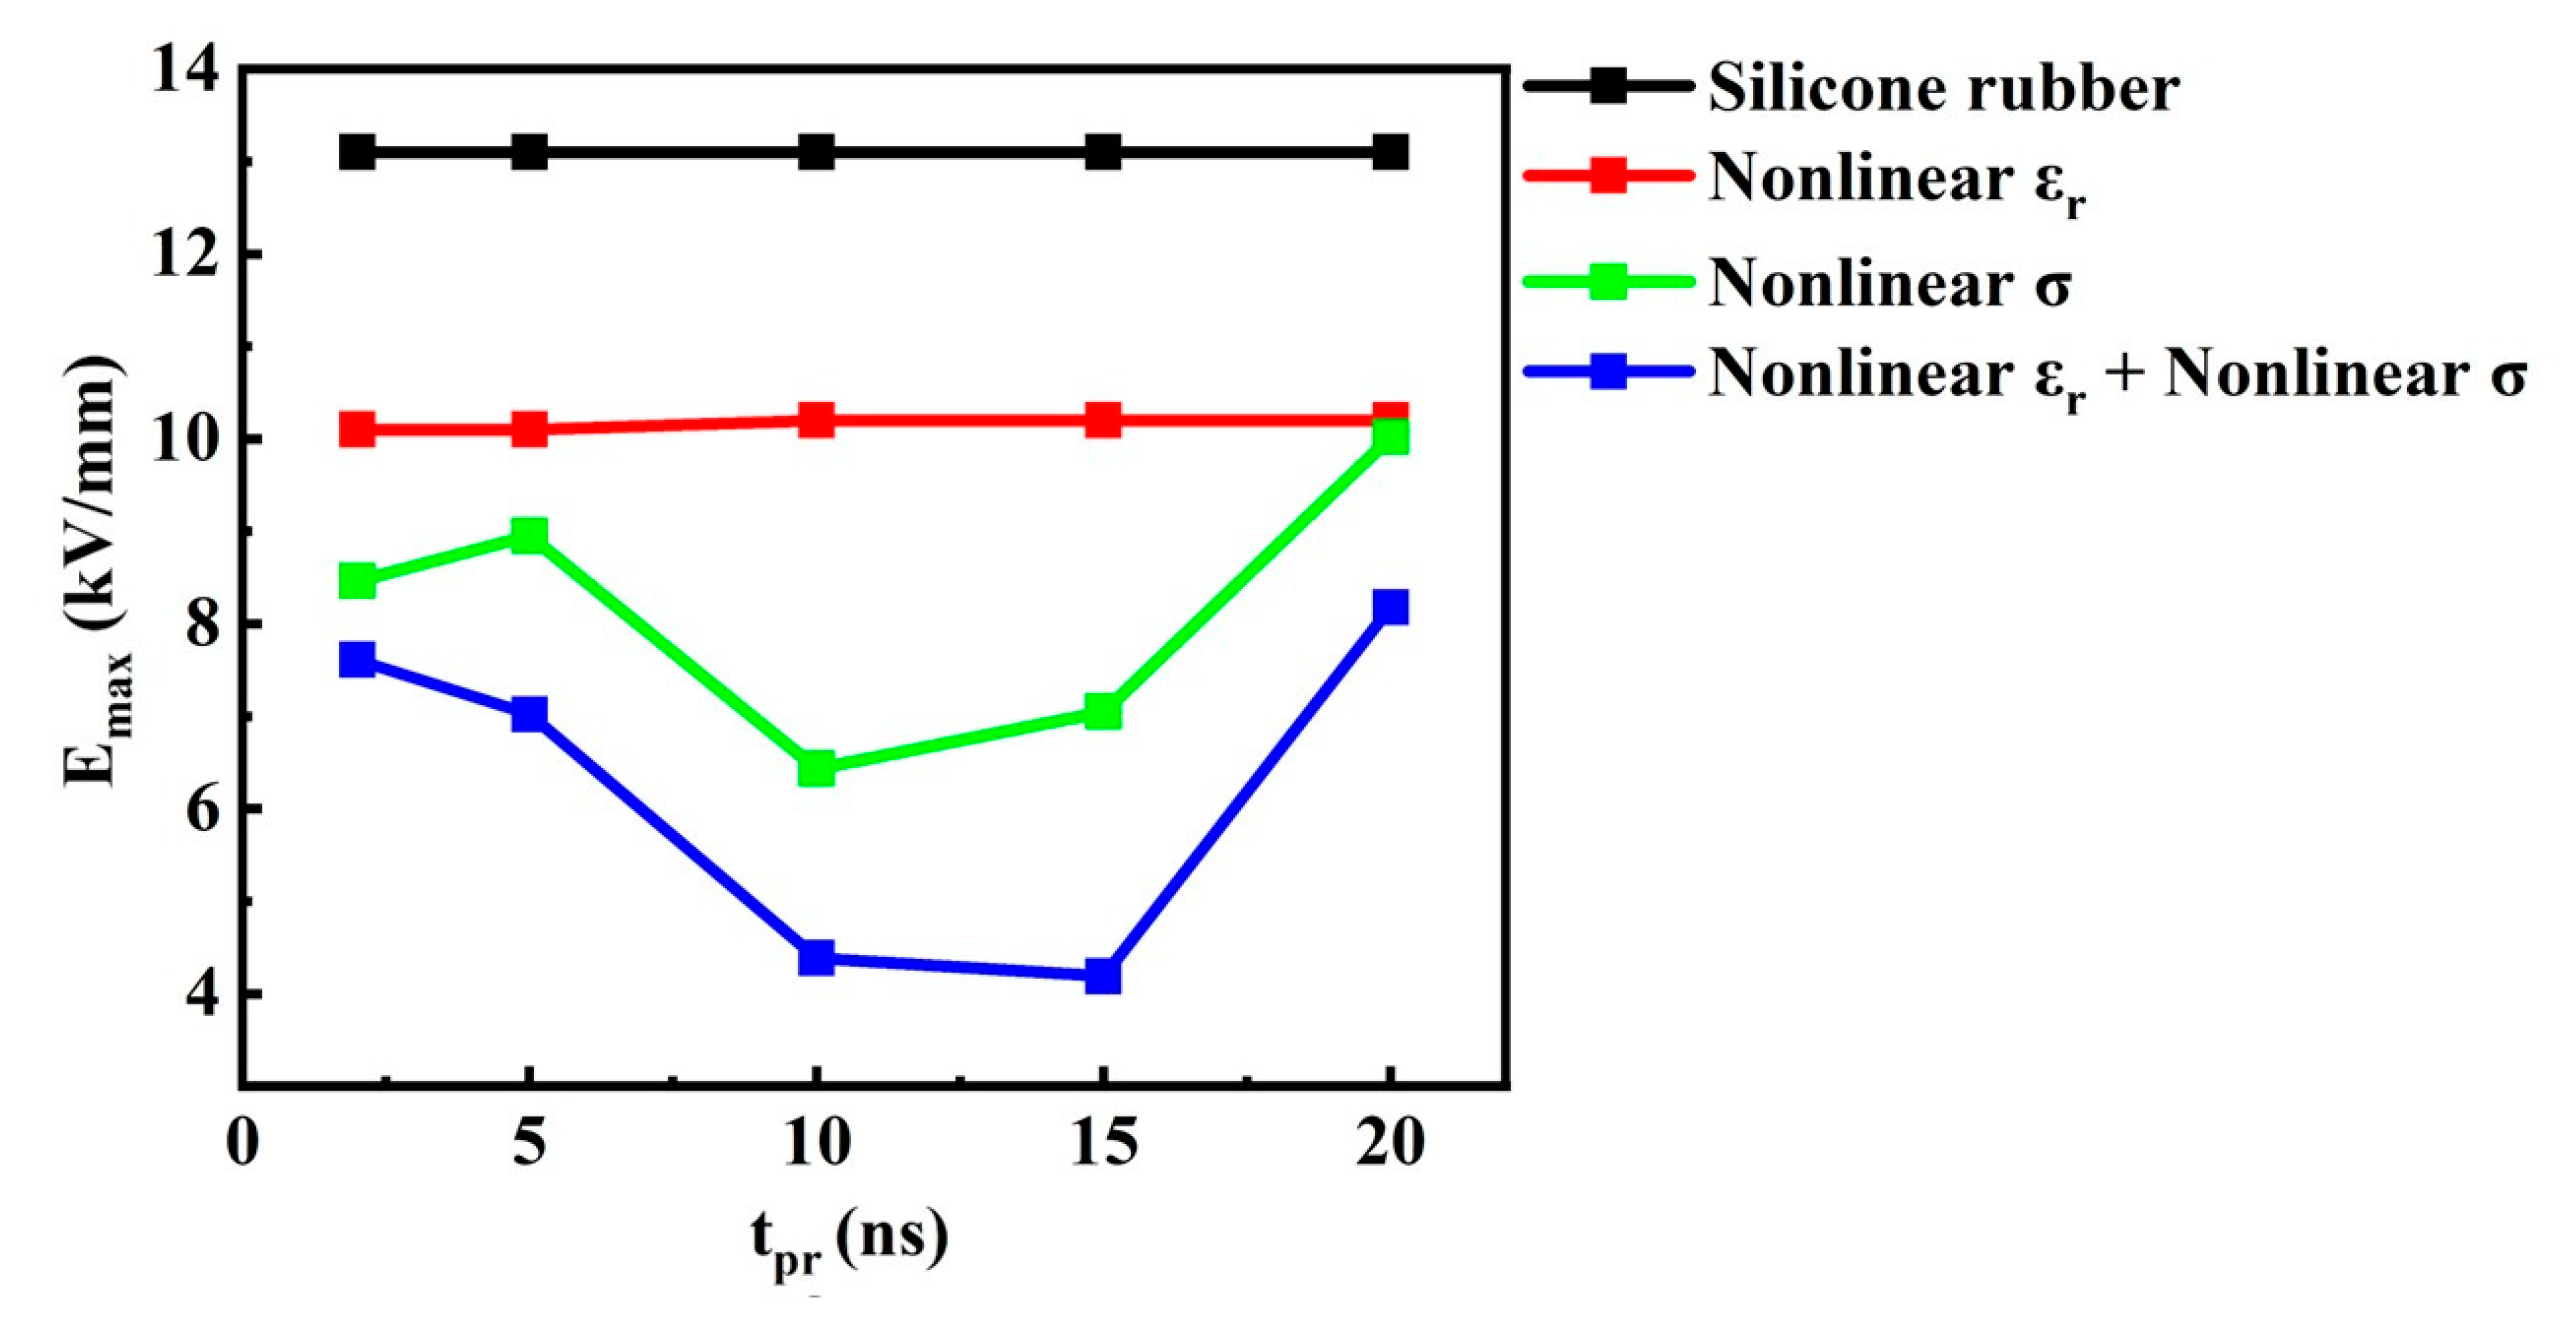
  • The nonlinear composite materials with field-dependent ε and σ exhibit a significantly improved homogenization effect compared to those of the linear materials, e.g., silicone rubber, and materials with merely nonlinear ε or σ . In addition, enhancement of the nonlinearity of the materials is generally favorable for field homogenization.
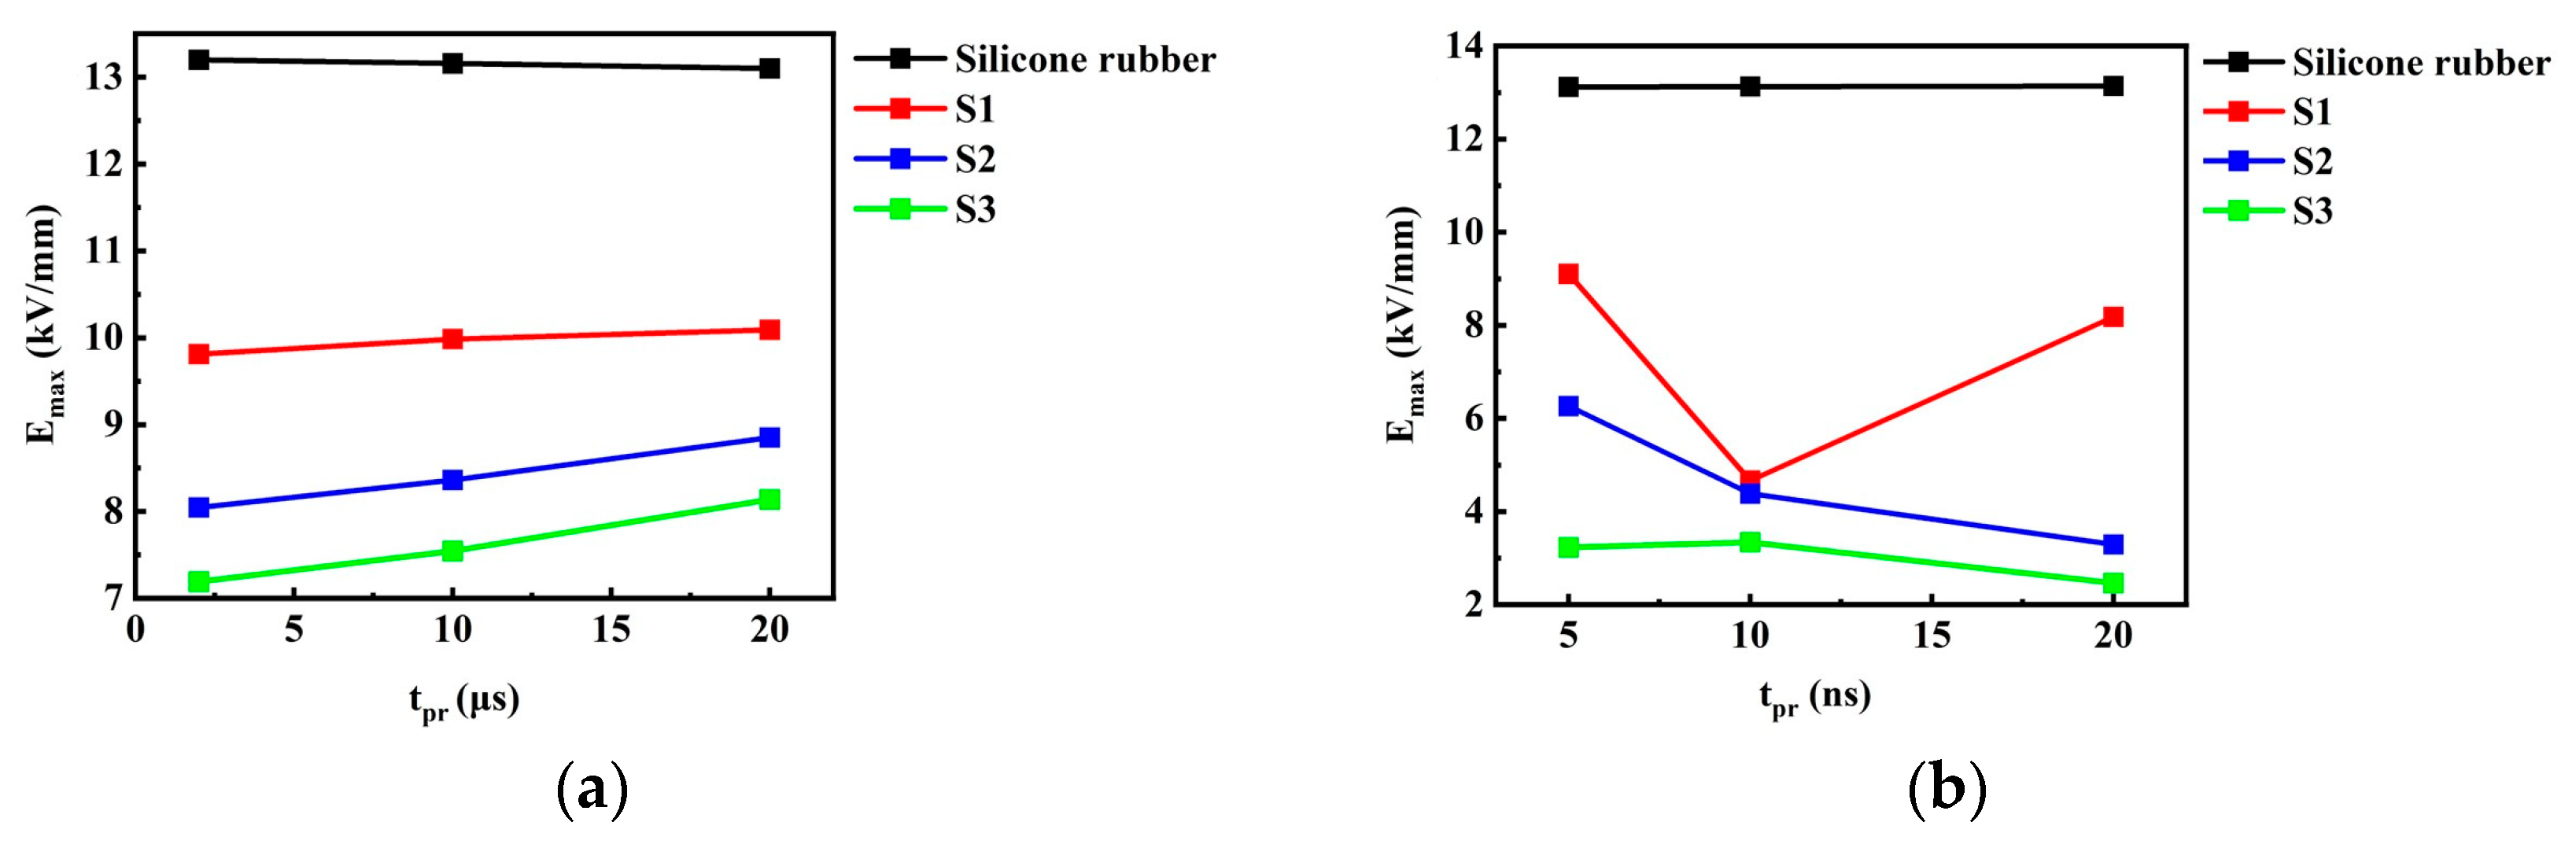
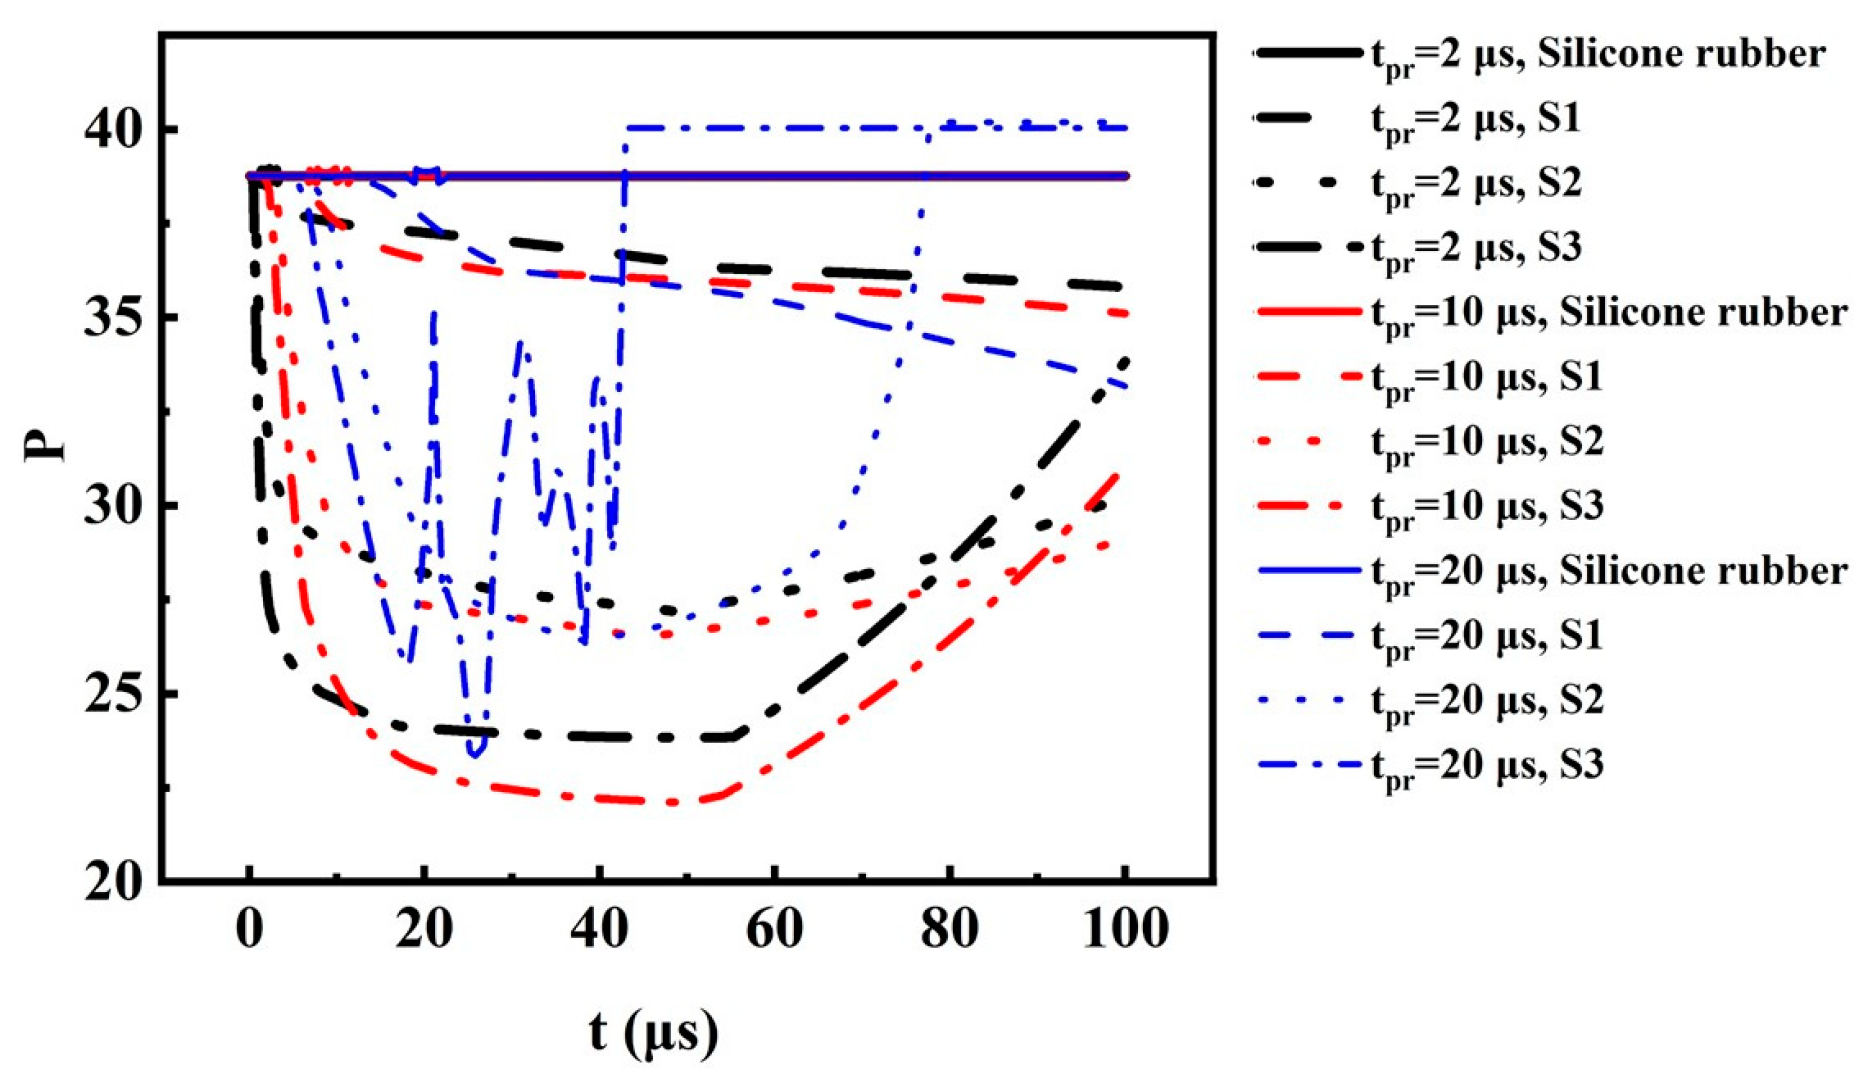
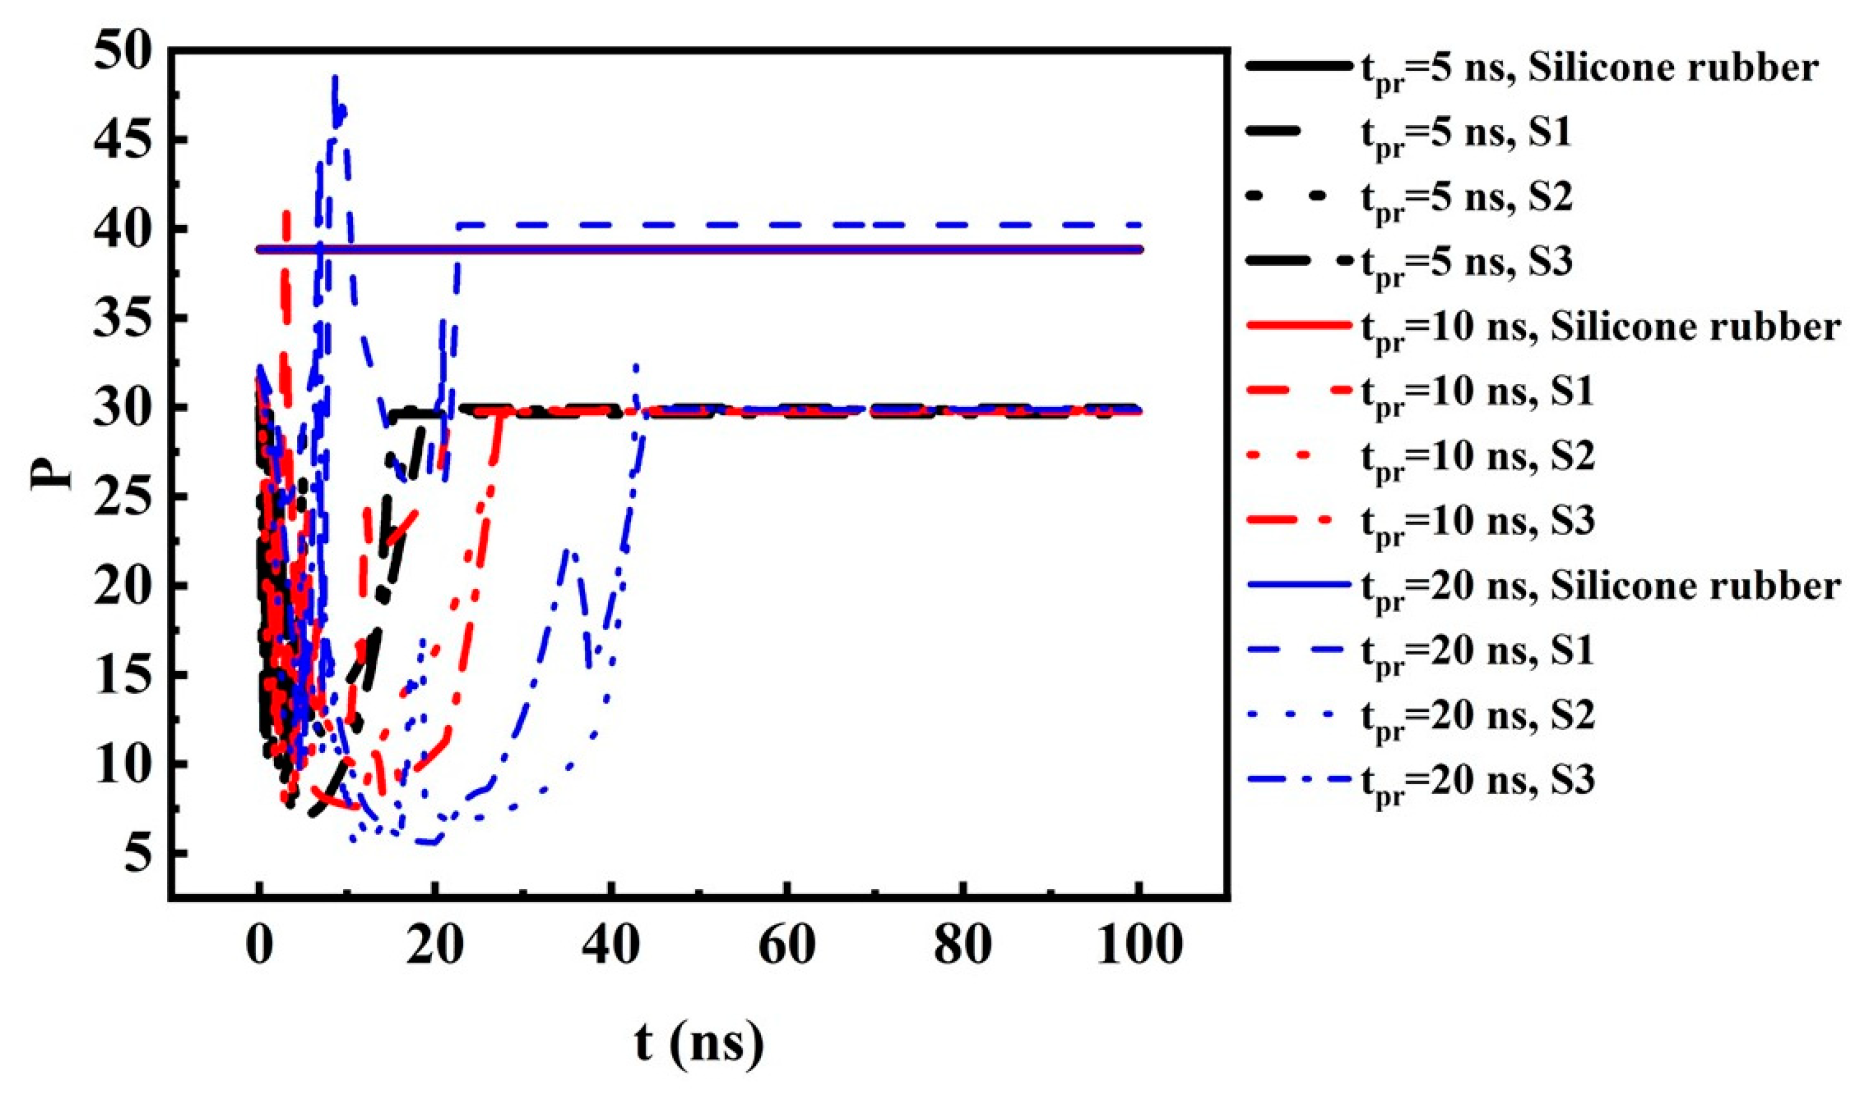
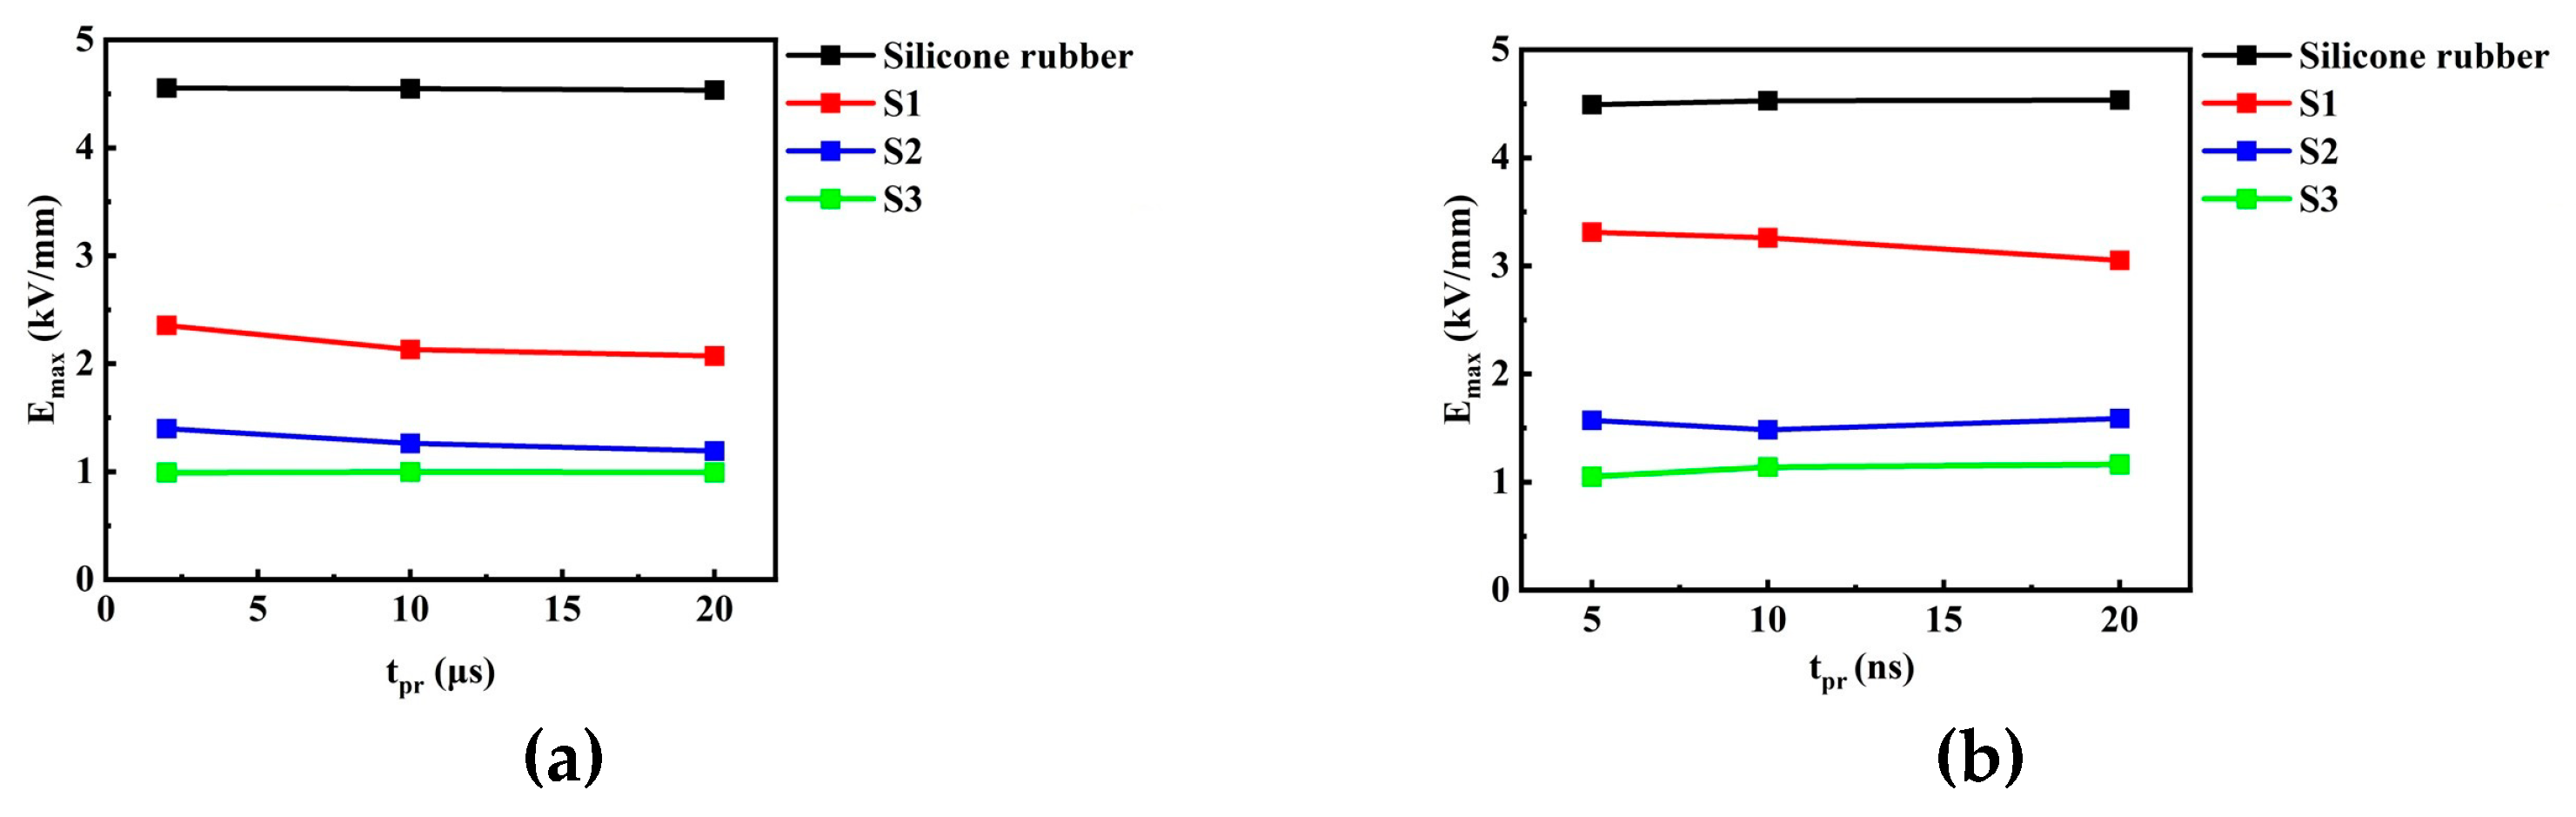
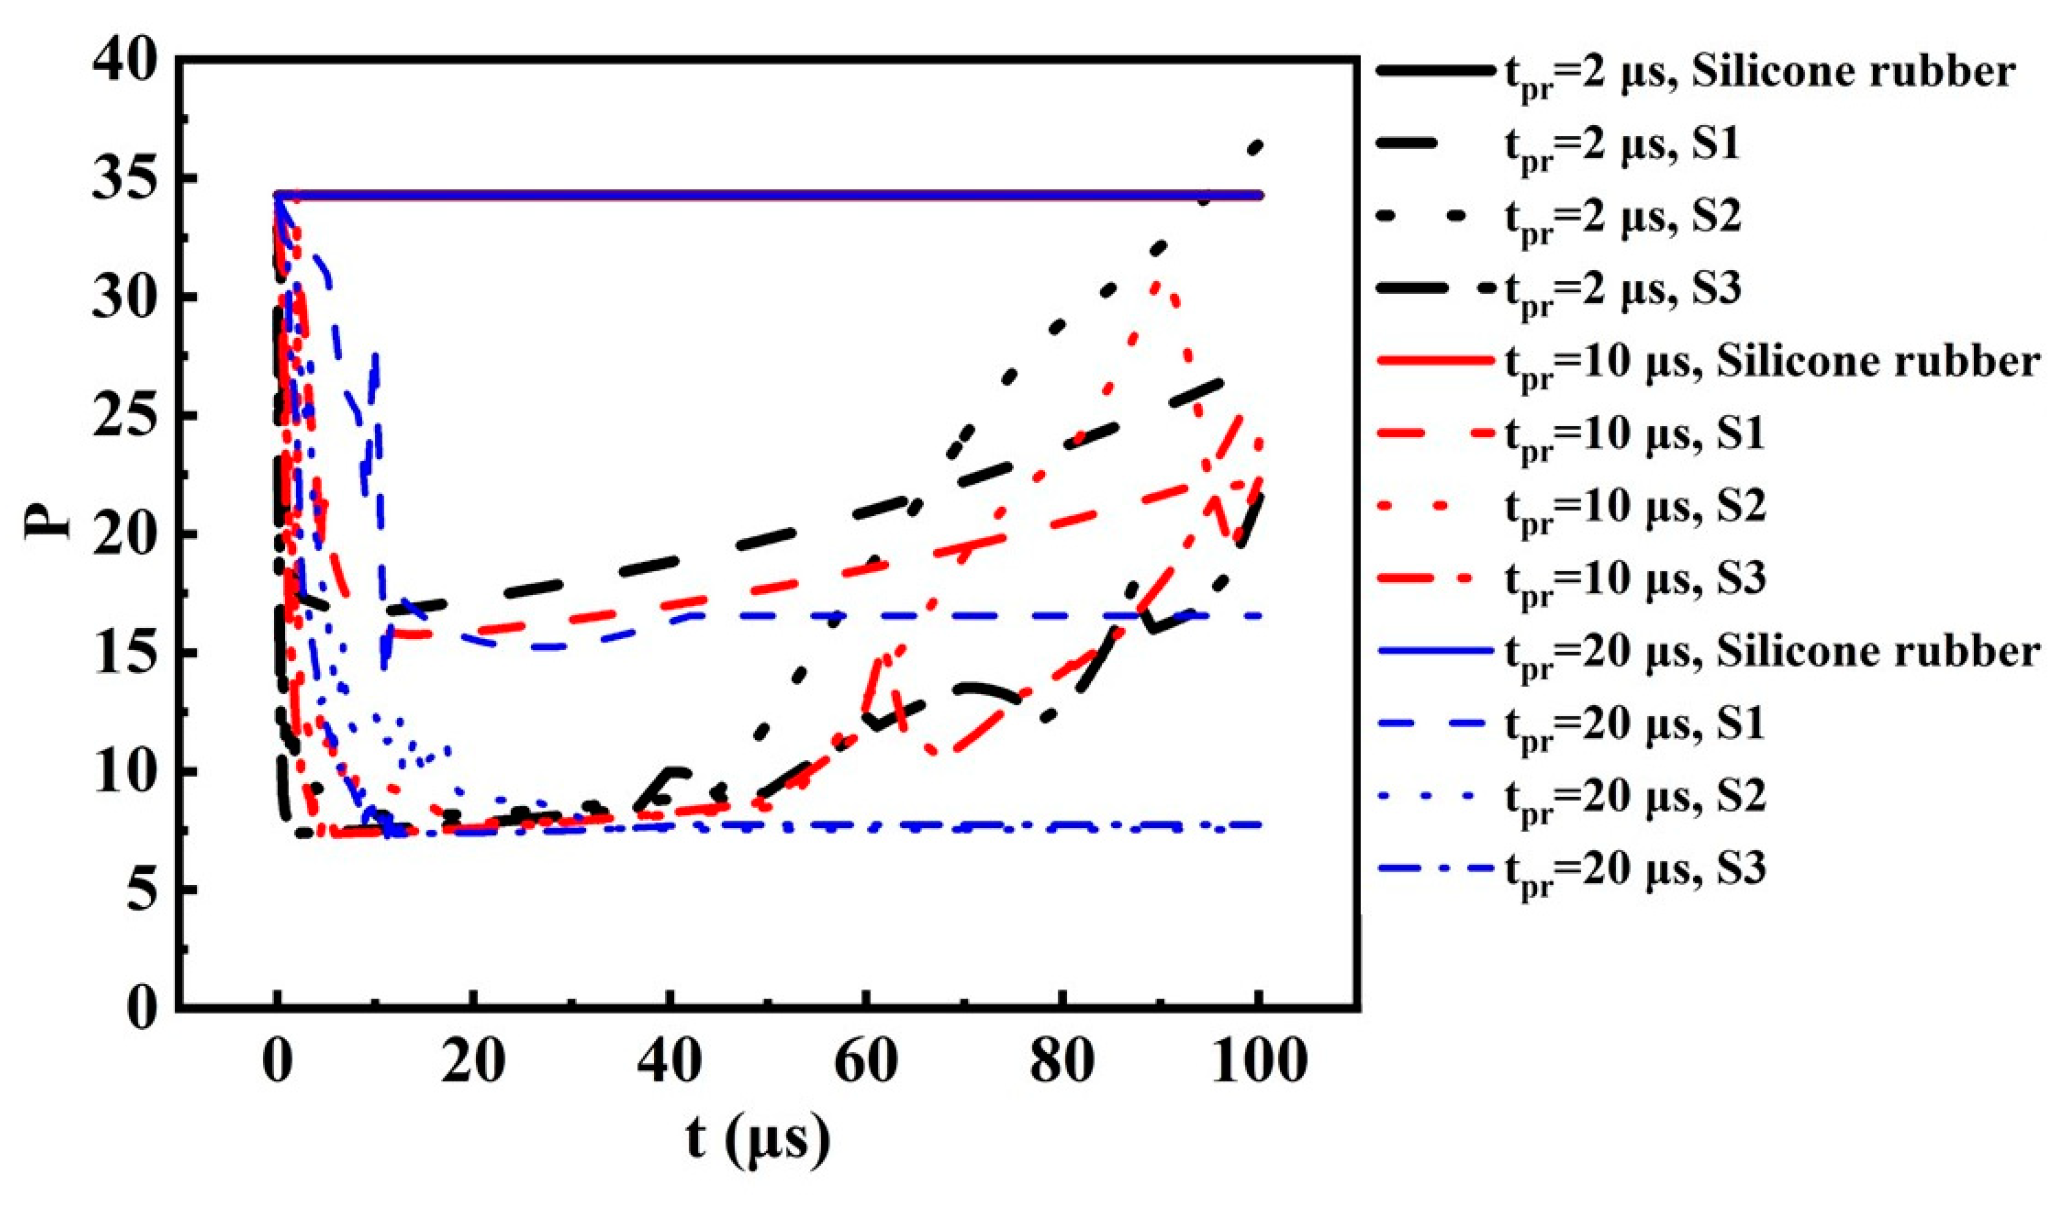
  • The distribution of the internal physical field of the linear material, i.e., silicone rubber, is determined mostly by its material properties, and the non-uniformity P changes very little under various tpr. On the other hand, the nonlinear variations in the material properties are in fact a reflection of the charge relaxation process; thus, tpr and the time profile of the pulsed excitations have significant influence on the non-uniformity P of the nonlinear materials, especially when the timescale of the pulsed field is comparative or shorter than the time-constant of the relaxation process. It can be seen that the influence of tpr is more obvious for nanosecond-scale pulses, which is consistent with the above explanation.
  • Existing experience for homogenization of the electric field intensity under DC or power frequencies is still valid in the presence of pulse excitations of microsecond scale. However, compared with the electric field generated by DC or power frequency sources, the pulsed electric field of nanosecond scale behaves in a different manner; thus, some abnormal phenomena appear. Therefore, inheritance of the measures commonly adopted in DC or power frequency scenarios demands cautious evaluation and implementation when applied to the homogenization of the pulsed electric field of nanosecond scale.
It is worth emphasizing that the limitation of the present research mainly lies in the absence of experimental validation. To evaluate the non-uniformity of the distribution of the electric field intensity within the insulators, measurement of the internal electric field is demanded, which is a troublesome task due to the lack of electric field sensors free of metallic constituents and deliberate deign of experimental apparatus to avoid the sensors interfering with the considered electric field. The development of a dedicated experimental platform and electric field sensors itself is a valuable research topic and will be our focus in the future.

Author Contributions

Conceptualization, J.W., M.M. and J.S.; Data curation, J.W. and M.M.; Funding acquisition, J.W.; Methodology, J.W., M.M. and J.S.; Project administration, J.W. and X.M.; Software, M.M.; Supervision, X.M.; Writing—original draft, J.W. and M.M. All authors have read and agreed to the published version of the manuscript.

Funding

This research was funded by National Key R&D Program of China under Grant 2021YFB2401700, and National Natural Science Foundation of China under grant 52207014.

Data Availability Statement

Data are available upon reasonable request to the corresponding author.

Conflicts of Interest

Author Jinghui Shao was employed by the company TBEA Electrical Equipment Group Co., Ltd. The remaining authors declare that the research was conducted in the absence of any commercial or financial relationships that could be construed as a potential conflict of interest.

References

  1. Akiyama, H.; Katsuki, S.; Redondo, L.; Akiyama, M.; Pemen, A.J.M.; Huiskamp, T.; Beckers, F.J.C.M.; van Heesch, E.J.M.; Winands, G.J.J.; Voeten, S.J.; et al. Pulsed Power Technology. In Bioelectrics; Akiyama, H., Heller, R., Eds.; Springer: Tokyo, Japan, 2017. [Google Scholar] [CrossRef]
  2. Li, L.; Wei, X. Power Interference Suppression Method for Measuring Partial Discharges under Pulse Square Voltage Conditions. Energies 2022, 15, 3437. [Google Scholar] [CrossRef]
  3. Mikrut, P.; Zydroń, P. Numerical Modeling of PD Pulses Formation in a Gaseous Void Located in XLPE Insulation of a Loaded HVDC Cable. Energies 2023, 16, 6374. [Google Scholar] [CrossRef]
  4. Zhang, Y.; Ge, X.H.; Zhao, X.; Yang, X.; Liu, S.; Xuan, J. Flashover of Insulation Materials Induced by Electrostatic Electromagnetic Pulse. COMPEL-Int. J. Comput. Math. Electr. Electron. Eng. 2023, 42, 169–180. [Google Scholar] [CrossRef]
  5. Chen, Z.; Wang, C.; Jia, W.; Cheng, L.; Guo, F.; Xie, L.; Wu, W.; Chen, W. Flashover Voltage of Epoxy FRP Insulators with Different Surface Roughness and Groove under Nanosecond Pulses in SF6. Energies 2022, 15, 2022. [Google Scholar] [CrossRef]
  6. Ren, H.W.; Tanaka, Y.; Miyake, H.; Endo, K.; Li, Q.; Gao, H.; Li, C.; Wang, Z. Research on the Effect of Unipolar Pulse Wave Voltage on Space Charge Characteristics for High-Frequency Equipment Insulation. IEEE Trans. Dielectr. Electr. Insul. 2021, 28, 150–157. [Google Scholar] [CrossRef]
  7. Tang, C.; Huang, B.; Hao, M.; Xu, Z.; Hao, J.; Chen, G. Progress of Space Charge Research on Oil-Paper Insulation Using Pulsed Electroacoustic Techniques. Energies 2016, 9, 53. [Google Scholar] [CrossRef]
  8. Du, B.X.; Jiang, J.P.; Zhang, J.G.; Liu, D.S. Dynamic Behavior of Surface Charge on Double-layer Oil-paper Insulation under Pulse Voltage. IEEE Trans. Dielectr. Electr. Insul. 2017, 23, 2712–2719. [Google Scholar] [CrossRef]
  9. Du, B.X.; Liu, Z.X.; Xiao, M. Effect of Pulse Duration on Surface Charge of Direct-Fluorinated Polyimide Films. IEEE Trans. Dielectr. Electr. Insul. 2016, 22, 3481–3487. [Google Scholar] [CrossRef]
  10. He, J.L.; Yang, X.; Hu, J. Progress of Theory and Parameter Adjustment for Nonlinear Resistive Field Grading Materials. Trans. China Electrotech. Soc. 2017, 32, 44–60. (In Chinese) [Google Scholar]
  11. Fuse, N.; Morita, S.; Miyazaki, S.; Takahashi, T.; Hozumi, N. Estimation Accuracy of the Electric Field in Cable Insulation Based on Space Charge Measurement. Energies 2022, 15, 4920. [Google Scholar] [CrossRef]
  12. Florkowski, M.; Kuniewski, M. Analysis of Space Charge Signal Spatial Resolution Determined with PEA Method in Flat Samples including Attenuation Effects. Energies 2023, 16, 3592. [Google Scholar] [CrossRef]
  13. Dascalescu, L.; Ribardière, P.; Duvanaud, C.; Paillot, J.M. Electrostatic Discharges from Charged Cylindrical Bodies to Grounded or Floating Surfaces. IEEE Trans. Ind. Appl. 2001, 37, 1483–1491. [Google Scholar] [CrossRef]
  14. Winter, A.; Kindersberger, J. Transient Field Distribution in Gas-Solid Insulation Systems under DC Voltages. IEEE Trans. Dielectr. Electr. Insul. 2014, 21, 116–128. [Google Scholar] [CrossRef]
  15. Li, H.; Zebouchi, N.; Haddad, M.; Reid, A.; Ekkel, E. Development of Future Compact and Eco-Friendly HVDC Gas Insulated Systems: Test Verification of Shape-Optimized DC Spacer Models. Energies 2022, 15, 8563. [Google Scholar] [CrossRef]
  16. Nath, D.; Yang, Q.; Montanari, G.; Yin, W.; Xiong, H.; Younsi, K. Modeling and Characterization of Surface Discharges in Insulating Material for Spacers: Electrode Shape, Discharge Mode, and Revision of the Creepage Concept. Materials 2023, 16, 989. [Google Scholar] [CrossRef]
  17. Monga., S.; Gorur, R.S.; Hansen, P.; Massey, W. Design Optimization of High Voltage Bushing Using Electric Field Computations. IEEE Trans. Dielectr. Electr. Insul. 2006, 13, 1217–1224. [Google Scholar] [CrossRef]
  18. Huang, X.Z.; Zhan, J.Y.; Zheng, N.; Zhang, G.J.; Kobayashi, S.; Yamano, Y. Dielectric Characteristics of Typical Organic Insulating Materials for Pulsed Power Field under Different Temperatures in Vacuum. Insul. Mater. 2012, 45, 55–59. (In Chinese) [Google Scholar]
  19. Wang, G.; Chen, Q.; Gao, M.; Yang, B.; Hui, D. Generalized Locally-Exact Homogenization Theory for Evaluation of Electric Conductivity and Resistance of Multiphase Materials. Nanotechnol. Rev. 2019, 9, 1–16. [Google Scholar] [CrossRef]
  20. Xie, J.C.; Hu, J.; He, J.L.; Guo, Z.C.; Yin, Y. Simulation Analyse of Modification Effect of Nonlinear Composites on Nonuniform Electrical Fields. High Volt. Eng. 2014, 40, 741–750. (In Chinese) [Google Scholar]
  21. Mesgarpour Tousi, M.; Ghassemi, M. Effects of Frequency and Temperature on Electric Field Mitigation Method via Protruding Substrate Combined with Applying Nonlinear FDC Layer in Wide Bandgap Power Modules. Energies 2020, 13, 2022. [Google Scholar] [CrossRef]
  22. Hoang, A.T.; Serdyuk, Y.V.; Gubanski, S.M. Charging and Discharge Currents in Low-Density Polyethylene and its Nanocomposite. Energies 2020, 13, 1518. [Google Scholar] [CrossRef]
  23. Xue, Y.; Guo, W.; Sun, Y.; Li, Z.; Han, Y.; Jia, H. Study on Nonlinear Dielectric Properties of Micro Silica. Energies 2023, 16, 2479. [Google Scholar] [CrossRef]
  24. Tavernier, K.; Varlow, B.R.; Auckland, D.W.; Ugur, M. Improvement in Electrical Insulators by Nonlinear Fillers. IEEE Proc.-Sci. Meas. Technol. 1999, 146, 88–94. [Google Scholar] [CrossRef]
  25. Alexander, V.; Kudrin, Y.; Petrov, E.Y. Cylindrical Electromagnetic Waves in a Nonlinear Nondispersive Medium: Exact Solutions of the Maxwell Equations. J. Exp. Theor. Phys. 2010, 110, 537–548. [Google Scholar]
  26. He, J.L.; Sun, G.; Yuan, Z.K.; Huang, Z.W.; Hu, J. Electric Field Distribution Characteristics of High-Voltage Bushing with Nonlinear Electric Field Grading Layer. High Volt. Eng. 2023, 49, 179–187. (In Chinese) [Google Scholar]
  27. Yang, X.; Zhao, X.; Li, Q.; Hu, J.; He, J. Nonlinear Effective Permittivity of Field Grading Composite Dielectrics. J. Phys. D Appl. Phys. 2018, 51, 075304. [Google Scholar] [CrossRef]
  28. de Oliveira, R.M.S.; de Lima, T.S.; Nascimento, J.A.S.; Girotto, G.G. Modeling Time-Evolving Electrical Conductivity in Air Ionization Plasma under DC Voltage: A Finite-Difference Time-Domain Approach for Needle-Plate Setup Based on Laboratory Experiments. Energies 2024, 17, 1799. [Google Scholar] [CrossRef]
Figure 1. Nonlinear conductivities of the composite materials.
Energies 17 04252 g001
Figure 2. Nonlinear permittivity of the composite materials.
Energies 17 04252 g002
Figure 3. Geometry of the needle-plate electrode model.
Energies 17 04252 g003
Figure 4. Electrical field distribution of needle-plate electrodes for silicone rubber insulators.
Energies 17 04252 g004
Figure 7. Maximum electric field intensities Emax in the presence of nanosecond excitations of various tpr.
Energies 17 04252 g007
Figure 8. Maximum electric field intensity Emax within the sample corresponding to various tpr and excitations of both timescales. (a) Microsecond pulse. (b) Nanosecond pulse.
Energies 17 04252 g008
Figure 9. Temporal variation in the nonuniformity P of the electric field distribution in the sample in the presence of pulse excitations of microsecond scale.
Energies 17 04252 g009
Figure 10. Temporal variation in the nonuniformity P of the electric field distribution in the sample in the presence of pulse excitations of nanosecond scale.
Energies 17 04252 g010
Figure 11. Geometry of the high-voltage bushing with an electric field equalization layer.
Energies 17 04252 g011
Figure 12. The distribution of the electric field intensity in the busing with the equalization layer made of silicone rubber.
Energies 17 04252 g012
Figure 13. Maximum electric field intensity Emax in the high-voltage bushing corresponding to various tpr and excitations of both timescales. (a) Microsecond pulse. (b) Nanosecond pulse.
Energies 17 04252 g013
Figure 14. Temporal variation in the nonuniformity P of the electric field distribution in the high-voltage bushing in the presence of pulse excitations of microsecond scale.
Energies 17 04252 g014
Figure 15. Temporal variation in the nonuniformity P of the electric field distribution in the high-voltage bushing in the presence of pulse excitations of nanosecond scale.
Energies 17 04252 g015
Figure 16. Emax corresponding to fixed length H = 1000 mm of the equalization layer and varying positions of the grounding shield. (a) Microsecond pulse. (b) Nanosecond pulse.
Energies 17 04252 g016
Figure 17. Emax corresponding to fixed position (d = 5 mm) of the grounding shield and varying length H of the equalization layer. (a) Microsecond pulse. (b) Nanosecond pulse.
Energies 17 04252 g017
Table 1. Parameters of linear materials.
Linear Material σ (S/m) ε r (1)
Silicone rubber1.00 × 10−144.3
Copper5.80 × 1061.0
Air01.0
Table 2. Parameters of nonlinear composite materials.
Nonlinear Material ε r 0 (1) σ 0 (S/m) α 1 , α 2 (m/V)
S14.310−1410−510−7
S22 × 10−52 × 10−7
S33 × 10−53 × 10−7
Table 3. Sensitivity test of the needle-plate model in terms of mesh density. The excitation is the nanoscale pulse with tpr = 5 ns. The investigated nonlinear material is S2 defined in Table 2.
Number of ElementsMaximum Edge Length (mm)Emax (kV/mm)P
346810.516.24615.985
51727.046.27614.614
92103.896.25314.537
17,7252.106.26514.211
61,3771.056.28814.219
Table 4. Sensitivity test of the needle-plate model in terms of time-step size. The excitation is the nanosecond-scale pulse with tpr = 5 ns. The investigated nonlinear material is S2 defined in Table 2.
Time-Stepping MethodMaximum Time-Step Size (ns)Time IterationsEmax (kV/mm)P
Backward
difference
23266.26514.211
0.111616.27514.608
0.0110,1706.26314.41
Generalized
alpha
0.0110,0226.26814.482
0.001100,0116.25814.373
Table 5. Sensitivity test of the needle-plate model in terms of time-step size. The excitation is the microsecond-scale pulse with tpr = 10 μs. The investigated nonlinear material is S2 defined in Table 2.
Time-Stepping MethodMaximum Time-Step Size (μs)Time IterationsEmax (kV/mm)P
Backward
difference
21288.36329.270
0.111148.36729.365
0.0110,0178.36529.175
Generalized
alpha
0.0110,0228.36329.168
0.001100,0098.35329.099
Table 6. Numerical results of insulator samples made of materials of different strengths of nonlinearity.
ExcitationsSample MaterialMaximum Field Intensity Emax (kV/mm)Electric Field Non-Uniformity (P)
tpr = 5, 10, 20 nstpr = 5, 10, 20 ns
Nanosecond pulseSilicone rubber13.122, 13.126, 13.14032.490, 32.490, 32.490
S19.103, 4.664, 8.18016.760, 12.400, 29.555
S26.265, 4.385, 3.29314.211, 10.257, 7.236
S33.228, 3.342, 2.4637.203, 7.707, 5.611
tpr = 2, 10, 20 μstpr = 2, 10, 20 μs
Microsecond pulseSilicone rubber13.200, 13.158, 13.10038.888, 38.590, 38.871
S19.813, 9.986, 10.09238.497, 37.530, 37.624
S28.046, 8.363, 8.85332.143, 29.270, 28.986
S37.191, 7.544, 8.13927.731, 25.267, 29.250
Table 7. Sensitivity test of the high-voltage bushing model in terms of mesh density. The excitation is the nanoscale pulse with tpr = 5 ns. The investigated nonlinear material is S2, defined in Table 2.
Number of ElementsMaximum Edge Length (mm)Emax (kV/mm)P
60877111.48211.75
82982161.48512.15
11,2341441.48311.18
36,61321.61.48211.25
Table 8. Sensitivity test of the needle-plate model in terms of time-step size. The excitation is the nanosecond-scale pulse with tpr = 5 ns. The investigated nonlinear material is S2, defined in Table 2.
Time-Stepping MethodMaximum Time-Step Size (ns)Time IterationsEmax (kV/mm)P
Backward
difference
21051.48311.18
0.110231.48511.23
0.0110,0171.48711.20
Generalized
alpha
0.111251.48512.06
0.0110,0071.48111.16
Table 9. Sensitivity test of the needle-plate model in terms of time-step size. The excitation is the microsecond-scale pulse with tpr = 10 μs. The investigated nonlinear material is S2, defined in Table 2.
Time-Stepping MethodMaximum Time-Step Size (μs)Time IterationsEmax (kV/mm)P
Backward
difference
21531.2619.463
0.110411.2659.451
0.0110,0171.2659.445
Generalized
alpha
0.0110,0228.3639.426
0.001100,0098.3539.351
Table 10. Numerical results of the high-voltage bushing with electric field equalization layers of various lengths and positions.
ExcitationsLength and Position of the LayerMaximum Field Intensity Emax (kV/mm)Electric Field Non-Uniformity (P)
tpr = 5, 10, 20 nstpr = 5, 10, 20 ns
Nanosecond pulseH1(1000 mm)d1(0 mm)2.14,2.57,2.1116.17,19.33,15.89
d3(10 mm)1.89,1.85,1.8414.24,13.93,13.87
d2(5 mm)1.57,1.48,1.5911.91,11.24,11.96
H2(1300 mm)1.60,1.54,1.6012.09,11.61,12.02
H3(1600 mm)1.65,1.80,1.6712.52,13.52,12.60
tpr = 2, 10, 20 μstpr = 2, 10, 20 μs
Microsecond pulseH1(1000 mm)d1(0 mm)1.88,1.75,1.8214.13,13.29,13.75
d3(10 mm)1.57,1.48,1.4811.78,11.19,11.09
d2(5 mm)1.40,1.26,1.1910.47,9.46,8.96
H2(1300 mm)1.26,1.21,1.169.40,9.11,8.76
H3(1600 mm)1.25,1.18,1.139.37,8.90,8.51
Table 11. Main conclusions of this manuscript.
ConclusionsExplanations
Findings
The composite materials with nonlinear ε and σ exhibit the best homogenization effect.
Field-dependent ε and σ can adaptively regulate the local electric field.
The time profile and tpr of the pulses have considerable influence on the behavior of the nonlinear materials.
Due to the charge relaxation process reflected by the nonlinear parameters, tpr and time profiles of the pulses have great impact on the behavior of the nonlinear materials, especially under nanosecond scales.
Homogenization measures developed for DC and power frequency condition are still trustworthy for the microsecond scale, but may not be valid for the nanosecond scale.
The nonlinear materials exhibit abnormal behavior under nanosecond scales due to the relaxation process, which is similar to the case in the second finding.
Limitations
Experimental validation is absent in the current research.
Lack of electric field sensors free of metallic constituent.
Deployment of the sensors can interfere the considered electric field.
Disclaimer/Publisher’s Note: The statements, opinions and data contained in all publications are solely those of the individual author(s) and contributor(s) and not of MDPI and/or the editor(s). MDPI and/or the editor(s) disclaim responsibility for any injury to people or property resulting from any ideas, methods, instructions or products referred to in the content.

