Article

Experimental and Numerical Simulation Research on Different Shapes of Flame-Stabilizing Baffles in the Furnace

1
School of Energy and Mechanical Engineering, Jiangxi University of Science and Technology, Nanchang 330044, China
2
National Energy Group Nanning Power Generation Co., Ltd., Nanning 530028, China
*
Author to whom correspondence should be addressed.
Energies 2024, 17(17), 4253; https://doi.org/10.3390/en17174253
Submission received: 15 July 2024 / Revised: 20 August 2024 / Accepted: 21 August 2024 / Published: 26 August 2024
(This article belongs to the Section K: State-of-the-Art Energy Related Technologies)

Abstract

:
The use of fully premixed combustion in small gas boilers can improve denitrification efficiency. On the basis of fully premixed combustion, adding flame stabilizers inside the boiler can further reduce production of oxides of nitrogen. Four types of flame-stabilizing baffles were added at a certain position inside the furnace after the fully premixed burner. Experiments were conducted separately on the Noporous baffle, and numerical calculations were performed for 36 operating conditions of the four baffles. The experimental results and numerical calculations indicate that under experimental conditions, NOx emissions were all below 40 mg/m3, and the net heat efficiency of the boiler was above 80%. Under a maximum firing rate, CO emissions are below 20 ppm, and the minimum error between the calculated and experimental values is 2.2%. The calculation error of CO emissions under various working conditions does not exceed 6.8%, indicating that the impact of different-shaped baffles on CO emissions is relatively small. When installing a Nonporous baffle, the error between the experimental and calculated exhaust temperature values under minimum firing rates is 6.6%, the error between the calculated and measured values under middle firing conditions is 2.9%, and the error between the calculated and measured values under maximum firing rate conditions is 3.0%. Among the four different partition conditions, the exhaust temperature of the Nonporous baffle is the lowest. Under the same excess air coefficient, the pressure in the furnace for the middle and maximum firing rate is higher than that of the minimum firing rate, and the experimental values are in good agreement with the calculated values. When installing the Strip baffle, the calculated CO2 emission is the lowest. The experimental results show that the NOx in the flue gas inside the furnace is mainly NO, and the NO content exceeds 75%, reaching a maximum of 85%. The experimental results show that the minimum NOx emission value is 26.9 mg/m3. The error between the measured and calculated NOx values when installing a Nonporous baffle is 20.4%. All of the above indicate that installing a flame-stabilizing baffle at an appropriate position in the furnace can further reduce NOx emissions, and the optimization amplitude is related to the shape of the baffle.

1. Preface

The energy sector of the world is facing two major problems: one is the shortage of traditional energy, and the other is the large amount of pollutants generated by the combustion of traditional energy [1]. Traditional energy sources mainly rely on fossil fuels such as coal, oil, and natural gas, and the most direct impact of their combustion on the Earth is the greenhouse effect [2], and NOx is the main pollutant causing the greenhouse effect [3,4,5]. Therefore, with the increasing awareness of environmental protection and the proposal of the “dual carbon” goal, the restrictions on the use of fossil fuels are becoming increasingly strict [6]. Among the three traditional fossil fuels mentioned above, natural gas is the cleanest. Therefore, in the process of seeking more new energy sources to replace traditional energy, more and more coal-fired or oil-fired boilers are being replaced by natural gas boilers.
In recent years, there has been an increasing call for reducing NOx emissions, as NOx has become one of the 30 most serious pollutants that harm humanity. The threats posed by NOx to humanity include acid rain, photochemical smog, ozone depletion, and global climate change. The UK had strict restrictions on NOx emissions as early as 2001, limiting them to no more than single-digit ppm [7]. In 2014, China issued the emission standard GB 13271-2014 [8] for atmospheric pollutants from boilers. With increasingly strict environmental requirements, the emission limits of this standard are no longer sufficient to meet the requirements. Local standards issued by various regions are much stricter, with most newly built boilers having NOx emissions limited to below 50 mg/m3 [9]. To meet the requirements of ultra-low NOx emissions, the furnace needs to meet the following conditions: lower flame center temperature, avoid fuel-rich areas in high-temperature areas, and keep fuel in oxidizing areas for a short period of time [10]. Based on the above theory, in small gas boilers, due to the limited space, if a common combustion device is used, the flame is prone to flush the water-cooled wall, causing the water-cooled wall to burst and CO production to increase sharply. At the same time, due to the long flame length, it also increases the residence time of flue gas in the high-temperature zone, leading to an increase in thermal NOx production. Therefore, a fully premixed burner is used instead of a traditional long-flame combustion device [11]. The core technology of condensing boilers lies in the burner, so fully premixed burners are more commonly used in condensing boilers. Due to the similarity in combustion space between small gas boilers and condensing boilers, fully premixed burners are also more commonly used in small gas boilers. The porous fully premixed burner has good flame stability, and the materials and forms used are generally metal fibers, ceramics, flame stabilizers, and metal stainless steel fins [12,13].
The premixed combustion method has unique advantages, so there are also many studies on premixed combustion. Yu et al. [12] studied porous burners made of three materials: fiber metal (MF), ceramic (CM), and finned stainless steel (SF). The MF type had the highest NOx emissions and thermal efficiency, while the SF type had the lowest NOx emissions and thermal efficiency. Taking into account various factors, MF is the most suitable material for the studied working conditions. Minutolo et al. [14] studied a new type of burner and summarized the advantageous performance of this combustion device. Keramiotis et al. [15] studied a porous medium burner with CO emissions as low as 50 ppm and NOx emissions around 25 ppm. Yu et al. [16] studied the fully premixed combustion-coupled flue gas recirculation method, and the results showed that using flue gas recirculation can reduce NOx and CO content while improving thermal efficiency by 4.7%. The experimental results showed that flue gas recirculation (EGR) can significantly reduce pollutant emissions and improve the safety of combustion.
Son Jeongeun et al. [17] used an immersion gasifier to remove generated NOx from flue gas. The removal efficiency is related to factors such as reaction temperature, pH value of water, residence time of flue gas in water, excess air coefficient, H2O2 concentration, etc. It can be seen that its denitrification method is a typical post-treatment method. Amirjavad Ahmadian Hosseini et al. [18] studied the effect of the swirl coefficient on the power field, temperature distribution, and radiation heat flux density inside the furnace. Increasing the swirl coefficient can make the temperature distribution inside the furnace more uniform; adjusting the swirl number can produce better internal and external flue gas recirculation while reducing the maximum temperature, thereby reducing the generation of thermal NOx. The optimal swirl coefficient can increase radiation efficiency by 36.5% and reduce NOx emissions by up to 78.6%. Ryosuke MATSUMOTO et al. [19] studied the combustion of methyl ether (DME). Due to its high combustion rate and low ignition point, the use of flue gas recirculation has a good inhibitory effect on NOx. When the flue gas circulation rate is between 25 and 48%, the NOx emissions are not higher than 10 ppm, and oxygen must be reduced under high cycle rate conditions.
The above methods use flue gas reflux for denitrification, achieving a good denitrification effect. Due to the low temperature of flue gas reflux, the temperature of the main combustion zone is reduced, and the decrease in temperature of the main combustion zone is not significant, so its denitrification effect is affected. If we want to reduce the temperature of the main combustion zone from a combustion perspective, using a fully premixed burner can achieve better results. Jorn Hinrichs et al. [20] used 3D full-scale numerical simulation to calculate the surface premixed burner on a condensing boiler. The calculation results showed that the temperature difference between flame surfaces at different positions reached 200 K, and the maximum temperature difference in porous media reached 450 K. Compared with experimental results, CO emissions were underestimated by nearly 50%, while NOx calculated values were 20% higher than experimental values. Liu Chunjing et al. [21] studied the premixed combustion of coal powder and air using experimental and numerical methods and concluded that under certain excess air coefficient conditions, MILD combustion can be achieved, NOx emissions can be reduced, and maximum thermal efficiency can be achieved. The temperature of secondary air has a significant impact on the temperature distribution and NOx emissions inside the furnace, while the concentration of primary air has a relatively small impact on NOx emissions. The chemical reaction between N and O under high temperature conditions is intense, resulting in a large amount of NOx generation. Ghasem Khabbazian et al. [22] achieved flameless combustion using a premixed burner and coupled it with a flue gas recirculation method to dilute the oxygen that supports combustion. The highest temperature in the furnace was uniform, and the temperature throughout the entire furnace decreased, resulting in a significant reduction in CO/NO emissions and a significant reduction in renovation costs compared to other methods. Huang Mingming et al. [23] constructed a two-stage combustion device and implemented MILD combustion on it. Experimental and numerical simulation results showed that staged combustion has a significant impact on the implementation of the MILD method. High-stage combustion can reduce ignition time and NOx emissions. MILD combustion exhibits excellent emission reduction performance, with NOx and CO emissions as low as 4 ppm under certain operating conditions. Cai Siqi et al. [24] used numerical simulation to study a micro “disc” combustion device, which can be used as a micro heater or as a small power generation device. Numerical calculations showed that the temperature of the combustion area decreased with the decrease in the Reynolds number (Re) and combustion ratio (φ) in the furnace, and the thermal power in the furnace increased with the increase in Reynolds number. With the increase in thermal conductivity, the uniformity of the outer surface temperature was significantly improved. This fully premixed structure of the burner has excellent thermal performance, providing ideas for the design of other burners and combustion spaces. Kuang Yucheng et al. [25] used an improved EDC (Eddy Dissipation Concept) model to study traditional combustion and MILD combustion. The original EDC model can accurately predict traditional combustion methods, but for MILD combustion, its predicted temperature and NOx emissions are higher. However, using an improved EDC model can accurately predict MILD combustion, making it difficult to accurately determine whether combustion belongs to MILD combustion solely through numerical simulation. The improvement of the EDC model has a significant impact on temperature and component content but has a relatively small impact on flow. Therefore, the main difference between traditional combustion and MILD combustion methods lies in the flow field distribution. Therefore, the flow field parameters can be used to determine whether it belongs to MILD combustion. Hu Fan et al. [26] used experimental methods to study the conditions for achieving MILD combustion when residual carbon and coal powder are co-fired. MILD combustion can be achieved in both symmetric and asymmetric structures. Compared to swirl low NOx combustion, NOx emissions are reduced by 54%, and the combustion efficiency reaches 94%, with CO emissions of only 20 ppm. Selsabil Boussetla et al. [27] used numerical simulation to calculate the NO generation pathway during biogas synthesis combustion. The results showed that when H2 was added to the synthesis gas, the temperature level in the furnace significantly increased, and when H2 was involved in combustion, NO generation was mainly rapid. When the O2 content increases, the temperature field rises significantly and is extremely prone to disrupting the MILD combustion state. When the O2 content is high, NO generation is mainly thermal. An increase in reaction rate can lower the temperature level, thus better maintaining the MILD combustion mode in the furnace. When the reaction rate is low or moderate, NO generation is mainly rapid and NNH type. When the reaction rate is high, NO generation is mainly NNH type. The chemical reaction pathways at different temperatures and equivalence ratios indicate that simplified mechanisms, such as the Westbrook mechanism [28] and Jones and Lindstedt mechanism [29], are not applicable to the MILD combustion mechanism.
From the above analysis, it can be seen that the fully premixed burner has good combustion and denitrification performance. If flue gas recirculation is added to the combustion system, it can further reduce NOx emissions. MILD combustion has excellent emission performance, and achieving MILD combustion can be achieved through premixed or non-premixed methods, which can achieve ultra-low NOx emissions. The above two methods were studied on the combustion system itself, and both achieved good denitrification effects. For small fully premixed gas boilers, installing internal smoke baffles with different structures can change the aerodynamic field and temperature field inside the furnace, thereby changing the NOx emission status. By conducting experimental measurements and numerical calculations, the NOx and CO emissions at the chimney inlet were measured and compared, and the NOx generation inside the furnace was calculated and compared. Finally, the optimal shape of the smoke baffle was determined.

2. Surface Combustion and Aerodynamic Field Experiments

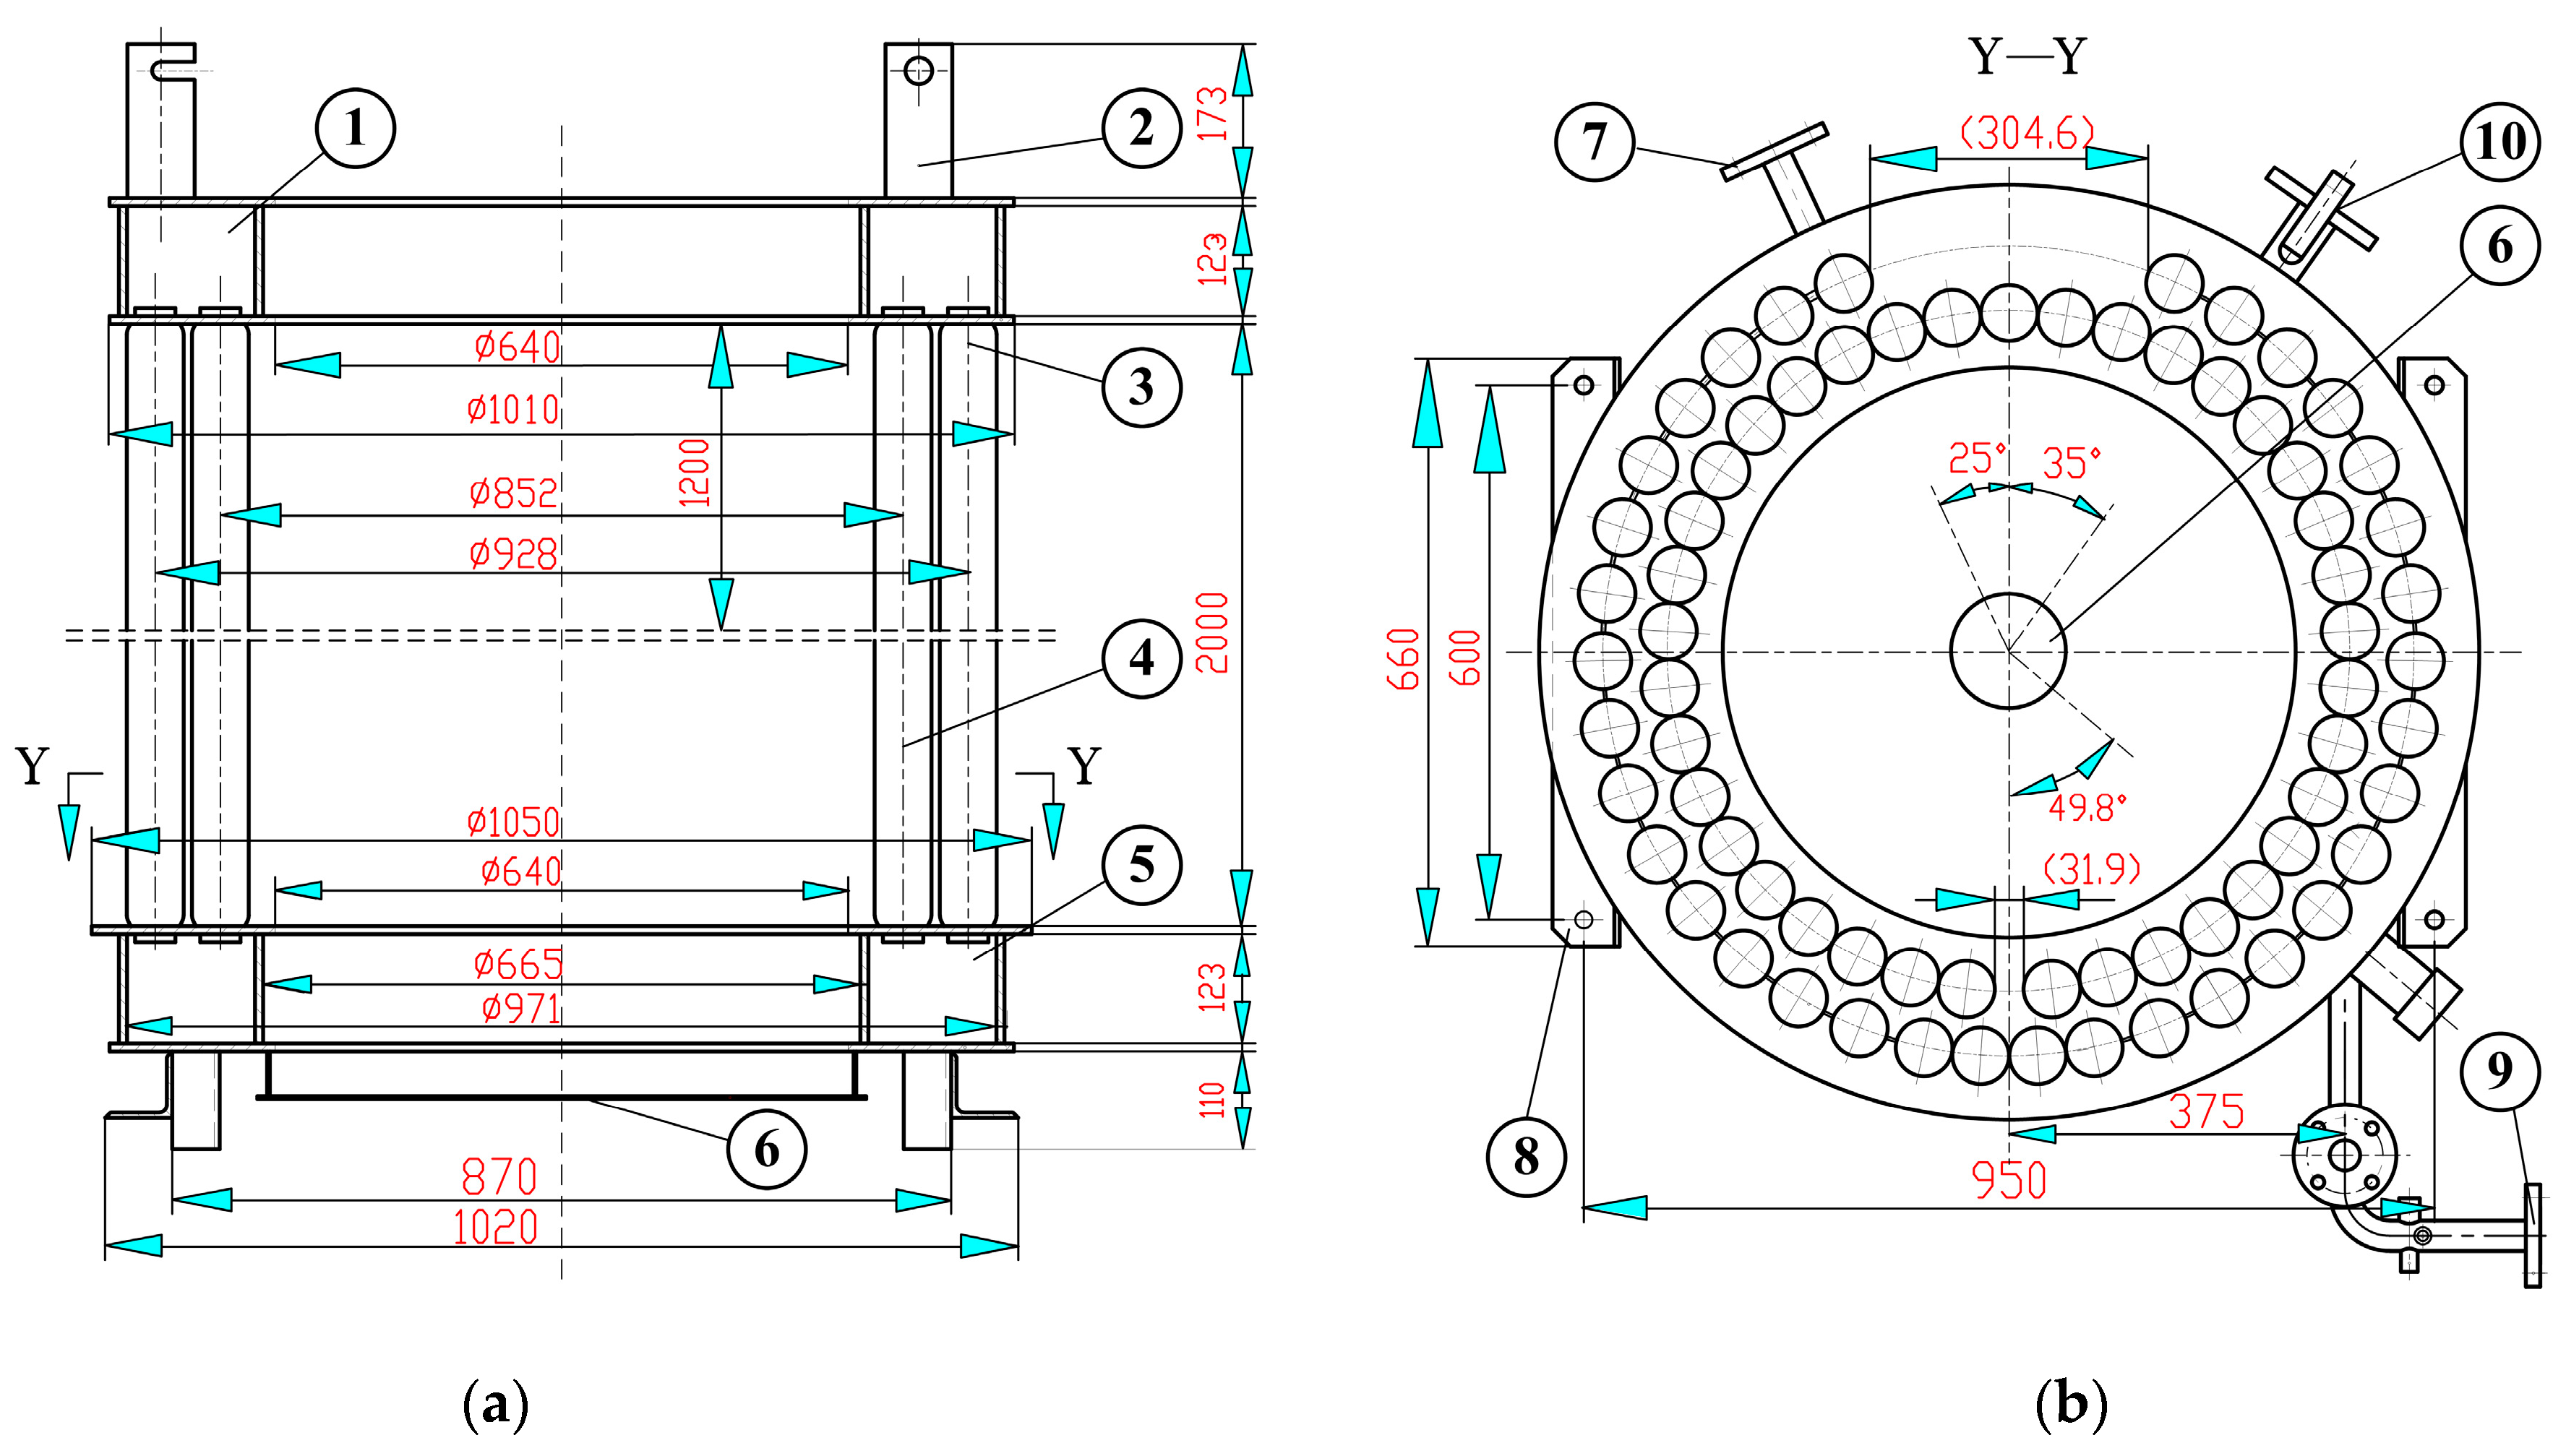
2.1. Boiler Experimental System Dimensions and Photos

By using a new static premixing device, natural gas and air are uniformly mixed in a certain proportion before entering the burner. The fully premixed low-N combustion system can achieve a good denitrification effect [9,30]. The combustion device is installed on the top of a vertical gas boiler, which provides steam to the user. The natural circulation steam boiler is equipped with upper and lower headers. Due to the much higher heat load of the inner water-cooled wall pipe compared to the outer side, the inner water-cooled wall pipe is an upward pipe and the outer side is a downward pipe. The upper header also serves as a separator, and the steam that meets the requirements is collected through the header and then transported to the user. The main components of the steam boiler include the burner, water-cooled wall, base, lifting rings, inlet and outlet joints, and header. The boiler produces 2 tons of steam per hour with a furnace box size of 2529 × 1010 × 1065. The combustion chamber is a cylindrical structure with a diameter of 800 mm and a height of 2000 mm. The fully premixed burner is installed at the top of the furnace, and an “irregular” flue gas baffle is set at a distance of 1200 mm from the top of the furnace to study the effect of the flue gas baffle on the temperature field and NOx generation inside the furnace. A measuring point is provided at the outlet of the furnace to measure the temperature and composition of the flue gas. Figure 1 shows the overall layout of the boiler.
The physical photo of the experimental boiler is shown in Figure 2. The boiler used is a 2 t/h steam boiler produced by a boiler factory in South Korea. The boiler is vertically arranged, and the burner is installed at the center of the top of the boiler as a fully premixed burner. The structure of the inner and outer water-cooled walls of the boiler is shown in Figure 2b. The heat load of the inner water-cooled wall is higher than that of the outer water-cooled wall, so the water in the inner water-cooled wall is first heated. Due to the lower heat load, the outer water-cooled wall forms a density difference between the inner and outer water-cooled walls. The pressure difference between the inner and outer water-cooled walls becomes the driving force for the internal water circulation of the boiler; as there is no additional driving force, it is called natural circulation. The upper annular container of the furnace is called the upper header, and the inner water-cooled wall generates a mixture of steam and water due to strong thermal radiation, which is collected in the upper header. Steam that meets customer requirements enters the user side through steam pipelines. The water with higher density in the lower part enters the lower header through the outer water-cooled wall and circulates back and forth, continuously outputting qualified steam.
The boiler uses a fully premixed combustion method for denitrification. The gas piping and premixed method are shown in Figure 3. The gas enters the gas filter through gas pipe 1, and the filtered and purified natural gas is divided into two paths after being detected by the lower pressure limit (valve 4). One path is the ignition pipeline, which ignites the mixed gas in the furnace through the gas pressure regulator (valve 7) and ignition solenoid valve 5. The other route is the gas supply pipeline. After passing through the gas pressure regulating valve 8, it is detected by the gas pressure detection upper limit instrument 9, and a gas leakage detection device 12 is installed here. When the pressure is qualified and there is no leakage, the gas enters the gas primary, secondary, and tertiary valves. The gas flow rate can be adjusted according to the boiler load here. Afterwards, the gas static mixer 15 uses the multi-chamber mixing device designed by Shi Hongwei et al. [30], which does not require additional power. In this static mixer, the gas is uniformly mixed with the combustion air from pipeline 16 and then enters the pre-mixed burner on the surface of the boiler.

2.2. Design of a Fully Premixed System

The well-mixed premixed gas enters the burner, and the 3D model of the burner and static mixer is shown in Figure 4. As shown in Figure 4a, due to the volume ratio of combustion air to gas being 10:1, the outer main and branch pipes of the static mixer are air pipelines, while the inner side is gas pipelines. The advantage of this arrangement is that it can better shear and mix gas and air. Air enters each air branch pipe through the main pipe 1 and then enters the air collection chamber 7. There are oblique holes between the air collection chamber and the gas mixing chamber on the side wall of the air collection chamber. Gas enters each gas branch pipe through the main pipe 3, and then enters the gas mixing chamber, where it is sheared and mixed with air. It then enters the mixing chamber through the opposite oblique hole and enters the burner 6 through the mixing pipeline. In order to evenly distribute the mixed gas flow in various parts of the combustion head, a partition plate 2 is installed inside the combustion head.
The actual surface burner is covered with a flame retardant layer at the head, which can make the combustion more uniform and prevent backfire, thereby preventing the occurrence of “deflagration” and ensuring the safe production of the boiler. The physical photo of the burner is shown in Figure 5. The bottom of the cylindrical burner is a porous mesh structure, where ignition outlet pipe 1, ignition probe 2, and flame detection rod 3 are arranged.
From Figure 5, it can be seen that the ignition rod first ignites the mixed gas at the bottom and then ignites the gas in the cylinder. The ignition area of the cylinder can be adjusted according to the surface coverage area, and then the flow field and temperature field inside the boiler can be adjusted. The boiler load also changes accordingly. The experimental site is located in Shandong Luren Thermal Energy Equipment Co., Ltd. in Heze, Shandong, China. The local gas used is natural gas produced by the production and sales plant of Zhongyuan Oilfield, and the composition of natural gas is shown in Table 1. According to the national standard, this batch of gas is classified as high-quality civilian fuel.

2.3. Full Premixed Combustion Experiment

The boiler has a double-layer water-cooled wall structure, with the outer water-cooled wall used as a downcomer to establish a natural water circulation system inside the furnace. Therefore, during simulation calculations, the furnace is treated as a single-layer coupled wall [31].
The appearance of the boiler is shown in Figure 2a, the double-layer water-cooled wall structure is shown in Figure 2b, and the detailed dimensions of the boiler are shown in Figure 1a. The burner is installed in the center position of the furnace top, and the combustion chamber is cylindrical. The net space of the combustion chamber is φ788 × 1988. Different-shaped “irregular” baffles are set at a distance of 1200 mm from the furnace top to study the effect of “irregular” baffles on NOx emissions. Conduct experiments on the installation of Nonporous baffles in the furnace, and the gas and combustion air mixed piping is shown in Figure 3. Both natural gas and air flow measurements are made using Kesaigong flow meters, with a measurement accuracy of 0.5%. The temperature measurement at the chimney outlet adopts a portable digital thermometer with a resolution of 0.1 ℃ and a maximum temperature resistance of 1300 ℃. The measurement of flue gas composition adopts an ecom-J2KN type flue gas analyzer; the measurement accuracy of O2 is 0.2%; the measurement accuracy of CO, NO, NO2, SO2 is 5% of the measurement value; the measurement error of smoke temperature is 1% of the measurement value; and the converted oxygen of NO, NO2, CO measurement value is 3.5%. The measurement of smoke composition is carried out using the eom-J2KN smoke analyzer. The measurement accuracy of O2 is 0.2%, the measurement accuracy of CO, NO, NO2, and SO2 is 5%, the measurement error of smoke temperature is 1%, and the conversion value of oxygen content for NO, NO2, and CO is 3.5%.
According to the intake volume of the boiler, the combustion state of the boiler is divided into three states in order to study the boiler emissions, output, and thermal efficiency. As shown in Table 2, according to the fuel entering the boiler, there are three combustion states: minimum firing rate, middle firing rate, and maximum firing rate, with corresponding gas flow rates of 100 m3/h, 161 m3/h, and 199 m3/h.
According to the experiment, when installing a Nonporous baffle, according to the measurement data in Table 2, it can achieve ultra-low NOx emissions regardless of the gas flow rate. Due to the fact that the boiler is a positive pressure combustion boiler, the O2 content is controlled below 2.7% for maximum, middle, and minimum fires. Specifically, during minimum firing rate, as the amount of O2 increases, the CO content shows an increasing trend, while the smoke temperature shows a decreasing trend, and the NOx emission is also the smallest. This indicates that it is more appropriate to control the O2 amount at around 1.9 during the minimum firing rate. Under this operating condition, due to the exhaust gas temperature of 151.4 °C, the CO content of unburned substances in the smoke is higher than the other two operating conditions, and the combustion condition deteriorates, resulting in a lower boiler thermal efficiency than the other two operating conditions. Due to the gradual increase in generated CO, the CO2 content shows a slight decrease trend. When the combustion state belongs to middle firing rate, as the O2 amount increases to 2.0, the CO content in the flue gas sharply decreases to 9 ppm. If the O2 amount continues to increase to 2.2, the CO in the flue gas then increases, and when the air coefficient is 2.0, the NOx emission is lower. At this time, the exhaust temperature is lower, and the net efficiency of the boiler is the highest. Therefore, the optimal O2 amount for middle firing rate should be around 2.0. When the combustion is at maximum firing rate, as the amount of O2 increases, the CO content shows an increasing trend, and CO2 shows a slight decrease, indicating that continuing to increase the amount of O2 at this time will lead to an increase in unburned substances in the flue gas and deterioration of combustion. When the excess air coefficient is 2.1, the exhaust gas temperature is lower among the three operating conditions, and the net efficiency of the boiler is at its maximum. Therefore, the O2 amount should be maintained at around 2.1 during maximum firing rate combustion.
When comprehensively analyzing minimum, middle, and maximum firing rates, each state has an optimal O2 value. As the CO content in the flue gas is directly related to the CO2 emissions, that is, when the CO content increases, the CO2 generation decreases accordingly. However, the net efficiency of the boiler is higher when the exhaust temperature is lower. The steam flow rate of the boiler is maintained at around 0.57 L/min in all three combustion states, and the NO generated by combustion is oxidized to NO2 in a short period of time. Under four working conditions, as the amount of gas increases, the amount of O2 increases, and the exhaust gas temperature shows an upward trend. The combination of the increase in gas quantity and the increase in O2 quantity leads to an increase in exhaust gas quantity and heat release. However, the heat absorbed by the water-cooled wall is not as fast as the increase in exhaust gas heat, resulting in an increase in exhaust gas temperature. Therefore, it can be considered that the NOx in the exhaust gas is mainly NO2, containing a small amount of NO, and the remaining nitrogen oxides can be ignored.
There is an optimal combustion condition for both maximum, middle, and minimum firing rates, which requires a comprehensive consideration of NOx emission, exhaust gas temperature, and net efficiency.

3. Computational Details

3.1. Calculation Models and Equations

On the basis of the original experiment, at a distance of 1200 mm from the installation plane of the burner in the experimental boiler shown in Figure 1, four types of baffles were installed. The shapes of different baffles are shown in Figure 6.
As shown in Figure 6, the four types of baffles have different shapes, but the flow area is equal, with each having a flow area of 0.302 m2. The Nonporous baffle is the experimental baffle. The diameter of the internal Nonporous baffle is 480 mm. The inner diameter of the other three types of perforated baffles is 520 mm. Figure 6a shows the Nonporous baffle, Figure 6b shows the Strip baffle, Figure 6c shows the Round baffle, and Figure 6d shows the Circular baffle.
The k-e model was used in the furnace turbulence model, the P1 model was used for radiation heat transfer, and the vortex diffusion model was used for the chemical reaction model [18]. Given the complexity of the aerodynamic field on the combustion surface, it is difficult to comprehensively evaluate the flow field and temperature field inside the furnace using only measurement methods. Therefore, a combination of calculation and experimentation is used to study this problem [32]. The numerical calculations were conducted for the four types of partitions, with each partition divided into three states: maximum, middle, and minimum firing rate. Three excess air coefficients were taken for each state for calculation, meaning 36 operating conditions in total.
Although there is a significant difference between premixed and non-premixed flames, the method for non-premixed combustion can still be applied to premixed combustion [33,34]. Under premixed combustion conditions, the premixed model cannot be used to simulate NOx generation due to the separation of reactants and combustion products by the flame front. The k-e equation and model equation used in the calculation process are as follows [35,36]:
ρ k t + ( ρ k u i ) = x j [ ( μ + μ t σ k ) k x j ] + G K + G b ρ ε Y M + S K
ρ ε t + ( ρ ε u i ) x i = x i [ ( μ + μ t σ ε ) ε x j ] + C 1 ε ε k ( G k + C 3 ε G b ) C 2 ε ρ ε 2 k + S ε
In the above equation, Gk is the average velocity gradient generation term; Gb is the buoyancy generation term; YM is the pulse generation term; C, C, and C are the constants; and Sk/Sε is representing source items.
Using a regular hexahedron with a fixed spatial position as the computational model, the form of the conservation equation is as follows [37]:
t ( ρ Y i ) + ( ρ v ¯ Y i ) = J i ¯ + R i + S i
In the above equation, Ri is the net generation rate of chemical reaction of component I; Si is the net generation rate obtained adding the diffusion term to the user-defined source term; and Ji is the diffusion flow rate generated by the i-th component due to concentration gradient.

3.2. The Test Result of Grid Independence

As shown in Figure 7, on the axis shown in the furnace, the speed at different points is taken, and the magnitude of the speed change is shown in Figure 7b. From the graph, it can be seen that in the direction of flue gas flow, the velocity first decreases and then increases, reaching the maximum velocity at the outlet of the flue gas. Under four calculated conditions, when the number of elements increased to 2,027,404, increasing the number of elements did not result in a significant change in speed, thus verifying the grid independence. Therefore, the actual calculation elements are taken as 2,027,404.

4. Result and Discussion

The experimental results of the Nonporous baffle are shown in Table 2. In addition to simulating the Nonporous baffle, numerical calculations were also performed on three other perforated baffles. The experimental results of the Nonporous baffle and the calculation results of the four baffle types were compared.

4.1. Comparison of Experimental Values of Nonporous Baffles and Calculated Values of Various Baffles

4.1.1. Comparison of Experimental Values of O and CO When Installing Nonporous Baffles and without Baffles

The calculation of the burner and pre-mixer forms is shown in Figure 4, and the installation of baffles in the furnace and their positions are shown in Figure 1a. For the non-baffle experimental boiler, its size is the same as the original furnace structure. The data are taken from the non-baffle experimental data of Shi Hongwei et al. [9]. The experimental data of the boiler with a Nonporous baffle are shown in Table 2, and the comparison of the experimental results between the two is shown in Figure 8.
From Figure 8, it can be seen that regardless of whether a baffle is added in the furnace or not, the experimental values show a decreasing trend in the required O2 amount in the furnace under optimal combustion conditions as the natural gas flow rate increases. This is consistent with the combustion theory, that is, as the natural gas flow rate increases, the required O2 amount shows an increasing trend, leading to a gradual decrease in the O2 amount in the flue gas. Under optimal operating conditions, the CO content gradually decreases, which is consistent with the trend analyzed in article [9], that is, as the gas volume increases, combustion becomes more and more complete, and the amount of O2 in the flue gas is consumed more and more, resulting in more complete combustion of CO. For the optimal combustion conditions of maximum, middle, and minimum firing rates, the CO content in the flue gas shows a decreasing trend, and the CO content in the flue gas decreases when the baffle is added for optimal combustion conditions, indicating that the combustion is more complete after adding the baffle.

4.1.2. Comparison of Calculated Values of CO Emissions

As mentioned earlier, compared to the working condition without baffles, adding Nonporous baffles results in more complete combustion and lower CO emissions. If the flow capacity of the Nonporous baffle remains unchanged, increase the baffle diameter and open three types of irregular holes on the baffle (as shown in Figure 6); investigate their impact on CO emissions and the amount of O2 in the furnace, as shown in Figure 9. By combining calculations, there are a total of 36 operating conditions, and then comparing the combustion and emission conditions under each operating condition.
Figure 9 shows the experimental values and the calculated CO emission values of the Nonporous baffle and the other three types of porous baffle, among which the experimental values of the Nonporous baffle are listed in Table 2. From Figure 9, it can be seen that under the three combustion conditions, the CO emissions are the lowest and all below 20 ppm during maximum firing rate, while the CO emissions are the highest during minimum firing rate.
During maximum firing rate (as shown in Figure 9C), the maximum error between the experimental and measured values of the Nonporous baffle is 34%, the error between the measured and calculated values is 2.2% under optimal operating conditions, and the maximum calculation error under optimal operating conditions for different baffles is 6.8%. It can be seen that the calculation error is relatively small, indicating that different baffles have little impact on CO emissions during maximum firing rate. As shown in Figure 9B, the baffle with a strip opening has the lowest calculated CO emission value, which is 8 ppm during the middle firing rate. Taking into account Figure 9, the calculated CO emissions under middle and maximum firing rates are significantly lower than those under minimum firing rates, indicating that under minimum firing rates, due to the relatively high O2 supply, non-equivalent combustion leads to increased incomplete combustion losses, resulting in a higher CO content in the flue gas compared to middle and maximum firing rates. When the working conditions are the same, the CO emission value is the lowest when the strip hole is used, and the highest value is calculated when there is Nonporous baffle. When the hole is a ring or circular, the CO emission value increases relative to the strip hole, but it is also lower than the CO emission value under the Nonporous baffle working condition.
In summary, the experimental values and measured values are in good agreement under the condition of porous baffle. When installing different types of baffles, among them, the Strip baffle has the lowest calculated CO emission. For Round and Circular baffles, the calculated CO values slightly increase compared to Strip baffles, but the calculated values are still lower than those for Nonporous conditions. Regardless of the maximum, middle, and minimum firing rates, the experimental values are higher than the calculated values. This is because the calculated conditions are adiabatic, resulting in a reaction temperature higher than the experimental temperature and more complete combustion, leading to a lower calculated CO value. Overall, regardless of maximum, middle, or minimum firing rates, CO emissions are lowest during maximum firing rate, slightly higher during middle firing, and highest during minimum firing rate.

4.2. Comparison of Calculated Values of CO2 Emissions

Due to the narrow combustion space inside the boiler furnace, the boiler has a large volumetric heat load. How to quickly transfer the heat generated by fuel combustion to the heating surface in a limited space is a key issue that needs to be considered in furnace combustion. The CO content in flue gas is related to the pyrolysis of CO2 in the mixed gas [38], so the CO2 emission shows a correlation trend with the CO emission. That is, a high CO2 emission indicates sufficient combustion, and the CO content in the flue gas is relatively reduced. Conversely, if the CO2 emission is low, the CO content in the flue gas is relatively increased. Figure 10 shows the relationship between CO and CO2 emissions under 36 operating conditions and lists the experimental values of the Nonporous baffle simultaneously. From Figure 10, it can be seen that the measured and calculated values of CO2 and CO show a correlation trend regardless of the maximum, middle, and minimum firing rate. Among them, the CO emission value decreases significantly during maximum firing rate, and the CO2 value increases relative to minimum firing rate during middle and maximum firing rates, but the increase is not significant and is all less than 15%. Specifically, in the experimental conditions, the CO2 emissions of the Nonporous baffle are the lowest, while the CO2 emissions of the Nonporous baffle increase under the calculated conditions. Among them, the calculated values of the Strip baffle are the highest, while the calculated values of the Round and Circular baffles have little change compared to the Strip baffle. For Nonporous baffles, the maximum error between calculated and measured values occurs during medium-firing combustion, with a maximum error of 22.7%. The reason for this phenomenon is that there is a significant difference in excess air coefficient during medium-firing combustion, resulting in significant changes in the aerodynamic field inside the furnace during experimental conditions, leading to significant measurement errors. However, the measurement error is also within the allowable range. Comparing the calculated values under different baffle conditions, the maximum error in CO2 emissions occurs during medium-firing combustion with an excess air coefficient of 1.2, which is 7%. This indicates that when the air supply is low, the amount of CO generated in the flue gas increases, and the combustion is unstable and incomplete, resulting in a significant change in CO2 content in the flue gas. This is consistent with the previous analysis. In summary, there is a correlation between the amount of CO2 generated in the flue gas and the incomplete combustion material CO content in the flue gas, which indirectly reflects the combustion status in the furnace. The experimental and calculated values of CO are in good agreement. After installing four types of furnace baffles, the trend in CO decrease is obvious, and it shows a decreasing trend according to the minimum, middle, and maximum firing rates. For the calculated value of CO2 emissions, when installing four types of baffles, the value slightly increases, but the increase is not significant. The overall trend shows that under high CO content conditions, the CO2 content decreases. Conversely, when the CO content is low, the CO2 content increases, which is also in line with the analysis of combustion theory.

4.3. Comparison of Calculated Values of Exhaust Gas Temperature

For small gas boilers, due to their much higher thermal and combustion efficiency than large coal-fired boilers, small changes in exhaust gas temperature can reflect significant changes in combustion inside the furnace and boiler thermal efficiency. A high exhaust gas temperature indicates an increase in the amount of heat that can be absorbed during combustion. Therefore, the exhaust gas temperature of the boiler is an important parameter that must be detected and monitored during boiler debugging and operation. Generally speaking, if the exhaust gas temperature of the boiler is high, it indicates that the heat absorption of the boiler’s water-cooled wall is relatively reduced. The subsequent flow direction of the boiler’s exhaust gas should increase the heating surface. However, for small gas boilers, the layout of the subsequent heating surface is limited. Therefore, the exhaust gas temperature must be strictly controlled at the furnace outlet to prevent combustion deterioration and poor heat exchange of the water-cooled wall. The pressure of flue gas in the furnace can indirectly reflect the combustion conditions inside the furnace. Specifically, a high exhaust gas pressure reflects a larger amount of flue gas in a limited space, an increased flow rate of flue gas, and a shorter residence time of combustible substances in the limited space, resulting in an increase in the content of incomplete combustion substances (CO) and an increase in exhaust gas temperature, which is consistent with the previous analysis. At the same time, the pressure of flue gas in the furnace is also an important means of controlling the excess air coefficient in the furnace. The high pressure of flue gas in the furnace leads to positive pressure combustion in the boiler and less air leakage in the boiler. The low pressure of flue gas in the furnace increases the air leakage of the boiler, which increases the excess air coefficient and leads to an increase in flue gas content, resulting in changes in exhaust gas temperature.
Table 2 lists the measured values of smoke exhaust temperature and chimney outlet smoke pressure under different working conditions. Under the working conditions listed in Table 2, numerical calculations were performed on four different baffles to compare their performance. The comparison of the calculation results is shown in Figure 11. As shown in the figure, during minimum firing rate in the furnace, the air supply is also small, and the combustion condition inside the furnace is poor. The exhaust temperature is lower, and the error between the calculated and measured values is 6.6% under the optimal working condition. During middle firing rate, due to a significant increase in the amount of flue gas, the flow rate of flue gas in the furnace increases, the flue gas stroke becomes shorter, and the boiler exhaust gas temperature increases significantly compared to minimum firing rate. The error between the calculated and measured values when installing Nonporous baffles under optimal operating conditions is 2.9%. During the combustion of a maximum firing rate, the amount of gas continues to increase, but compared to the increase from minimum to middle firing rate, the amount decreases. Therefore, the increase in exhaust temperature is not significant. The optimal exhaust temperature occurs when the O2 content is 2.1 and the error between the measured value and the calculated value is 3.0%. Taking into account the three operating conditions of perforated baffles, the measurement error is less than 7%, and the measured values are in good agreement with the calculated values. Examining the installation of four types of baffles in the furnace, it was found that regardless of the maximum, middle, or minimum firing rate, the exhaust temperature of the Nonporous baffle was the highest, while the Strip baffle decreased significantly compared to the Nonporous baffle. The calculated temperature during middle firing rate combustion decreased by 12.5% under the optimal operating conditions. For the three types of opening conditions, the combustion condition of the strip hole is the best, and the exhaust temperature is lower than that of the Nonporous baffle and also lower than the other two types of baffle, indicating that the combustion condition in the furnace is optimal at this time. For Round and Circular holes, the flue gas exhaust temperature does not change significantly compared to the Strip hole, but the combustion condition of Round and Circular baffles is also better than that of Nonporous baffles.
Observing the pressure inside the furnace under different operating conditions, it was found that there was a significant increase in middle and maximum fire rates compared to minimum firing rates. This is because the increase in fuel quantity led to an increase in flow velocity in the limited space inside the furnace, resulting in an increase in furnace pressure. When burning at maximum, middle, and minimum firing rates, the furnace pressure increases with the increase in air volume when the fuel volume is the same. This is because the same fuel volume consumes the same amount of air, leading to an increase in flue gas volume when the O2 volume is high, resulting in an increase in furnace pressure.

4.4. Comparison of Calculated Values of NOx Emissions

For small gas boilers, due to the lack of specialized denitrification equipment, the main method of denitrification is to use low-N burners to suppress or convert the generated NOx during the combustion process as the main denitrification method. Due to the current use of clean fuels in gas boilers, the sulfur content in the fuel is very low, so the sulfides generated during combustion are generally not considered, and NOx has become an important indicator of clean combustion in this type of boiler. Lamioni R et al. [39] found that NOx in combustion products is mainly thermodynamic. After entering the atmosphere, NO is quickly oxidized to produce NO2, so NOx is mainly NO at the furnace chimney. The experimental and calculated values of NOx at the furnace outlet are shown in Figure 12. The comparison of NOx, NO, and NO2 measurement values under optimal operating conditions is shown in Figure 12A. Figure 12B–D show the comparison of NOx calculated values when different baffles are installed.
As shown in Figure 12A, the optimal values of NOx, NO, and NO2 at the furnace outlet under maximum, middle, and minimum firing rates are shown in the figure. From the graph, it can be seen that NO is the main component of NOx in the flue gas, accounting for over 75%, with the highest proportion of NO being 85%, which is consistent with theoretical analysis. Under three optimal operating conditions, the minimum NOx emission is 26.9 mg/m3, which has already met the minimum NOx emission requirements in the Beijing Tianjin Hebei region. From the experimental results, it can be seen that NO is the main component of NOx, containing a small amount of NO2. After entering the atmosphere, NO is quickly oxidized to NO2. From Figure 12B, it can be seen that during minimum firing rate, when installing a Nonporous baffle, the error between the optimal operating condition measurement value and the calculated value is 2.4%, and the calculated value is in good agreement with the measured value. Install four different baffles and calculate the lowest NOx emissions using a Strip baffle. For Round and Circular baffles, NOx emissions slightly increase, but the overall emission amplitude is still lower than that of Nonporous baffles. For the optimal operating condition of minimum firing rate, the excess air coefficient is 1.9, and for other air coefficients, NOx emissions increase. As shown in Figure 12C, the error between the calculated and measured values is 6.7% under optimal operating conditions. The maximum error between the calculated and measured values occurs when the excess air coefficient is 1.2, with a maximum error of 8.7%. During the middle firing rate, the Strip-style emission of the four baffles is the lowest, with a minimum value of 29.7 mg/m3. When the baffle is made of Round and Circular holes, the NOx emissions slightly increase, but under various air coefficients, the NOx emissions are lower than the Nonporous baffle. As shown in Figure 12D, under the optimal working condition during maximum firing rates, when there is a Nonporous baffle, the error between the calculated and measured values is 20.4%, which is relatively high. This is because during maximum firing rate, the amount of flue gas in the furnace increases relatively more compared to middle and minimum firing rates, and the required air volume also increases. As a result, the flow velocity at the chimney inlet increases and the airflow disturbance is greater, resulting in an increase in measurement error. When the excess air coefficient is 2.2, the maximum error reaches 40.1%. Comparing four different types of baffles, the trend is the same as that of middle and minimum firing rate, with the lowest NOx emissions from Strip baffles and a slight increase in NOx emissions from Round and Circular baffles than Strip baffles, but still better than that of Nonporous baffles. Regardless of maximum, middle, or minimum firing rate, the trend of NOx impact values is consistent, and the use of a Strip-shaped baffle can obtain the optimal NOx emission value.

5. Conclusions

(1)
The installation of Nonporous baffles in the furnace and combustion experiments were conducted. The results showed that when installing a Nonporous baffle in the furnace, considering parameters such as exhaust temperature, boiler efficiency, and NOx emissions, the optimal excess air coefficients were 1.9, 2.0, and 2.1, respectively. Under the optimal operating conditions, the experimental values of NOx emissions were all below 30 mg/m3, and the net heat efficiency of the boiler was above 80%.
(2)
A comparative combustion experiment was conducted without or with the addition of a Nonporous baffle. The experimental results showed that as the gas volume increased, the optimal oxygen consumption increased, and the net heat efficiency of the boiler slightly increased. Under minimum, middle, and maximum firing rates, the CO content in the flue gas decreases, indicating that adding baffle is more beneficial for combustion. For the Nonporous baffle, the calculated values were compared with experimental values, and it was found that the minimum CO emission value was below 20 ppm. The maximum error between the calculated value and the experimental value is 6.8%, and the minimum error is 2.2%, indicating high calculation accuracy. Comparing the calculated values of the four types of baffles, it was found that the CO values in the flue gas were the lowest when installing the Strip baffle, and the exhaust temperature was also the lowest when installing the Strip baffle.
(3)
Comparing the average temperature values on different cross-sections along the axis of flue gas flow in the furnace under calculation conditions, different airflow fields lead to different temperature distributions. Among them, when installing a Strip baffle, the flue gas temperature drops the most after crossing the baffle and reaches the lowest value among the four types of baffles at the furnace outlet. The calculated NOx emissions are also the lowest among the four operating conditions at the corresponding positions, and the optimal operating condition calculation values are all below 40 mg/m3.
Full premixed combustion can achieve ultra-low emissions, and on this basis, adding different types of baffles in the furnace can further reduce NOx emissions. The installation of different baffles has varying degrees of impact on the combustion conditions in the furnace, with the Strip baffle exhibiting excellent performance. Therefore, without changing the furnace structure and burner form, adding baffles in the furnace can continue to reduce NOx emissions and improve the boiler’s thermal efficiency to a certain extent.

Author Contributions

H.S. wrote the original draft; X.Y. carried out testing and verification; C.W. wrote the original draft of this article; H.W. reviewed and edited the article. All authors have read and agreed to the published version of the manuscript.

Funding

This work was supported by the Foundation of Jiangxi Educational Committee, China (grant number: GJJ200822). This work was funded by the Doctor Foundation of Jiangxi University of Science and Technology (grant Nos.: 205200100511 and 205200100513).

Data Availability Statement

The data that support the findings of this study are available from the corresponding author upon reasonable request.

Conflicts of Interest

Author Xiao Yin was employed by the National Energy Group Nanning Power Generation Co., Ltd. The remaining authors declare that the research was conducted in the absence of any commercial or financial relationships that could be construed as a potential conflict of interest.

Nomenclature

ρFluid density;
kTurbulent kinetic energy equation;
εTurbulent dissipation rate equation;
μDynamic viscosity;
v ¯ Mean fluid velocity;
NonporousWithout holes;
StripWith bar holes;
RoundWith annular holes;
CircularWith ring holes;
GkAverage velocity gradient generation term;
GbBuoyancy generation term;
YMPulse generation term;
YiComponent i pulse generation term;
C1.44;
C1.92;
CEmprical constant;
Sk/SεSouce items;
RiNet generation rate of chemical reaction of component I;
SiThe net generation rate obtained by adding the diffusion term to the user-defined source term;
JiThe diffusion flow rate generated by the i-th component due to concentration gradient;
qWater-cooled wall heat flux density, W/m2;
TwWater-cooled wall temperature, K;
TfAverage flue gas temperature inside the furnace, K;
hfConvective heat transfer coefficient between water-cooled wall and flue gas;
hintComprehensive heat transfer coefficient of convective radiation;
TintConvection radiation comprehensive heat transfer temperature, K;
qradRadiative heat transfer, W;
GAverage heat release of high-temperature flames, W;
εwSurface emissivity of water-cooled walls.

References

  1. Liu, J.; Zhao, J.; Zhu, Q.; Huo, D.; Li, Y.; Li, W. Methanol-based fuel boiler: Design, process, emission, energy consumption, and techno-economic analysis. Case Stud. Therm. Eng. 2024, 54, 103885. [Google Scholar] [CrossRef]
  2. Paniego-Alday, A.; Lopez-Ruiz, G.; Azkorra-Larrinaga, Z.; Uriondo-Arrue, Z.; Romero-Anton, N. Analysis and improvement of gas flow behaviour at the inlet duct of an industrial HRSG boiler through CFD modelling. Case Stud. Therm. Eng. 2024, 60, 104717. [Google Scholar] [CrossRef]
  3. Zhu, S.; Hui, J.; Lyu, Q.; Ouyang, Z.; Liu, J.; Zhu, J.; Zeng, X.; Zhang, X.; Ding, H.; Liu, Y.; et al. Experimental study on pulverized coal combustion preheated by a circulating fluidized bed: Preheating characteristics for peak shaving. Fuel 2022, 324, 124684. [Google Scholar] [CrossRef]
  4. Xie, Y.; Qin, C.; Guo, S.; Chen, Z. Experimental research of a small-scale industrial furnace with regenerative disc-flame burners. Case Stud. Therm. Eng. 2023, 41, 102613. [Google Scholar] [CrossRef]
  5. Han, B.; Lin, H.; Miao, Z. Numerical investigation on the optimized arrangement for high-temperature corrosion after low NOx transformation. J. Therm. Anal. Calorim. 2021, 146, 2183–2197. [Google Scholar] [CrossRef]
  6. Liu, H.; Li, S.; Xiang, X.; Gong, S.; Jia, C.; Wang, Q.; Sun, B. Simulation of biogas co-combustion in CFB boiler: Combustion analysis using the CPFD method. Case Stud. Therm. Eng. 2024, 59, 104610. [Google Scholar] [CrossRef]
  7. Liu, B.; Bao, B.; Wang, Y.; Xu, H. Numerical Simulation of Flow, Combustion and NO Emission of a Fuel-Staged Industrial Gas Burner. J. Energy Inst. 2017, 90, 441–451. [Google Scholar] [CrossRef]
  8. GB13271-2014; Emission Standard of Air Pollutants for Boiler. Ministry of Ecology and Environment of the People’s Republic of China: Beijing, China, 2014.
  9. Shi, H.-W.; Wang, H.-P. Research on Full Premixed Combustion and Emission Characteristics of Non-Electric Gas Boiler. Energies 2023, 16, 7409. [Google Scholar] [CrossRef]
  10. Bell, R.; Buckingham, F. An Overview of Technologies for Reduction of Oxides of Nitrogen from Combustion Furnaces; MPR Assoc Inc.: Alexandria, VA, USA, 2003. [Google Scholar]
  11. Najarnikoo, M.; Targhi, M.Z.; Pasdarshahri, H. Experimental study on the flame stability and color characterization of cylindrical premixed perforated burner of condensing boiler by image processing method. Energy 2019, 189, 116130. [Google Scholar] [CrossRef]
  12. Yu, B.; Kum, S.-M.; Lee, C.-E.; Lee, S. Combustion characteristics and thermal efficiency for premixed porous-media types of burners. Energy 2013, 53, 343–350. [Google Scholar] [CrossRef]
  13. Mujeebu, M.A.; Abdullah, M.Z.; Abu Bakar, M.Z.; Mohamad, A.A.; Muhad, R.M.N.; Abdullah, M.K. Combustion in porous media and its applications—A comprehensive survey. J. Environ. Manag. 2009, 90, 2287–2312. [Google Scholar] [CrossRef]
  14. Minutolo, P.; D’Anna, A.; Commodo, M.; Pagliara, R.; Toniato, G.; Accordini, C. Emission of Ultrafine Particles from Natural Gas Domestic Burners. Environ. Eng. Sci. 2008, 25, 1357–1364. [Google Scholar] [CrossRef]
  15. Keramiotis, C.; Stelzner, B.; Trimis, D.; Founti, M. Porous burners for low emission combustion: An experimental investigation. Energy 2012, 45, 213–219. [Google Scholar] [CrossRef]
  16. Yu, B.; Kum, S.-M.; Lee, C.-E.; Lee, S. Effects of exhaust gas recirculation on the thermal efficiency and combustion characteristics for premixed combustion system. Energy 2013, 49, 375–383. [Google Scholar] [CrossRef]
  17. Son, J.; Yang, H.; Kim, G.; Hwang, S.; You, H. Technology development for the reduction of NOx in flue gas from a burner-type vaporizer and its application. Korean J. Chem. Eng. 2017, 34, 1619–1629. [Google Scholar] [CrossRef]
  18. Hosseini, A.A.; Ghodrat, M.; Moghiman, M.; Pourhoseini, S.H. Numerical study of inlet air swirl intensity effect of a Methane-Air Diffusion Flame on its combustion characteristics. Case Stud. Therm. Eng. 2020, 18, 100610. [Google Scholar] [CrossRef]
  19. Matsumoto, R.; Ozawa, M.; Terada, S.; Iio, T. Low NOx Combustion of DME by Means of Flue Gas Recirculation. J. Power Energy Syst. 2008, 2, 1074–1084. [Google Scholar] [CrossRef]
  20. Hinrichs, J.; Bortoli, S.D.; Pitsch, H. 3D modeling framework and investigation of pollutant formation in a condensing gas boiler. Fuel 2021, 300, 120916. [Google Scholar] [CrossRef]
  21. Liu, C.; Hu, X.; Chen, G. Temperature and NOx distribution characteristics of coal particles under high-temperature and low-oxygen environments simulating MILD oxy-coal combustion conditions. J. Energy Inst. 2022, 101, 73–86. [Google Scholar] [CrossRef]
  22. Khabbazian, G.; Aminian, J.; Khoshkhoo, R.H. Experimental and numerical investigation of MILD combustion in a pilot-scale water heater. Energy 2022, 239, 121888. [Google Scholar] [CrossRef]
  23. Huang, M.; Li, R.; Xu, J.; Cheng, S.; Deng, H.; Rong, Z.; Li, Y.; Zhang, Y. Effect of equivalence ratio and staging ratio on the methane MILD combustion in dual-stage combustor. Fuel 2022, 307, 121903. [Google Scholar] [CrossRef]
  24. Cai, S.; Yang, W.; Ding, Y.; Zeng, Q.; Wan, J. Hydrogen-air premixed combustion in a novel micro disc-burner with an annular step. Fuel 2022, 313, 123015. [Google Scholar] [CrossRef]
  25. Kuang, Y.; He, B.; Wang, C.; Tong, W.; He, D. Numerical analyses of MILD and conventional combustions with the Eddy Dissipation Concept (EDC). Energy 2021, 237, 121622. [Google Scholar] [CrossRef]
  26. Hu, F.; Li, P.; Zhang, T.; Zu, D.; Cheng, P.; Liu, Y.; Mi, J.; Liu, Z. Experimental investigation on co-firing residual char and pulverized coal under MILD combustion using low-temperature preheating air. Energy 2022, 244, 122574. [Google Scholar] [CrossRef]
  27. Boussetla, S.; Mameri, A.; Hadef, A. NO emission from non-premixed MILD combustion of biogas-syngas mixtures in opposed jet configuration ScienceDirect. Int. J. Hydrog. Energy 2021, 46, 37641–37655. [Google Scholar] [CrossRef]
  28. Westbrook, C.K.; Dryer, F.L. Chemical kinetics and modeling of combustion processes. Symp. Combust. 1981, 18, 749–767. [Google Scholar] [CrossRef]
  29. Jones, W.P.; Lindstedt, R.P. Global reaction schemes for hydrocarbon combustion. Combust. Flame 1988, 73, 233–249. [Google Scholar] [CrossRef]
  30. Shi, H.W.; Liu, Z.Q. Study on mixing characteristics of multichamber static mixer. Eng. Rep. 2023, 6, e12712. [Google Scholar] [CrossRef]
  31. Weng, Z. FLUENT 14.5 Flow Field Analysis from Beginner to Master; China Machine Press: Beijing, China, 2013; pp. 288–290. (In Chinese) [Google Scholar]
  32. Lee, P.H.; Hwang, S.S. Formation of Lean Premixed Surface Flame Using Porous Baffle Plate and Flame Holder. J. Therm. Sci. Technol. 2013, 8, 178–189. [Google Scholar] [CrossRef]
  33. Pierce, C.D.; Moin, P. Progress-variable approach for large-eddy simulation of non-premixed turbulent combustion. J. Fluid Mech. 2004, 504, 73–97. [Google Scholar] [CrossRef]
  34. Mittal, V.; Pitsch, H. A flamelet model for premixed combustion under variable pressure conditions. Proc. Combust. Inst. 2013, 34, 2995–3003. [Google Scholar] [CrossRef]
  35. Chang, J.; Wang, X.; Zhou, Z.; Chen, H.; Niu, Y. CFD modeling of hydrodynamics, combustion and NOx emission in a tangentially fired pulverized-coal boiler at low load operating conditions. Adv. Powder Technol. 2021, 32, 290–303. [Google Scholar] [CrossRef]
  36. Echi, S.; Bouabidi, A.; Driss, Z.; Abid, M.S. CFD simulation and optimization of industrial boiler. Energy 2019, 169, 105–114. [Google Scholar] [CrossRef]
  37. Liu, B. ANSYS Fluent 2020 Comprehensive Application Case Explanation; Tinghua University Press: Beijing, China, 2015; pp. 253–255. [Google Scholar]
  38. Hassan, G.; Pourkashanian, M.; Ingham, D.; Ma, L.; Taylor, S. Reduction in Pollutants Emissions From Domestic Boilers—Computational Fluid Dynamics Study. J. Therm. Sci. Eng. Appl. 2009, 1, 011007. [Google Scholar] [CrossRef]
  39. Lamioni, R.; Bronzoni, C.; Folli, M.; Tognotti, L.; Galletti, C. Feeding H2-admixtures to domestic condensing boilers: Numerical simulations of combustion and pollutant formation in multi-hole burners. Appl. Energy 2022, 309, 118379. [Google Scholar] [CrossRef]
Figure 1. Schematic diagram of steam boiler body and accessories. (a) Main view. (b) Y-Y section view. 1. Upper header. 2. Suspension ear. 3. Outer water-wall. 4. Inner water-wall. 5. Lower header. 6. Chimney inlet. 7. Water replenishing port. 8. Base. 9. Water inlet. 10. Drain valve.
Energies 17 04253 g001
Figure 2. Physical photos of experimental boilers. (a) Appearance of boiler body. (b) Structure of internal water-wall.
Energies 17 04253 g002
Figure 3. Gas piping diagram of a full premixed burner. 1. Gas supply pipe. 2. Gas filter. 3. Gas supply pressure gauge 1. 4. Gas pressure lower limit switch. 5. Ignition solenoid valve. 6. Gas manual valve 1. 7. Gas pressure regulator. 8. Gas pressure regulating valve. 9. Gas pressure upper switch. 10. Gas supply pressure gauge 2. 11. Gas solenoid valves of 2 and 3. 12. Gas leakage detector. 13. Gas solenoid valves of 1. 14. Gas manual valve 2. 15. Mixer of air and gas. 16. Air pipeline.
Energies 17 04253 g003
Figure 4. Three-dimensional modeling of static mixer and burner. (a) Static mixer. (b) Burner. 1. Air inlet. 2. Partition board. 3. Gas inlet. 4. Air branch pipe. 5. Gas branch pipe. 6. Burner. 7. Hybrid cavity.
Energies 17 04253 g004
Figure 5. Physical photo of the burner. 1. Metal insulation cover. 2. Ignite the exhaust pipe. 3. Ignition needle. 4. Flame detection rod. 5. Porous medium layer.
Energies 17 04253 g005
Figure 6. Schematic diagrams of internal partition structure. (a) Nonporous baffle. (b) Strip baffle. (c) Round baffle. (d) Circular baffle.
Energies 17 04253 g006
Figure 7. Grid independence verification for Circular baffle. (a) Schematic diagram of the point position in the furnace. (b) Comparison of calculation results for different elements.
Energies 17 04253 g007
Figure 8. Comparisons between the Non-partition values and the Nonporous values: O2 and CO.
Energies 17 04253 g008
Figure 9. Comparison of CO emissions under five operating conditions.
Energies 17 04253 g009
Figure 10. Relationship between CO2 and CO value under different working conditions.
Energies 17 04253 g010
Figure 11. The exhaust temperature and pressure under different working conditions.
Energies 17 04253 g011
Figure 12. Comparison of NOx values under different operating conditions.
Energies 17 04253 g012
Table 1. Natural gas composition table.
ItemsCH4C2H6C3H8N2Density
/kg·Nm−3
Wobbe Number
/KJ·m−3
Explosion
Limit/%
Combustion
Index
Calorific Value
/MJ·Nm−3
Natural gas95.3462.9360.5351.1830.7452.445.0–15.139.335.7
Table 2. Full premixed combustion test for the Nonporous baffle.
Premixed Gas Flue Gas Emission IndexBoiler Output and Efficiency
Natural Gas
Temperature
/m3·h−1
O2
/%
CO
/ppm
CO2
/%
NO
/mg·m−3
NO2
/%
NOx
/mg·m−3
Exhaust
Gas
Temperature/°C
Smoke
Pressure
/pa
Steam
Flow Rate
/L·min−1
Gross
Efficiency
/effg%
Net
Efficiency
/effn%
100/
Minmum firing rate
1.92410.7733635.2151.42.80.5790.281.9
2.23310.6535537.8158.25.30.5992.784.1
2.43210.3740542.6160.316.80.5792.884.2
161/
Middle firing rate
1.23111.2231739.3185.1150.5792.882.2
2910.7725.9936.1180.5230.5691.482.9
2.22410.6535438205.257.20.5790.682.1
199/
Maximum firing rate
2.1912.8221.2526.9200.8580.5590.482
2.21212.163163321163.10.5690.381.9
2.71512.4727729207600.5690.180.6
Disclaimer/Publisher’s Note: The statements, opinions and data contained in all publications are solely those of the individual author(s) and contributor(s) and not of MDPI and/or the editor(s). MDPI and/or the editor(s) disclaim responsibility for any injury to people or property resulting from any ideas, methods, instructions or products referred to in the content.

