In this section, we start with how we implemented the trade algorithm, the blockchain, and the full protocol. Then, we present the simulation settings and, finally, the results of the numerical experiments.
8.2. Pure Operation Performance of the Trade Algorithm
In this scenario, we evaluate the operational dynamics and performance of the trade algorithm. The goal is to present how the energy demand, supply, and price change for EVs with different demand and supply attributes. Here, we consider five charging EVs () and five discharging EVs () with KWh, , KWh, $/kWh, , , , , .
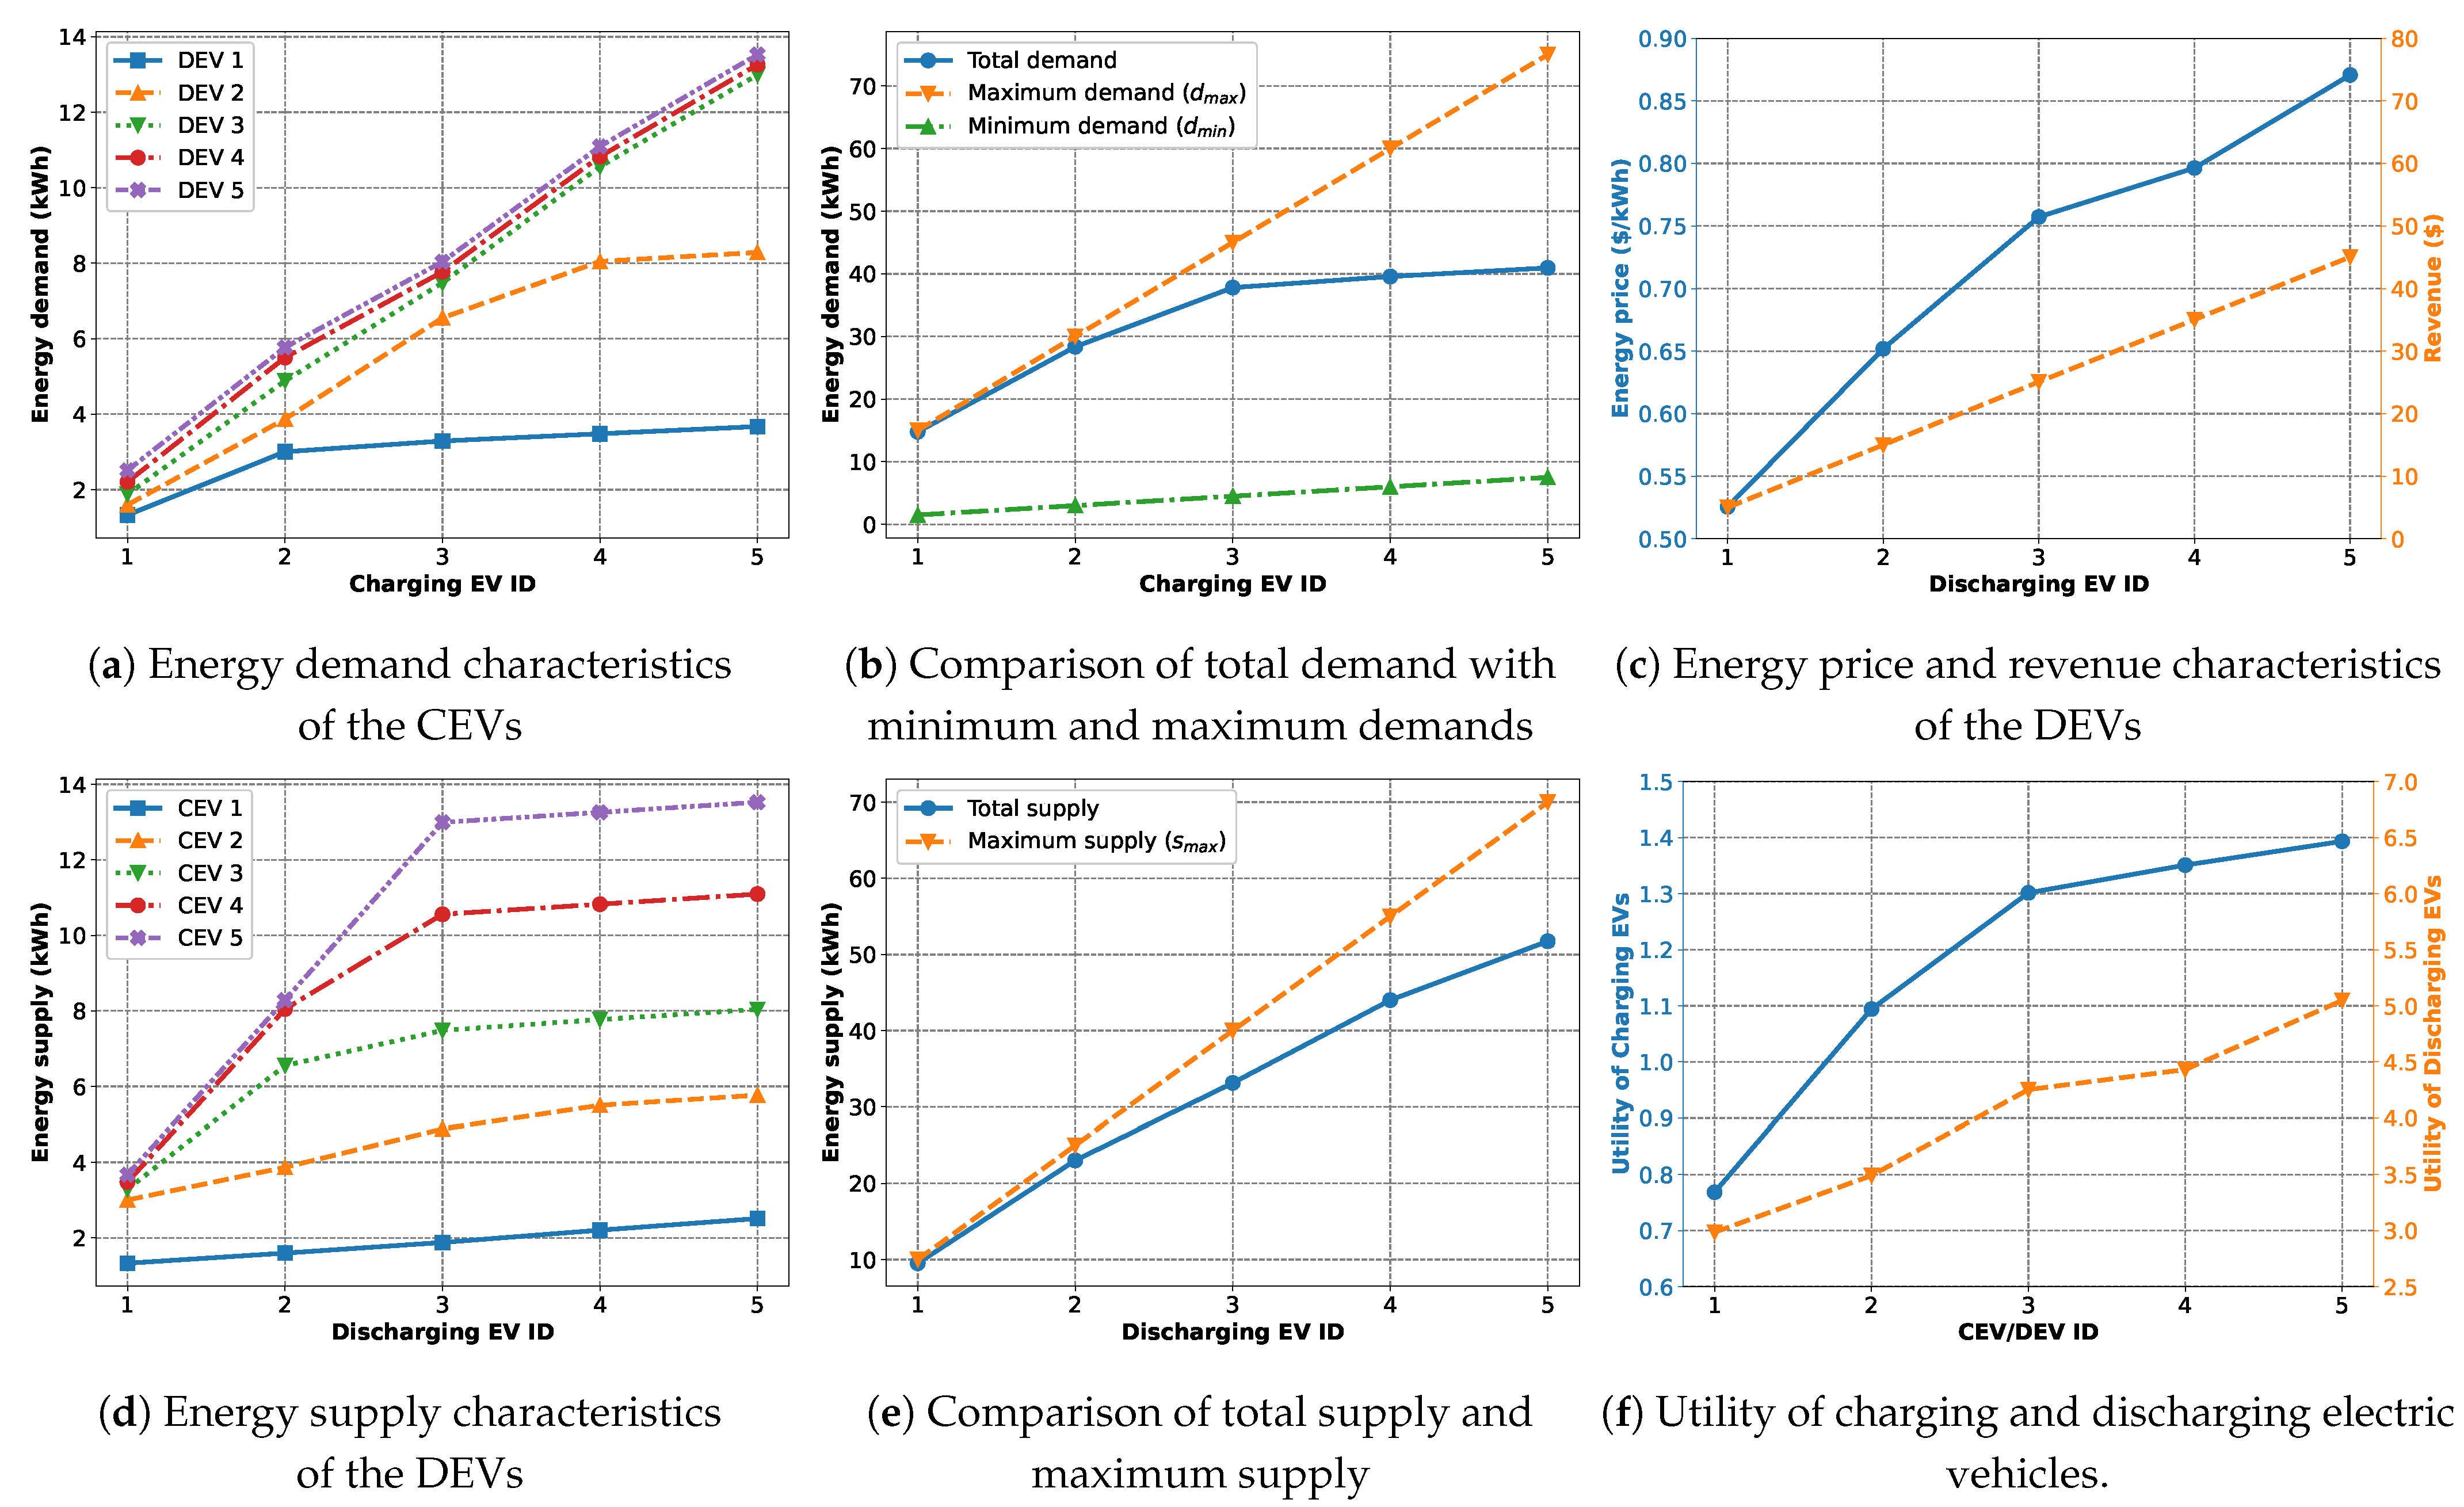
Figure 8a shows the energy demands of each charging EV (horizontal axis) from each discharging EV (separate lines). As expected, as CEVs with higher IDs have higher maximum demand, they are receiving more energy from each DEV. Also, DEVs with higher IDs offer more energy. We can see that DEVs 1 and 2 are hitting their capacity and the curves start to tapper off. On the other hand, DEVs 3 to 5 rise steadily with their higher maximum supply.
Figure 8b shows the total demands of the CEVs and how they compare with the respective maximum and minimum demands. We observe that the demand curve falls between the maximum and minimum demand curves as expected. While the lower CEV IDs (1, 2) have their demands fulfilled, the higher IDs with higher demands are unable to do so. This is because those remaining demands have to be met by the higher ID DEVs, who also have a higher energy price. This is evident, as shown in
Figure 8c. DEVs with higher IDs have higher energy prices and revenues.
Figure 8d presents the energy each discharging EV (horizontal axis) supplies to each charging EV (separate lines). Similarly here, as DEVs with higher IDs have a higher maximum supply capacity, they are selling more energy to each CEV, while CEVs with higher IDs are buying more energy. Also, while CEVs 1 and 2 are receiving a proportionally increasing amount of energy from the DEVs, CEVs 3 to 5 are receiving significantly less from DEVs 1 and 2. This is due to the fact that DEVs 1 and 2 have lower supply capacity.
Figure 8e shows the total supply of the DEVs, comparing it with the corresponding maximum supply. Similar to the CEV case, while the lower DEV IDs (1, 2) have most of their supplies bought out, the higher IDs with higher supplies have unsold energies. This is because these DEVs also expect higher prices. As shown in
Figure 8c, DEVs with higher IDs are able to generate higher revenue, although they are not selling all of their supplies.
Finally,
Figure 8f presents the utility values for the CEVs and the DEVs. In both cases, we observe that the utility values increase with increasing EV IDs. This is expected as the CEVs with higher IDs are able to buy more energy, thus satisfying their higher energy demands, while the increased amount of energy sold at higher prices does the same for the DEVs.
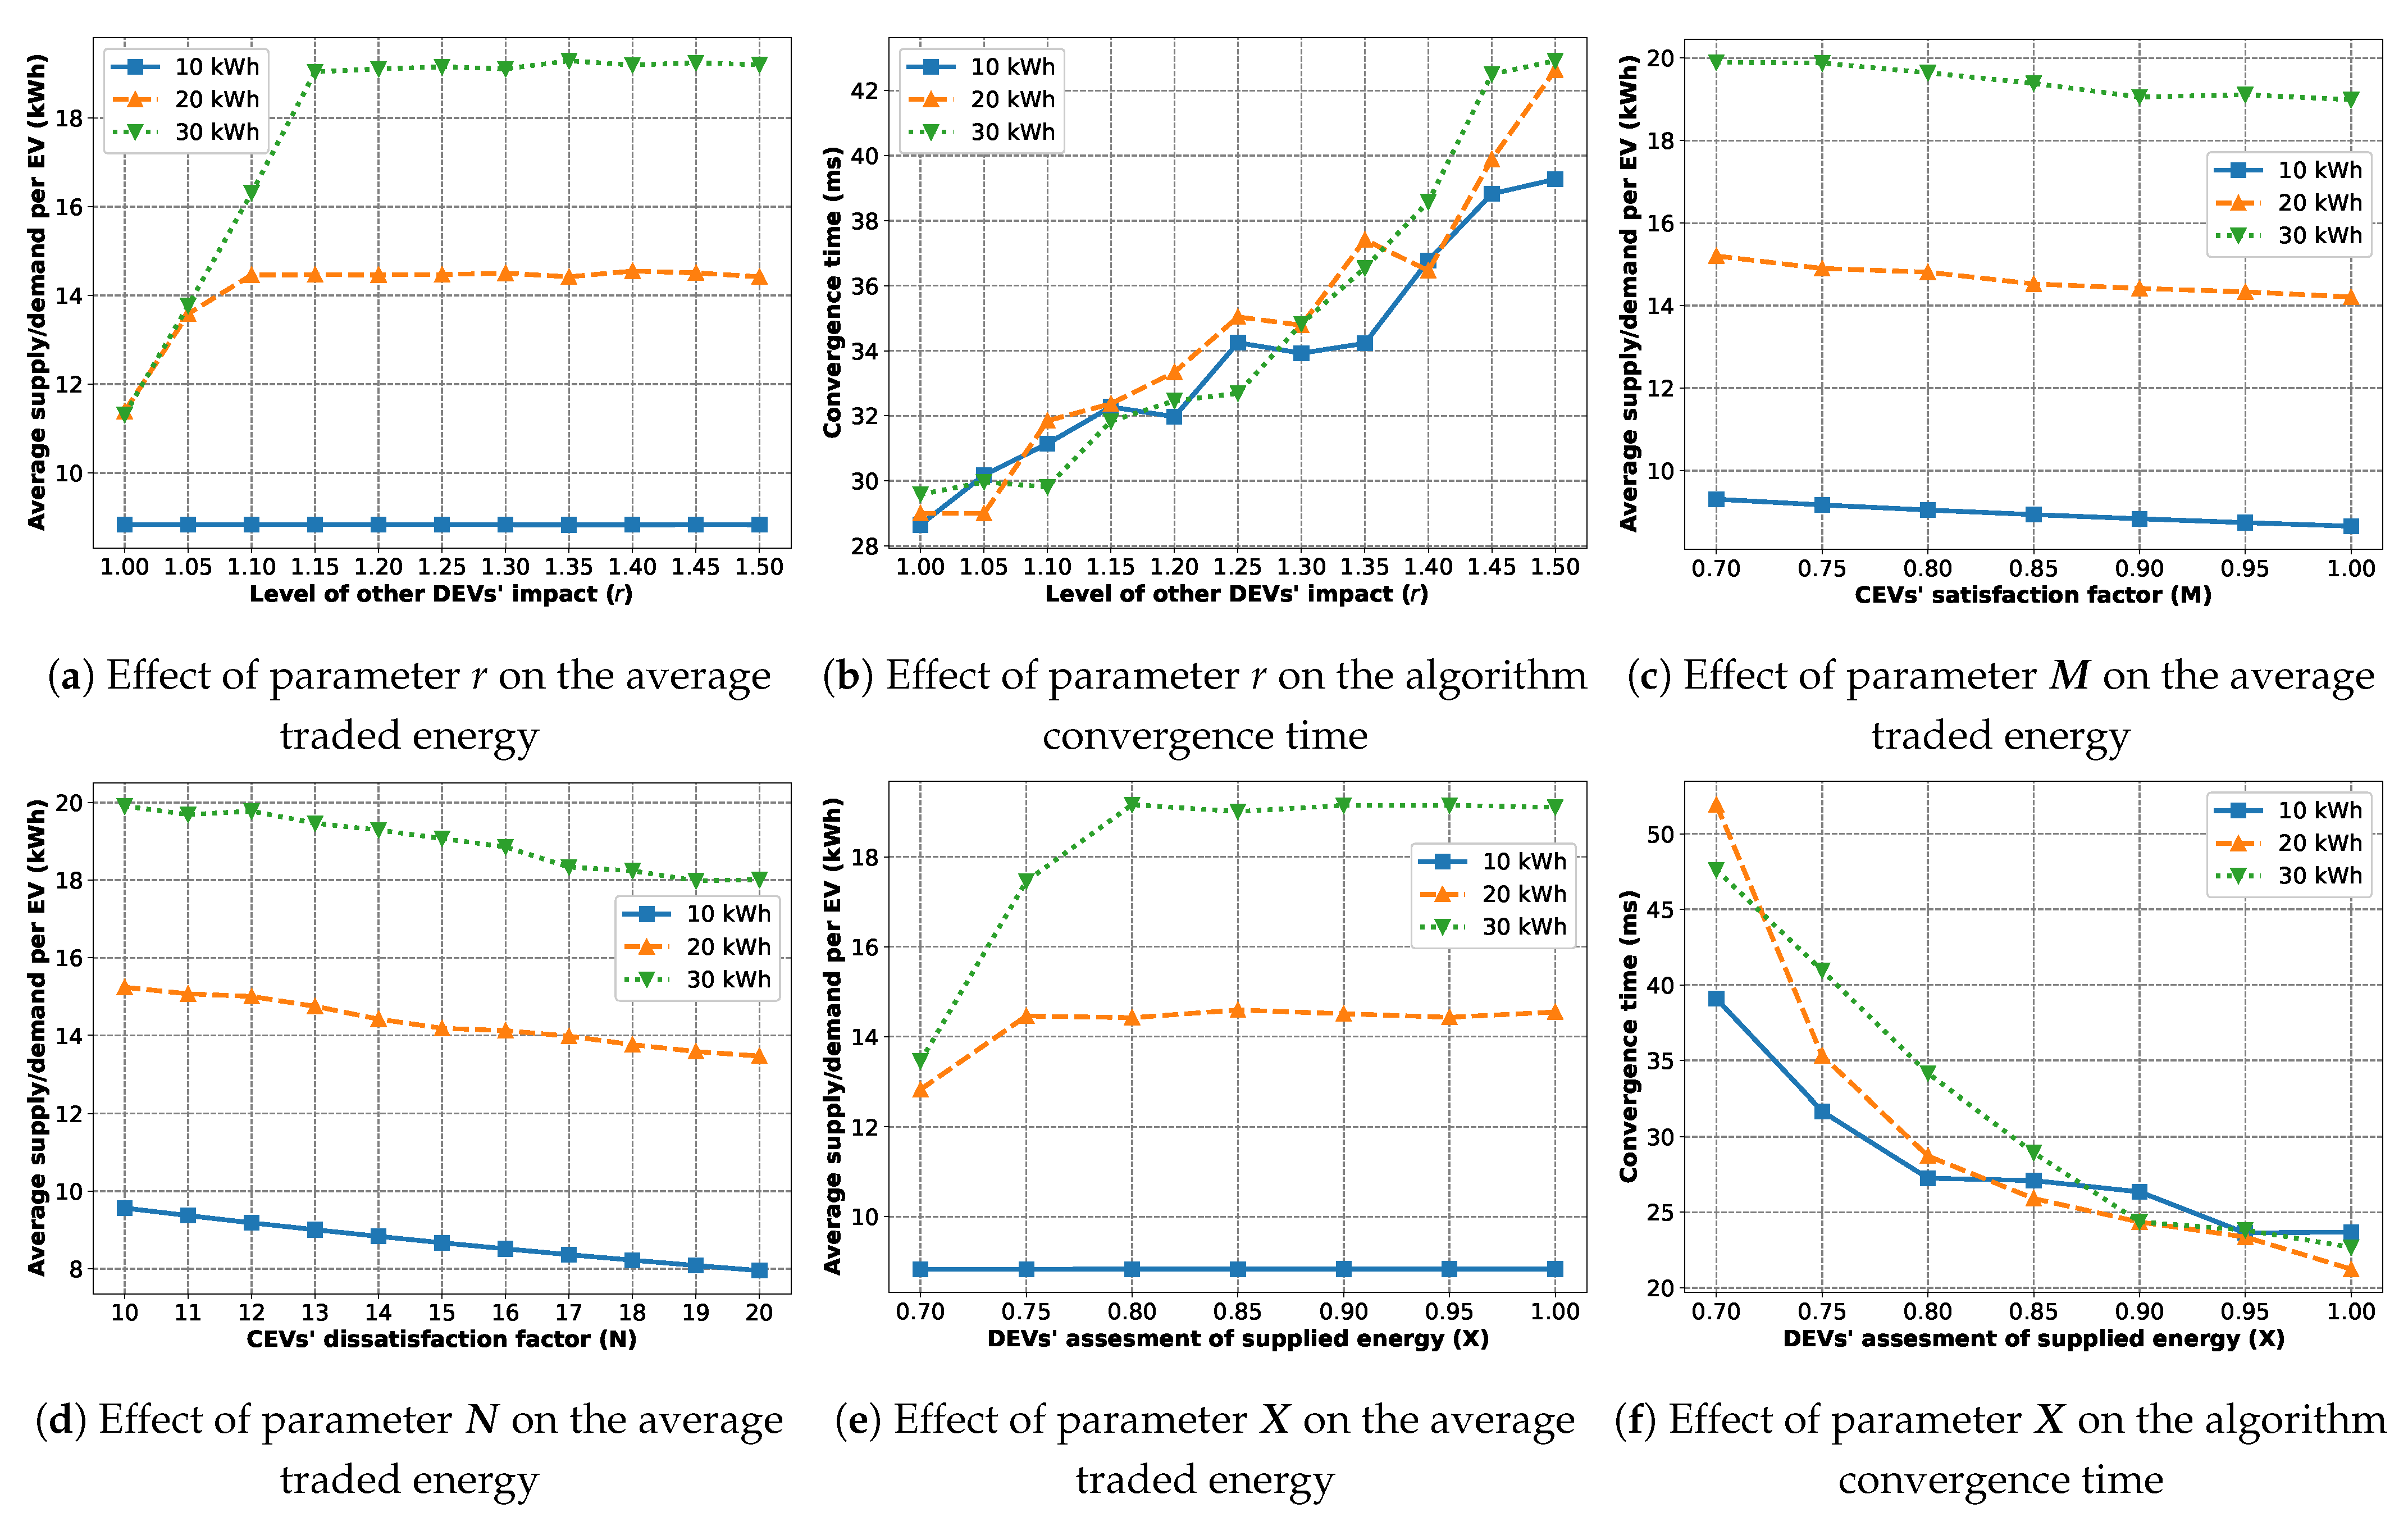
In addition to the previous scenario, we perform a sensitivity analysis in
Figure 9 for algorithm-specific parameters such as
r,
,
, and
. Here, we consider two CEVs and two DEVs,
kWh,
kWh,
$/kWh,
,
,
,
and
, unless stated otherwise.
Figure 9a shows the effect of parameter
r on the average demand/supply. For
Figure 9, the average demands and average supplies are equal as we are considering an equal number of CEVs and DEVs. According to Equation (
6),
r affects the denominator of the positive term, which means a higher value of
r will make this term smaller based on the other DEVs’ supply. To match this, a DEV will try to increase its own supply. This is why we see that the traded energy quantity is rising with increasing values of
r until it becomes saturated when the CEVs have their demands satisfied. From
Figure 9b, we observe that increasing
r also makes the algorithm slower to converge.
Figure 9c shows the effect of parameter
, the satisfaction coefficient of the CEVs, on the average demand/supply. It captures the loss in the energy transfer. The lower the satisfaction coefficient, the higher the loss. To compensate for the higher loss, CEVs demand more energy. This is evident by the downward trend in traded energy with respect to the increasing satisfaction coefficient.
Figure 9d depicts the sensitivity of the dissatisfaction coefficient of the CEVs (
) in terms of average demand/supply.
is a constant added to the denominator of the positive term in Equation (
5). Higher
lowers the positive term so, in response, a CEV will either have to increase the numerator by increasing the demand or decrease the negative term by decreasing the demand. Due to the logarithmic operator in the numerator of the positive term, the effect of increasing demand is weaker than that of decreasing the demand. This results in a downward trend in the traded energy with increasing
.
Finally,
Figure 9e,f present the effect of
on the quantity of traded energy and the convergence time of the trade algorithm.
represents the DEVs’ evaluation of traded energy or, in other words, their willingness to trade with the CEVs. This is why increasing
results in more traded energy until the CEVs’ demands are fulfilled, as shown in
Figure 9e.
Figure 9f informs us that increasing
also leads to faster convergence of the trade algorithm.
8.3. Scalability of the Trade Algorithm
In this subsection, we study the scalability characteristics of the trade algorithm with varying numbers of EVs and other trade parameters like the maximum demands, supplies, and prices.
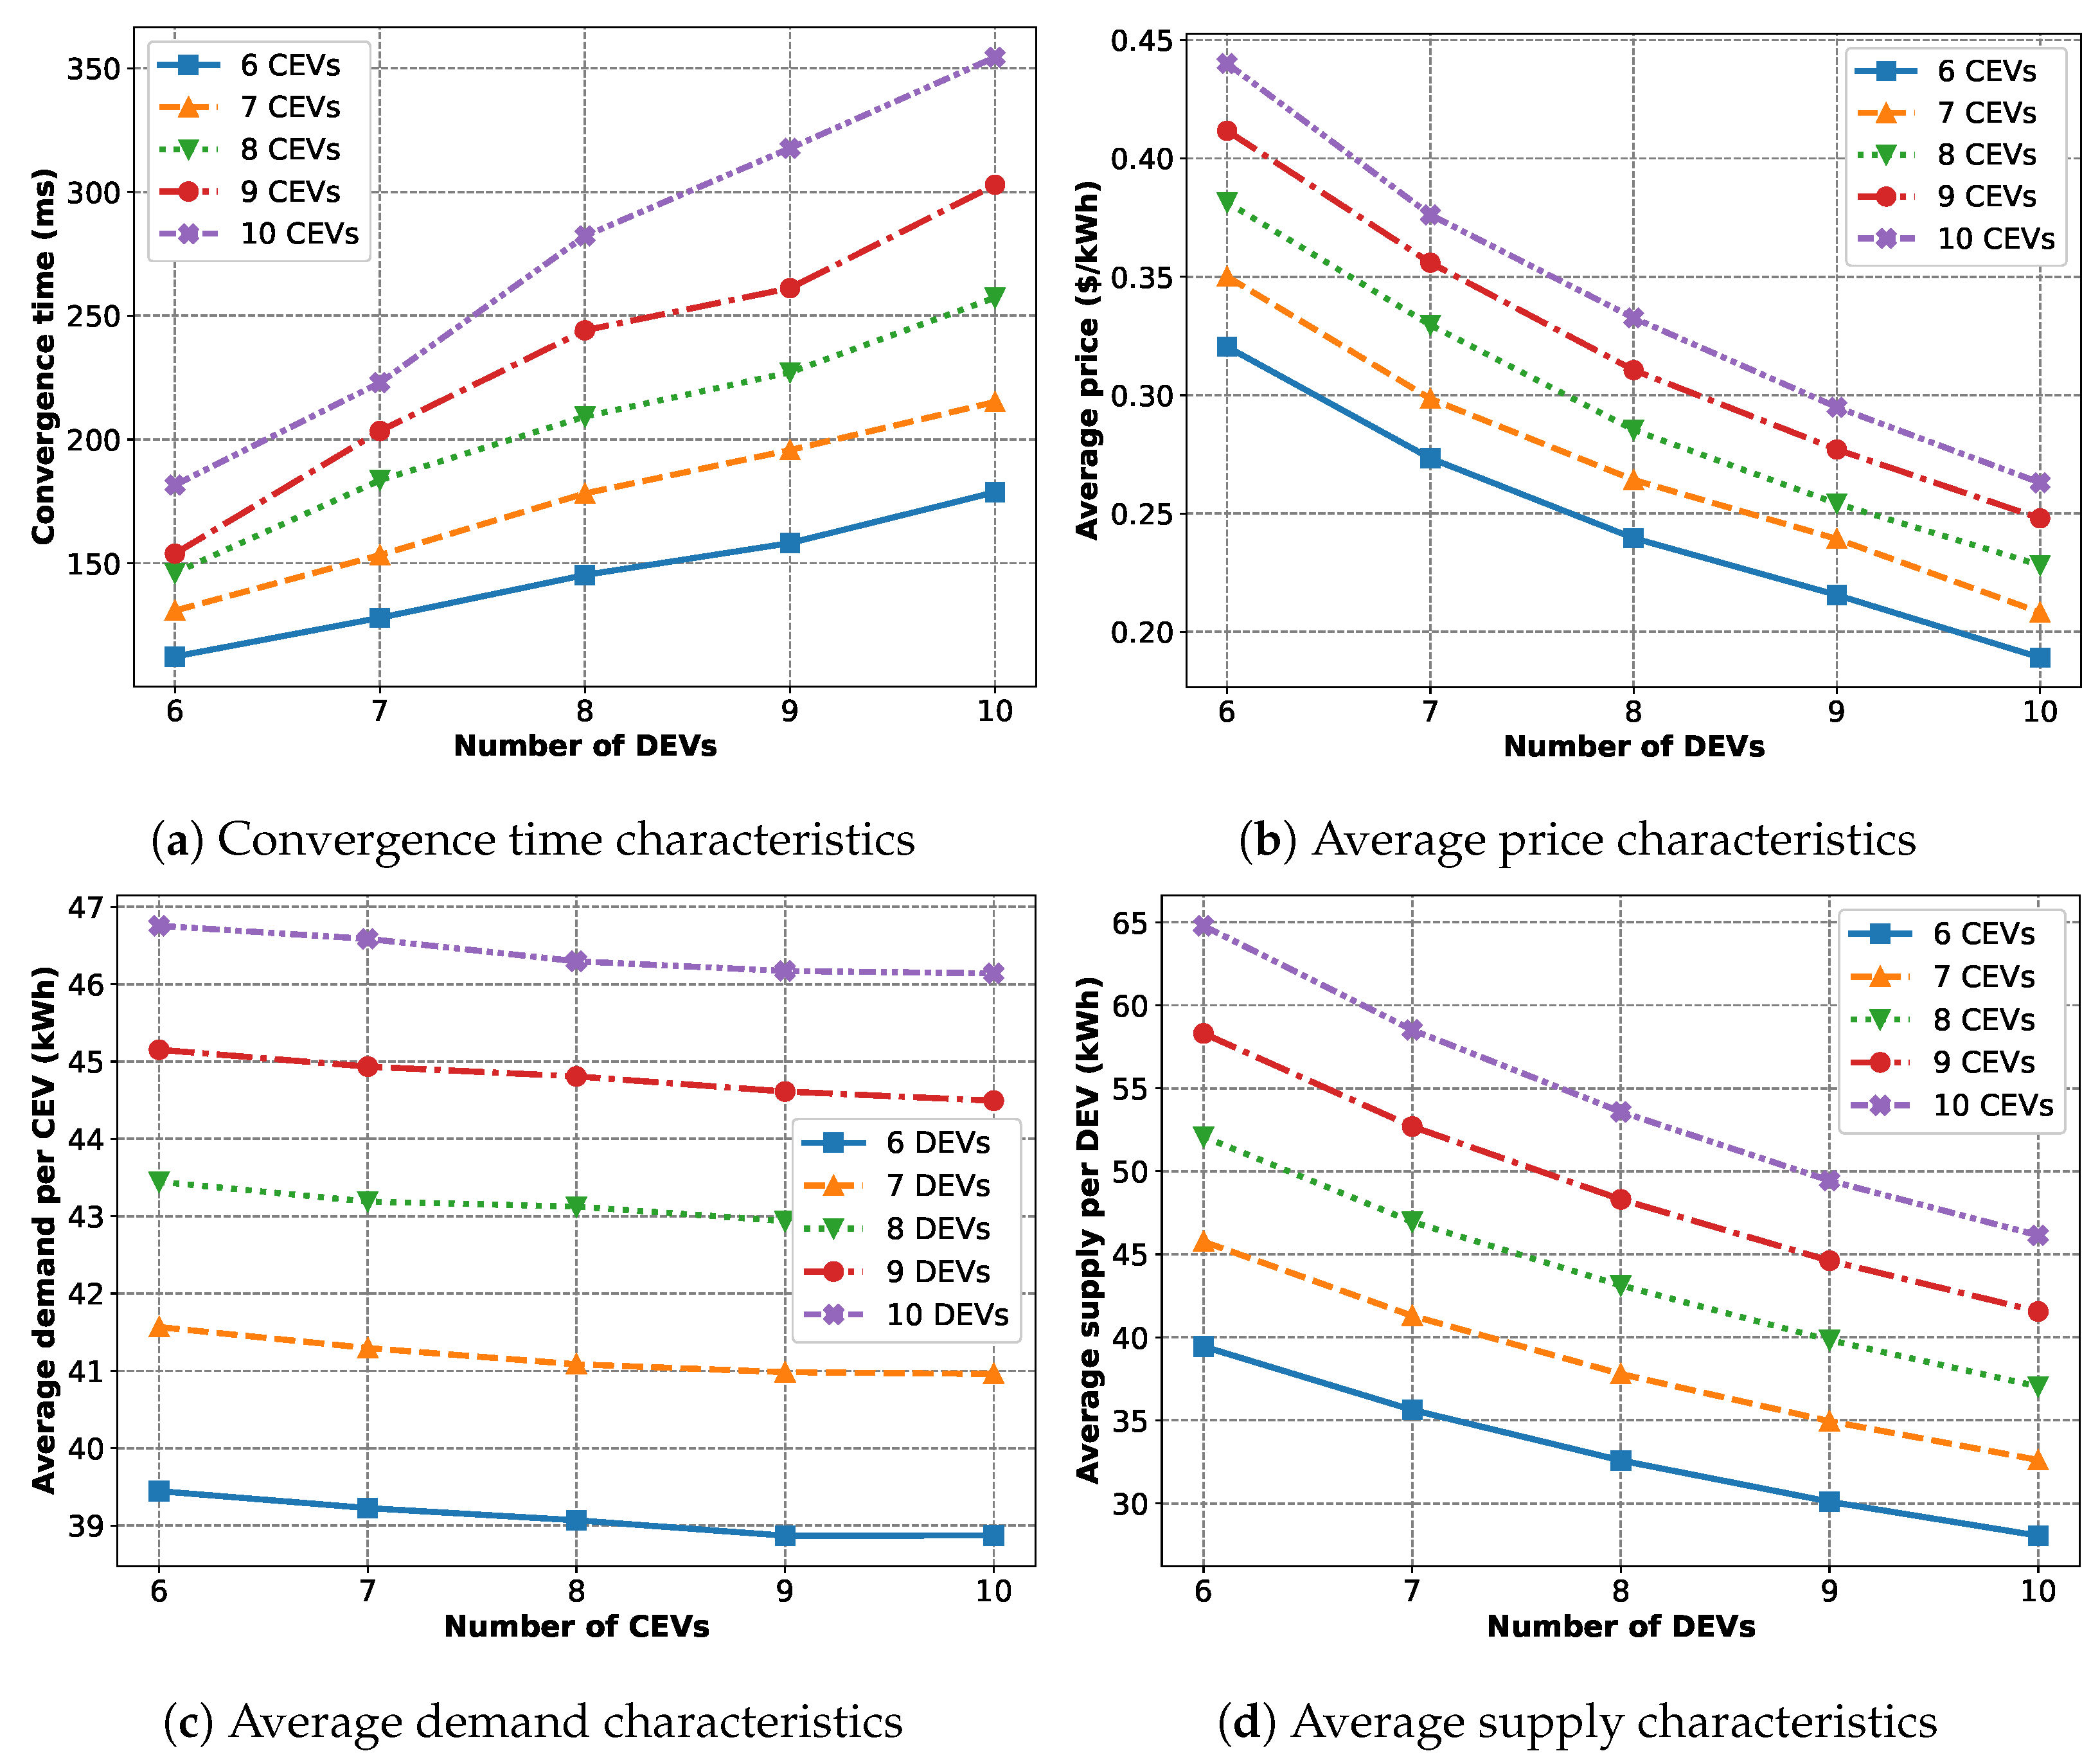
The first scenario we consider deals with varying the number of CEVs and DEVs, with the results presented in
Figure 10. Here, we fixed
kWh,
kWh and
$/kWh for all the EVs.
Figure 10a shows the convergence characteristics of the trade algorithm. We can see that, with an increased number of EVs, the convergence time also increases.
Figure 10b shows that the average price decreases with an increasing number of DEVs as more DEVs mean more available supply. Also, the average price increases with an increasing number of CEVs as more CEVs mean more total demand.
Figure 10c illustrates that, as the number of CEVs increases, the average amount of energy each CEV can buy decreases as the supply remains the same. On the other hand, adding more DEVs results in an increased amount of energy bought by the CEVs.
Figure 10d shows the same thing but from the DEVs’ point of view.
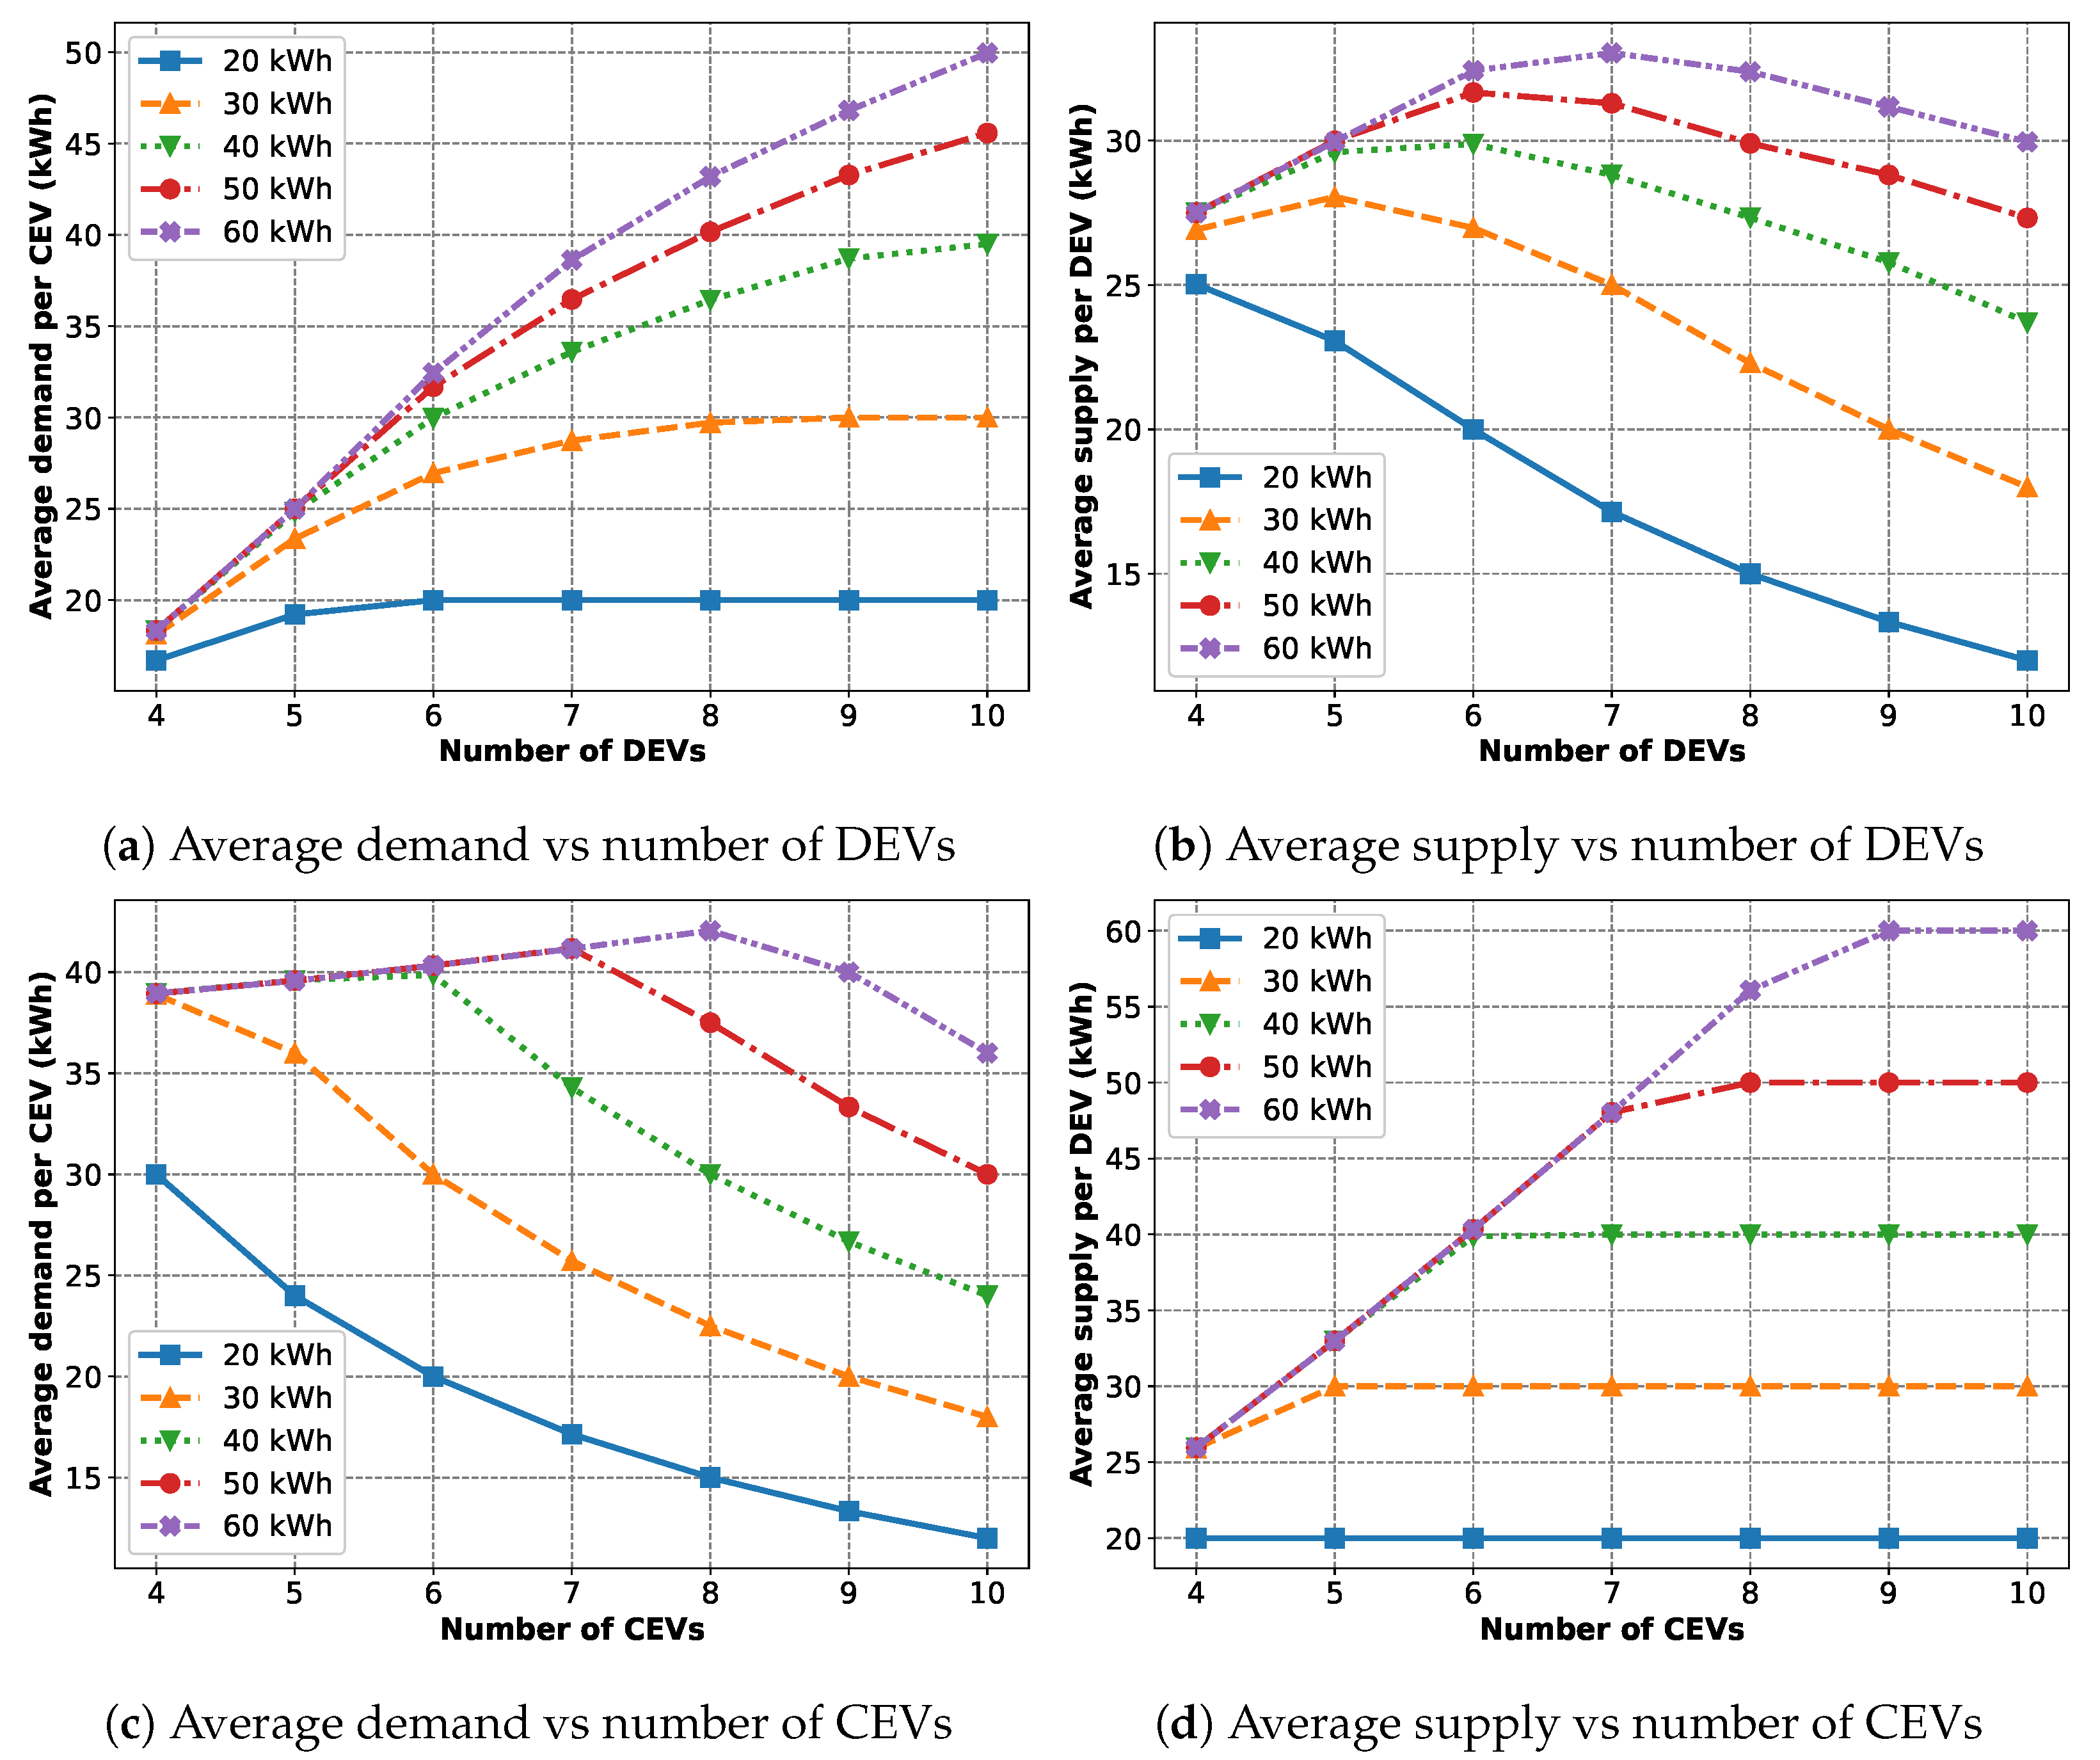
The second scenario (the results are presented in
Figure 11) deals with varying the maximum demand and supply parameters along with the number of CEVs and DEVs. For
Figure 11a,b, the number of DEVs and the maximum energy demand of the CEVs are varied. Each CEV (
) has the same maximum demand, while for the DEVs,
kWh and
$/kWh.
Figure 11a shows that the average demand per CEV respects the maximum demand constraints. With fewer DEVs present, the demands are not fulfilled and lag behind the maximum value. However, with more DEVs present, the demands are met and follow the constraint exactly. This is why we see that the curves plateau at some point as the number of DEVs increases.
Figure 11b shows that the average supply per DEV increases with more DEVs at first as they increasingly satisfy unmet demands from the CEVs. However, at some point it reaches a peak when all the CEVs’ demands are met and starts going down as, from this point forward, adding more DEVs results in a reduced amount of energy bought from each DEV. Also, as expected, the peak point is achieved later when the maximum demand of the CEVs is higher.
For
Figure 11c,d, the number of CEVs and the maximum energy supply of the DEVs are varied. Each DEV (
) has the same maximum supply and price (
$/kWh), while for the CEVs,
kWh.
Figure 11c shows that the average demand per CEV increases with more CEVs at first as they increasingly buy more energy from the DEVs who have unsold energies. But at some point, it reaches a peak when all the DEVs’ energy is sold and starts going down, as from this point forward adding more CEVs results in a reduced amount of energy available for each CEV. Also, as expected, the peak point is achieved later when the maximum demand of the CEVs is higher.
Figure 11d shows that the average supply per DEV respects the maximum supply constraints. With fewer CEVs present, there are unsold energies and the supply lags behind the maximum value. However, with more CEVs present, all the energies are sold and exactly follow the constraint. This is evident from the fact that the curves plateau as the number of CEVs increases.
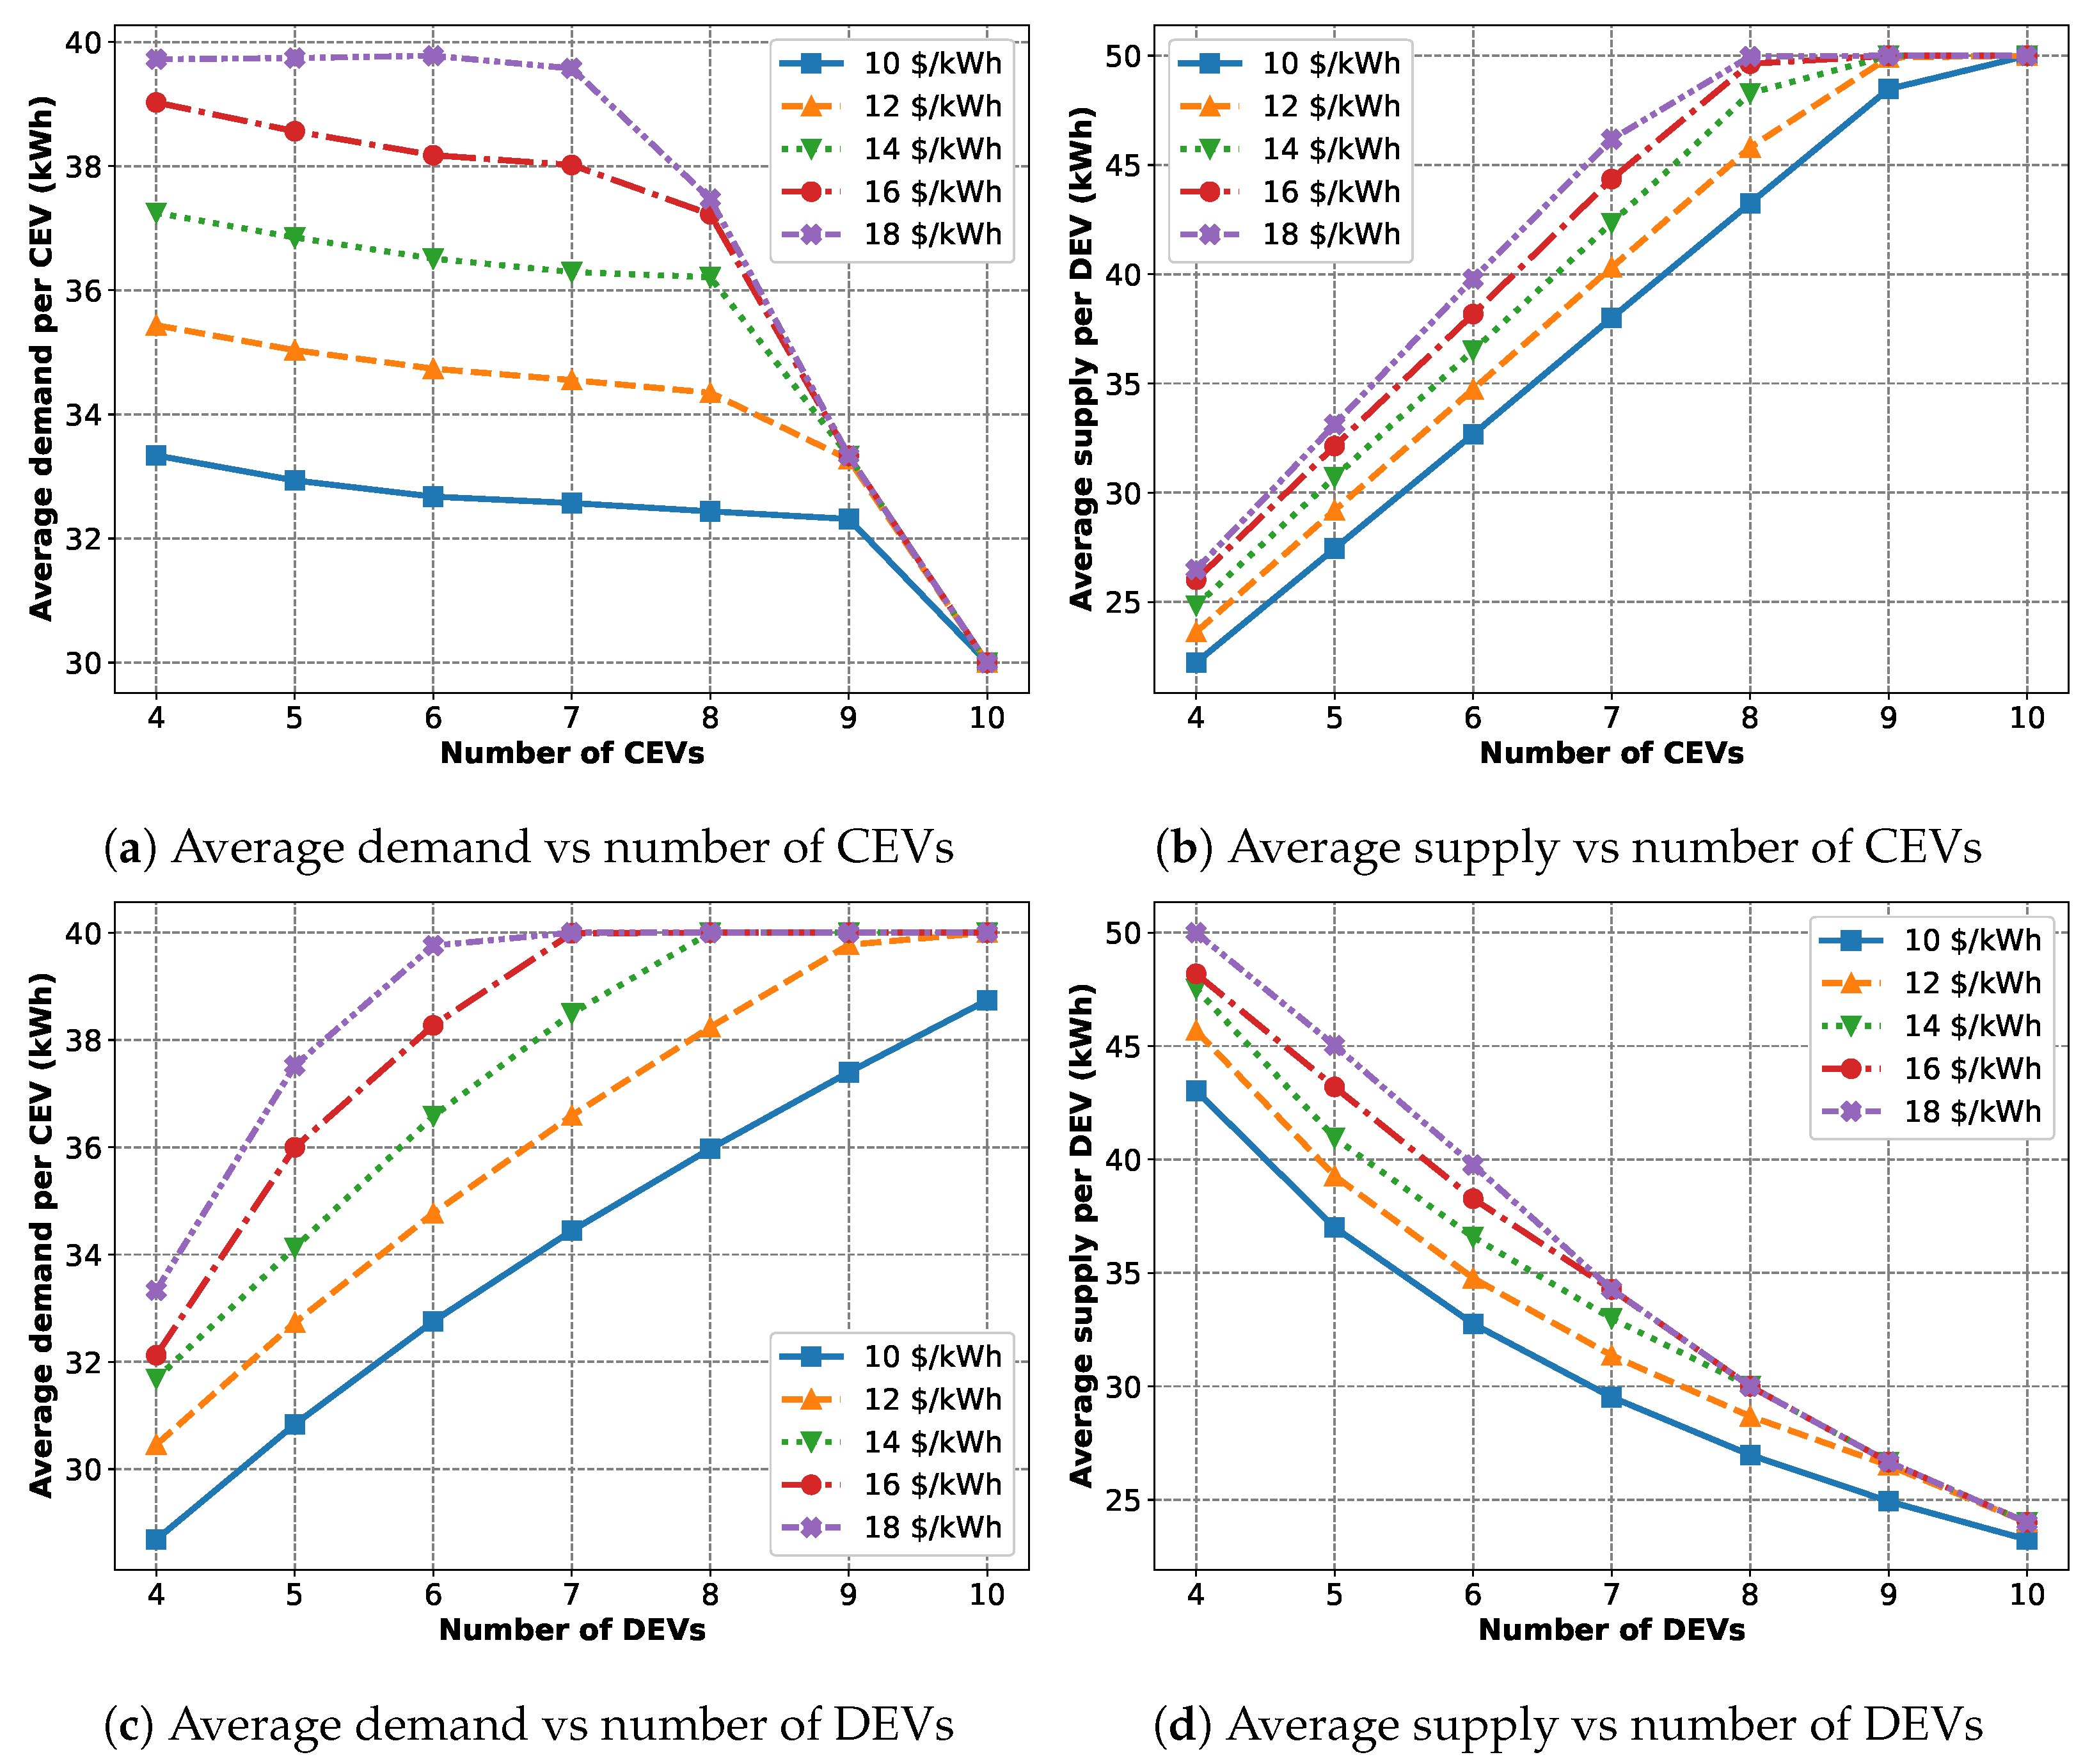
The third and final scenario (the results are presented in
Figure 12) deals with varying the maximum price parameters along with the number of CEVs and DEVs. For
Figure 12a,b, the number of CEVs and the maximum energy price of the DEVs are varied. Each DEV (
) has the same maximum supply,
kWh, and price while each CEV has the same maximum demand,
kWh.
Figure 12a illustrates that, with an increasing number of CEVs, while the number of DEVs remains the same, the average energy bought per CEV decreases due to supply shortage. Also, we see a sudden drop in the amount of energy bought with more CEVs as the DEVs cannot supply any more energy and have hit their maximum capacity. On the other hand, as the maximum prices of the DEVs increase, they are willing to sell more energy and, as a result, the CEVs also buy more energy due to increased supply. However, as a result, the DEVs also hit their maximum capacity faster, as is evident from the fact that the 18
$/kWh curve starts to drop steeply sooner than the 10
$/kWh curve. Also, we observe that the 18
$/kWh curve has already reached the 40 kWh maximum demand constraint and thus plateaus for the first three data points.
Figure 12b shows that, with increasing price, the DEVs are willing to sell more. Also, increasing the number of CEVs results in more energy sold when available while hitting the 50 kWh maximum supply constraint with too many CEVs present.
For
Figure 12c,d, the number of DEVs and the maximum energy price of the DEVs are varied. Each CEV (
) has the same maximum demand,
kWh, while each DEV has the same maximum demand,
kWh, and price. In
Figure 12c, adding more DEVs means more available energy; thus, the CEVs are able to buy more energy before reaching the 40 kWh maximum demand limit. Similarly to the previous case, increasing the energy price makes the DEVs willing to sell more energy, as shown in
Figure 12d, causing the CEV to buy more energy as well due to unmet demands. Also, adding more DEVs lowers the average energy sold by each DEV.
8.4. Pure Operation Performance of the Protocol
In this section, we present the pure operation characteristics of the fully implemented protocol. With two CEVs and two DEVs,
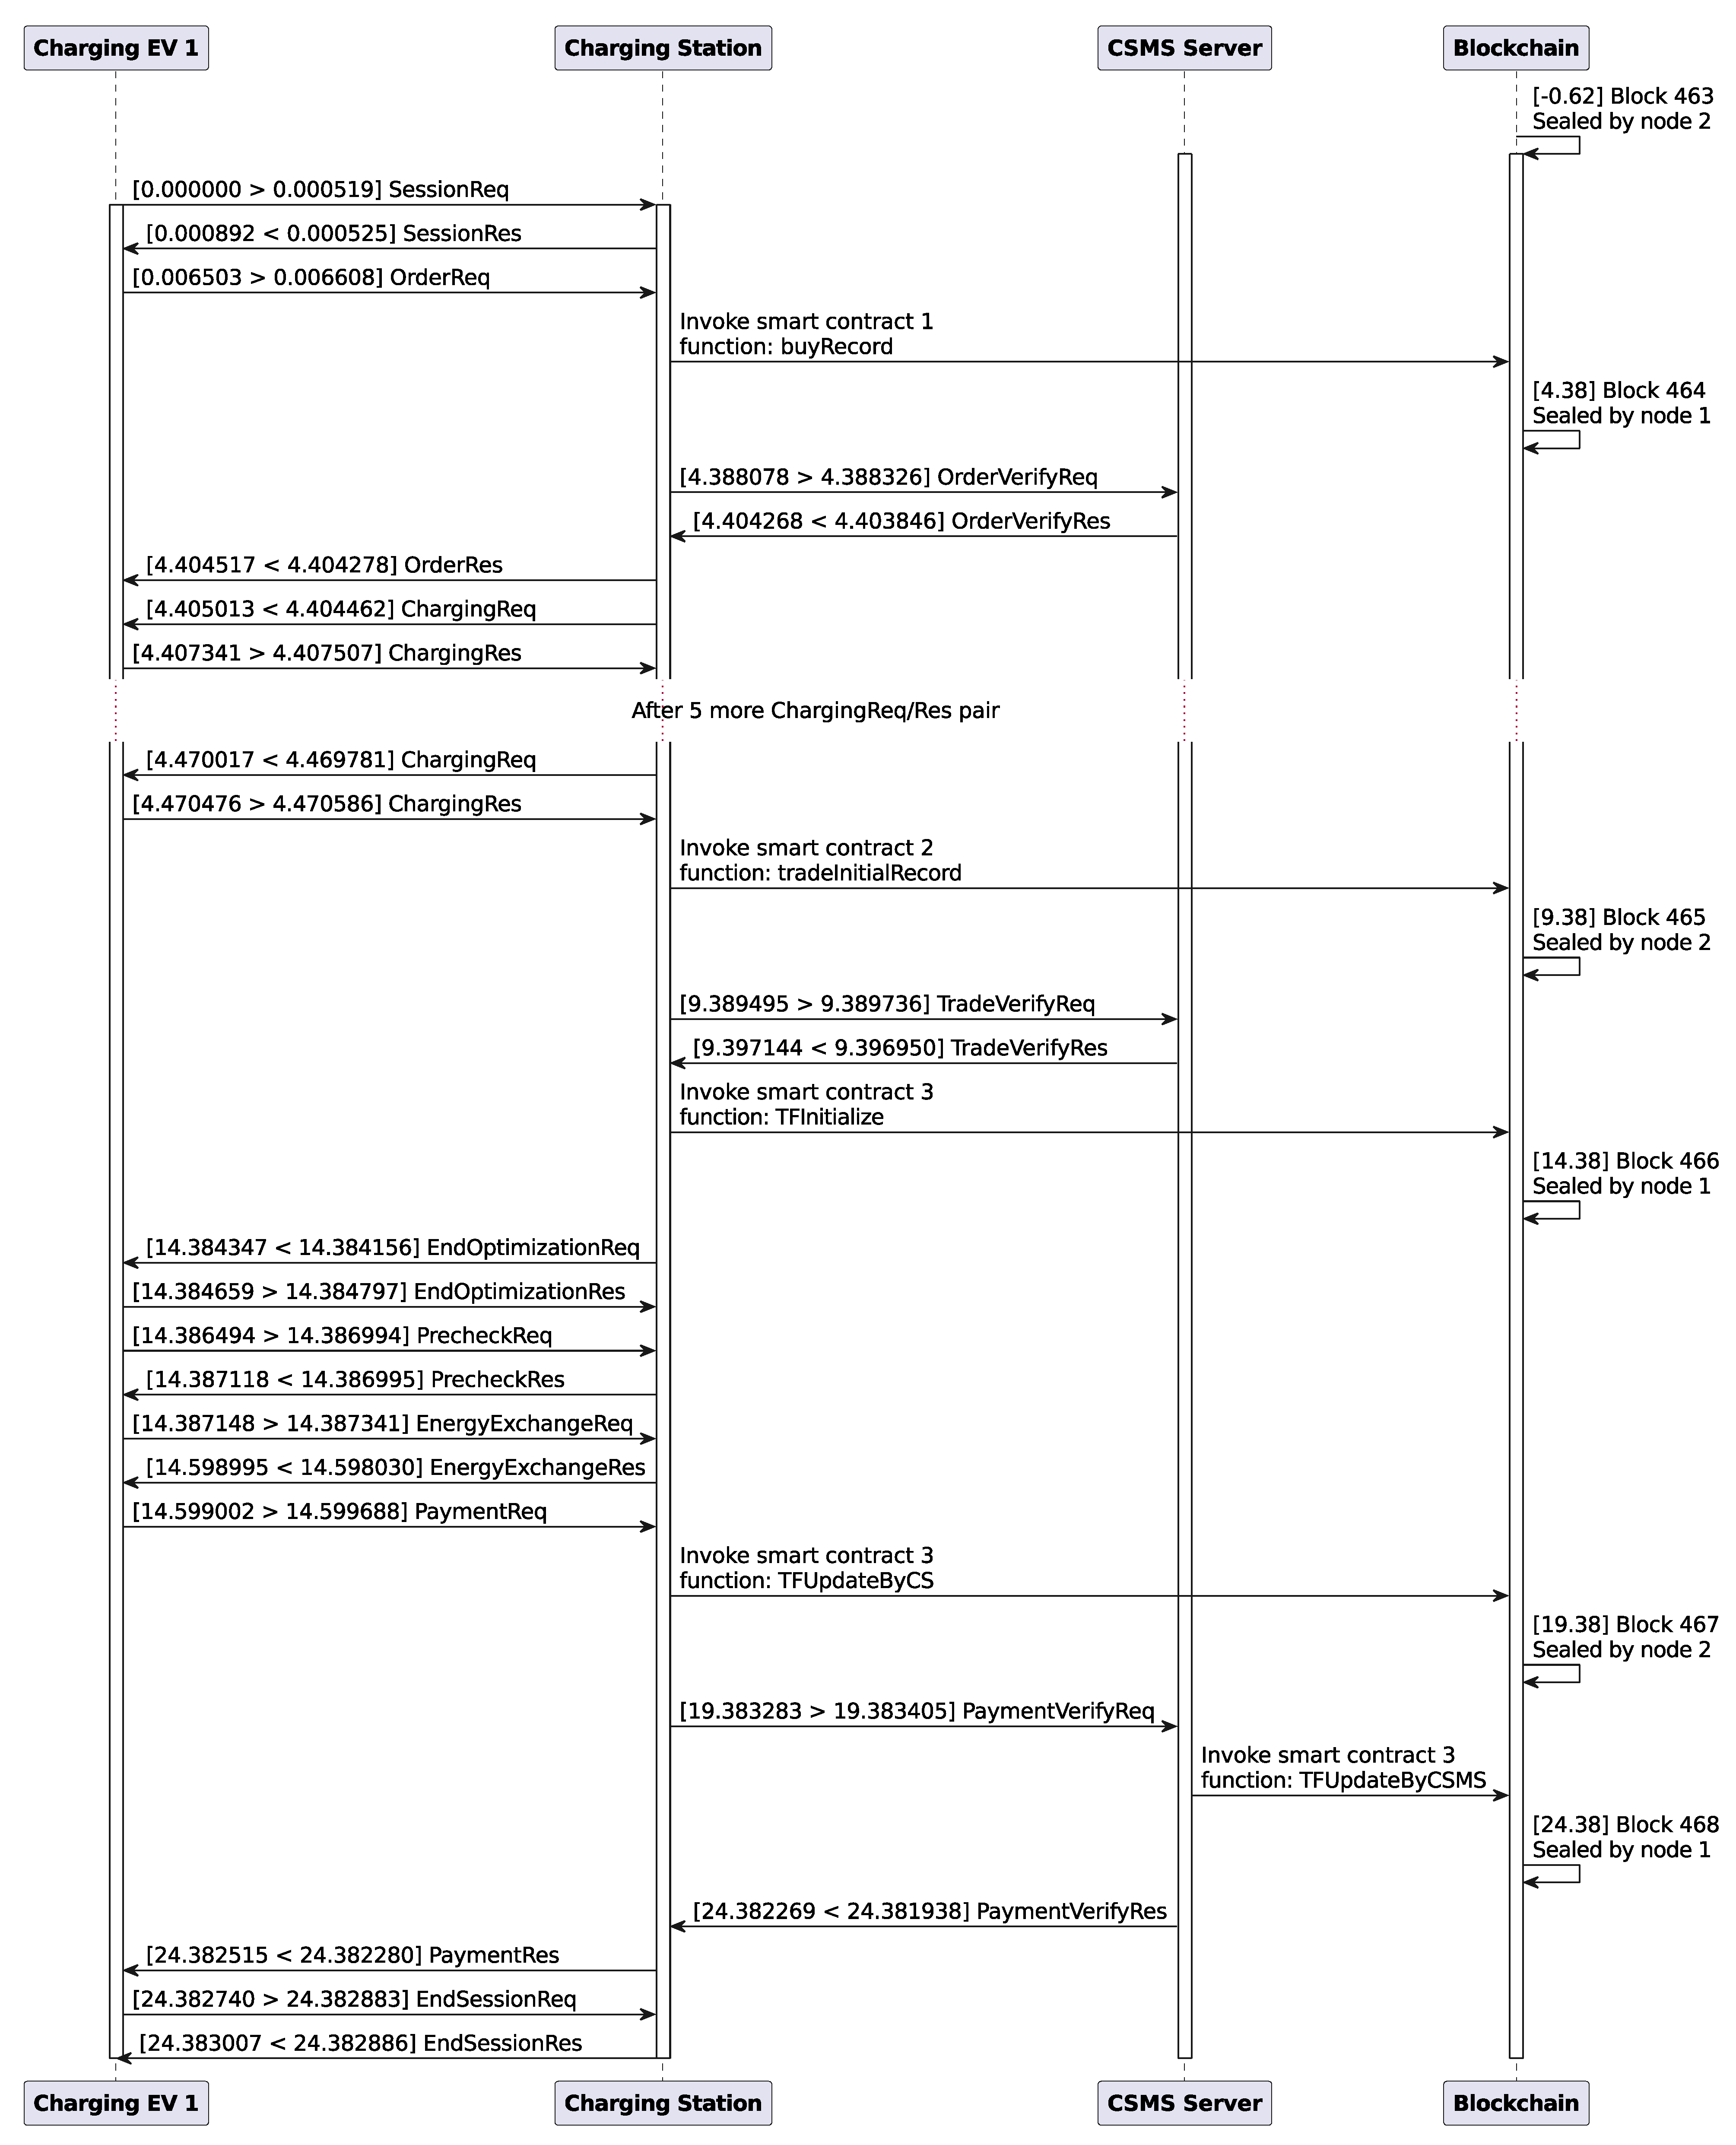
Figure 13 shows the timing diagram for the communication between the first charging EV (CEV 1) and the CS. The numbers in square brackets beside most of the actions represent the relative times in seconds. For example, in the case of the blockchain line, it shows when the block was sealed. In the case of messages, there are two numbers that, depending on the direction, represent the sending time and the receiving time. The relative time counter starts when the EV sends the first message (SessionReq). The diagram is self-explanatory and gives a overview of how the protocol works in practice. To simulate the energy exchange, we instructed the EV and the CS to sleep for 10 milliseconds per kWh of energy exchanged. This is why we see approximately 200 ms of gap between the EnergyExchageReq and EnergyExchageRes message pairs, as the energy demand was approximately 20 kWh.
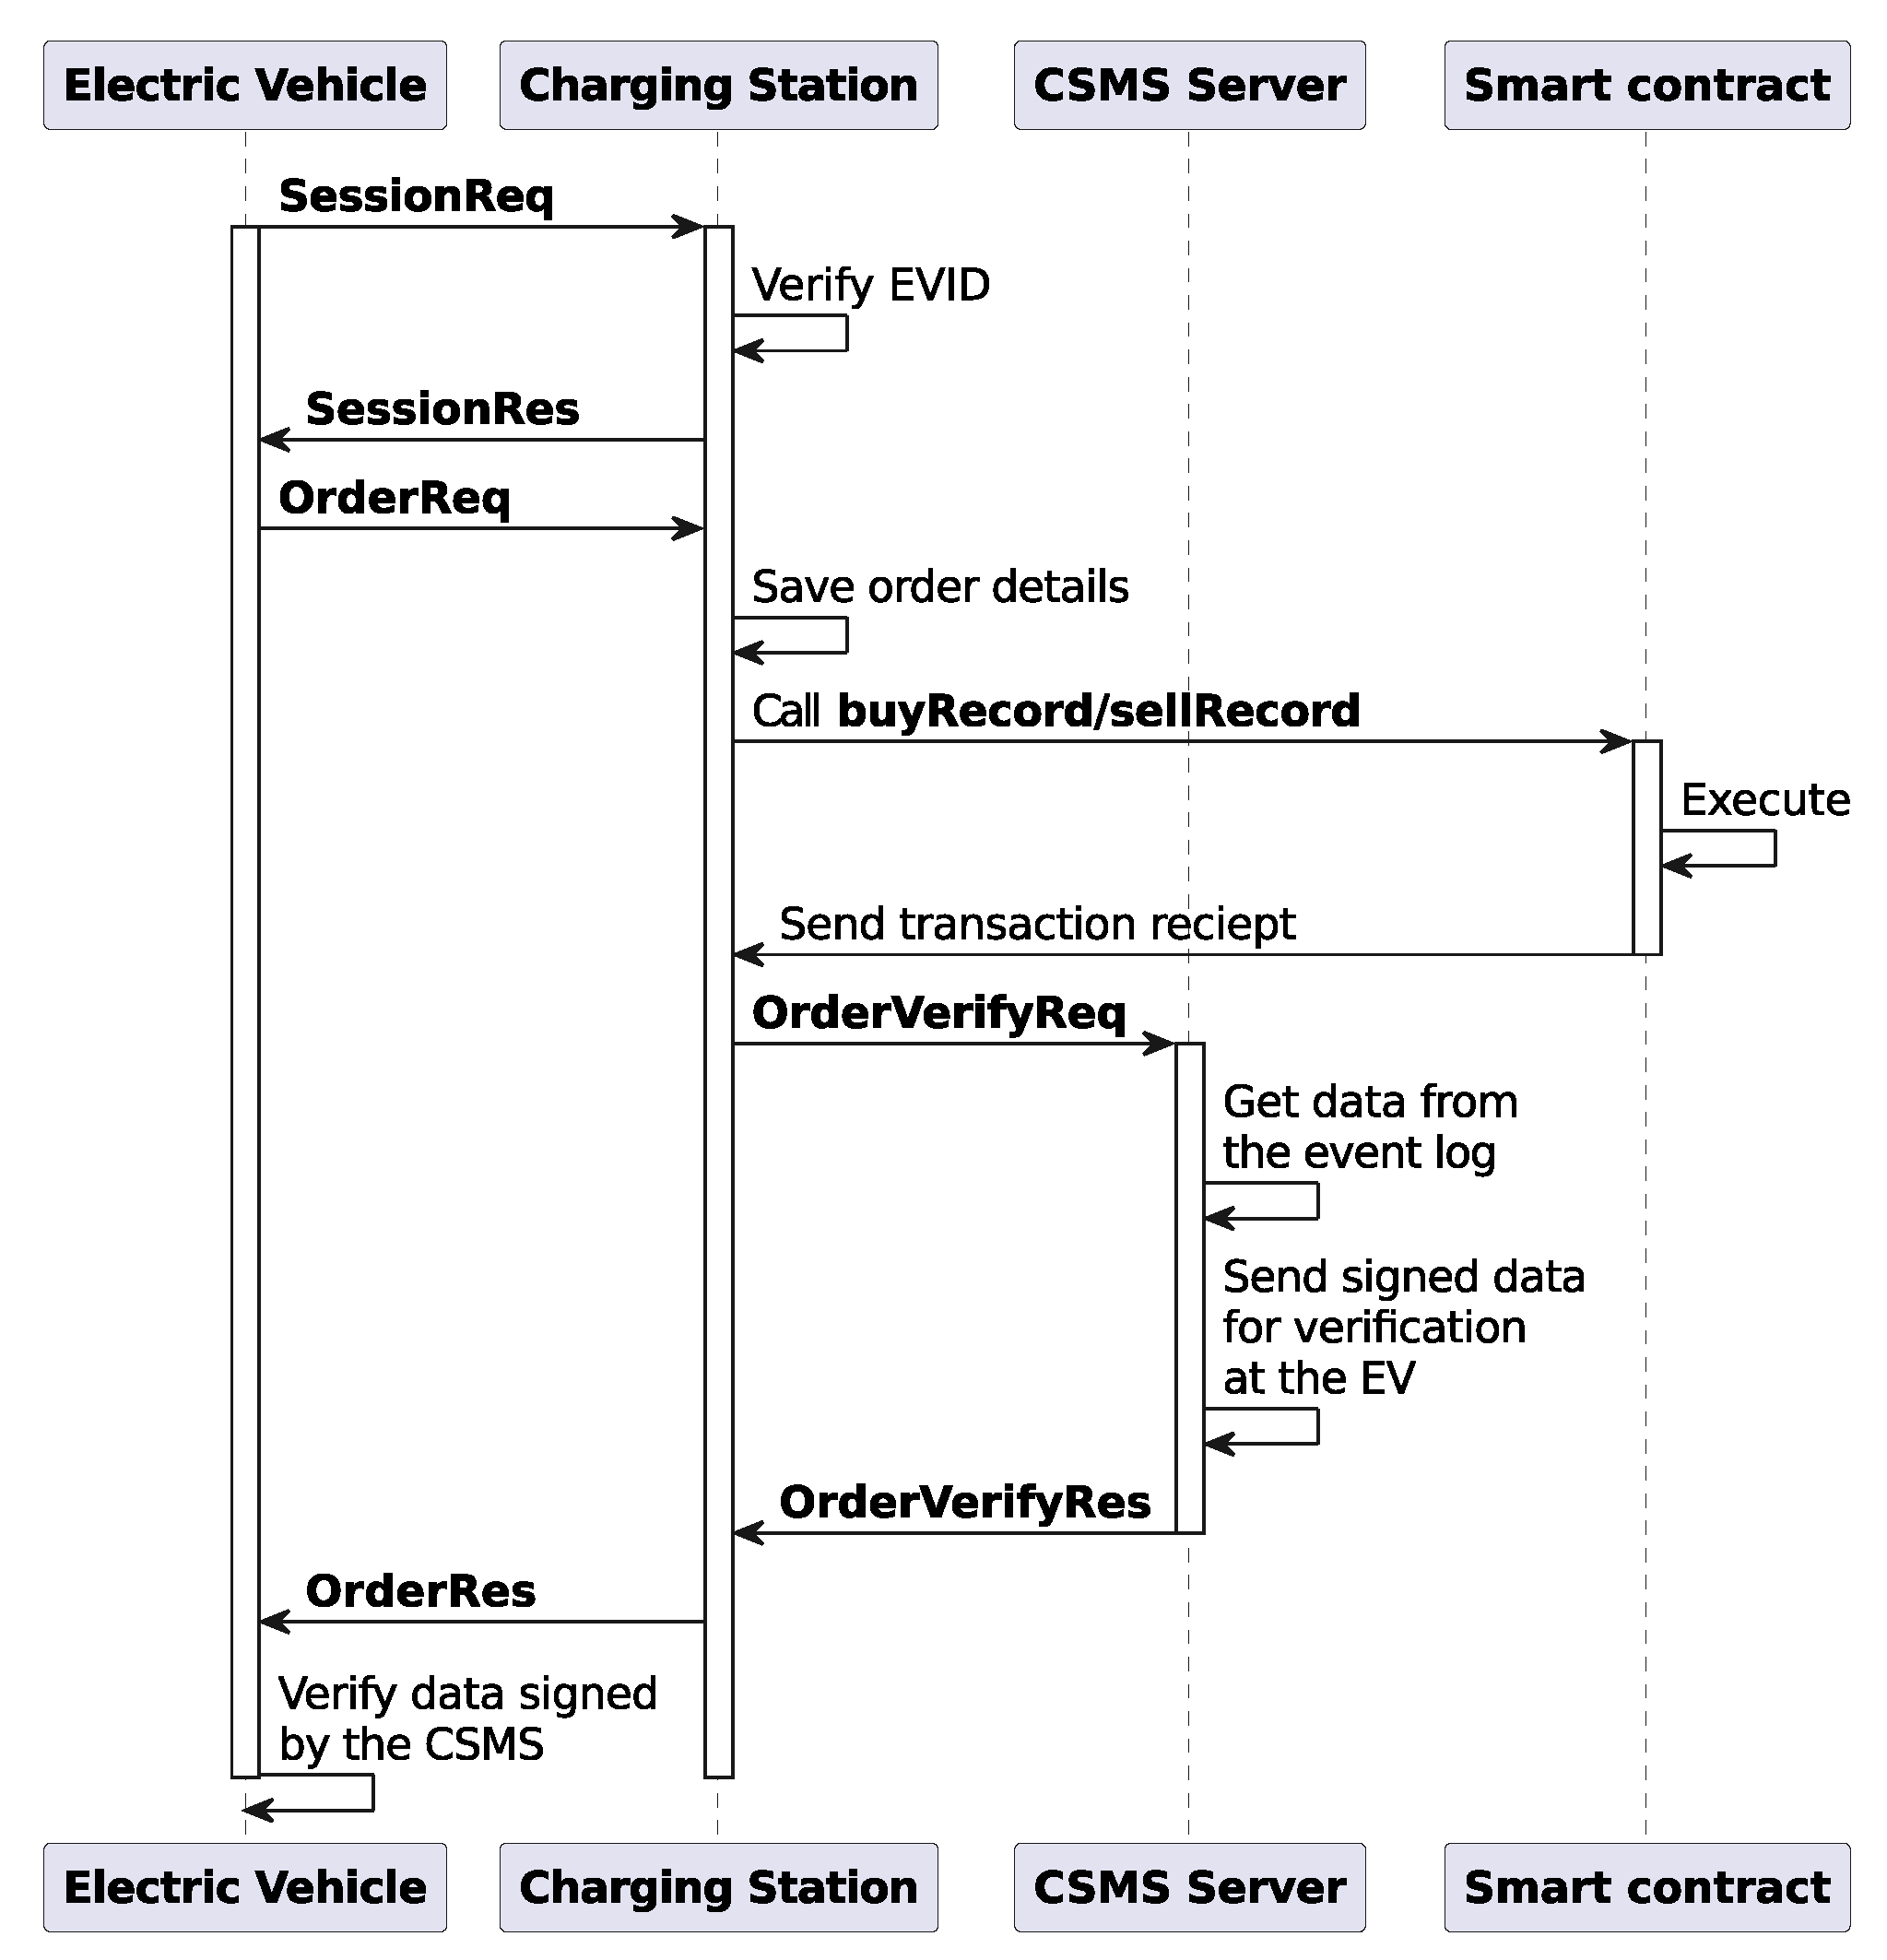
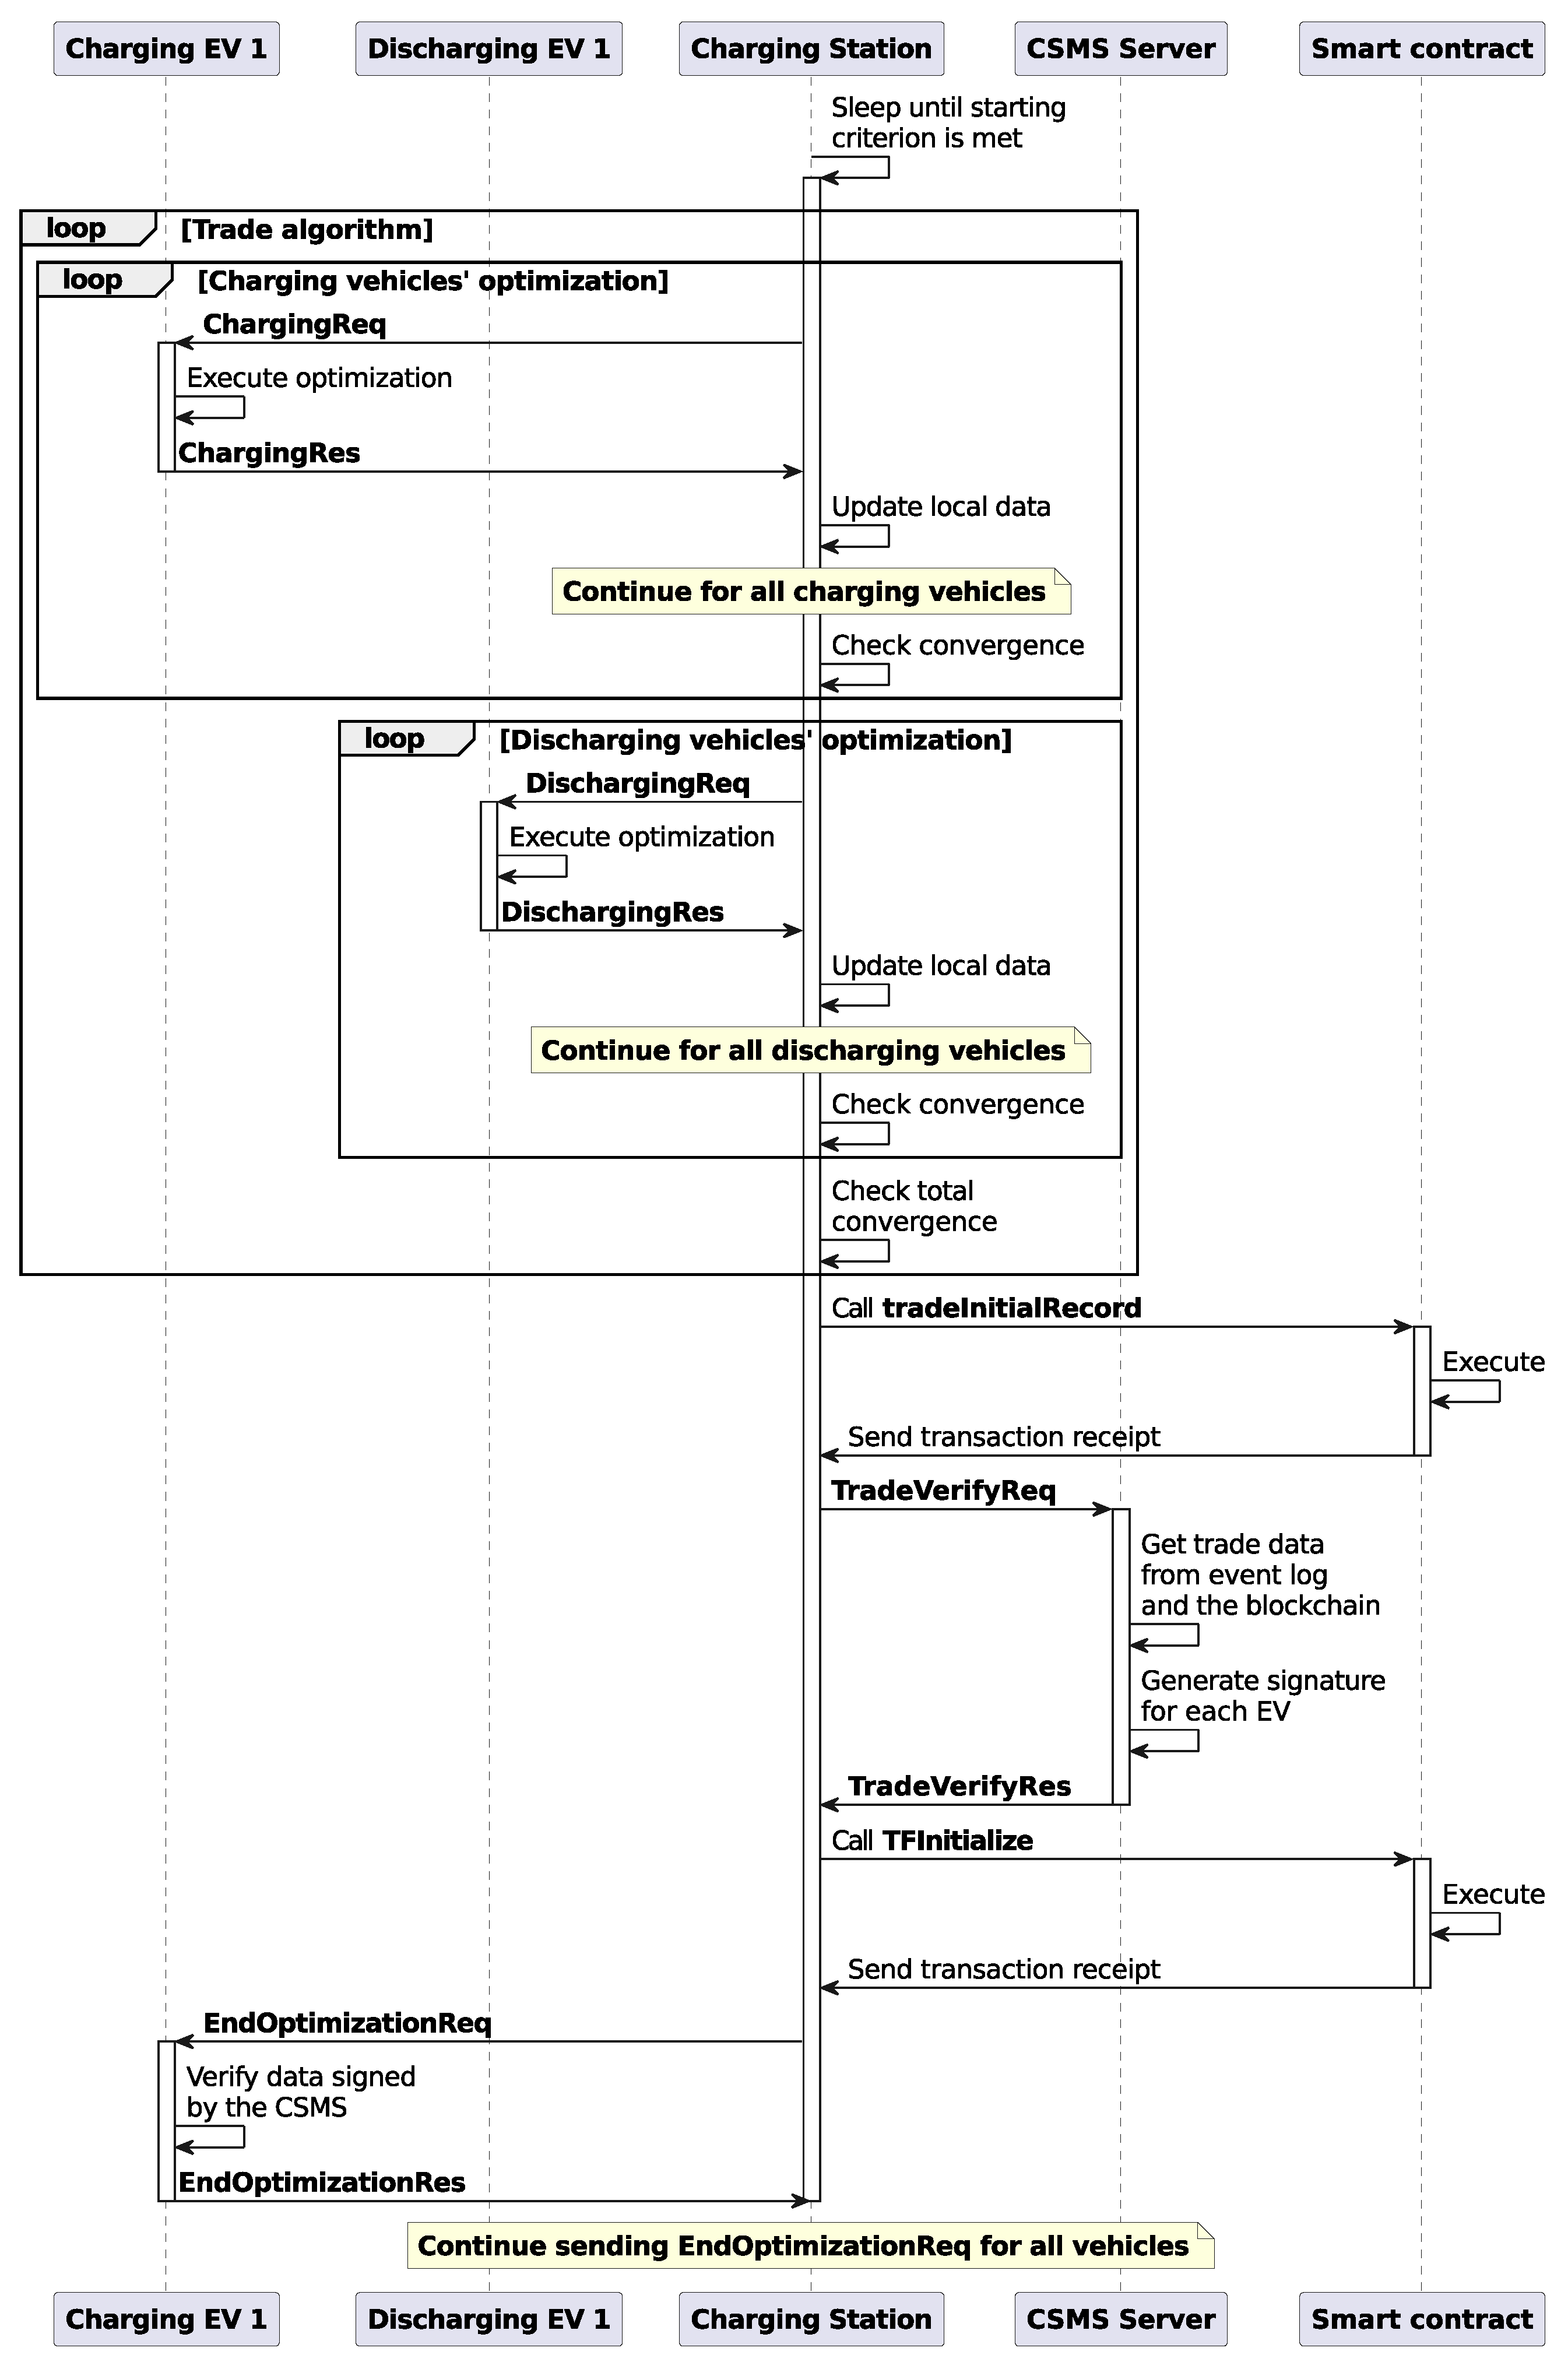
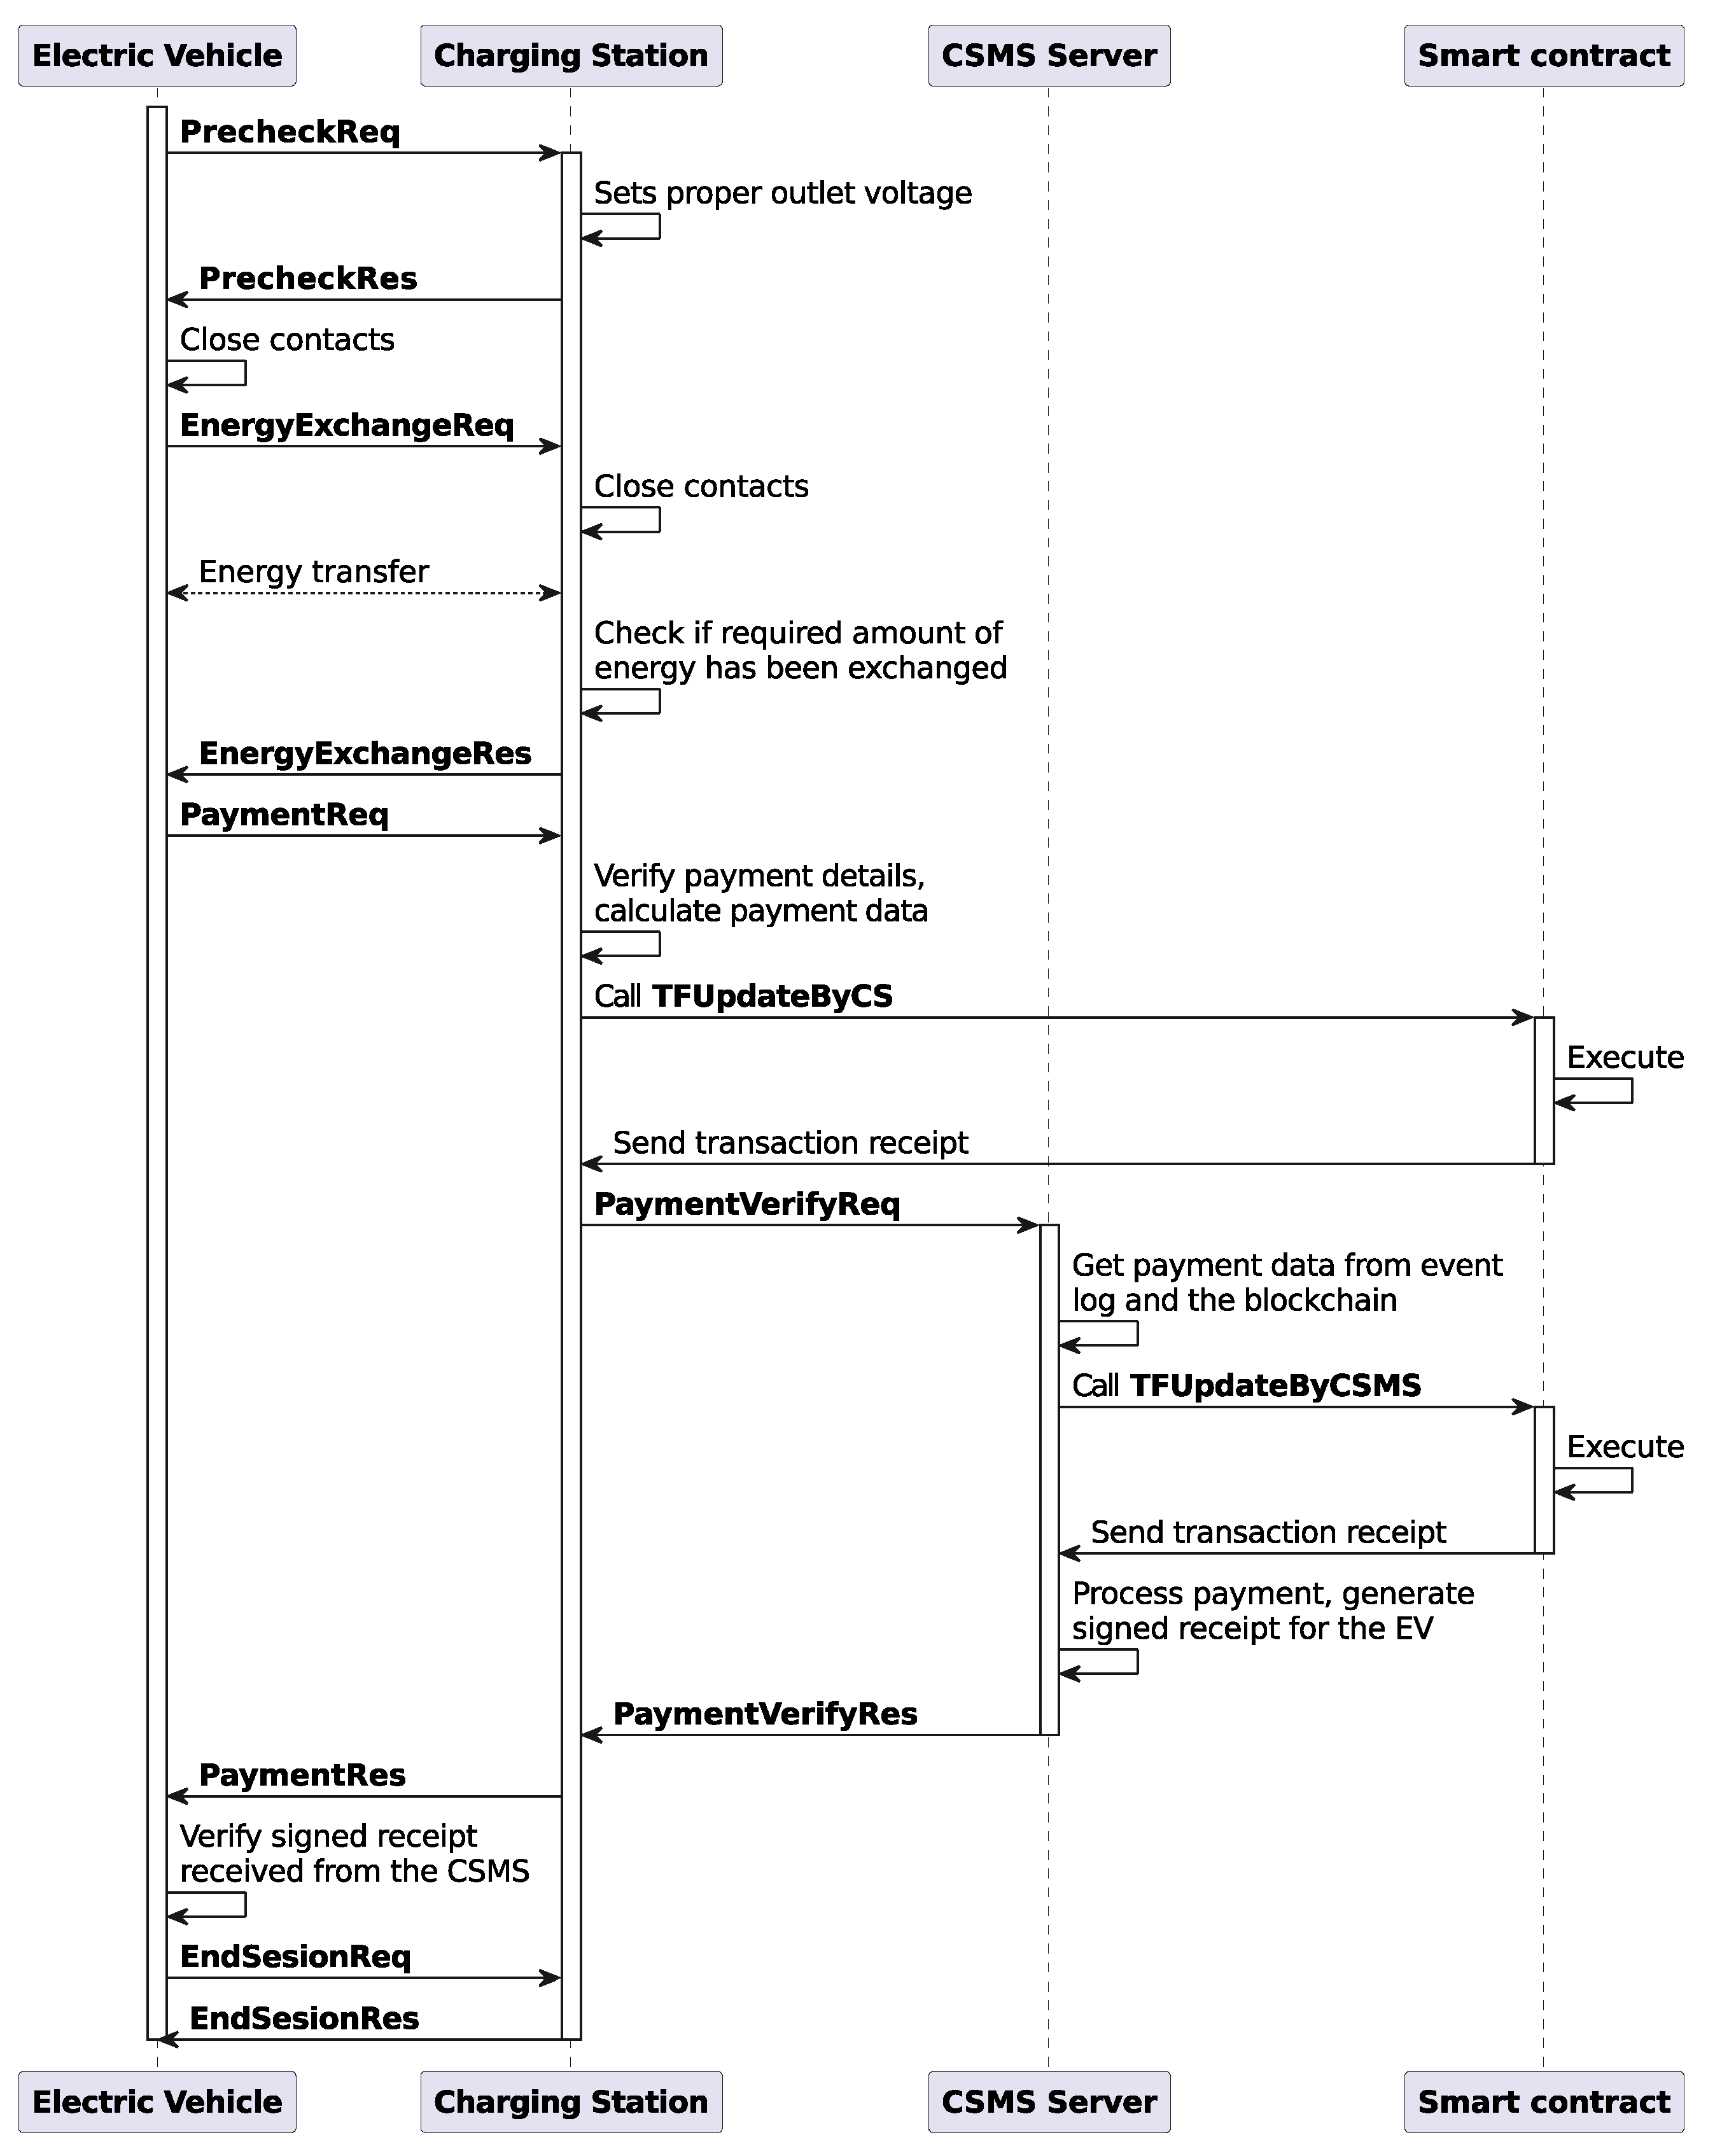
We can clearly understand that the blockchain used here has two sealers and a block period or interval of 5 s. The smart contract functions shown in Algorithms 1 and 3 are executed once per EV per charging session, while the function shown in Algorithm 2 is executed once per charging session. Each function is executed in a different block of the blockchain, so we need approximately 5 (number of functions) multiplied by 5 s (block period) = 25 s for the protocol execution. As shown in
Figure 10a, the trade algorithm itself takes less than half a second, even for a 10 CEV and 10 DEV case. Therefore, the bottleneck can be the block generation speed, but it can be made smaller. While we experimented with two different block period (
Section 8.6), we did not investigate how small it can be while operating properly. Another thing to mention here is that, while all the other smart contract functions are submitted in parallel to the blockchain, the last one (TFUpdatebyCSMS, Algorithm 3) does it sequentially for each EV. We designed it this way because parallel submission for the last smart contract means all the vehicles will have to wait until the last vehicle finishes its task. In real-life, no one will want to wait once they are finished charging or discharging their EV. This is why we submit the last contract sequentially as soon as the EV finishes its energy exchange.
In
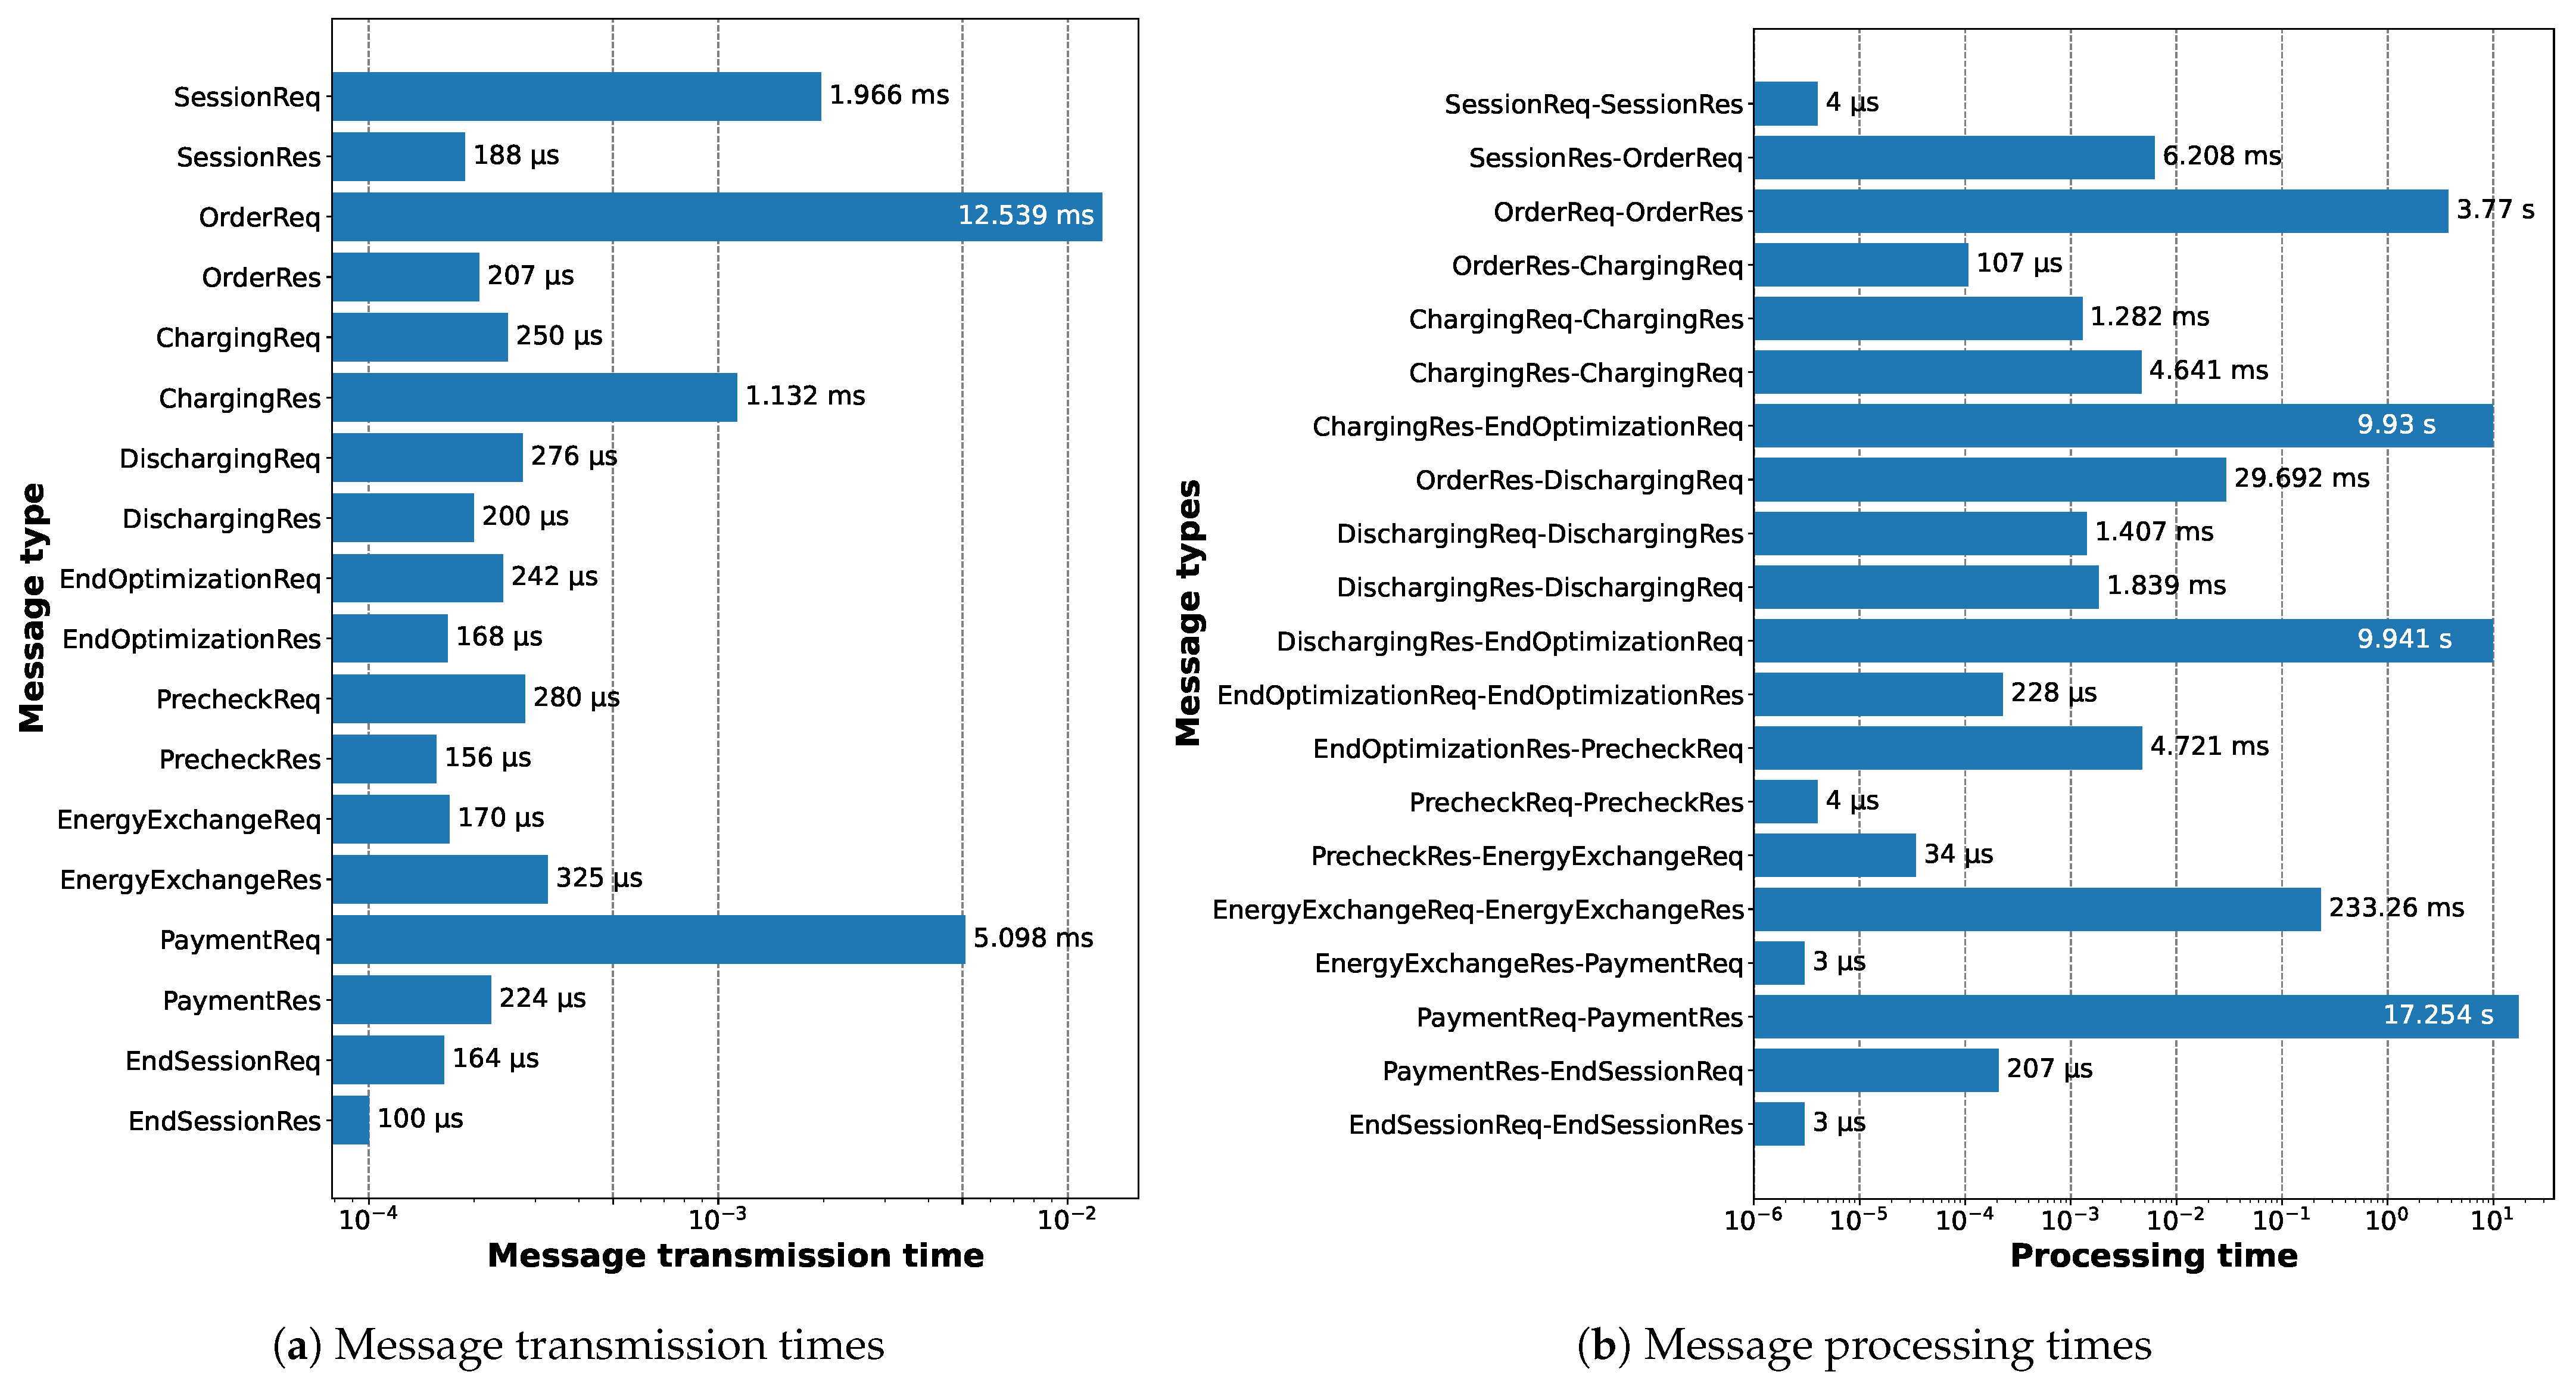
Figure 14, we present the average data transmission and processing times for messages between the EVs and the CS.
Figure 14a shows that most of the message transmission times are less than a millisecond, and at this level these values can be unreliable. However, we are showing these for reference purposes. For higher values, the reason lies in how we implemented the protocol. To control the data dependency between the CS’s multiple socket connections to the EVs, we used asynchronous locks. This causes the connections to wait for each other while performing some data-dependent tasks, thus introducing some delays in both the transmission and processing messages.
Figure 14b depicts the processing time between two consecutive messages. For example, the item
SessionReq-SessionRes represents the time spent by the CS between receiving the
SessionReq and sending the
SessionRes messages. All the significant values here are due to the smart contract execution delay. As the block period is 5 s, if we combine insights from
Figure 13 and
Figure 14b, we can understand that two smart contract functions are executed between the last
ChargingRes/DischargingRes and the
EndOptimizationReq messages, which causes approximately 10 s of delay. For
OrderReq-OrderRes, the value will be less than or equal to the block period (5 s), but the exact number will depend on when the EV makes the first request. If it is right before a block is sealed, it does not have to wait long and the contract can be executed immediately. On the other hand, if it is right after a block is sealed, it has to wait a full block period to have the contract executed.
PaymentReq-PaymentRes message pairs also include two smart contract executions, so the processing time here will be at least 10 s. However, as mentioned previously, the last function is called sequentially so each EV adds an extra 5 s. Therefore, for the first EV to finish charging/discharging, it should be exactly 10 (5 + 5 × 1) s, while for the fourth one (we have four EVs in total), it should be 25 (5 + 5 × 4) s. Therefore, the average is 17.5 s, which is what we see in
Figure 14b. Finally, the
EnergyExchangeReq-EnergyExchangeRes processsing time is approximately 200 ms, as already explained earlier.
Figure 15 presents the data transmission and processing times for messages between the CS and the CSMS. As we see in
Figure 15a, the values here are negligible as all of them are less than a millisecond. On the other hand, for
Figure 15b, the first two involve the CSMS server retrieving logs and data from the blockchain and then signing them. Therefore, they are in the range of milliseconds. Also, as the
PaymentVerifyReq-PaymentVerifyReq includes a contract execution, it needs at least a block period (5 s) worth of time.
In
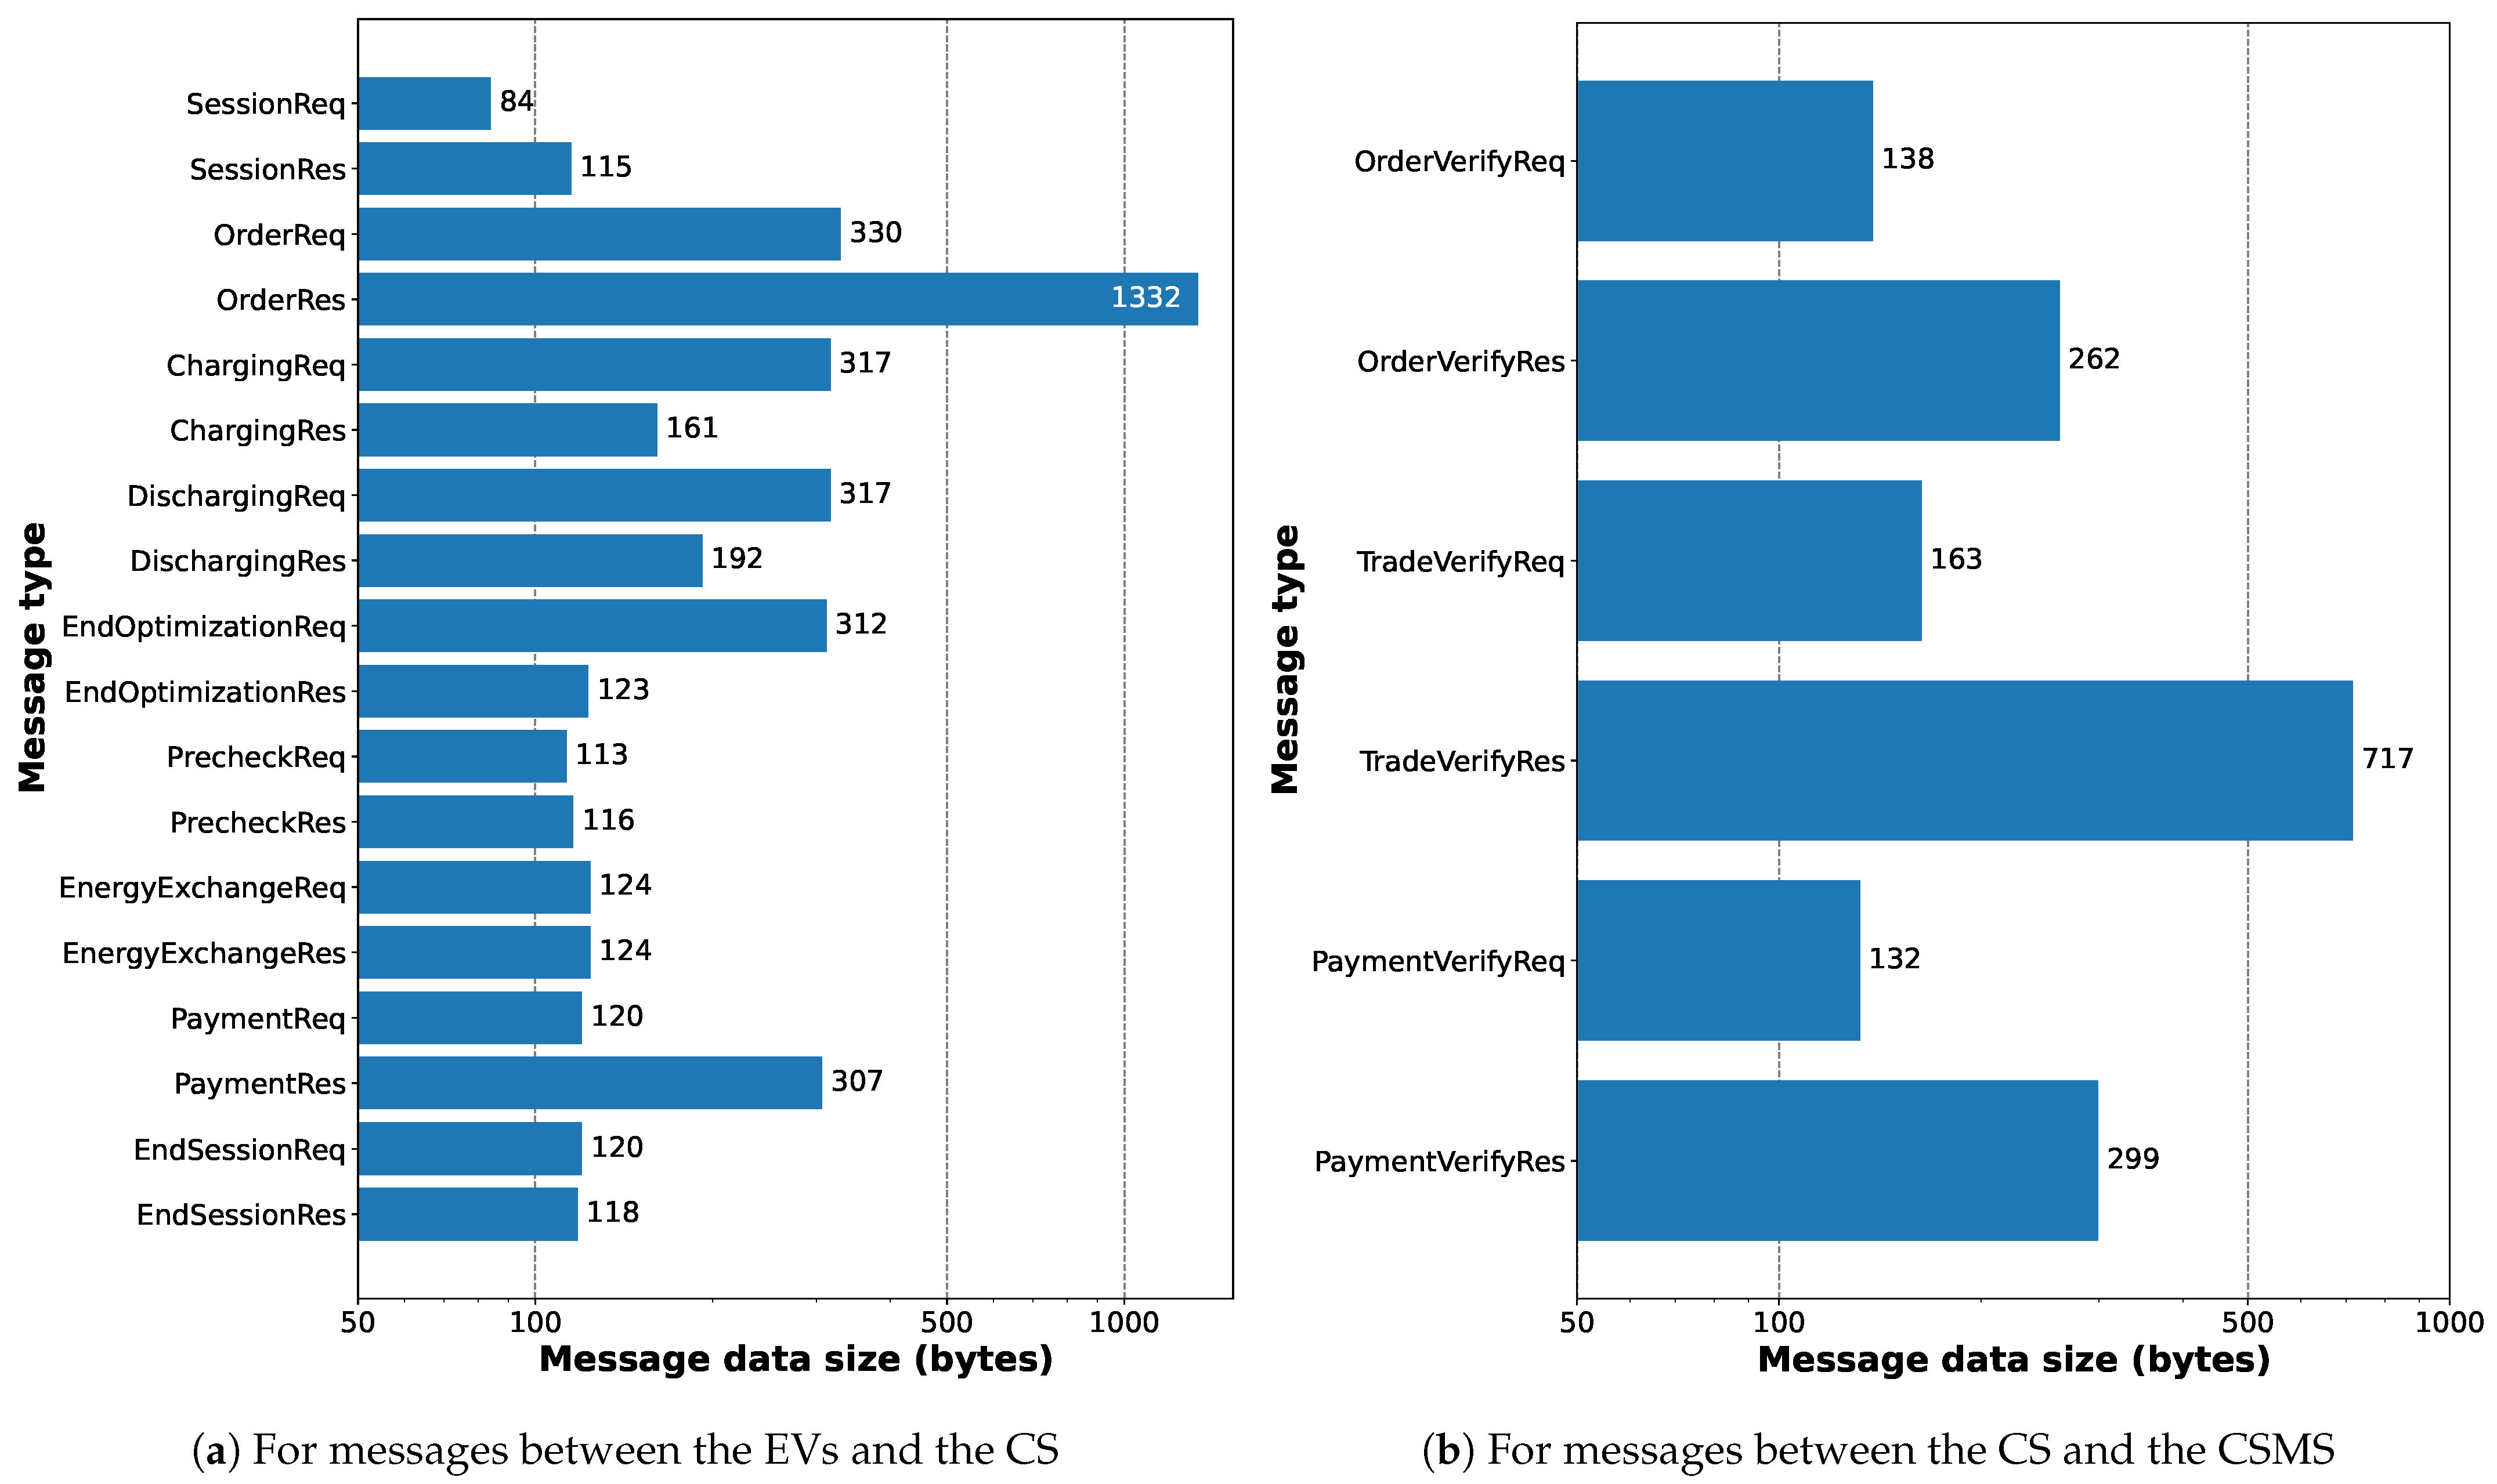
Figure 16, we illustrate the message data sizes for messages between various entities. In
Figure 16a, we see that the OrderRes message has the highest data size as it includes the CSMS server’s certificate. All of these values will make sense if compared with the message definitions described in
Section 5.4. We did not round off the values of various numbers that are sent between the entities, as while doing so would reduce the data size, it would not be that significant. Also, most of the messages are between the EVs and the CS using a direct, local connection. In
Figure 16b, the highest data size is for the
TradeVerifyReq message as it includes separate signatures for each of the EVs.
Finally,
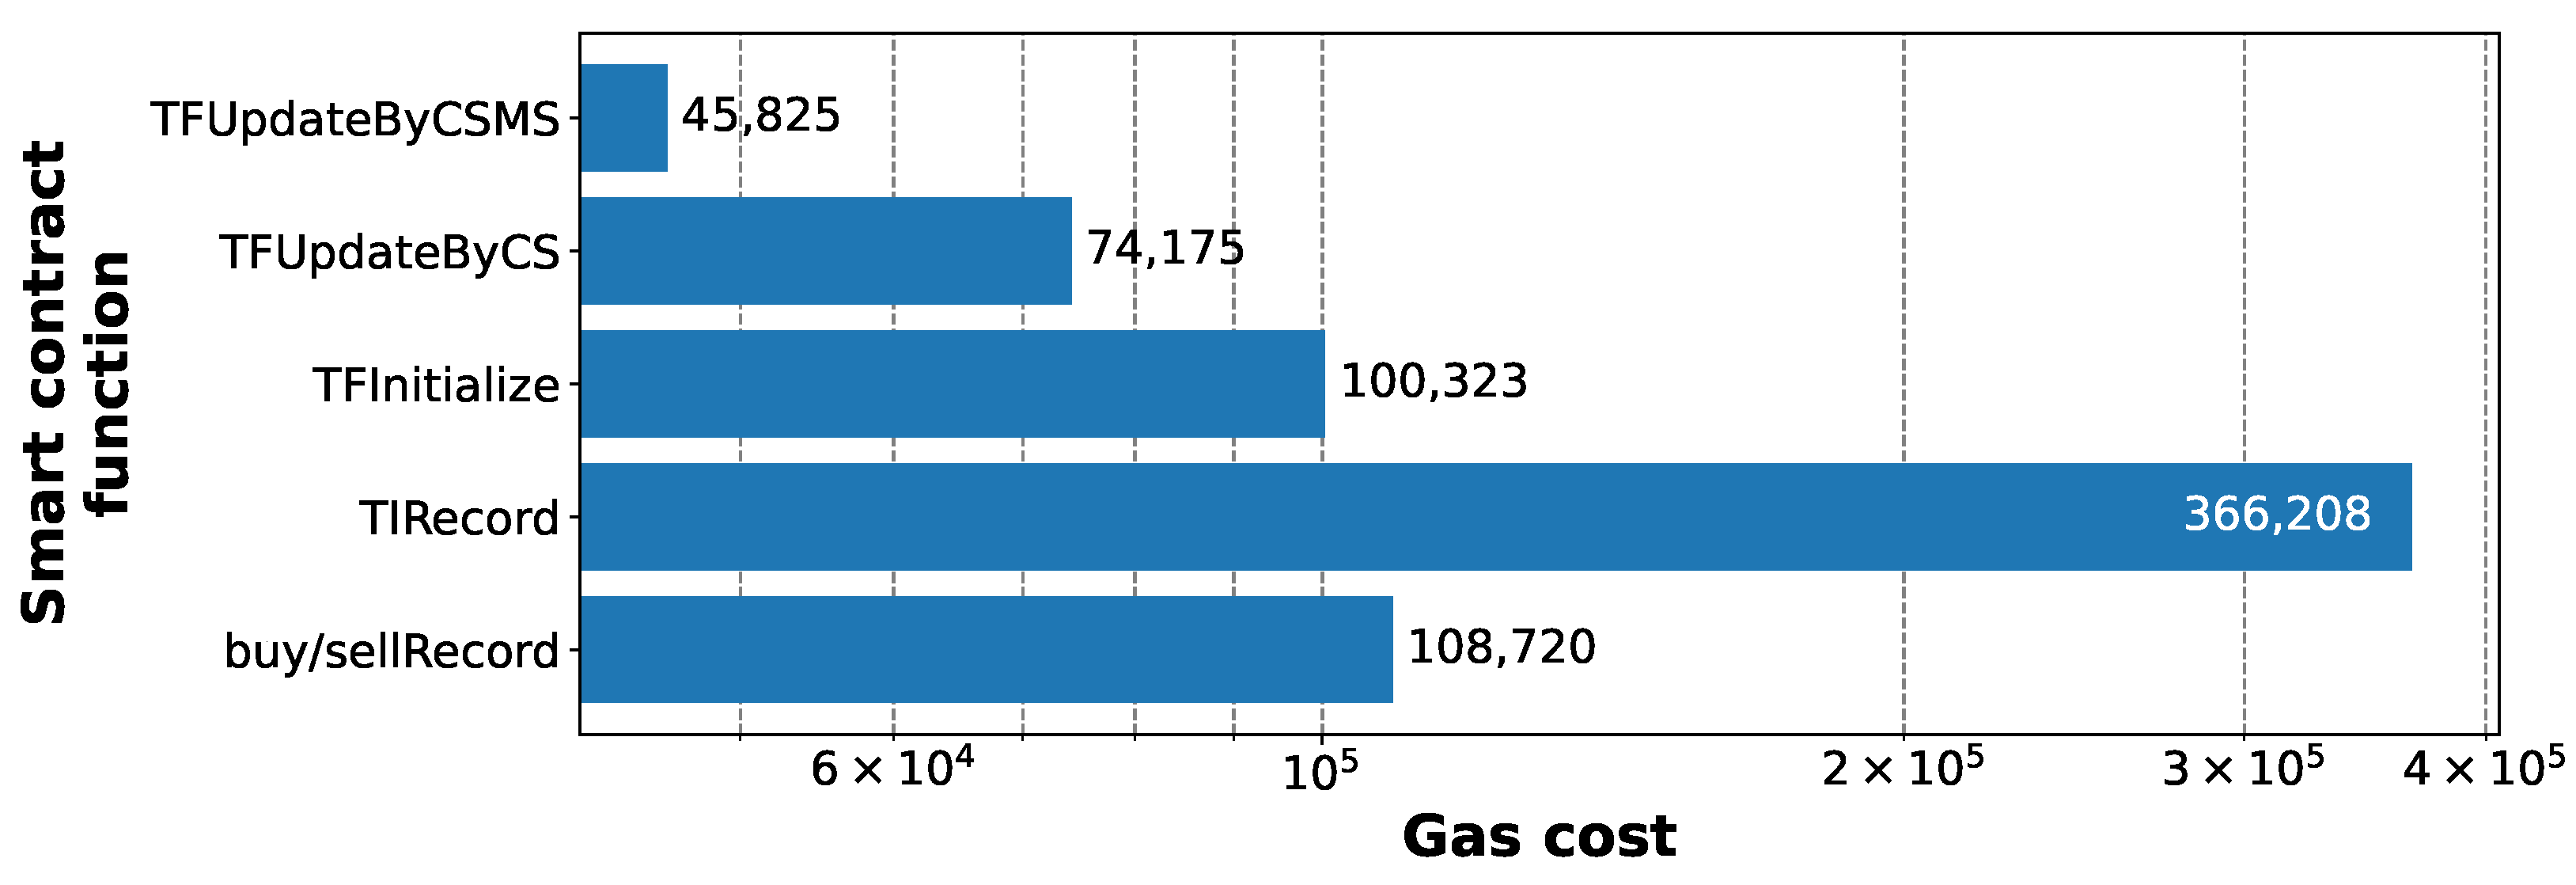
Figure 17 shows the gas cost to execute the smart contract functions given in Algorithms 1–3. The smart contract function TIRecord (Algorithm 2) has the highest gas cost as it has the largest amount of data to be recorded in the blockchain. However, it is also executed only once per energy exchange session while the others are executed per vehicle basis. Considering this, the buy/sellRecord functions are actually the most expensive ones.
8.5. Scalability of the Protocol
Here, we test the protocol with different numbers of CEVs and DEVs. Only the metrics that change significantly with the number of CEVs and DEVs are presented here.
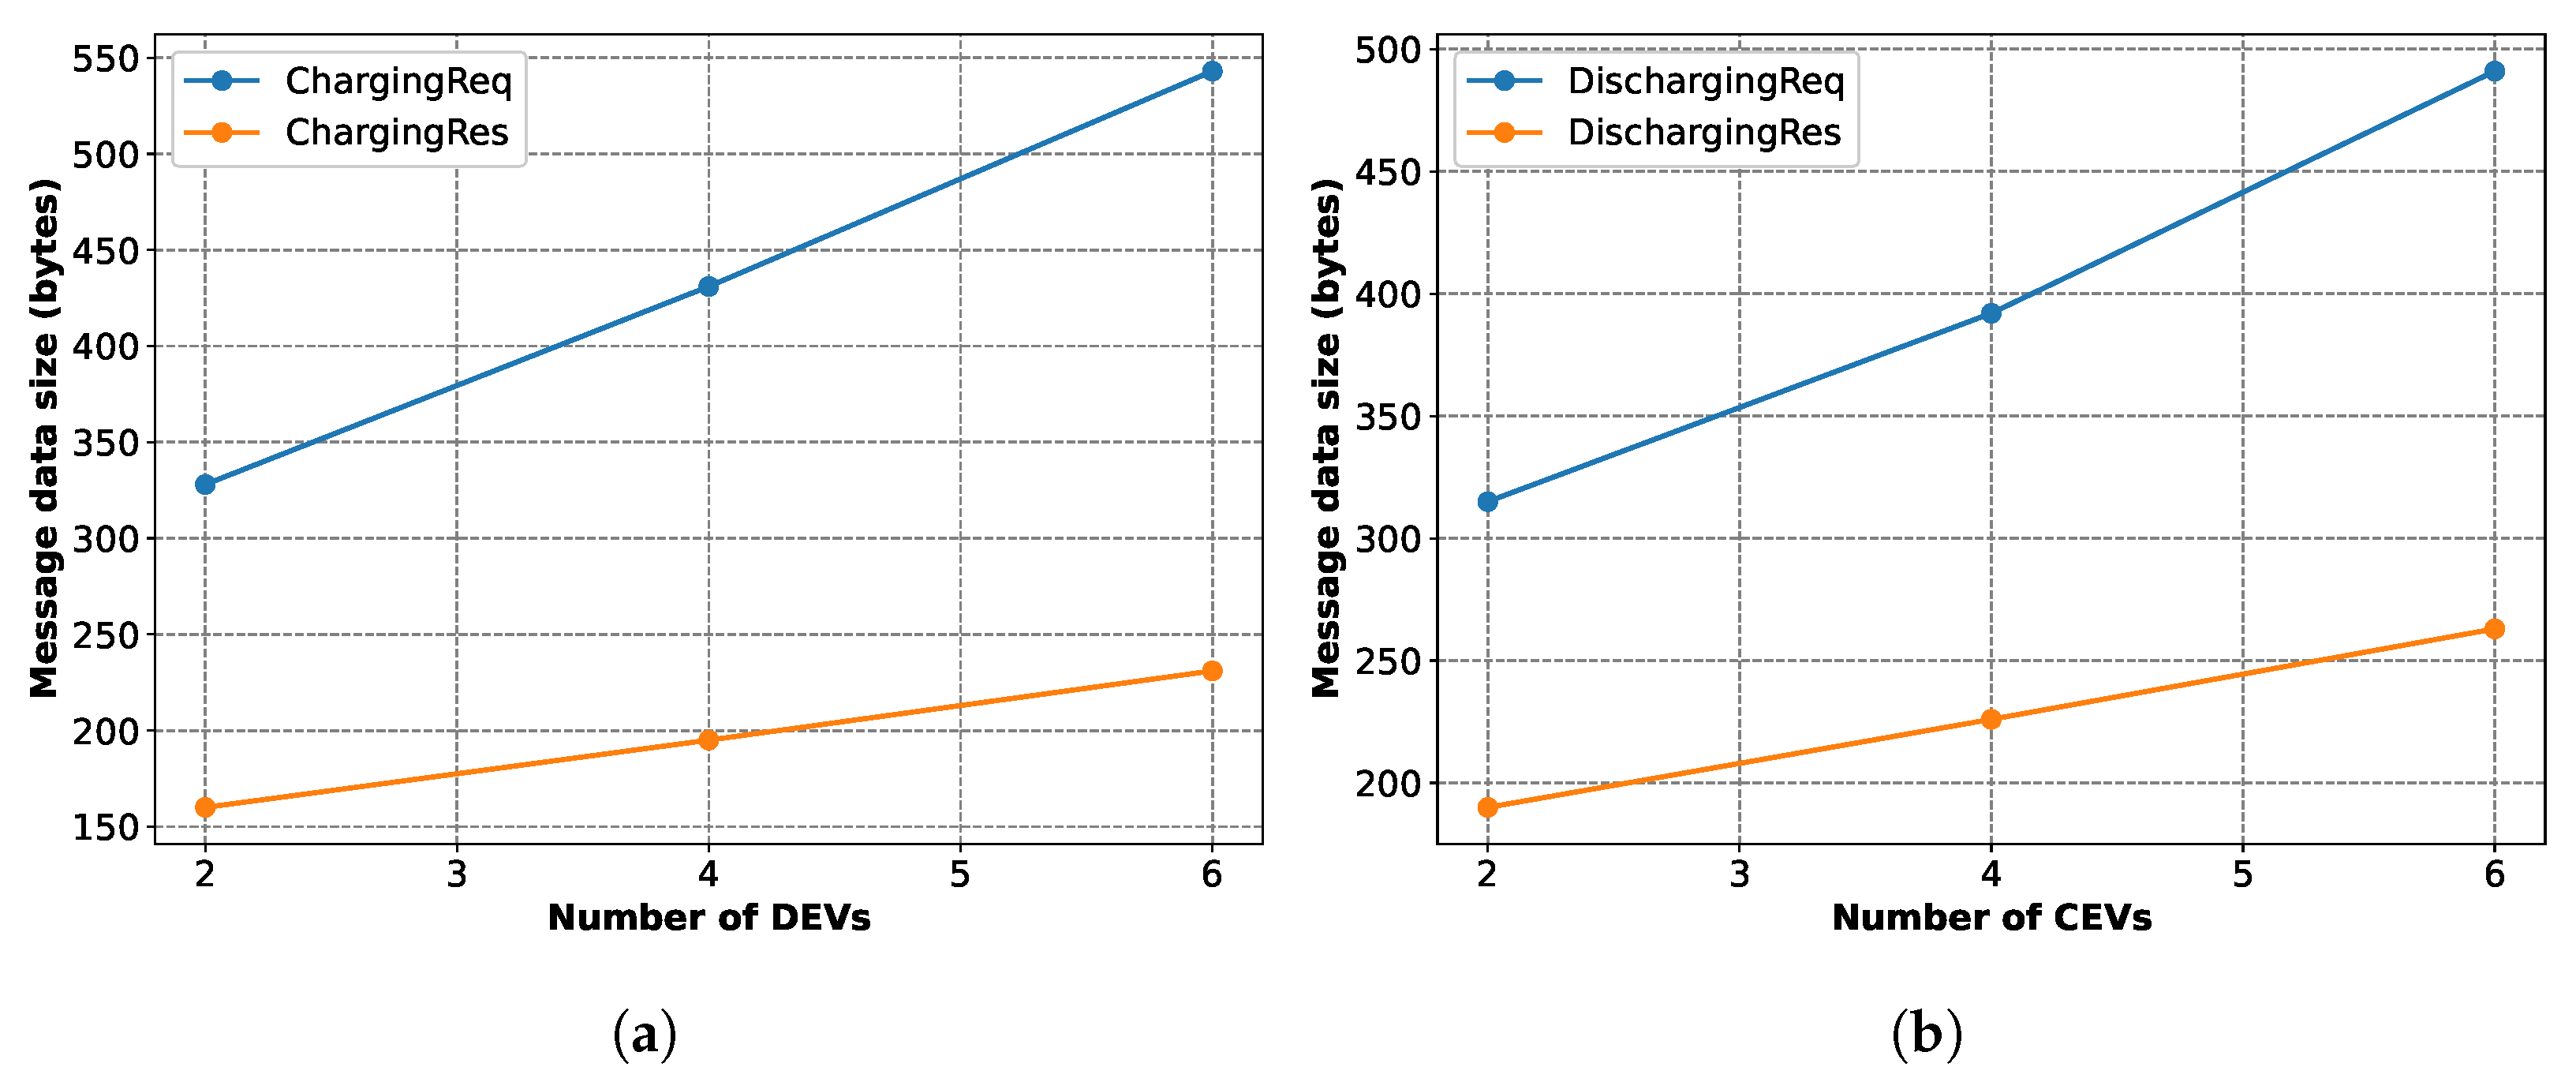
Figure 18 illustrates the data size variations for a few messages. The
ChargingReq and
ChargingRes messages have increased data size with an increased number of DEVs, as shown in
Figure 18a, because each of these messages contains the supplies and prices of each DEV. For the same reason, The
DischargingReq and
DischargingRes messages have an increased data size with an increased number of CEVs, as shown in
Figure 18b.
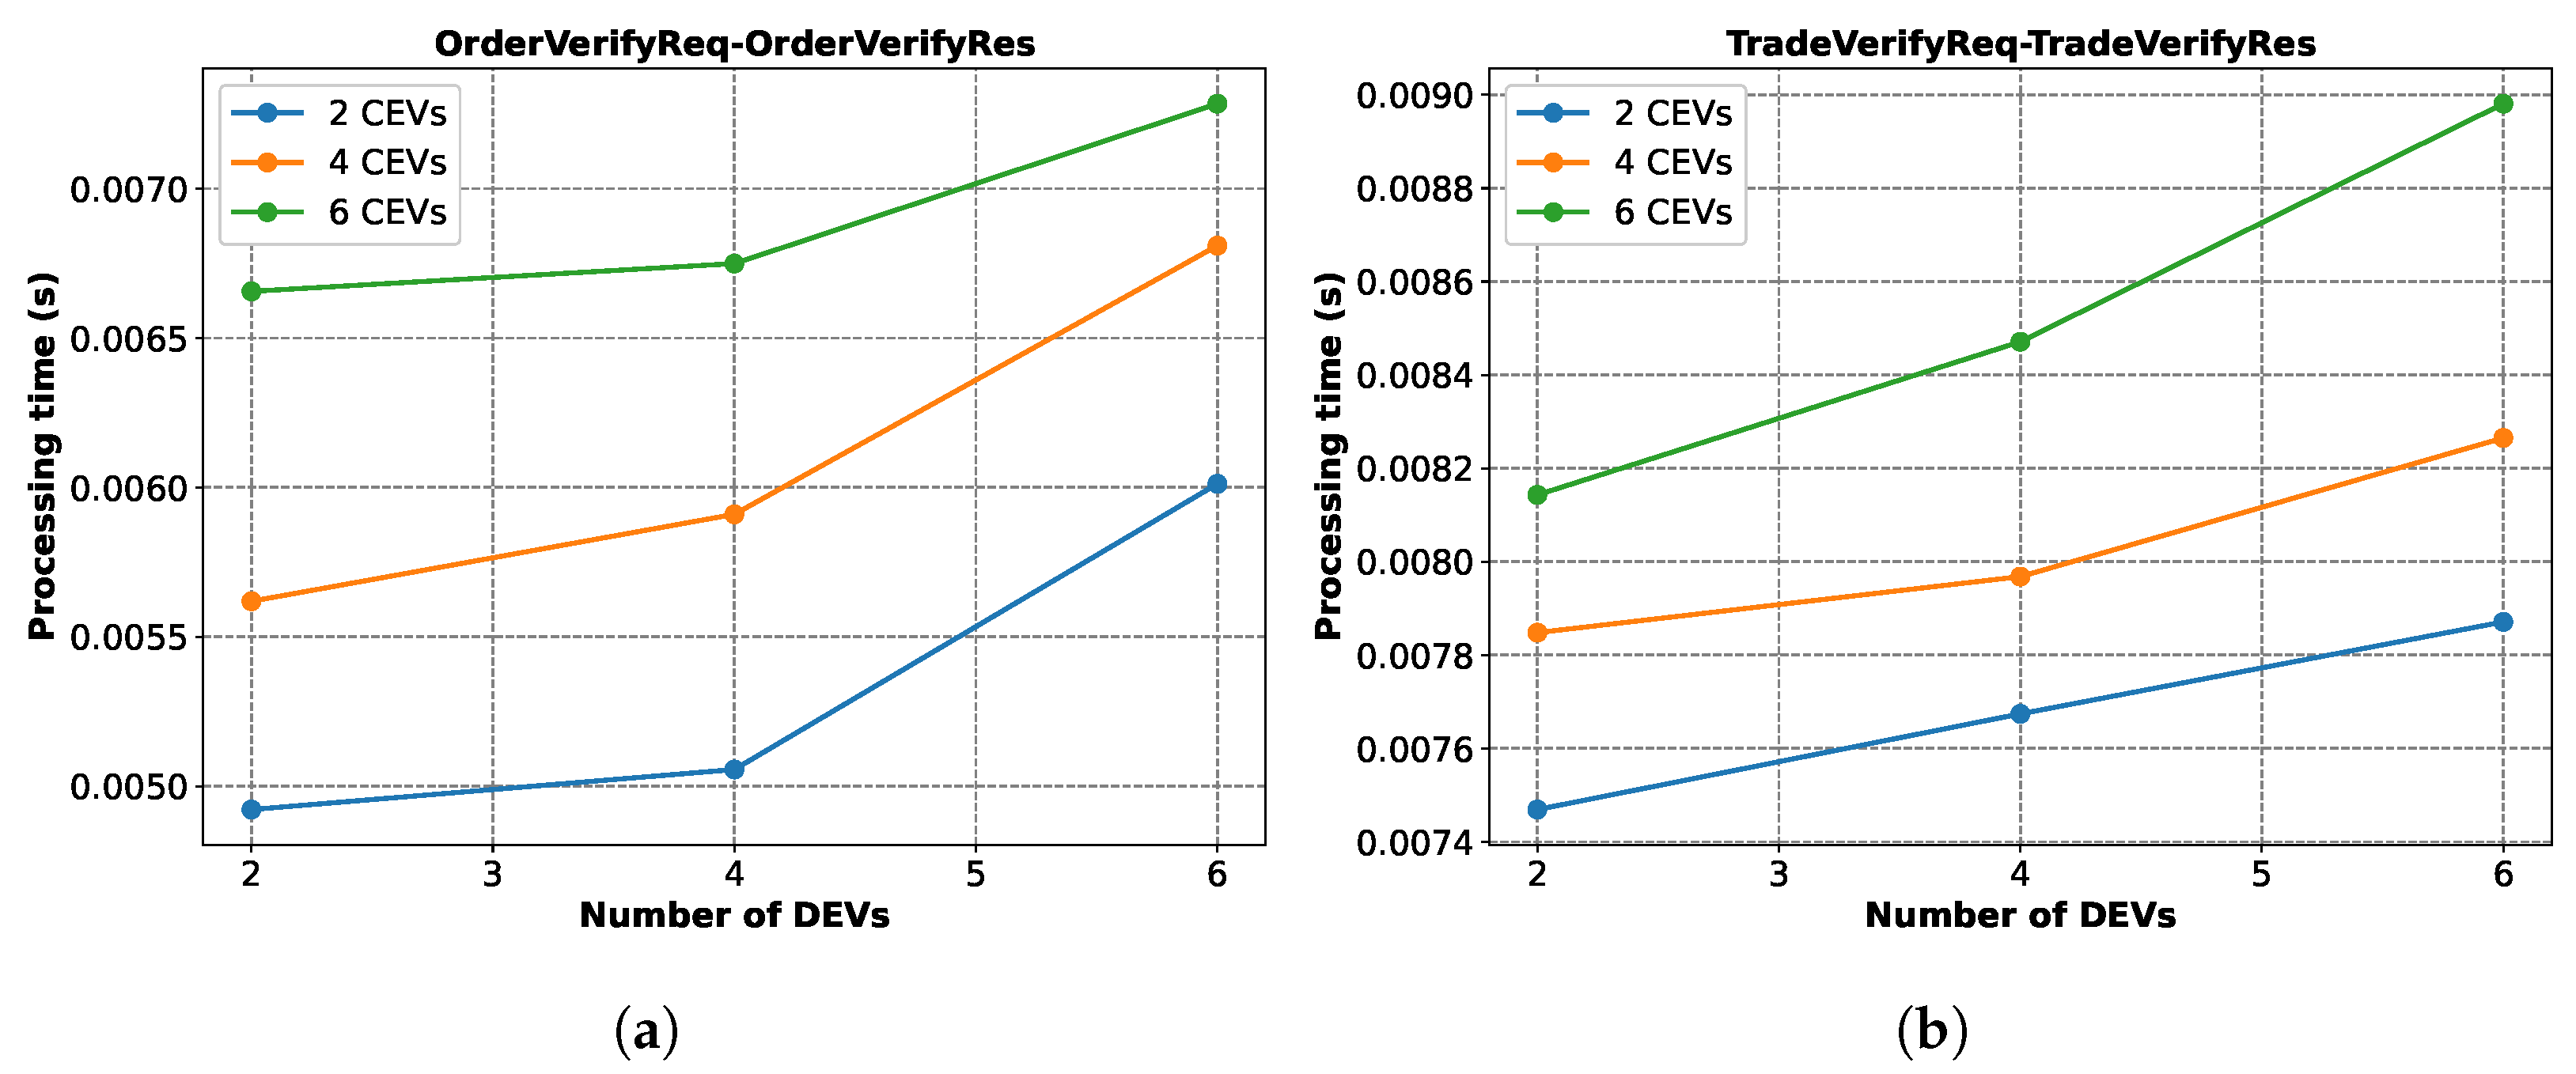
Figure 19 shows the message processing time variations for a few message pairs. In
Figure 19a, we observe that the CSMS takes more time to process the
OrderVerifyReq and generate the
OrderVerifyRes messages as the number of CEVs and DEVs increase.
Figure 19b shows the same thing for the
TradeVerifyRes-TradeVerifyRes pairs. This is due to the fact that the CSMS has to generate more signatures when there are more EVs.
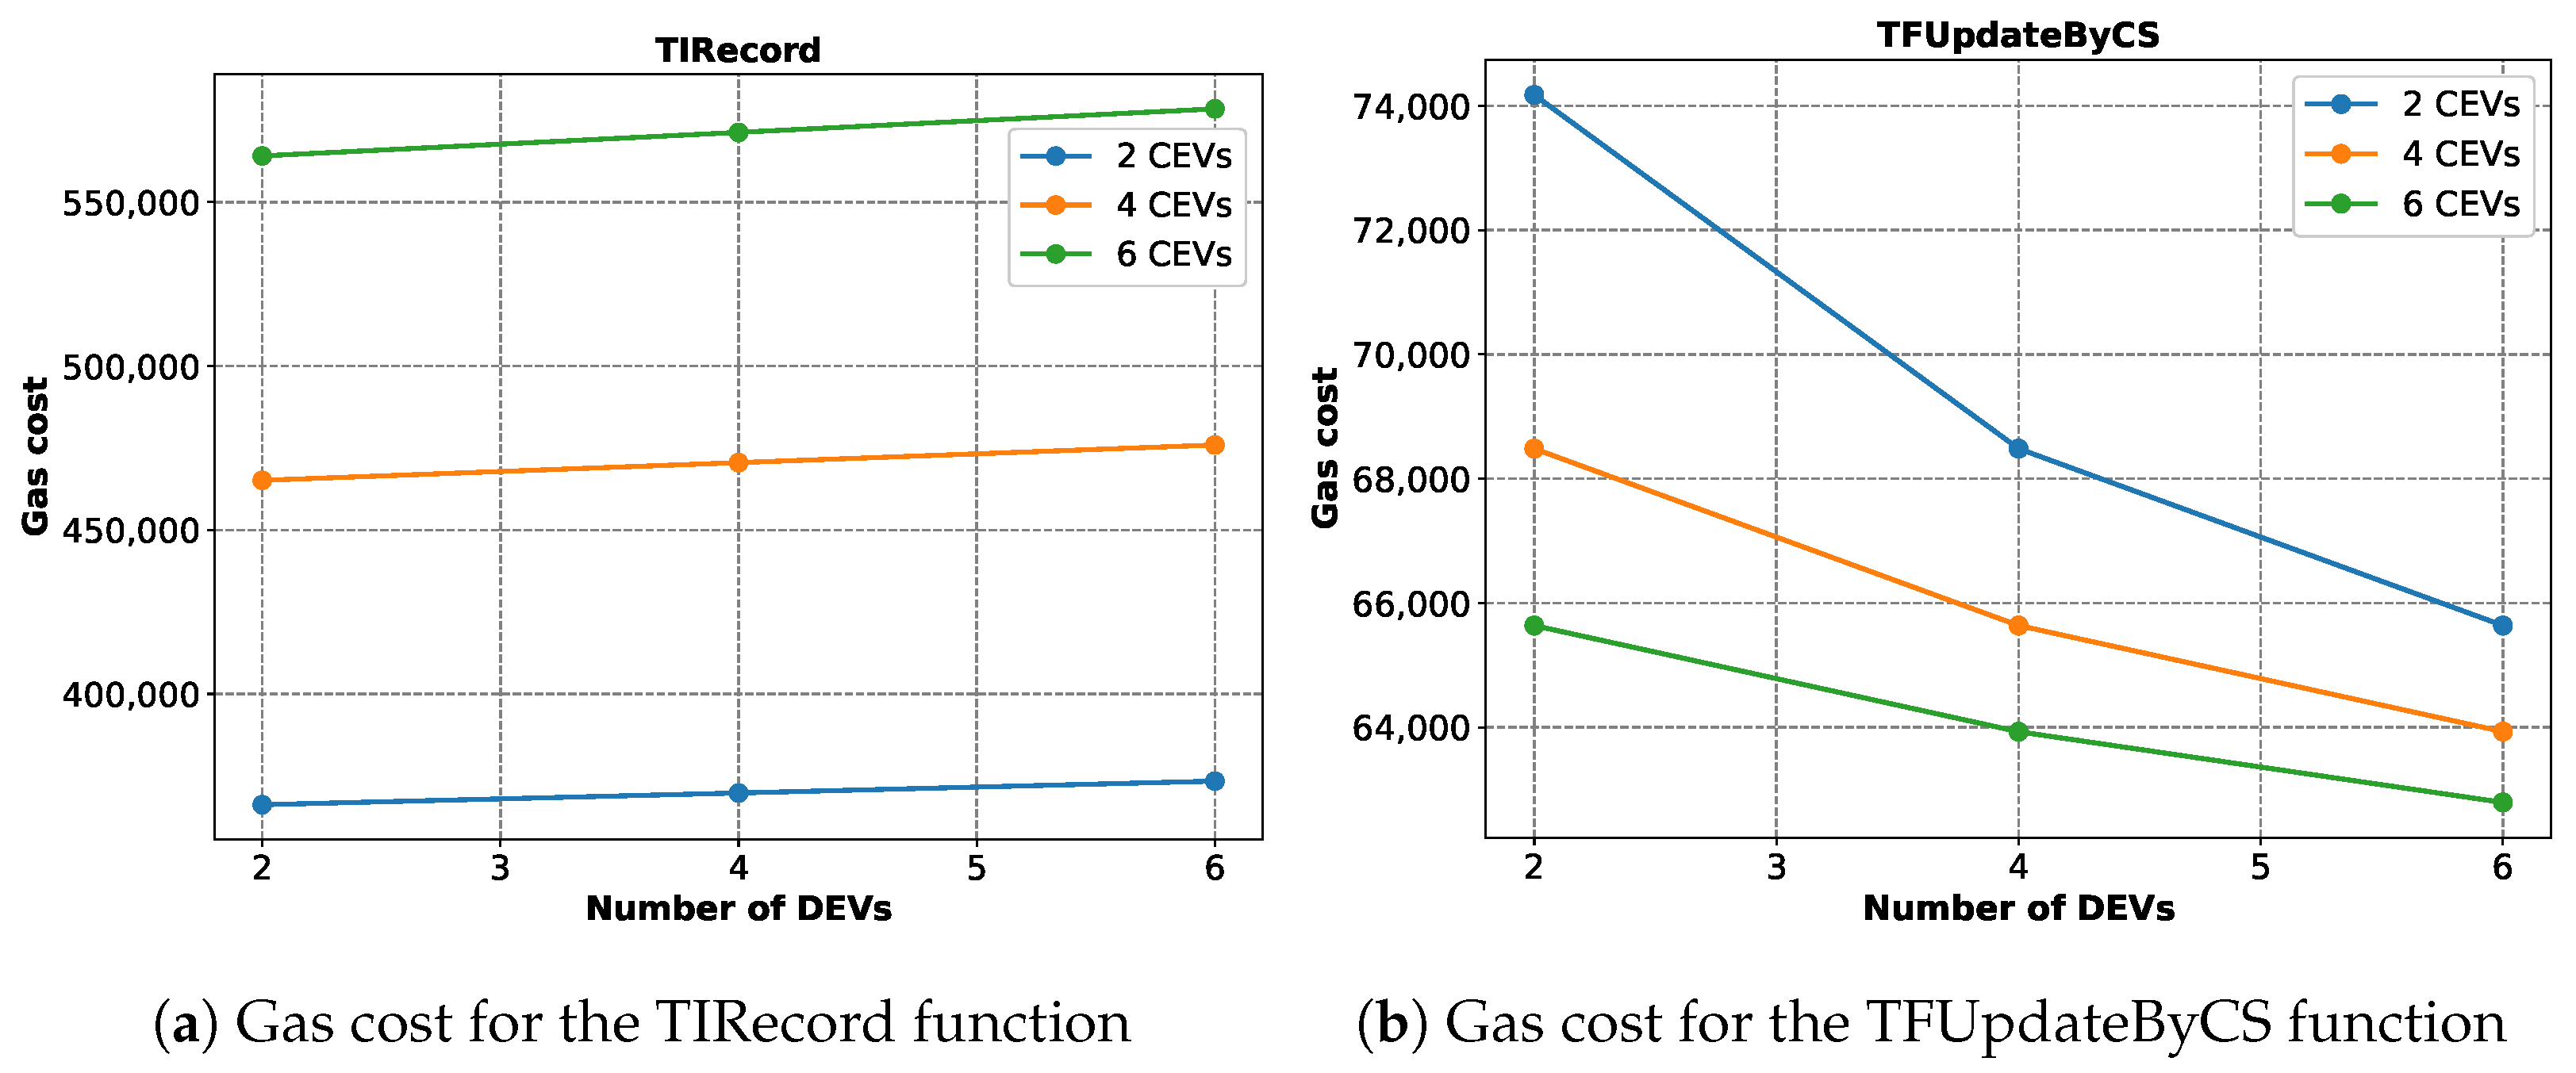
Figure 20 presents how the gas cost varies when executing a few smart contract functions.
Figure 20a shows that the gas cost to execute the TIRecord (Algorithm 2) function increases for an increasing number of CEVs and DEVs. However, the jump is much larger in the case of the CEVs compared to the DEVs. This is due to the nature of Solidity. In Solidity, adding a new element to an array with at least one element costs much less than adding an element for the first time to an array. In our implementation of TIRecord, the demands for the CEVs are placed along the rows of a 2D array, while the columns represent demands from each DEV. Therefore, increasing the number of DEVs means adding additional elements to some non-empty rows, while increasing the number of CEVs means creating and then adding elements to the newly created empty rows. This is why increasing the number of CEVs is more expensive. In
Figure 20b, the same thing is shown for the smart contract function TFUpdatebyCS (Algorithm 3). Here, the average gas cost decreases with the increasing number of CEVs and DEVs due to a very similar reason. We initialized the arrays to hold the CEV and DEV IDs as empty arrays. When the first EV ID is pushed to the array, it costs more, while the subsequent pushes cost less. This is why the average cost decreases with additional elements.
Lastly, in
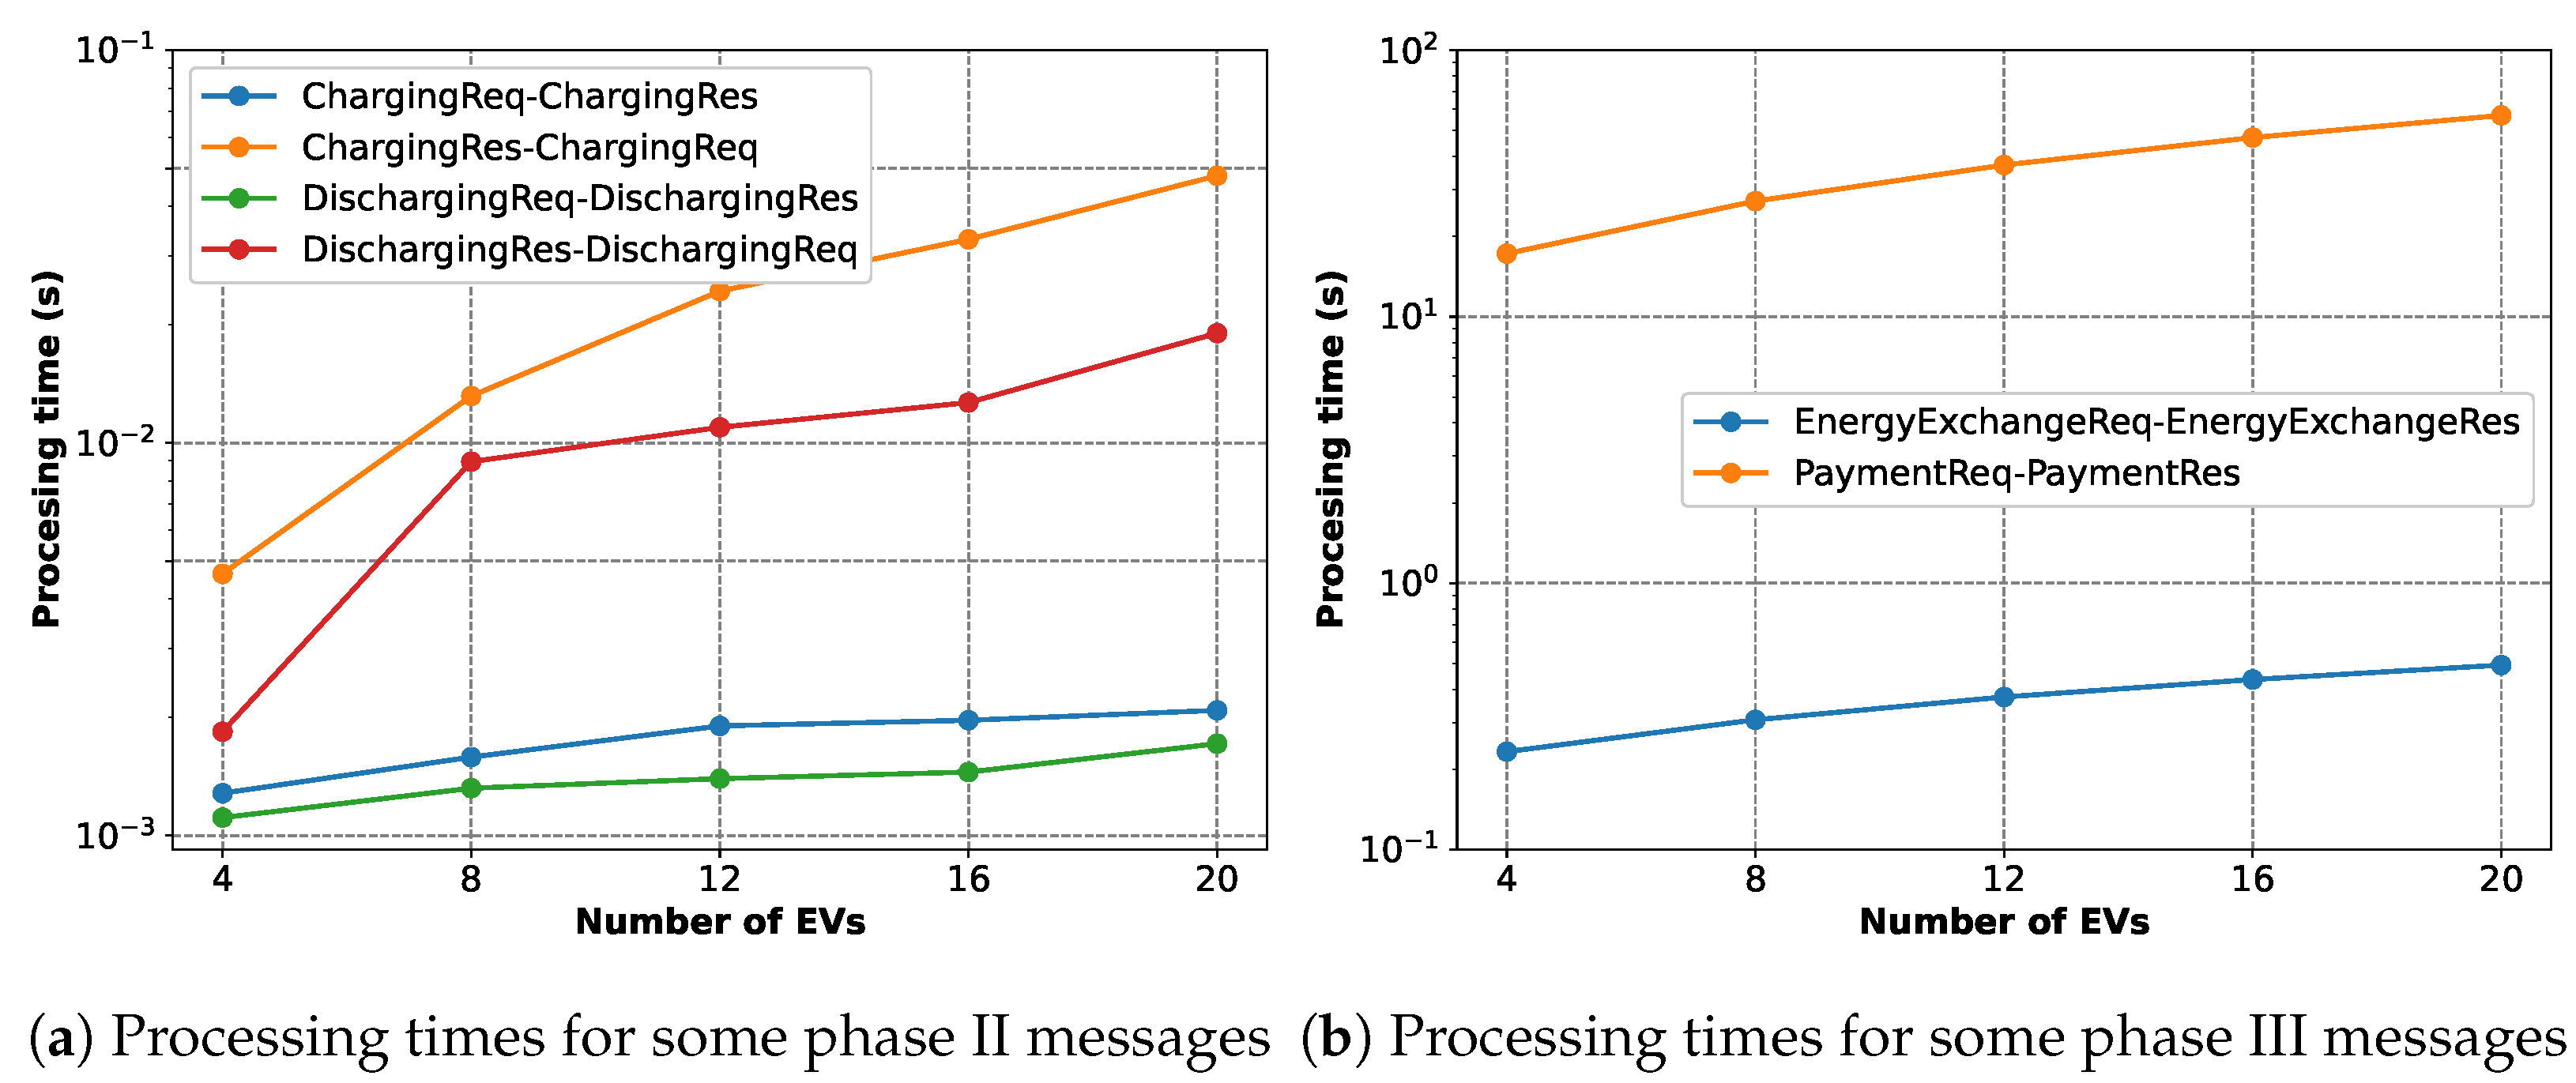
Figure 21, we present how some message processing times compare to each other with varying numbers of EVs (equal numbers of CEVs and DEVs).
Figure 21a shows that all of the four processing times increase with the increasing number of EVs. The
ChargingReq-ChargingRes and
DischargingReq-DischargingRes pairs actually represent a single iteration of optimization for the charging EVs and the discharging EVs, respectively. Therefore, the charging EVs take a longer time to perform the optimization than the discharging EVs. The
ChargingRes-ChargingReq and
DischargingRes-DischargingReq pairs, on the other hand, represent the time an EV spends waiting for others to finish their optimization, which is, as expected, significantly higher than the time it spends for its own optimization.
Figure 21b shows that the
EnergyExchangeReq-EnergyExchangeRes pairs need more time as the number of EVs increases because of the increased amount of traded energy. Also, the
PaymentReq-PaymentRes pairs, similarly, take more time as the final smart contract function is executed sequentially into consecutive blocks for each EV.
8.6. Scalability of the Blockchain
As blockchain plays a key role in our proposed V2V energy-trading protocol, we examined how its performance changes with increasing numbers of nodes and workload. In our experiments, we generate the workload (transactions from smart contract executions) using the signers only. This is due to the fact that the CSs play the role of signers in our system and they mainly call the smart contract functions, thus generating the transactions. Each signer node has a fixed number of workloads or transactions to be sent. Each node continues to generate and submit transactions until that fixed number is reached. To make the experiment simple, we only execute the buy/sellRecord function (Algorithm 1) that has the highest gas cost, as mentioned previously. Unless mentioned, we use a block period of 1 s and block gas limit of 1 billion. We used a few metrics to measure the performance. They are as follows:
Transaction submission rate: It describes how fast a node can submit transactions (or execute smart contract functions). Its unit is transactions per second, or tx/sec.
Transaction throughput: It presents how fast the blockchain can record submitted transactions to a block and seal it. For example, if the block period is 5 s and each block contains approximately 500 transactions, the transaction throughput is 100 tx/sec.
Transaction latency: It is the time spent between submitting a transaction and having that transaction verified and included in a block.
Average number of queued transactions: When a transaction is submitted, it is verified and added to a pending list, if its nonce is in order. For example, the very first transaction submitted from an address will have a nonce of 0. For each subsequent transaction, the nonce will be increased by 1. If transactions with a nonce of 0, 1, and 2 are in the pending list and a new transaction with a nonce of 4 is submitted, it will not be put into the pending list as the expected transaction in order should have a nonce of 3. Therefore, it will be added to a different list call queue. When the transaction with nonce 3 arrives, it will be placed on the pending list and then the transaction with nonce 4 will be taken out out the queue and be added to the pending list as well. Before a new block is sealed, the pending transactions are added to the block according to its capacity. The default maximum length of this pending list in Geth is 4096, but it can be modified. The default length of the queue is 64. If the number of queued transactions goes above this limit, the transaction will be lost and the Geth node can crash. Therefore, the average number of queued transaction is an important performance metric.
In
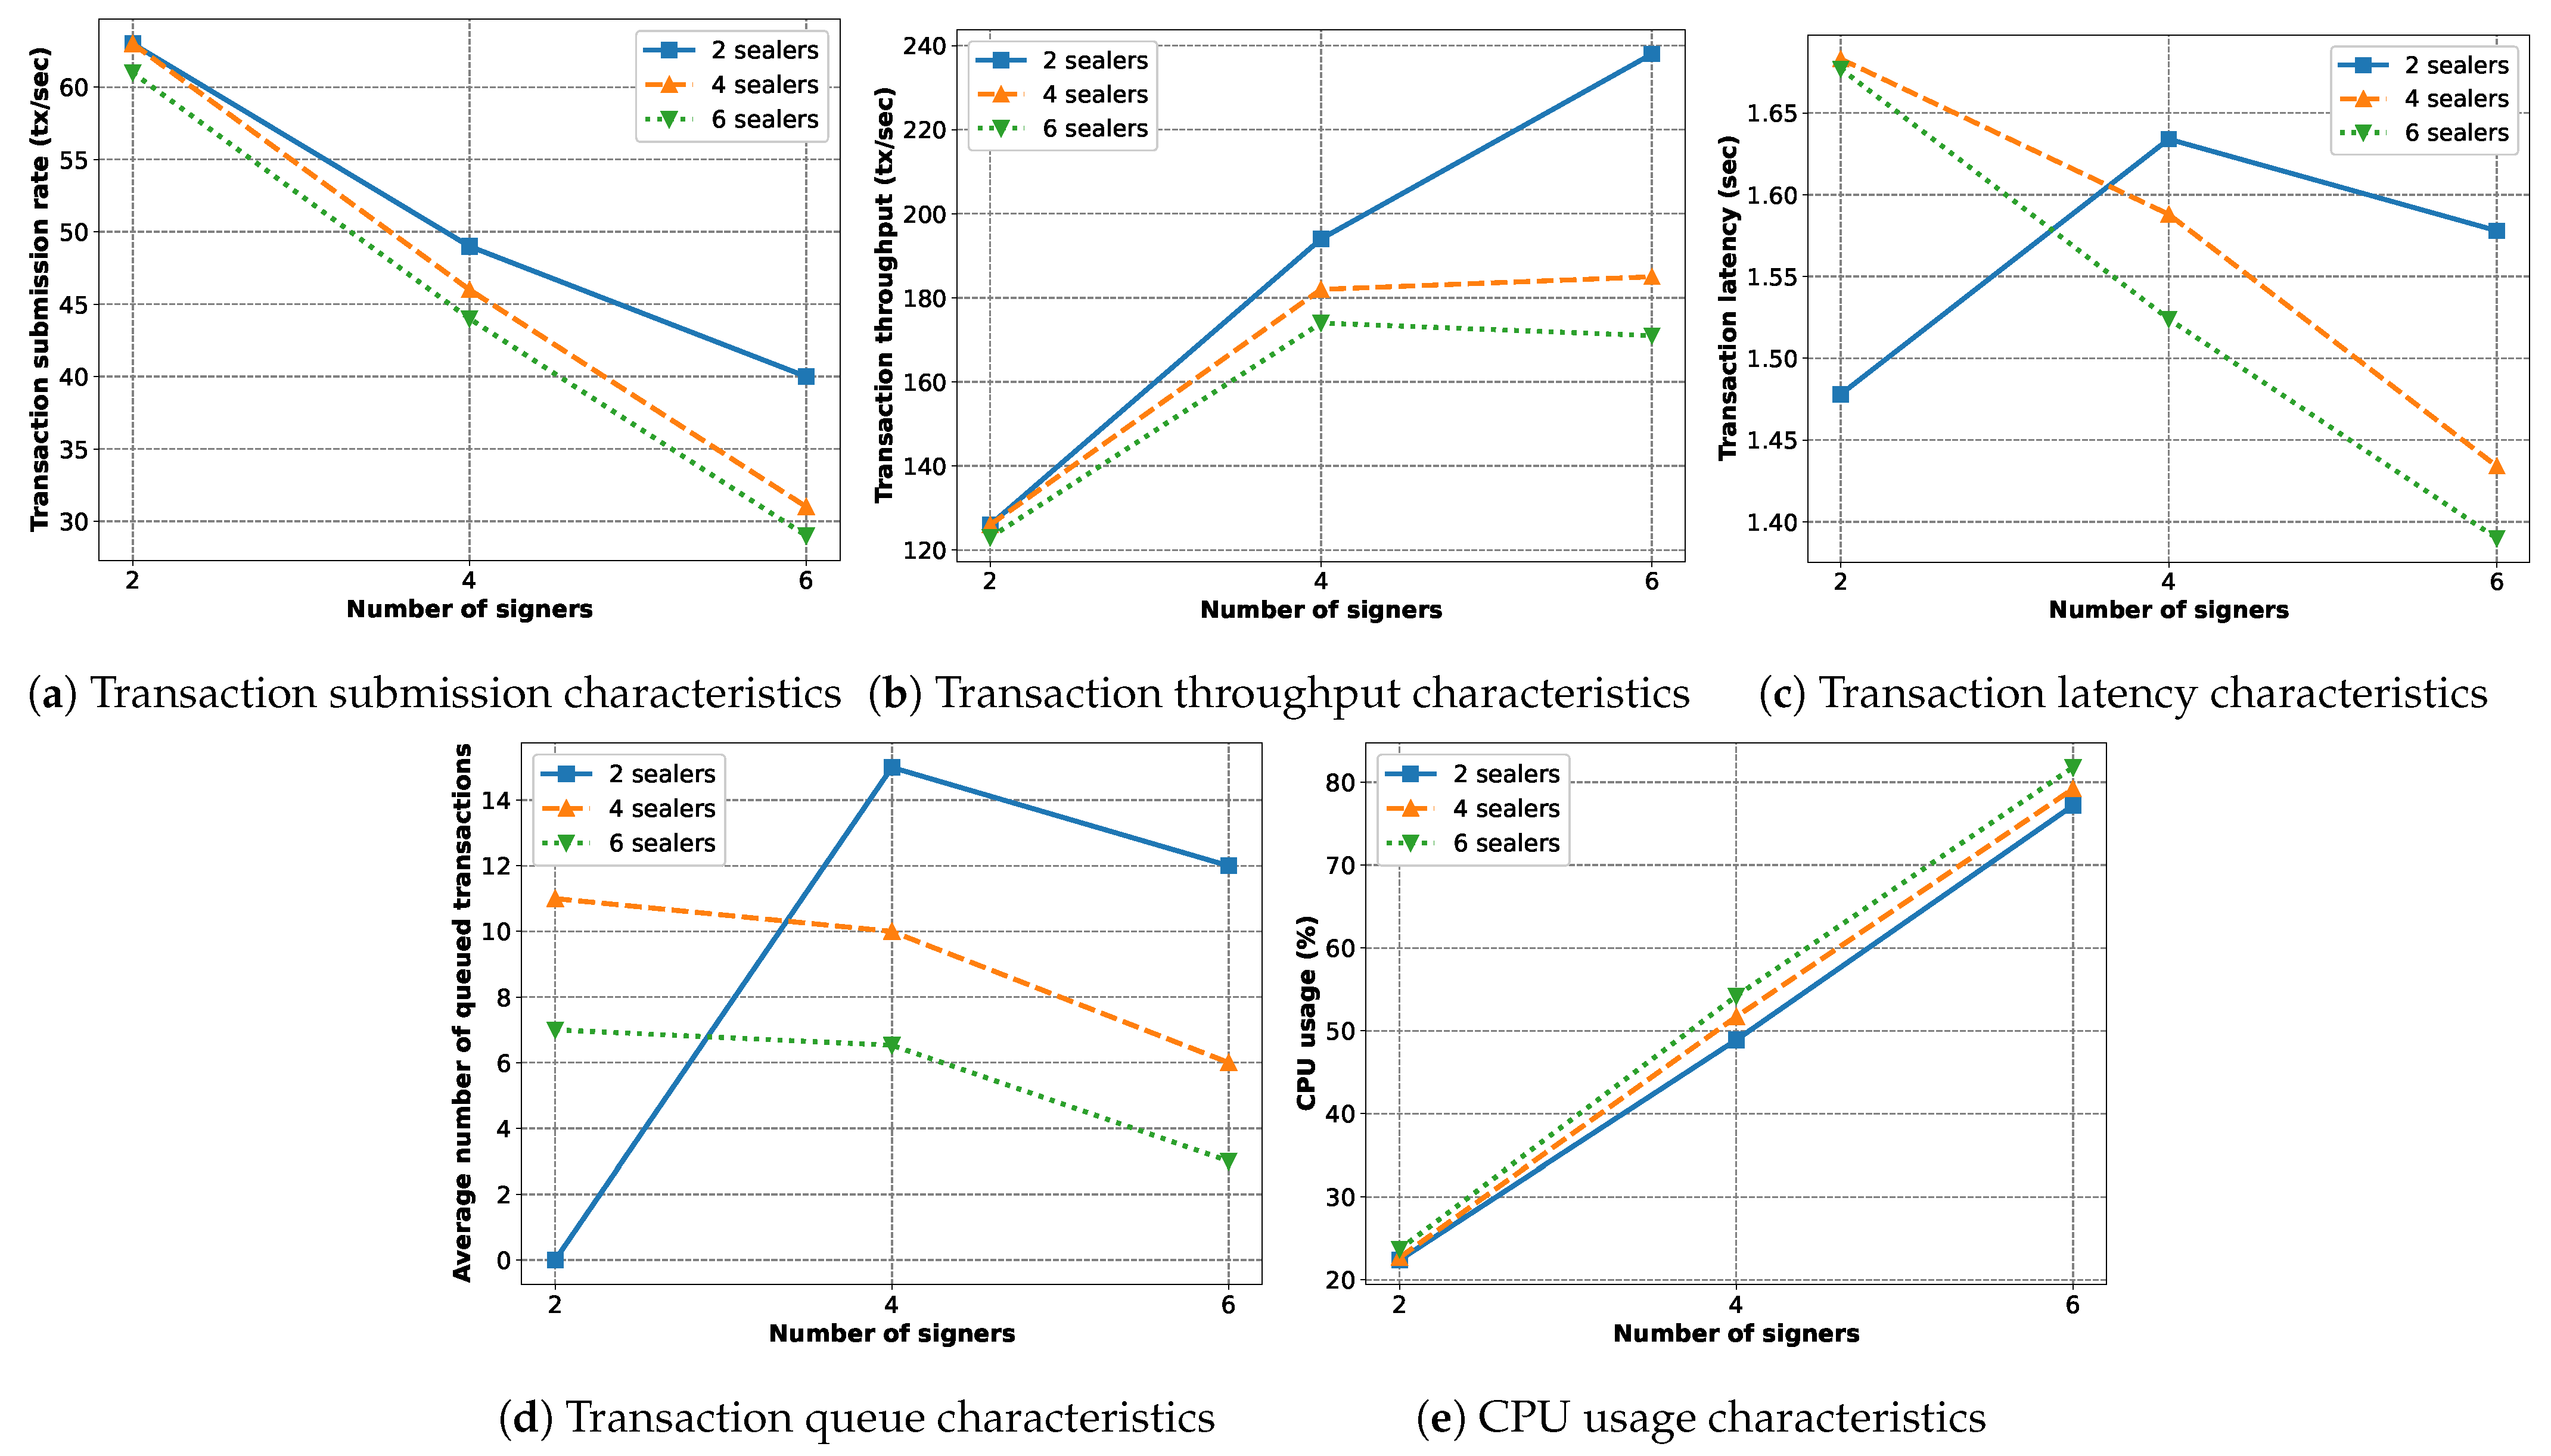
Figure 22 is shown the behavior the implemented blockchain with varying numbers of sealers (with active mining enabled) and signers (without mining). Here, the workload is 2500 transactions per signer.
Figure 22a shows that, with increasing numbers of signers (thus the total workload), the transaction submission rate decreases significantly. The number of sealers has a similar, but weaker, effect. Especially for the two-sealers case, we see that the rate of decrement is slower.
Figure 22b shows that the transaction throughput initially rises as more signers are added, but later, it slows down. For six sealers, it even starts to decrease. This is expected as, with more signers, the submission rate decreases while the total amount of submitted transactions increases. For even more signers, the submission rate decreases faster than the increment of total submissions. Thus, the throughput dips.
Figure 22c,d show that the transaction latency and the average number of queued transactions are correlated. The reason for this is that, when a transaction is stuck in the queue, it is not being processed, and this increases the latency. Therefore, more queued transactions results in more latency. The two-sealer and two-signer case seems to be exceptional, with a very low number of queued transactions and low latency. For other cases, with more sealers and signers, the queued transactions are split among their own transaction queues, thus lowering the average number of queued transactions and the latency. Finally,
Figure 22e shows why the transaction submission rate decreases with increased sealers and signers. We can clearly see that the CPU usage increases drastically with an increasing number of signers, while the effect of sealer nodes are much weaker. We do not show the results for 8 or 10 sealers as it is obvious that the CPU will hit its limit and will not perform properly.
In
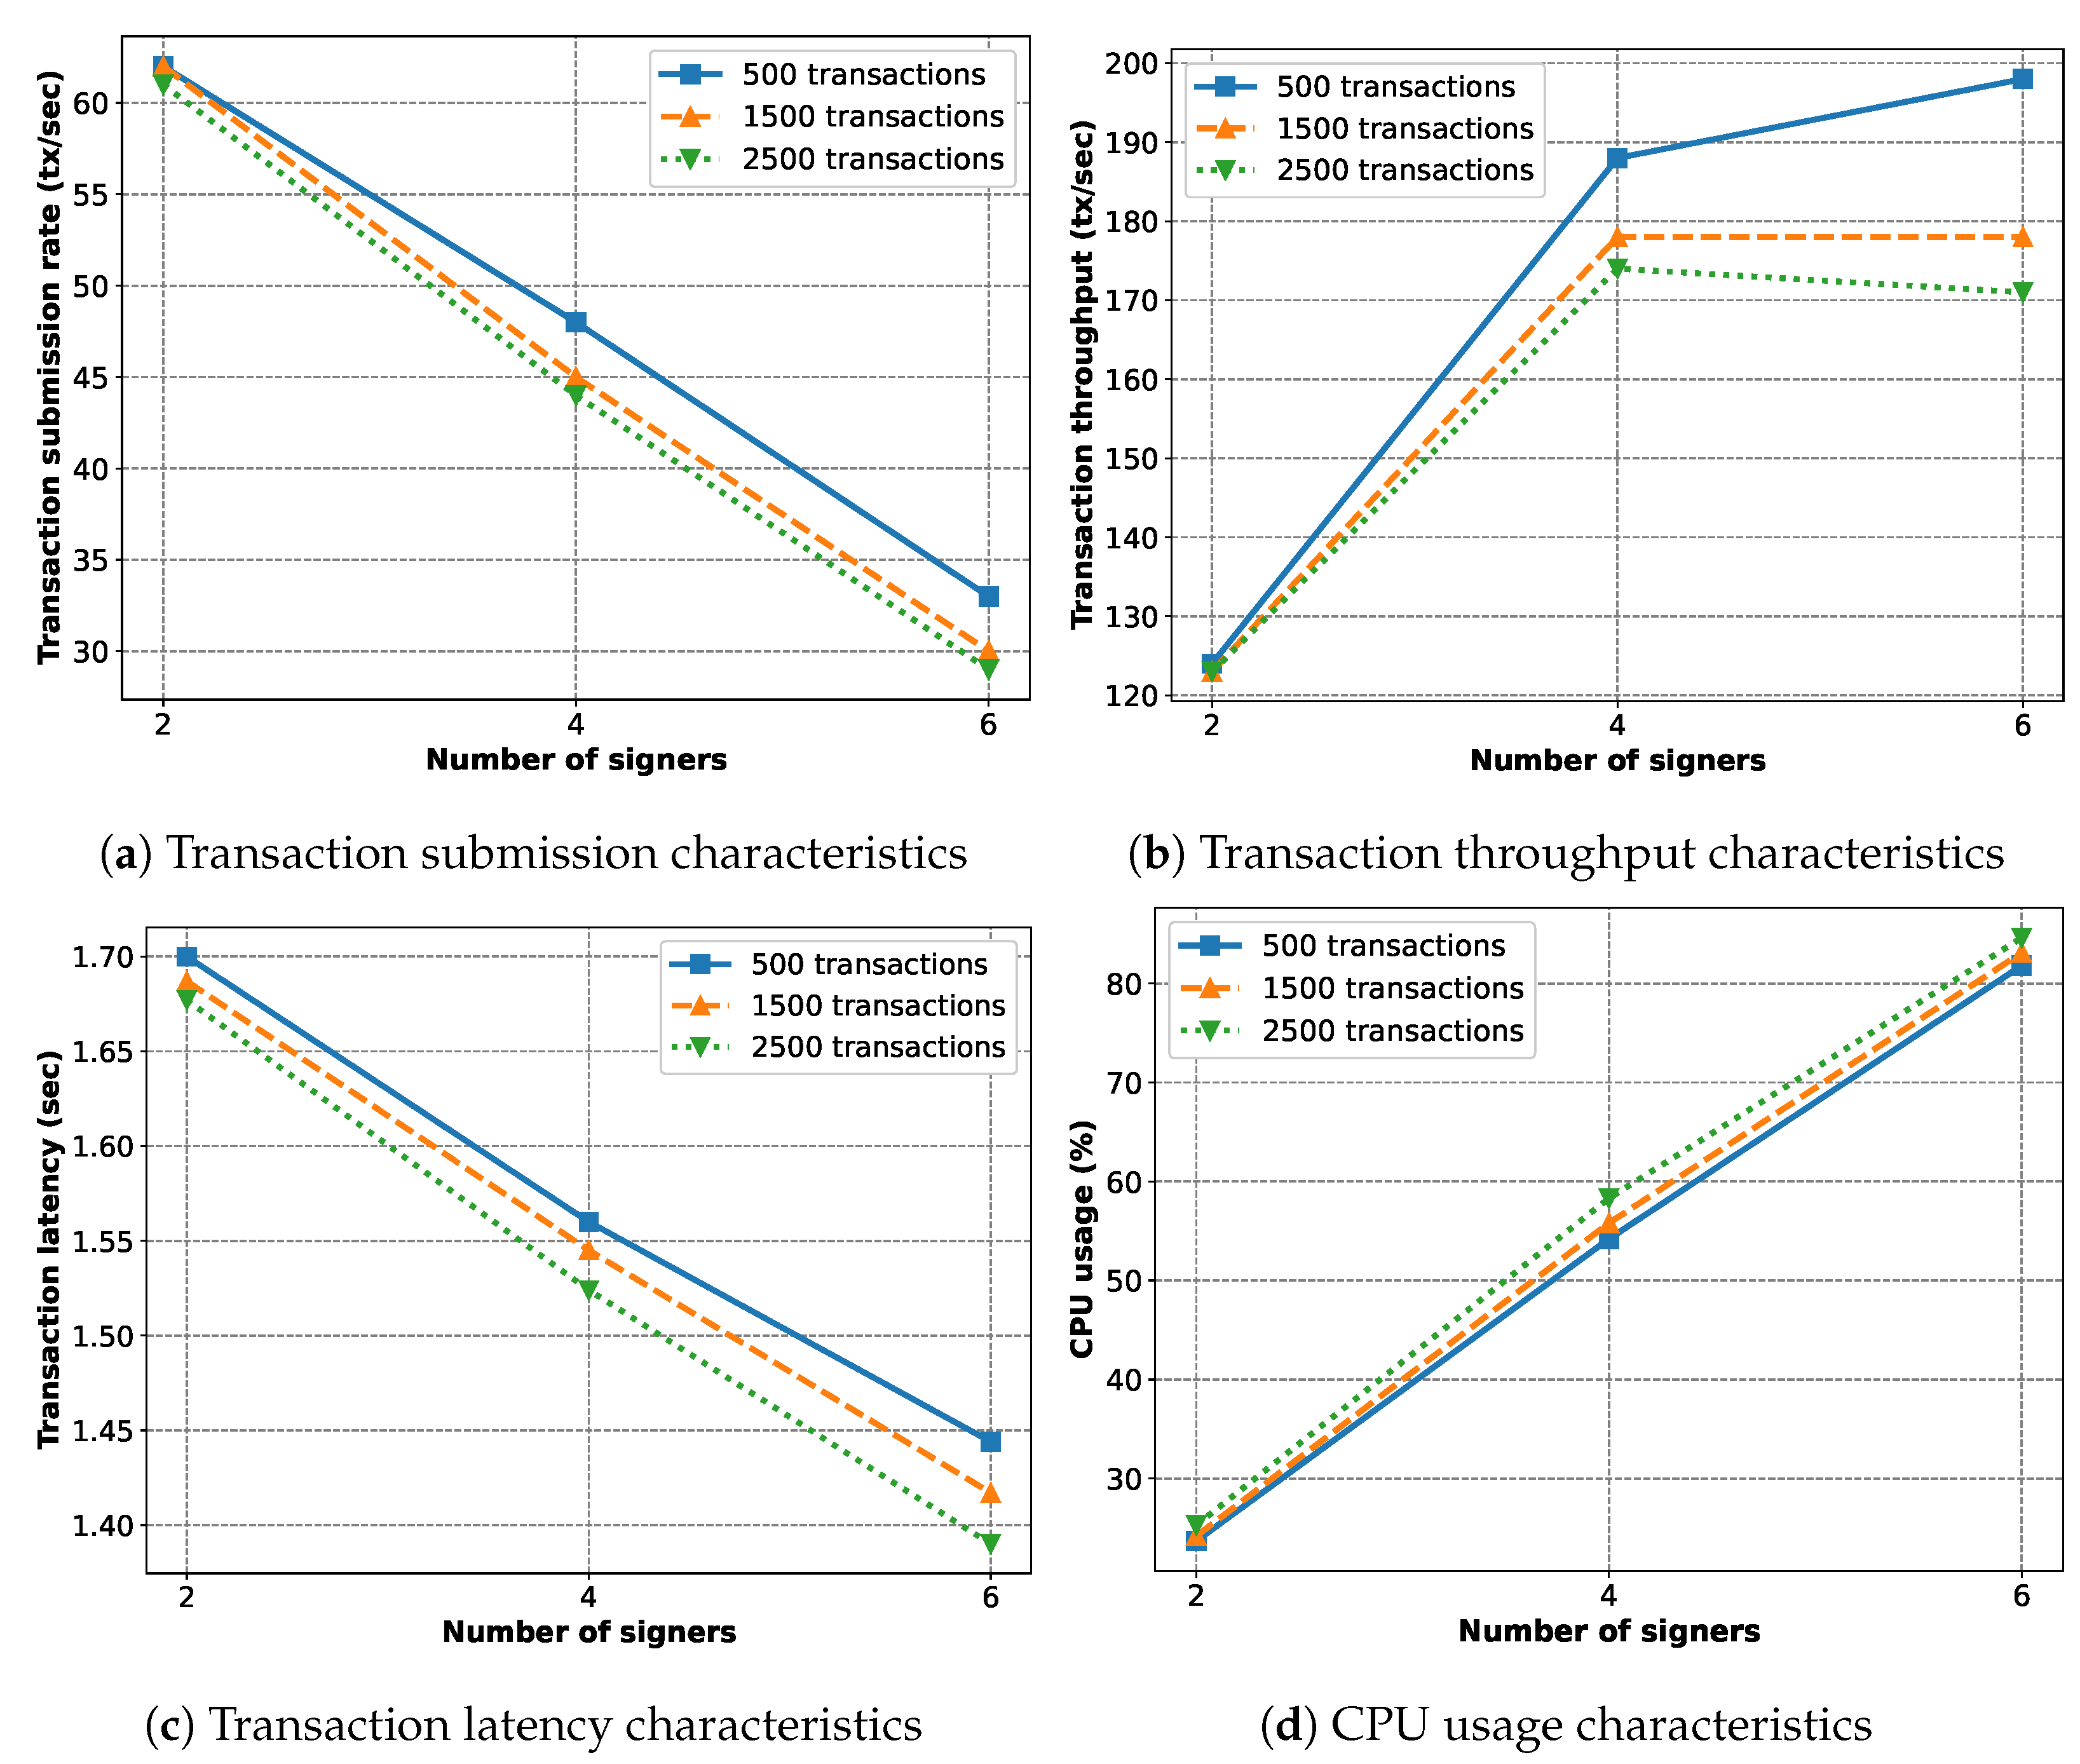
Figure 23, we study the behavior the implemented blockchain with varying numbers of signers and workloads per signer. The number of sealers is six. The behavior is nearly similar to the previous case in
Figure 22, but the effects are weaker. The decreasing submission rate (
Figure 23b) stems from the rising CPU usage (
Figure 23d), causing the throughput behavior in
Figure 23a. The better latency in
Figure 23c might be a direct result of the decreased throughput, as the blockchain is processing a lower number of transactions per second.
In
Figure 24, we study the behavior of the implemented blockchain with varying numbers of signers and block periods. Here, the workload is 2500 transactions per signer and there are four sealers. With faster block generation, we see a higher transaction submission rate (
Figure 24a) and throughput (
Figure 24b). The latency also becomes lower with shorter block periods (
Figure 24c) as the transactions have to wait less to be included in a block. The average number of queued transactions increases (
Figure 24d) with faster block generation as the blockchain has less time to synchronize submitted transactions. Finally,
Figure 24e shows that the CPU usage is considerably lower for shorter block periods.
