Article

Numerical Simulation of Corona Discharge Plasma Affecting the Surface Behavior of Polymer Insulators

Faculty of Engineering, University of Mons, 7000 Mons, Belgium
*
Author to whom correspondence should be addressed.
Energies 2024, 17(17), 4247; https://doi.org/10.3390/en17174247
Submission received: 23 July 2024 / Revised: 22 August 2024 / Accepted: 22 August 2024 / Published: 25 August 2024
(This article belongs to the Section F6: High Voltage)

Abstract

:
Corona discharge is a significant problem in the operation of high-voltage transmission and distribution systems, particularly for polymer insulators. Numerical simulation has become an effective tool for investigating the underlying physical mechanisms and optimizing the design of insulators. In this paper, we present a two-dimensional numerical simulation study on corona discharge plasma affecting the surface behavior of polymer insulators. The simulation was performed with the Comsol Multiphysic software and is based on the finite element method and the fluid plasma model, which considers ionization, recombination, and the transport of plasma species. The numerical results are analyzed to study the spatial and temporal characteristics of the corona discharge and its effect on the surface behavior of polymer insulators. The results show that the electric field is affected not only by the volume charge density but also by the surface charge density, which in turn depends on the densities of the charge carriers migrating on the insulator surface. However, the electric field drops drastically when one or two grading rings are installed. But one grading ring is not enough to limit the discharge.

1. Introduction

Polymer insulators are extensively employed in high-voltage settings owing to their superior electrical and mechanical characteristics. Nevertheless, they may experience surface deterioration and, consequently, electrical breakdown, particularly in conditions marked by elevated humidity, pollution, and intense electric fields [1,2,3]. Corona discharge is one of the main causes of surface deterioration. This form of partial discharge occurs when the electric field intensity exceeds the dielectric strength of the surrounding air. Corona discharge can cause localized heating, chemical reactions and surface erosion, which can significantly affect the performance and reliability of polymer insulators.
Numerical simulation has become an effective tool enabling researchers to study the underlying physical mechanisms and optimize insulator design. Moreover, it allows for a deep understanding of the behavior of corona discharge in polymer insulators. In this context, the aims of this study were to investigate the influence of corona discharge plasma on the surface condition of polymer insulators and to provide insights on the mechanisms of the corona discharge process [2].
Several models have been devoted to the simulation of corona discharges, using numerical approaches to simulate the plasma of gas discharges, such as Trichel pulses [4,5], pulsed periodic and stationary (glow) modes [6], and also the transition from glow mode to arc discharge [7].
Previous research on corona discharge in polymer insulators has been carried out under different aspects, such as experimental studies, theoretical analysis and numerical simulations. In [8], Reddy et al. formulated a methodology to assess the effectiveness of polymeric shed materials under corona stresses amid natural fog conditions; the findings disclosed increased surface hydroxylation. Consequently, this led to a greater reduction in hydrophobicity. The influence of DC corona is noted to be less significant when contrasted with AC corona. However, the hydroxylation process triggered by DC corona in the presence of fog bears similarity to that induced by AC excitation [9]. Likewise, Yuan et al. investigated the aging effects of corona discharge on high-temperature vulcanized (HTV) silicone rubber. They assessed the moisture absorption and dielectric loss angle of the silicone rubber samples. The results suggest that it is feasible to predict temperature increases by considering the duration of aging and the intensity of corona discharge [10]. Belhiteche et al. investigated the impact of aging duration on the hydrophobicity of polymers exposed to corona discharge. The degradation status of these insulators was assessed using Fourier transform infrared spectrometry (FTIR). Their observations revealed that the contact angle and adhesion energy are influenced by the surface’s physicochemical properties and the duration of the applied electrical stress [11].
Ghiasi et al. employed the finite element method (FEM) for a theoretical investigation, analyzing the electric field distribution on a polymer insulator under diverse non-uniform pollution conditions. Their study results suggest that modifying the thickness of the contamination layer has a notable effect on the distribution of electric fields. In particular, they observed that a ring-shaped non-uniform pollution setup exhibits superior efficiency in electric field distribution compared to the fan-shaped configuration [12]. Likewise, Kone et al. undertook a numerical study to examine how internal defects within composite insulators affect the distortion of electric fields. Their results emphasized the increased sensitivity of the radial electric field component to the presence of internal defects. Interestingly, they observed that the existence of a grading ring had no influence on the distortion of the electric field component, irrespective of the defects position [13].
Numerical simulations have gained extensive use in the examination of corona discharge within polymer insulators. As an example, Shanmugam et al. introduced a simulation-driven method for determining the propagation attributes of streamers in polymer suspension insulators exposed to positive-polarity lightning pulse voltages. The assessment of criteria for streamer initiation, propagation and sustenance involves employing electric field calculations through the finite element method. The configurations of insulator elements, including meteorological sheds, the placement of the initial shed and shed radius, exert a substantial impact on the initiation and spread of streamers. These factors play a pivotal role in dictating the flashover characteristics of the insulator [14]. All previous numerical simulations either ignore the space charge [12,13,14,15,16,17] or use a constant space charge [2]. Here, we present a more realistic numerical study, which takes into account the discharge plasma as well as space and surface charges.
The polymer insulator model used in this work is the one used for high-voltage lines in Belgium in collaboration with Elia Group. In this study, a two-dimensional numerical simulation analysis was carried out for the corona discharge affecting the surface behavior of polymer insulators. The simulation is based on the Comsol Multiphysics© software using the finite element method and the fluid plasma model, which considers the ionization, recombination and transport of charged species in the plasma. The behavior of the electric field in the gas is simulated along with the gas–solid interface, the surface charge distribution and that of the charged species in the plasma. The numerical results present the spatial and temporal characteristics of the corona discharge and its effect on the surface behavior of polymer insulators. The simulation was validated against experimental data. Our study is original and highlights the effect of realistic space charge on the behavior of polymer insulator chains.

2. Description of the Numerical Simulation Model

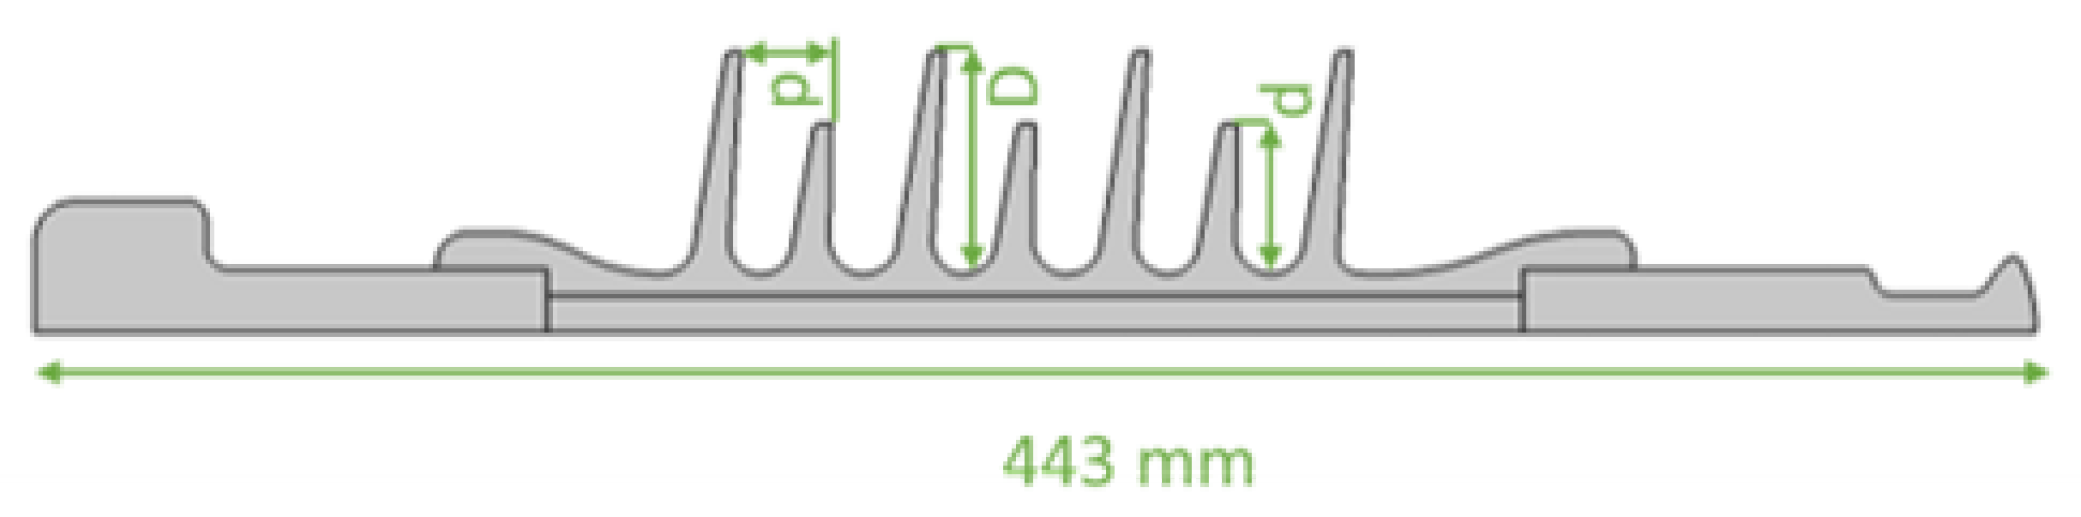
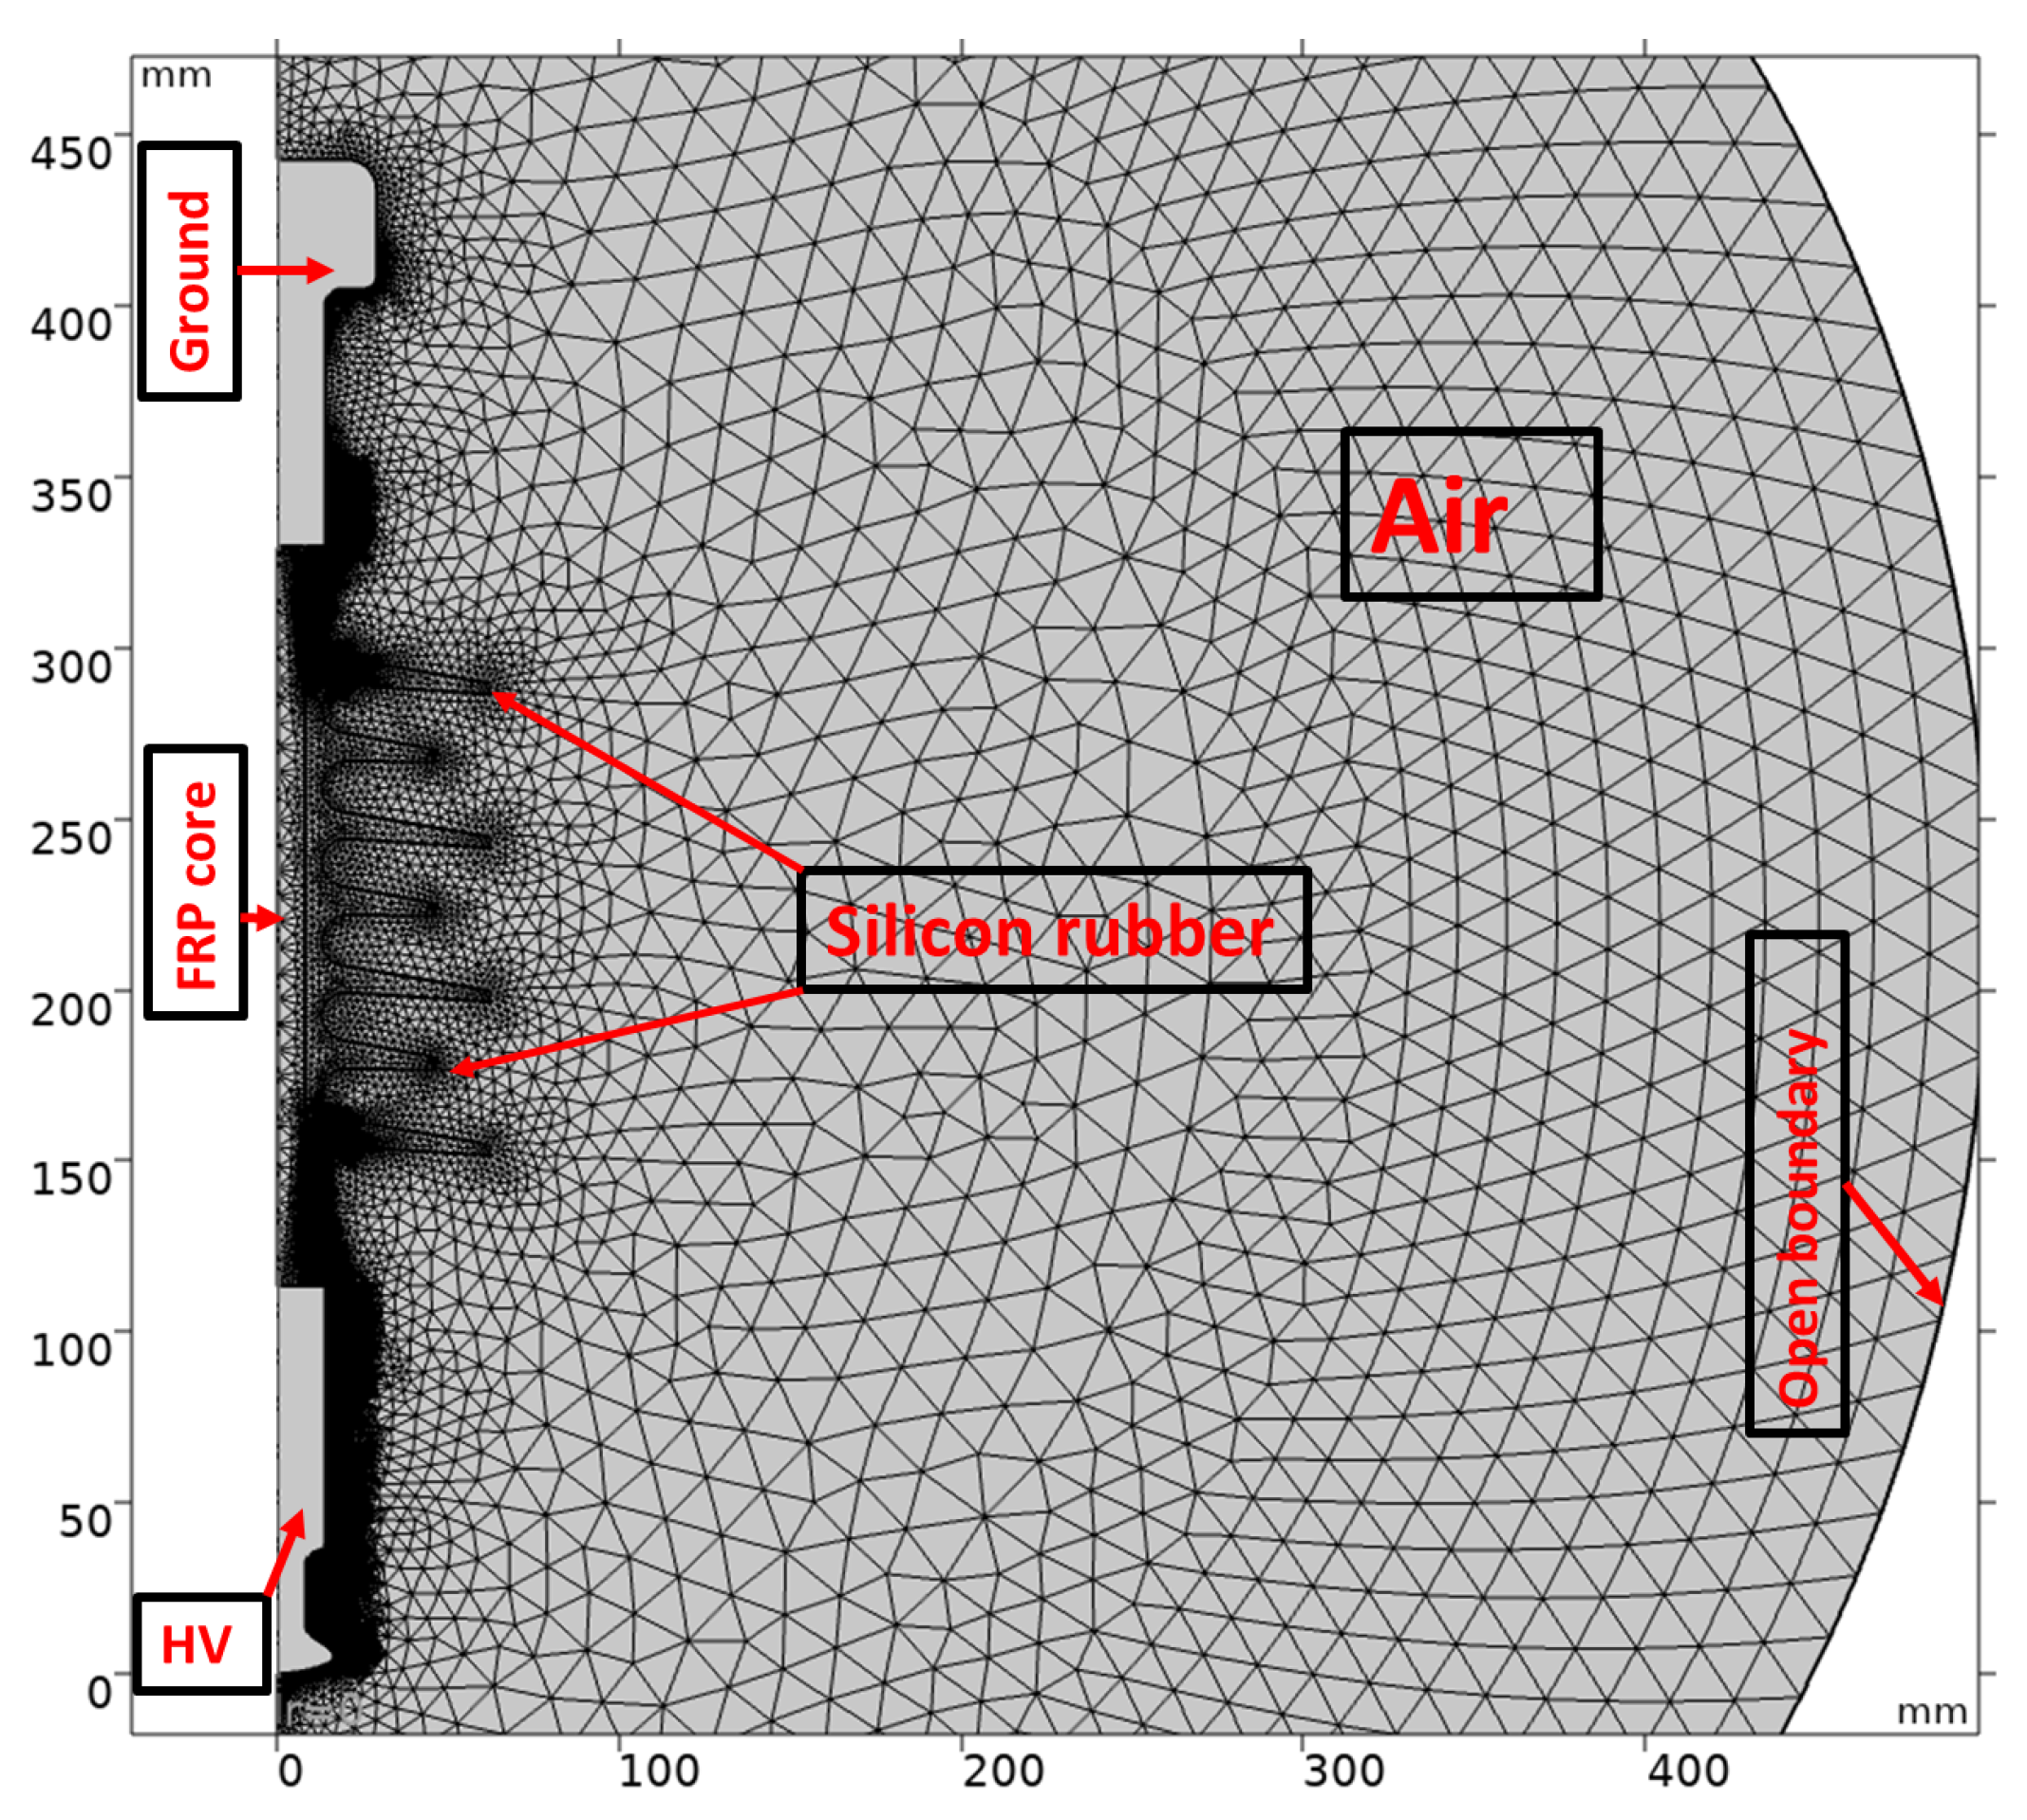
2.1. Geometric and Numerical Model

Insulators employed in high-voltage transmission lines are typically engineered to bear the weight of hanging conductors while preventing the passage of electrical current from the tower to the ground. Corona discharge is a significant problem in the operation of high-voltage transmission and distribution systems, especially for polymer insulators. Numerical simulation has become an effective tool for studying the underlying physical mechanisms and optimizing insulator design. Our test case is a typical 100 kV high-voltage composite insulator, as shown in Figure 1, and the corresponding geometrical characteristics are given in Table 1.
Insulators for high-voltage applications are commonly crafted from porcelain, glass or composite polymer materials. Composite insulators usually consist of a central rod constructed from fiber-reinforced plastic and an external weather shed crafted from silicone rubber. The weather shed is designed to keep specific sections of the insulator dry, enhancing its ability to resist flashovers during wet-weather conditions. The finite element modeling of insulators in the simulation involves utilizing material properties such as electrical conductivity and relative permittivity, which are detailed in Table 2.
We transformed our model from a three-dimensional experimental setup to a two-dimensional axisymmetric configuration. To ensure minimal impact on the plasma channel, the computational domain’s width was extended adequately to mitigate the influence of open boundaries. A direct current (DC) voltage of 100 kV was applied to the high-voltage electrode. The computational domain is circular with a radius of 0.5 m, which is a size deemed acceptable as it does not affect the discharge properties due to open boundaries.
A physics-controlled mesh proves unsuitable for addressing the local plasma generation challenge. Therefore, we implemented a user-controlled mesh. To ensure the accurate calculation of plasma variables, it is imperative that the mesh size across the entire computational domain be several times smaller than the Debye length. Mesh refinement is particularly applied in regions of the insulator and where high plasma density is observed (especially in the first 50 mm from the triple junction to limit calculation times).
The mesh comprises approximately 3.5 × 10 6 elements with an average quality of 0.9, denoting its efficiency. The computational domain’s geometry and mesh details are illustrated in Figure 2. The total degrees of freedom amount to around 8.1 × 10 6 , and the simulation time can extend up to 120 h, given a fixed discharge time of 100 ns (although it is possible to go beyond 100 ns, we limit ourselves to this instant for reasons of data volume). Time steps in the flow models are meticulously determined and set by us, considering the minute mesh along the flow axis. With a fixed time step of 10 11 s, the simulation duration is justified, promoting robustness and significantly minimizing errors.

2.2. Corona Discharge in Air

The hydrodynamic methodology employed in the Plasma Module is a widely recognized theoretical framework for characterizing high-pressure gas discharges. This approach conceptualizes the plasma as a blend of electrons and ions in mutual motion. It is articulated through the integration of continuity equations, along with Poisson’s equation governing the electric field, as illustrated below [18,19,20]:
n e t · Γ e = R e + R p h
Γ e = n e μ e · E + D e · n e
ρ w k t = · ρ w k V k + R k
· ε 0 ε r E = q k = 1 N Z k ρ w k n e
E = V
where t is time; n e is the electron density; Γ e is the electron flux; μ e is the electron mobility; T e is electron temperature; E is the electric field vector; D e = μ e · T e is the electron diffusivity; ρ is the mixture density; Z k , V k and w k are, respectively, the charge number, the multicomponent diffusion velocity vector and the mass fraction of the k-th species; q is the electric charge; V is the electric potential; ε 0 is the permittivity of the vacuum; ε r is the relative permittivity of the material; R e is either a source or a sink of electrons; and R k is the rate expression of the k-th species computed using the BOLSIG+ code [20,21]. It should be noted that, in the right-hand side of the continuity equations, additional terms have been introduced, specifically the source term R p h corresponding to photoionization.
The process of photoionization is articulated through three linear Helmholtz equations, employing the Coefficient Form Partial Differential Equation (PDE) Interface within the Mathematics Module:
Δ R p h j λ j p O 2 2 R p h j = A j p O 2 2 0.1 p q p + p q R e
where p O 2 is the partial pressure of molecular oxygen, p q is quenching pressure, and j = 1 , 2 , 3 , λ j and A j are constants defined in [18,20,22,23].
Boundary conditions play a crucial role in simulating corona discharges. Electrons near the wall display random motion and are quickly lost to it within a short distance, approximately a few mean free paths. Concurrently, they are replenished through secondary emission effects. This results in the establishment of the following boundary condition for electron flux:
n · Γ e = 1 γ e 1 + γ e 1 2 ν e , t h n e k γ p Γ k p · n
where γ e is the reflection coefficient on the surface of the electrodes, considered null in our model, the secondary electron emission coefficient γ p is zero on all walls, except on the insulator surface where it is equal to 0.005 in our model. And ν e , t h is the thermal velocity of the electrons. Regarding the heavier particles, ions are depleted near the wall due to surface interactions and the inherent orientation of the electric field toward the wall:
n · Γ k p = 1 4 γ k 8 R · T g π M k n k
where γ k is the sticking coefficient of the ions to the electrodes, R is the thermodynamic constant, and M k is the mass of the ionic species k.
Surface charge accumulation is added on the dielectric surfaces where the plasma is generated through the application of the classical continuity condition of electric displacement between two media, denoted as media 1 and 2:
σ s = n · D 1 D 2
The surface charge density σ s is determined by solving the given distributed ordinary differential equation (ODE) on the dielectric’s surface:
σ s t = n · J i + 1 + γ p n · J e
where the expression n · J i represents the normal component of the total ion current density at the wall. Similarly, n · J e denotes the normal component of the total electron current density at the wall.
The term of photoionization is segregated from the plasma variables. Additionally, we implemented stabilization techniques for the reaction terms to prevent the electron density values from approaching zero.
The comprehensive kinetic model for air includes various processes such as the excitation of electronic states; the destruction and ionization of heavy particles due to electron impacts, associative ionization, electron attachment and detachment; recombination of electrons with ions and ions with other ions; chemical transformations of neutral particles in both their ground and excited electronic states; and ion conversion [24]. In a previous, though unpublished, study, we assessed a kinetic model consisting of 32 species and approximately 350 chemical reactions for a N 2 / O 2 mixture. We compared the simulation results with those obtained from a simpler kinetic model used in this study, which includes only seven species (both charged and neutral) and eight reactions. The discharge current predictions from both models were similar. It was observed that negative ions form in the ionization layer near the anode, with O 2 being the dominant species. Moreover, the positive space charge in the corona mainly consists of O 2 + in the ionization layer and O 4 + in the drift region further from the anode [18,19,20]. To manage data more effectively, given the geometry of the current model, we focused on the simpler average model as it best represents the development of the positive corona discharge. Our goal was to determine a set of reactions necessary to accurately describe the evolution of the positive corona discharge. This minimal set includes photoionization, electron impact ionization and attachment, O 4 + production, recombination and dissociation (see Table 3) [18,19,20,24].

3. Results and Discussion

The results of this paper are presented and discussed for a positive continuous corona discharge supported by surface charge accumulation processes with a voltage value of 100 kV applied to the HV electrode, and the other electrode being grounded. Environmental conditions were set for a clean dry insulator and for dry air with temperature T g = 300 K and pressure P g = 760 Torr (=1 atm). These results compare the charge density distribution, the electric field distribution and the current density distribution for the insulator presented in Section 2, with one or two grading rings and without grading rings. (Note that the position and size of the grading rings were previously determined by an optimization study with Comsol Multiphysics. The optimization study was aimed at finding the optimum position of the grading rings to obtain the highest flashover voltage.) As shown in Figure 2, the lower end of the composite insulator is defined as the HV electrode, and the upper end is defined as the grounded electrode.

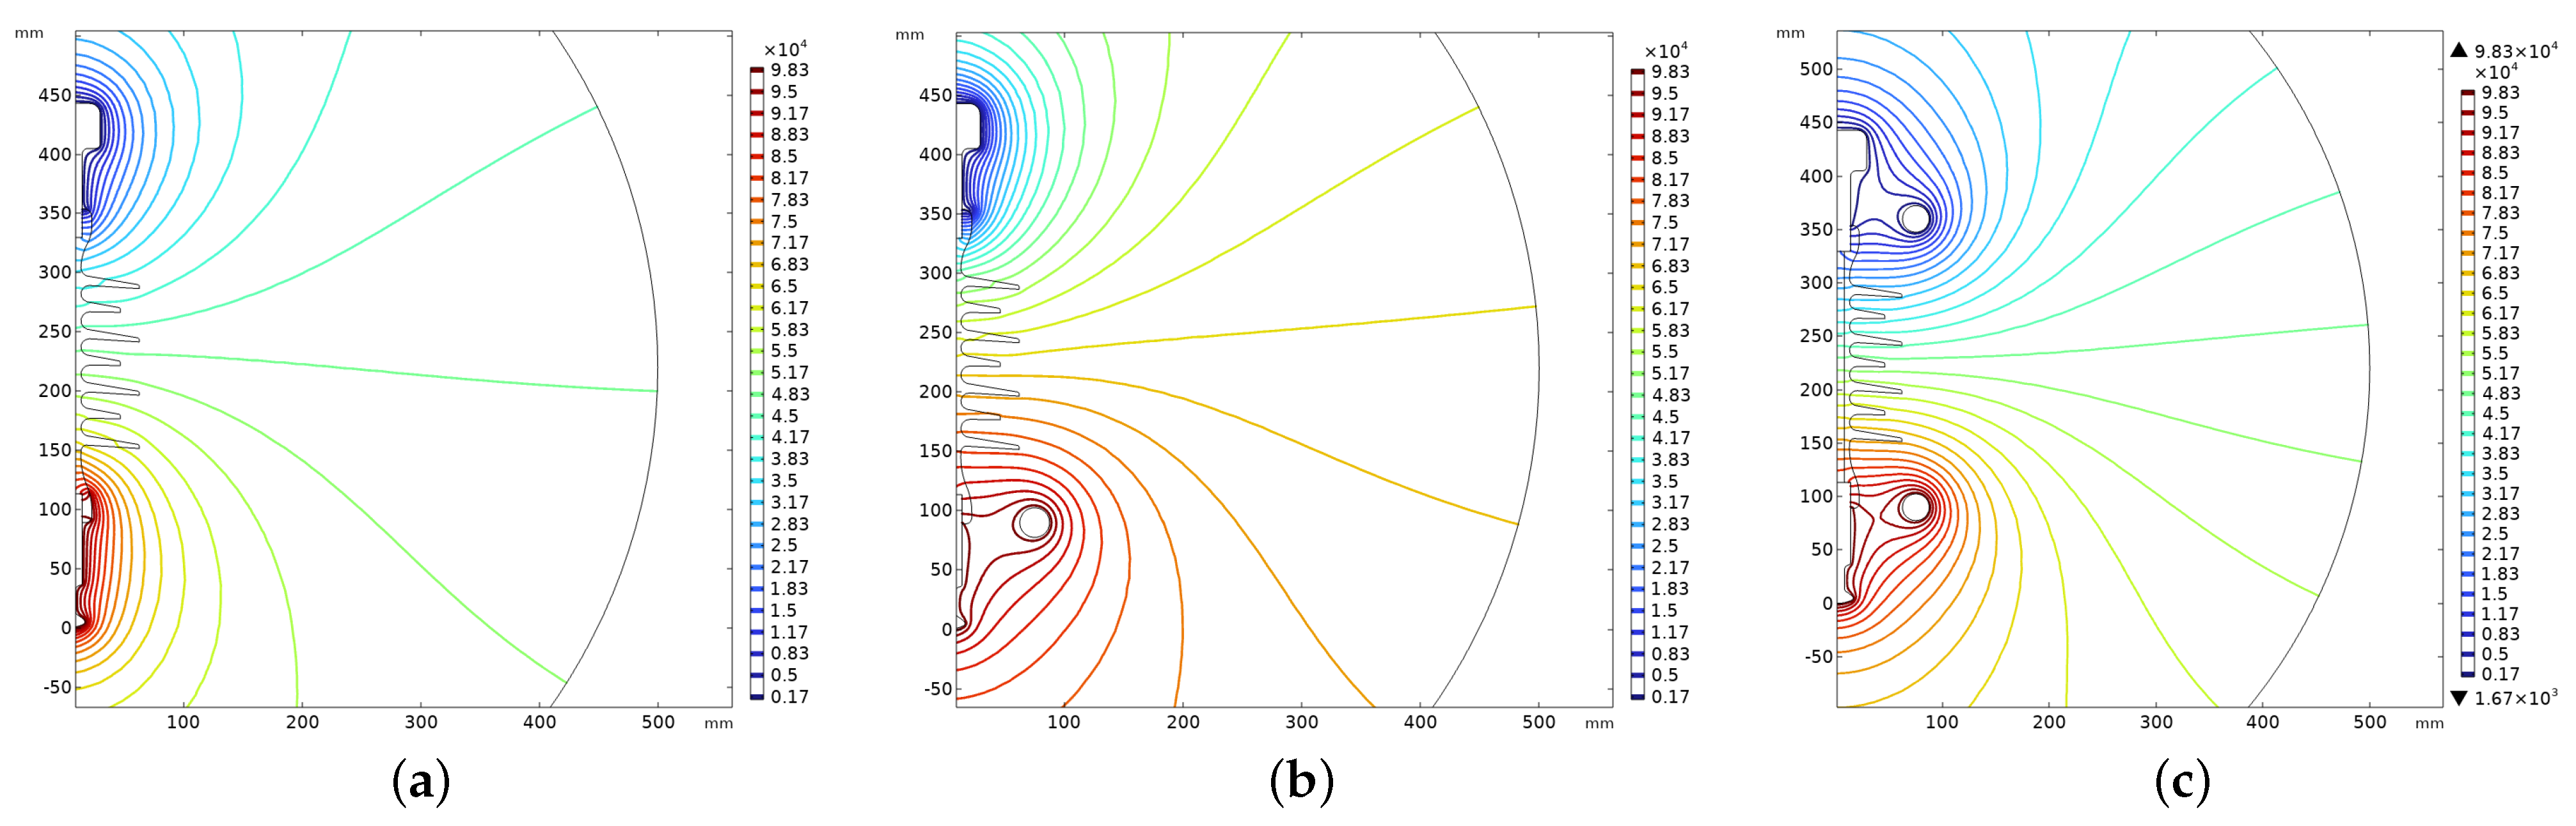
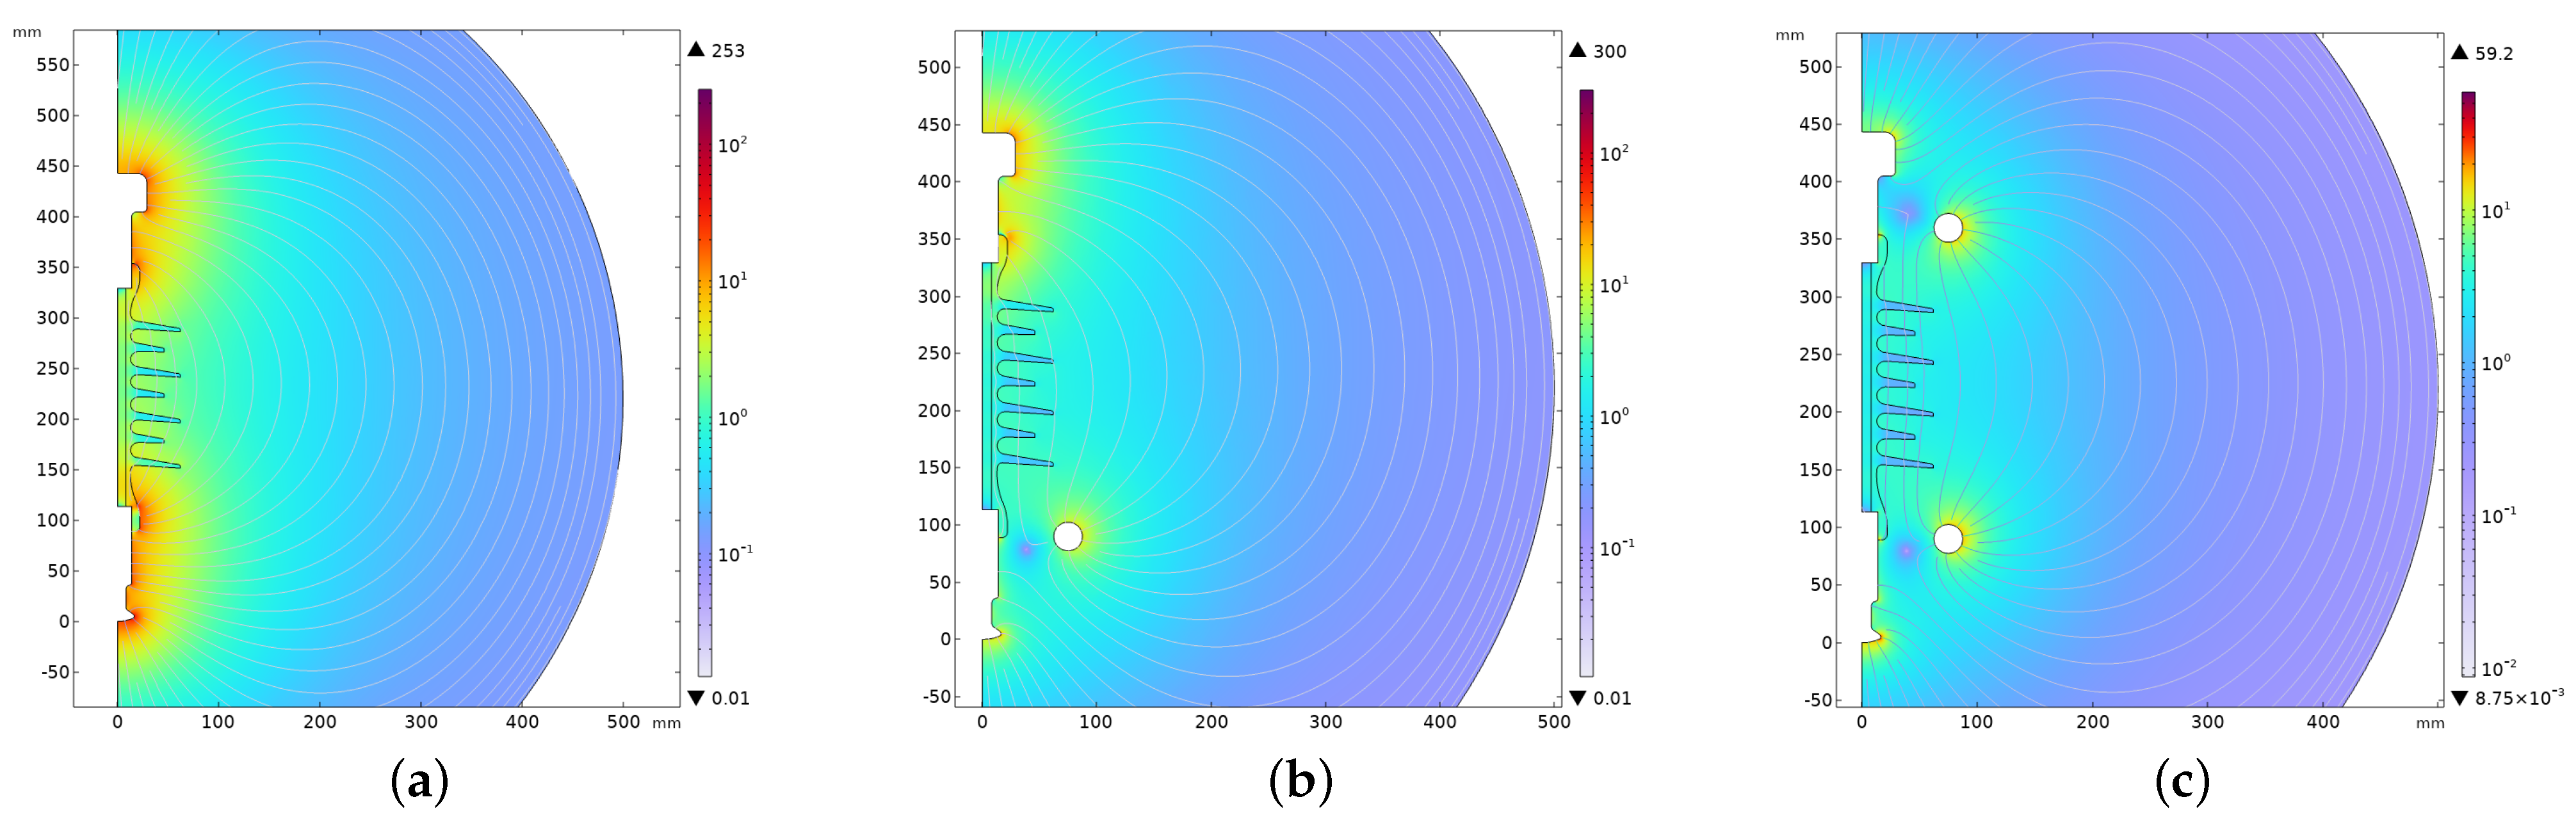
3.1. Equipotential and Electric Field Distributions

When a polymer insulator is subjected to an electric voltage, an electric field forms across the insulator. This electric field is generally non-uniformly distributed along the insulator and can be described by an electric field distribution. Figure 3 and Figure 4 show equipotential profiles and 2D electric field distributions for insulators with and without grading rings at time t = 100 ns, respectively. Equipotential lines and electric field lines are related and together provide a complete representation of the electric field in a given region. As shown in Figure 3 and Figure 4, the equipotential lines do not have the same distribution for the three different configurations even though the voltage applied to the HV electrode is identical. These equipotentials dictate the electric field distributions. The electric field does not exhibit uniformity across various configurations. In instances without a grading ring, the electric field intensity is notably higher at both ends of the insulator compared to the middle section. We observe that with a single grading ring placed near the HV electrode, the electric field becomes weak at the HV electrode but increases drastically at the grounding electrode. When two grading rings are installed on either side of the electrodes, the electric field becomes quite uniform but remains weaker than in the first two configurations. When two grading rings are placed, the maximum electric field is reduced 75 % . The placement of the grading rings is therefore important because they even out the electric field along the insulator. The field in the middle position is relatively weaker. This is because the electric field is primarily where the equipotential are most concentrated. The middle part of the insulator is where the electrodes are in a very high-field electromagnetic environment, and this can easily lead to partial discharges and, in severe cases, even to the rupture and complete failure of the insulation system. Contrarily, employing two grading rings has demonstrated a significant reduction in both the inhomogeneity and peak surface electric field. Consequently, the incorporation of grading rings enhances the insulator’s capacity to endure higher overvoltage levels.
The electric field distribution under dry conditions was calculated for insulators with and without grading rings. In all devices, the electric field distribution has the same evolution. The highest electric field in conditions without grading rings is 10 times higher than that encountered in conditions with one or two grading rings; this is at the triple junction near the HV electrode, as shown in Figure 5 (note that 0 in Figure 5 represents the triple junction near the HT electrode). The electric field with one or two grading rings is low at the triple junction near the HV electrode, which is not necessarily the case at the triple junction near the grounded electrode, where the field is low for the system with two grading rings but remains high with one or no grading rings. Along the creepage distance, the tangential electric field increases with the addition of two grading rings. This is due to the distance between the two rings. Their position reduces the electric field between the electrodes and the rings, but results in a high electric field between the two rings. It is important to note that the localized electric field exceeds the propagation limits of the streamer except when the system includes two grading rings. This can be seen by comparing Figure 5 and Figure 6, which shows the evolution of the streamer along the insulator surface from the triple junction. Therefore, for the applied voltage value of 75 kV, localized degradation may already occur on composite insulators, especially in the case of an insulator without a grading ring.

3.2. Electron Density Distribution

Figure 6 shows the 2D distribution of the time evolution of the streamer along the insulator in the case of the insulator without corona rings. In this figure, the lowest point where charge migration begins represents the triple junction on the HV electrode end. The electric field is affected by the surface charge density, which in turn depends on the densities of the charge carriers migrating on the insulator surface. It is noted that the streamer originates from the triple junction where the electric field is very high and then the streamer propagates along the polymer surface supported by the electric field. This results in a very high surface charge where the streamer developed. Therefore, degradation can occur on composite insulators, especially in the case of an insulator without corona rings. Since the polymer is not perfect, a number of electrons will be injected into the insulator and migrate inside the polymer to the ground electrode. Most of them will be captured by holes and others released by thermal effects. The study of the behavior of the injected electrons that can help the degradation processes of the insulator is not treated in this article. Please note that we have limited the calculation time to 100 ns, which does not allow us to observe the complete development of the streamer over the entire creepage distance.

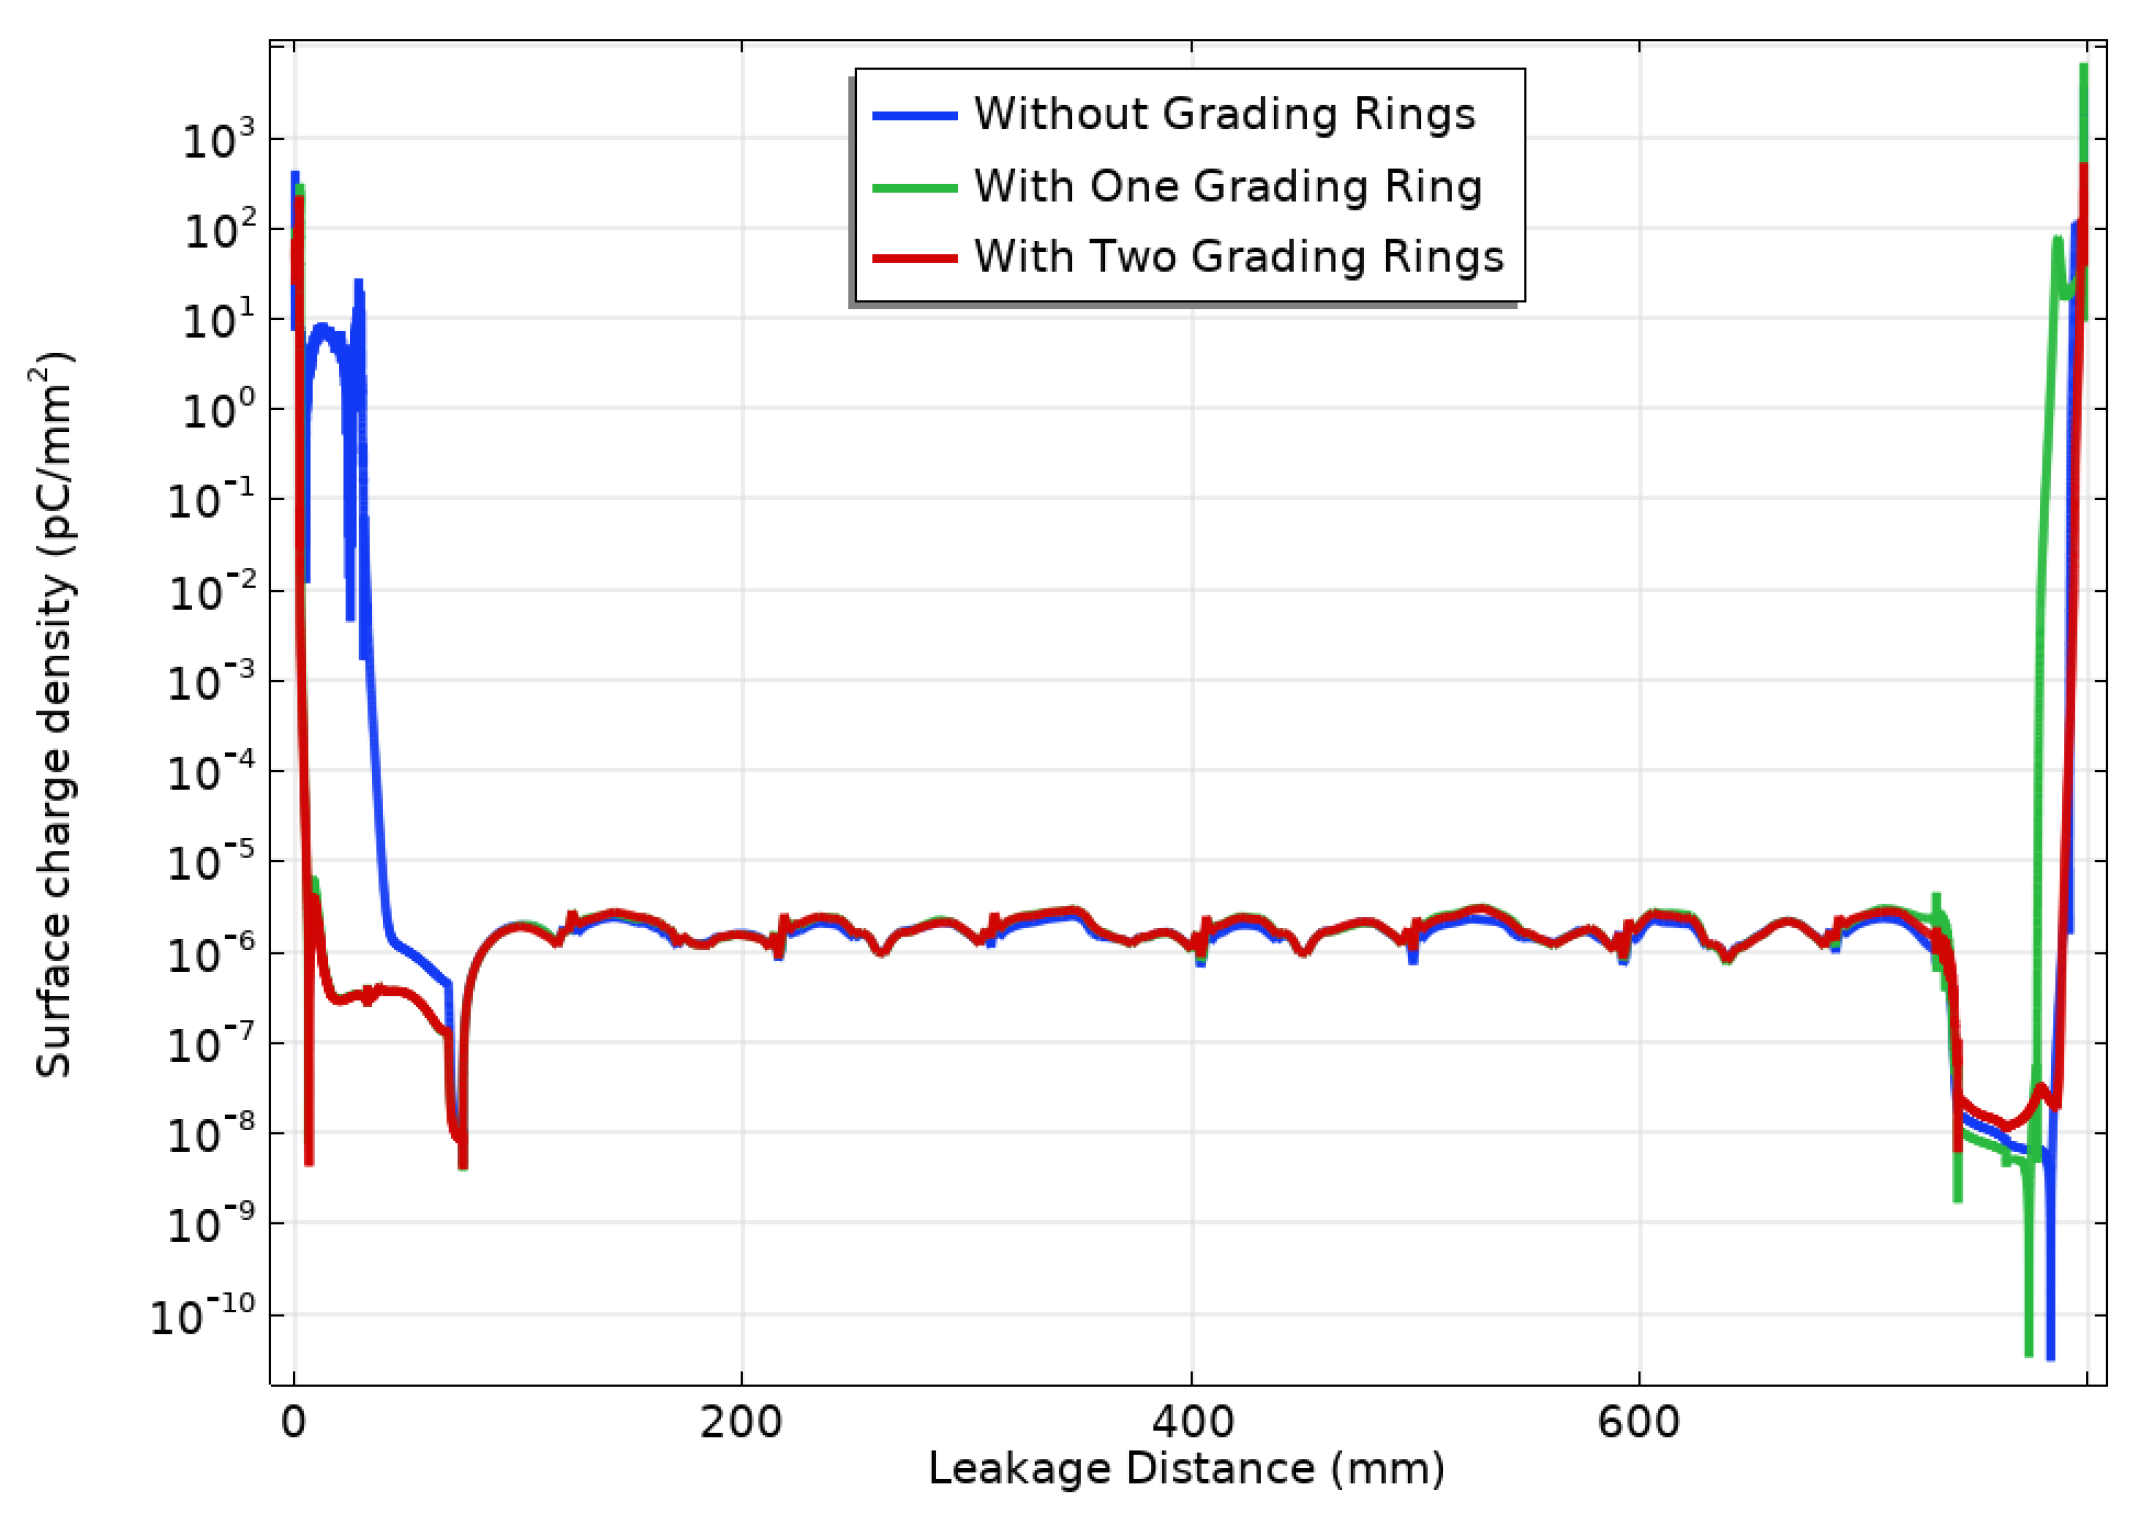
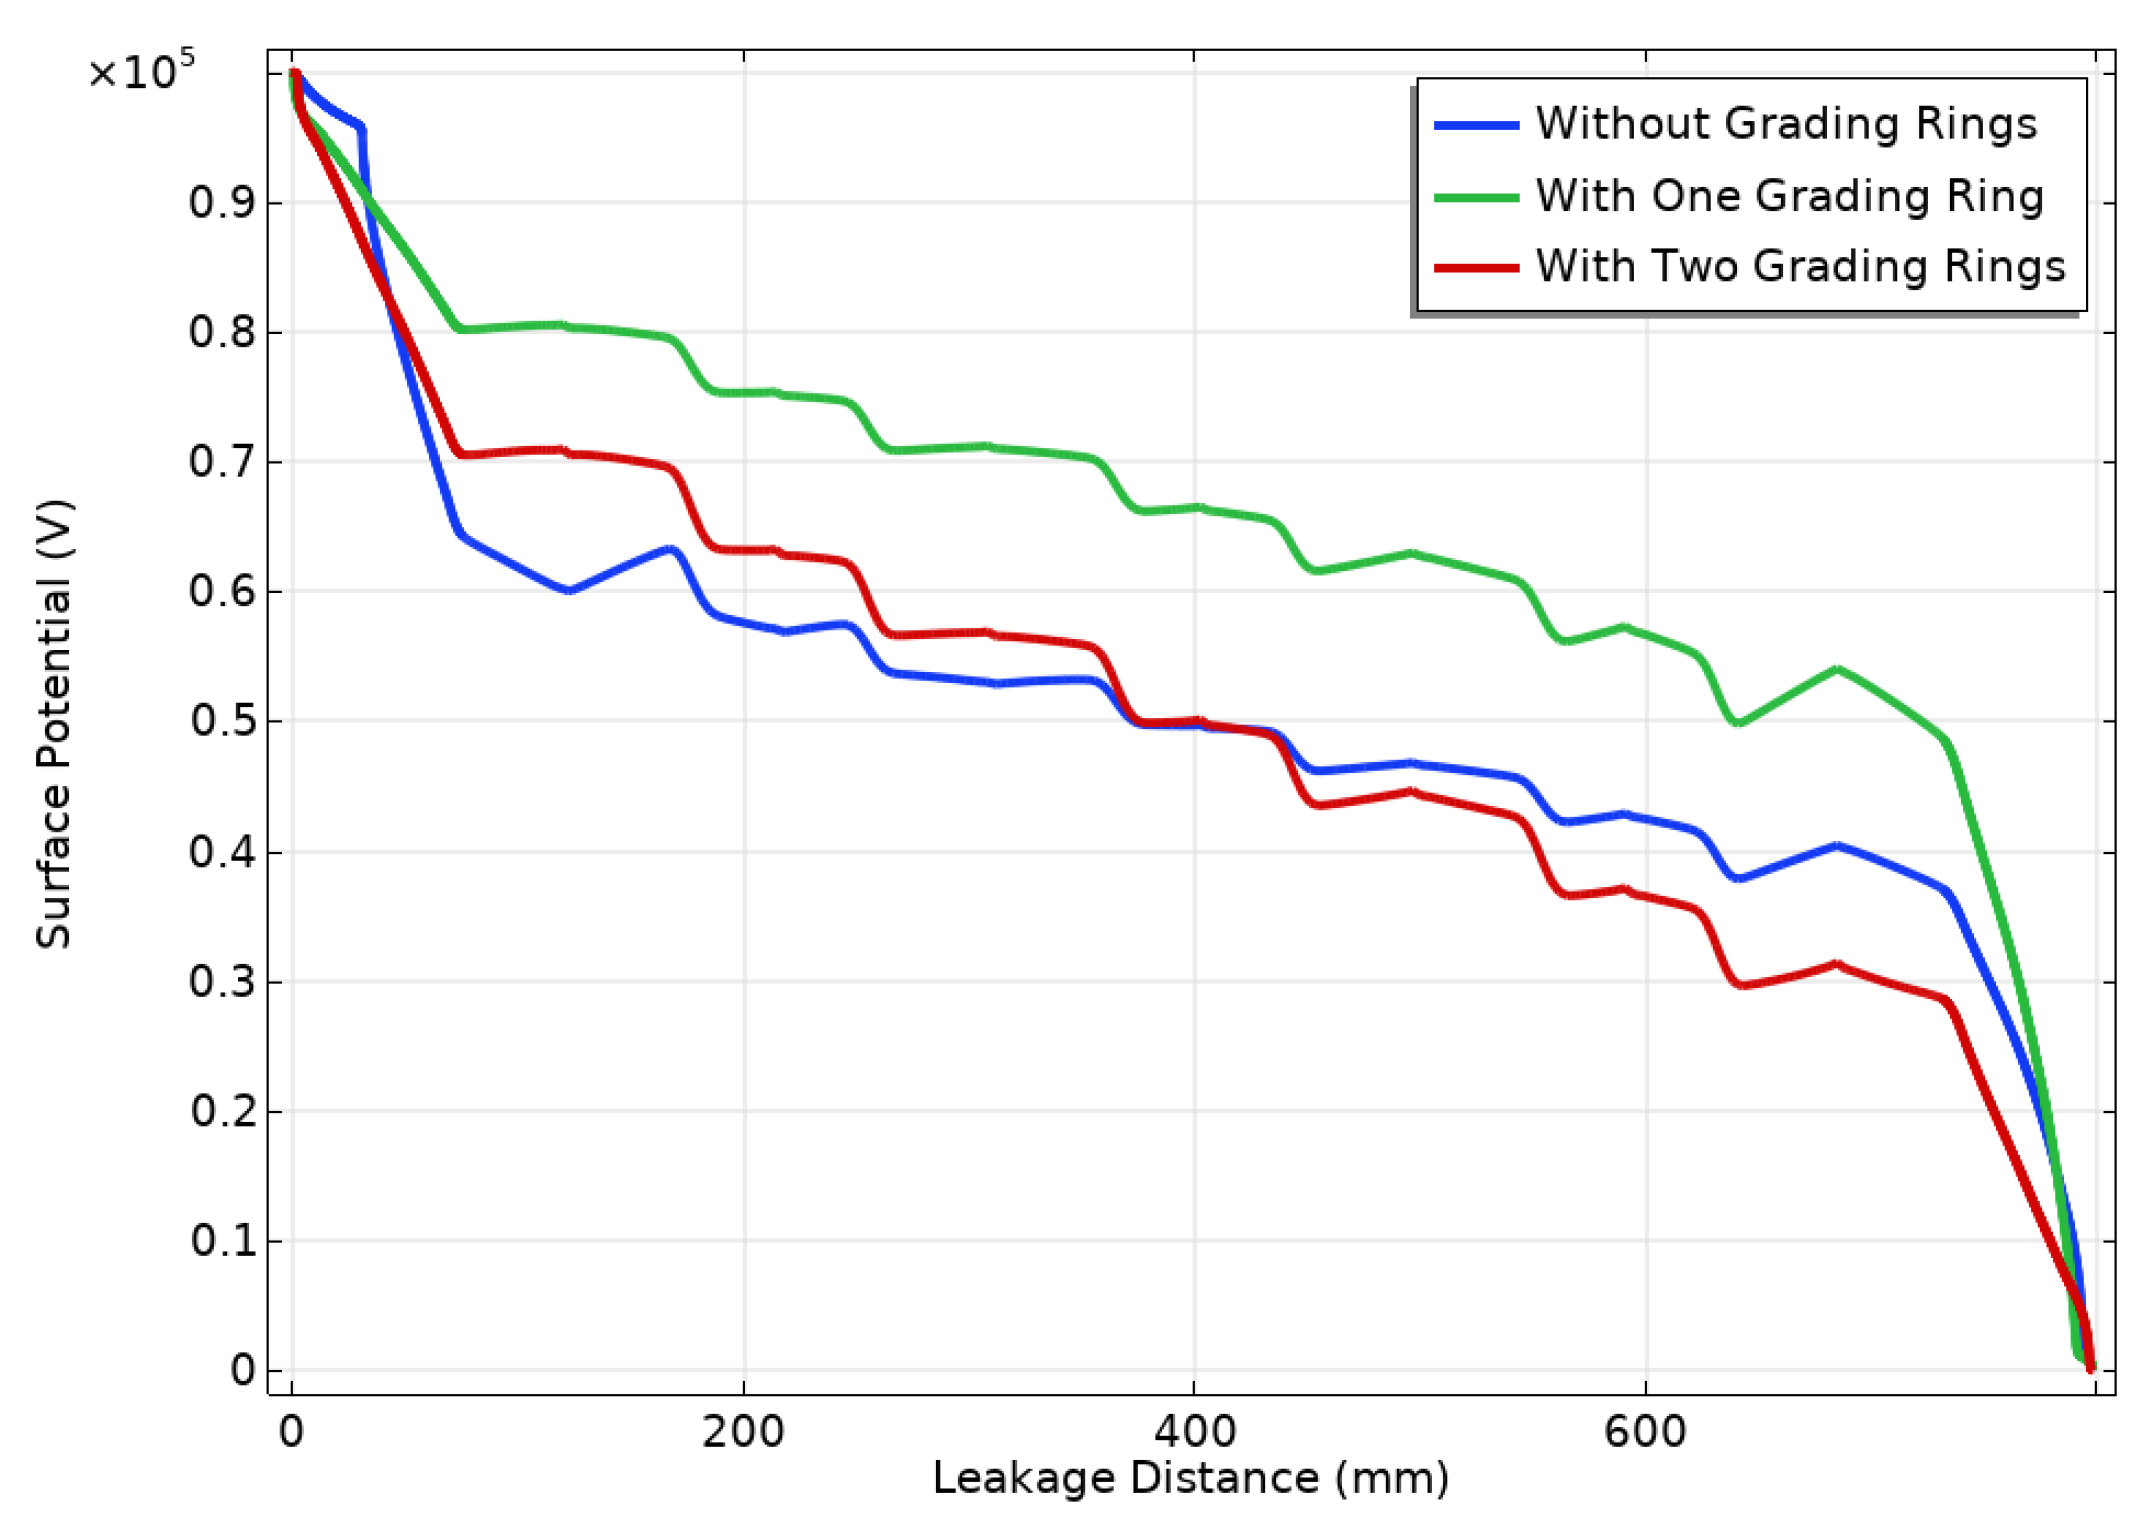
3.3. Surface Charge Density and Surface Potential

Comprehending how surface charges impact surface potential and electric field is essential for evaluating the efficacy and insulation characteristics of polymer insulators. By controlling the charge distribution and minimizing field enhancement effects, the design and optimization of insulator surfaces can be improved to enhance their electrical withstand performance. It is crucial to highlight that the surface potential and electric field are mutually dependent on each other. The surface potential determines the electric field, and the electric field influences the movement and redistribution of charges on the surface. Figure 7 and Figure 8 present, respectively, the surface charge density and surface potential distribution along leakage distance with and without grading rings at t = 100 ns. The charges called surface charges initiate at the triple junction between solid, gas and metal and then move to the solid–gas interface along the polymer insulators and accumulate due to the difference in conductivity between the gas and solid. As can be seen in Figure 7, the surface charge is very large over an accumulation distance identical to the streamer path that develops on the insulator surface (see Figure 6). This large value of surface charge causes the electric field lines to bend around the charged regions, creating non-uniform electric field distributions as well as electric field enhancement, as illustrated in Figure 5. Over time, charges can accumulate on the insulator surface, especially in regions not directly adjacent to the grading rings. This accumulated charge can create local electric fields that are stronger than anticipated, especially in areas where the control from the grading rings is weaker (see Figure 5).
The electric field enhancement is due to the local electric field strength increasing due to the accumulation of charges in specific regions or irregularities of the surface. The increased field strength can lead to higher electrical stress and increased vulnerability to electrical breakdown in these localized areas. Surface charges create an electrical potential difference between the charged surface and its surroundings. The surface potential is directly related to the density and distribution of charges on the surface. Positive charges create a positive surface potential, while negative charges create a negative surface potential. The surface potential determines the energy required to move a charge from the surface to a reference point. The surface potential distribution profiles are almost identical for the insulator with and without guard rings. We notice that the potential is relatively larger where the charges are dominant but slowly decreases for the insulator with only one ring. The electric field is very weak where the accumulation of surface charges is not sustained. Note also that polymeric insulators often have shed designs with specific profiles that promote charge dissipation and reduce the effects of surface contamination.

4. Conclusions

In this paper, we present a two-dimensional axisymmetric numerical simulation study on corona discharge plasma affecting the surface behavior of polymer insulators. The simulation is based on the finite element method and the fluid plasma model of the commercial software Comsol Multiphysics©, which considers the ionization, recombination and transport of plasma species. The numerical results were analyzed to study the spatial and temporal characteristics of the corona discharge and its effect on the surface behavior of polymer insulators. The results show that the addition of grading rings significantly alters the electric field distribution along the insulator. In the absence of grading rings, the electric field is highly concentrated at both ends of the insulator, particularly at the HV electrode, resulting in a non-uniform distribution. Introducing a grading ring near the HV electrode reduces the electric field strength at this end, but causes a considerable increase at the grounded electrode. The most uniform electric field distribution was achieved using two grading rings, with electric field intensity reduced by 75 % compared to the configuration without grading rings. This uniformity indicates that the strategic placement of grading rings can effectively attenuate high electric field concentrations, reducing the risk of electrical breakdown and improving the overall reliability of the insulation system.
The distribution of electron density and the temporal evolution of streamers were also examined, particularly for the insulator configuration without grading rings. It was observed that streamers start at the triple junction near the HV electrode, where the electric field is strongest. The streamers then propagate along the insulator surface, contributing to the accumulation of surface charge. This accumulation of surface charge in turn influences the distribution of the electric field, exacerbating the increase in field strength and potentially leading to the localized degradation of the insulator. The absence of grading rings allows for more pronounced streamer development and charge accumulation, which could ultimately compromise insulator performance and longevity.
Surface charge density and surface potential distributions were also assessed along the leakage distance. The results indicate that regions of high surface charge density correspond to areas of higher electric field strength, which can lead to localized electrical stress and increased vulnerability to breakdown.

Author Contributions

Conceptualization, C.Z. and J.L.; methodology, C.Z.; software, C.Z.; validation, C.Z., J.L. and F.M.; formal analysis, C.Z. and J.L.; investigation, C.Z. and J.L.; resources, C.Z., J.L. and F.M.; data curation, C.Z. and J.L.; writing—original draft preparation, C.Z.; writing—review and editing, C.Z. and J.L.; visualization, C.Z. and J.L.; supervision, J.L. and F.M.; project administration, J.L. and F.M.; funding acquisition, C.Z., J.L. and F.M. All authors have read and agreed to the published version of the manuscript.

Funding

This research received no external funding.

Data Availability Statement

The original contributions presented in the study are included in the paper; further requests can be sent directly to the corresponding author.

Acknowledgments

This study was supported by the University of Mons. The author appreciates the University of Mons for granting the opportunity to undertake this research.

Conflicts of Interest

The authors declare no conflicts of interest.

References

  1. Cherney, E.A. 50 years in the development of polymer suspension-type insulators. IEEE Electr. Insul. Mag. 2013, 29, 18–26. [Google Scholar] [CrossRef]
  2. Mahmoodi, J.; Mirzaie, M.; Akmal, A.A.S. Surface charges on silicon rubber (SiR) insulator and their effect on potential and electric field distribution. Electr. Eng. 2018, 100, 2695–2705. [Google Scholar] [CrossRef]
  3. Learning from Service Experience with Composite Line Insulators. INMR: 2020. Available online: http://www.inmr.com/learning-from-service-experience-with-composite-line-insulators-2/ (accessed on 10 May 2024).
  4. Zheng, Y.; Wang, L.; Wang, D.; Jia, S. Numerical study of the effect of the needle tip radius on the characteristics of Trichel pulses in negative corona discharges. Phys. Plasmas 2017, 24, 063515. [Google Scholar] [CrossRef]
  5. Tarasenko, V.F.; Kh Baksht, E.; Vinogradov, N.P.; Kozyrev, A.V.; Kokovin, A.S.; Kozhevnikov, V.Y. On the Mechanism of Generation of Trichel Pulses in Atmospheric Air. JETP Lett. 2022, 115, 667–672. [Google Scholar] [CrossRef]
  6. Saifutdinova, A.A.; Timerkaev, B.A.; Saifutdinov, A.I. Numerical Computations of Transition Processes in Direct Current Corona Microdischarge. Russ. Phys. J. 2022, 65, 156–168. [Google Scholar] [CrossRef]
  7. Saifutdinov, A.I. Numerical study of various scenarios for the formation of atmospheric pressure DC discharge characteristics in argon: From glow to arc discharge. Plasma Sources Sci. Technol. 2022, 31, 094008. [Google Scholar] [CrossRef]
  8. Reddy, B.S. Corona degradation of the polymer insulator samples under different fog conditions. IEEE Trans. Dielectr. Electr. Insul. 2016, 23, 359–367. [Google Scholar] [CrossRef]
  9. Reddy, B.S.; Marathe, M. Corona studies on polymeric insulator samples used in high voltage transmission. In Proceedings of the IEEE International WIE Conference on Electrical and Computer Engineering (WIECON-ECE), Pune, India, 19–21 December 2016; pp. 160–163. [Google Scholar]
  10. Yuan, Z.; Tu, Y.; Wang, C. Temperature Rise Prediction on Silicone Rubber Housing of Composite Insulator in High Humidity Environment. In Proceedings of the IEEE International Conference on High Voltage Engineering and Application (ICHVE), Beijing, China, 6–10 September 2020; pp. 1–4. [Google Scholar]
  11. Belhiteche, E.H.; Rondot, S.; Dony, P.; Moudoud, M.; Jbara, O. Effect of Aging Time on the Hydrophobicity of Polymers Subjected to Corona Discharge. In Proceedings of the International Conference of Advanced Technology in Electronic and Electrical Engineering (ICATEEE), M’sila, Algeria, 26–27 November 2022; pp. 1–5. [Google Scholar]
  12. Ghiasi, Z.; Faghihi, F.; Shayegani-Akmal, A.A. FEM analysis of electric field distribution for polymeric insulator under different configuration of non-uniform pollution. Electr. Eng. 2021, 103, 2799–2808. [Google Scholar] [CrossRef]
  13. Kone, G.; Volat, C.; Ezzaidi, H. Numerical investigation of electric feld distortion induced by internal defects in composite insulators. IET High Volt 2017, 2, 253–260. [Google Scholar] [CrossRef]
  14. Wang, Y.; Dong, J.; Zhang, L.; Wang, Y.; Li, X. Numerical simulation of surface discharge characteristics on silicone rubber insulators with different surface roughness. IEEE Access 2021, 9, 104898–104907. [Google Scholar]
  15. Liu, H.; Liu, Q.; Wang, Z.; Zhang, L. Numerical simulation and analysis of corona discharge in a coaxial cylindrical system under high-altitude environment. IEEE Trans. Plasma Sci. 2021, 49, 3984–3994. [Google Scholar]
  16. Li, Y.; Li, X.; Li, D.; Xie, W. Numerical simulation of surface charge accumulation on silicone rubber insulator based on corona discharge model. IEEE Access 2020, 8, 165004–165014. [Google Scholar]
  17. Shanmugam, G.; Karakkad, S. Influence of the insulator geometry on the streamer propagation characteristics in polymeric insulators under positive polarity lightning impulse voltages. IET Sci. Meas. Technol. 2018, 12, 1082–1088. [Google Scholar] [CrossRef]
  18. Zogning, C.; Lobry, J.; Moiny, F. Comparison between Positive and Negative Corona Discharges by Hydrodynamic Plasma Simulations. In Proceedings of the International Symposium on Electrical Insulating Materials (ISEIM), Tokyo, Japan, 13–17 September 2020; pp. 552–560. [Google Scholar]
  19. Sima, W.; Liu, C.; Yang, M.; Shao, Q.; Xu, H.; Liu, S. Plasma model of discharge along a dielectric surface in N2/O2 mixtures. Phys. Plasmas 2016, 23, 063508. [Google Scholar] [CrossRef]
  20. Zogning, C.; Lobry, J.; Moiny, F. Simulation of Positive Corona Discharge in Atmospheric-pressure Air by Plasma Hydrodynamic Model. In Proceedings of the 12th National Conference on High Voltage Engineering CNHT, Sidi Bel-Abbès, Algeria, 4–6 October 2022. [Google Scholar]
  21. Hagelaar, M.; Pitchford, L.C. Solving the Boltzmann equation to obtain electron transport coefficients and rate coefficients for fluid models. Plasma Sources Sci. Technol. 2005, 14, 722. [Google Scholar] [CrossRef]
  22. Zhelezniak, M.B.; Mnatsakanian, A.K.; Sizykh, S.V. Photoionization of nitrogen and oxygen mixtures by radiation from a gas discharge. High Temp. 1982, 20, 357–362. [Google Scholar]
  23. Bourdon, A.; Pasko, V.P.; Liu, N.Y.; Célestin, S.; Ségur, P.; Marode, E. Efficient models for photoionization produced by non-thermal gas discharges in air based on radiative transfer and the Helmholtz equations. Plasma Sour. Sci. Technol. 2007, 16, 656–678. [Google Scholar] [CrossRef]
  24. Kossyi, I. Kinetic scheme of the non-equilibrium discharge in nitrogen-oxygen mixture. Plasma Sources Sci. Technol. 1992, 1, 207. [Google Scholar] [CrossRef]
Figure 1. Two-dimensional axisymmetric effective section of the insulator.
Energies 17 04247 g001
Figure 2. The geometry and mesh of the computational domain.
Energies 17 04247 g002
Figure 3. Equipotential profiles on computational domain at t = 100 ns. (a) Without grading rings. (b) With one grading ring. (c) With two grading rings.
Energies 17 04247 g003
Figure 4. Two–dimensional electric field distribution (kV/cm) on computational domain at t = 100 ns. (a) Without grading rings. (b) With one grading ring. (c) With two grading rings.
Energies 17 04247 g004
Figure 5. Electric field distribution along a polymeric insulator with and without grading rings at t = 100 ns.
Energies 17 04247 g005
Figure 6. Two-dimensional electron density distribution (1/m3) along the insulator surface from the triple junction near the HV electrode, without grading rings at different simulation times. (a) At 0.01 ns. (b) At 1.0 ns. (c) At 25 ns. (d) At 50 ns. (e) At 75 ns. (f) At 100 ns.
Energies 17 04247 g006
Figure 7. Distribution profiles of the surface charge density along leakage distance with and without grading rings at t = 100 ns.
Energies 17 04247 g007
Figure 8. Distribution profiles of surface potential along leakage distance with and without grading rings at t = 100 ns.
Energies 17 04247 g008
Table 1. Geometrical characteristics of insulator.
Leakage distance800 mm
Dry arcing distance265 mm
Large shed radius (D)48.9 mm
Small shed radius (d)33.2 mm
Space between two sheds (p)24.7 mm
Shed number7
Table 2. Material properties used in simulation.
MaterialsElectrical Conductivity (S/m)Relative Permittivity
Air 1.0 × 10 13 1.0
Fiber glass 1.0 × 10 14 7.2
Silicon rubber 1.0 × 10 12 4.3
Metal fittings 1.1 × 10 6 1.0
Table 3. Minimal reaction set (units of two-body reaction rates—cm3/s and three-bodies—cm6/s). Electron temperature T e given in eV [20].
Reaction TypeReactionRate Expression
Impact ionization O 2 + e O 2 + + 2 e Townsend coefficients (Bolsig+ code)
Impact ionization N 2 + e N 2 + + 2 e Townsend coefficients (Bolsig+ code)
Electron attachment O 2 + O 2 + e O 2 + O 2 1.9 × 10 30 0.026 / T e exp 1 0.026 / T e · 7 / 3
O 4 + production N 2 + O 2 + O 2 + N 2 + O 4 + 2.4 × 10 30
Three-body recombination N 2 + O 2 + O 4 + N 2 + 3 O 2 2.0 × 10 25
Three-body recombination N 2 + O 2 + O 2 + N 2 + 2 O 2 2.0 × 10 25
Impact dissociation e + O 2 + 2 O 4.2 × 10 9 exp 5.6 / T e
Photoionization O 2 + h ν e + O 2 + Calculated by Helmholtz equation set
Disclaimer/Publisher’s Note: The statements, opinions and data contained in all publications are solely those of the individual author(s) and contributor(s) and not of MDPI and/or the editor(s). MDPI and/or the editor(s) disclaim responsibility for any injury to people or property resulting from any ideas, methods, instructions or products referred to in the content.

