Article

Multi-Scenario-Based Strategic Deployment of Electric Vehicle Ultra-Fast Charging Stations in a Radial Distribution Network

by
Sharmistha Nandi
1,
Sriparna Roy Ghatak
1,
Parimal Acharjee
2 and
Fernando Lopes
3,*
1
School of Electrical Engineering, KIIT Deemed to be University, Bhubaneswar 751024, India
2
Electrical Engineering Department, National Institute of Technology, Durgapur 713209, India
3
National Laboratory of Energy and Geology, 1649-038 Lisbon, Portugal
*
Author to whom correspondence should be addressed.
Energies 2024, 17(17), 4204; https://doi.org/10.3390/en17174204
Submission received: 30 July 2024 / Revised: 14 August 2024 / Accepted: 21 August 2024 / Published: 23 August 2024
(This article belongs to the Section E: Electric Vehicles)

Abstract

:
In the present work, a strategic multi-scenario EV ultra-fast charging station (CS) planning framework is designed to provide advantages to charging station owners, Distribution Network Operators, and EV owners. Locations of CSs are identified using zonal division and the Voltage Stability Index strategy. The number of chargers is determined using the Harris Hawk Optimization (HHO) technique while minimizing the installation, operational costs of CS, and energy loss costs considering all the power system security constraints. To ensure a realistic planning model, uncertainties in EV charging behavior and electricity prices are managed through the 2m-Point Estimate Method. This method produces multiple scenarios of uncertain parameters, which effectively represent the actual dataset, thereby facilitating comprehensive multi-scenario planning. This study incorporates annual EV and system load growth in a long-term planning model of ten years, ensuring the distribution network meets future demand for sustainable transportation infrastructure. The proposed research work is tested on a 33-bus distribution network and a 51-bus real Indian distribution network. To evaluate the financial and environmental benefits of the planning, a cost-benefit analysis in terms of the Return-on-Investment index and a carbon emission analysis are performed, respectively. Furthermore, to prove the efficacy of the HHO technique, the results are compared with several existing algorithms.

1. Introduction

Electric Vehicles (EVs) are emerging as a rapidly advancing technology with global significance, driven by concerns over fossil fuel scarcity and environmental pollution. The extensive acceptance of EVs is hindered by the limited driving mileage of EVs, long charging duration, and lack of adequate charging arrangements, which is posing a challenge for EV users [1]. In this context, Ultra-fast charging stations are crucial for the widespread adoption of EVs due to their ability to provide a rapid charging experience comparable to the quick refueling process at gas stations [2]. One of the primary barriers to EV adoption has been the lengthy charging times compared to the few minutes it takes to refuel a conventional vehicle [3]. Ultra-fast chargers address this issue by significantly reducing charging times, making EV use more convenient and practical for everyday drivers. This is especially important for long-distance travel, where quick recharges are essential to maintain the continuity of trips without lengthy delays [3]. Governments worldwide are actively promoting the use of EVs and encouraging the establishment of public CSs. To ensure the success of this initiative, effective EV CS planning is necessary, which involves the careful selection of CS locations, as well as the determination of the adequate number of chargers that can be present in each CS [4]. The planning should be done in such a way that enhances user convenience, reduces concerns about vehicle range, integrates EVs into daily life, increases station utilization, and contributes to sustainable transportation solutions.
The CS cannot be placed arbitrarily or in every node of the electrical network as it can violate the power system constraints and increase the risk of grid overload [5]. The location of the CS should be determined wisely so that all areas of the network can be properly covered by placing the appropriate number of CSs. The determination of the superior number of chargers in a CS is also an important factor to look into because a huge number of chargers may also lead to power quality problems, voltage degradation, and increased power losses. On the other hand, an insufficient number of chargers may increase the station congestion and waiting time of the users [6]. Strategic placement of ultra-fast charging stations with a sufficient number of chargers allows substantial energy delivery in a short time, facilitating continuous travel and reducing extended stops. This enhances the overall travel experience and makes EVs more viable for long-haul journeys, encouraging more drivers to switch from gasoline vehicles to electric ones [7].
The planning of EVCSs is influenced by several uncertain factors, such as variable EV charging demand, variation in charging time, unpredictable user behavior, fluctuating energy prices, etc. To handle this, uncertainty modeling is essential during the planning of ultra-fast EVCSs as it helps in making accurate decisions [8]. In this context, multi-scenario planning is advantageous because it considers multiple scenarios of uncertain parameters, capturing the intermittent nature of variables. This approach reduces the burden and complexity of the program by providing a definite range of data points that represent the actual data more accurately [9]. By incorporating a range of potential outcomes, multi-scenario planning ensures that strategies are more resilient and better prepared to handle variability and uncertainty. Besides this, considering yearly EV growth and system load growth is crucial for planning charging stations to ensure the infrastructure can meet future demand [10]. As EV numbers increase, the need for more charging stations rises, while system load growth affects overall energy demand. Planning with these factors in mind ensures that the charging network remains efficient and capable of handling future requirements, supporting both EV adoption and commercial energy needs.
Although the advantages of ultra-fast charging stations are well-recognized, there is a notable scarcity of research focused on their planning from a power system operational standpoint as well as a CS owner’s standpoint [7]. Existing studies primarily highlight the benefits of ultra-fast charging in terms of reducing charging time and supporting EV adoption, but they often do not address the planning aspects related to station location, sizing, and impact analysis in terms of cost-benefit evaluation and emission analysis [11,12]. Addressing this gap is crucial, as a comprehensive understanding of these factors can significantly enhance the effectiveness and efficiency of ultra-fast charging infrastructure. In [13], the authors analyzed the impacts of ultra-fast charging stations on distribution networks (DN) in terms of voltage profile and current trends. In [8,14,15], the authors considered travel distance and arrival State of Charge (SOC) as uncertain parameters, while in [16], battery SOC and battery capacity were considered uncertain variables during the planning process. However, for robust planning, all the possible uncertain parameters should be taken into account, which is largely missing in previous studies. Again, in [14,17,18], the authors used a scenario generation technique, the Monte Carlo Simulation method, to handle the uncertainty, which generates a huge number of scenarios leading to computational inaccuracy. In contrast, the 2m-Point Estimate Method (2m-PEM) is more efficient for scenario generation as it gives accurate results, is more stable, and is less sensitive to the sample size [8]. Therefore, in the current study, the 2m-PEM is adopted to handle different uncertainties related to EVCS planning, such as vehicle driving distance, battery SOC, battery capacity, charging time, and varying electricity prices. In [19], the authors minimized the power loss, voltage profile degradation, and installation cost of the CS while determining the optimal size of the CS. Additionally, locations of the CSs were obtained to use the Balance Mayfly Algorithm. In [20,21], the authors identified the location of the CS using PSO and Grey Wolf Optimization techniques while minimizing the power loss of the network. The authors of [22,23,24] addressed the benefits only from the CS owner’s point of view by minimizing installation and operational costs during the planning of CS.
From the literature, it is evident that, in some papers, researchers had addressed the advantages from the CS owner’s point of view while some authors had addressed the Distribution Network Operator’s (DNO’s) aspects. However, for comprehensive EVCS planning, it is crucial to consider all the objective functions like voltage profile, power loss, and costs related to CSs in terms of installation and operational costs. This will ensure benefits to both CS owners and DNOs. In [25,26,27,28,29,30], the authors identified the location for the CS placement using several optimization techniques like the Arithmetic Optimization Algorithm, PSO, Teaching Learning Based Optimization, and Grey Wolf Optimization algorithm. The results reveal that CSs are often placed on consecutive buses, leaving the majority of the network uncovered. However, for superior EV user services, CSs should not be concentrated in one place. Rather, they should be placed in a distributed manner to cover the whole network. Therefore, in the proposed planning, the CSs are allocated strategically throughout the planning area to reduce the range anxiety of the EV users. On the other hand, in previous research [22,23,24,25,29,30], the authors did not account for the EV growth and system load growth of the system during the planning of charging stations. However, this integration is essential for long-term planning to ensure that the infrastructure can accommodate future demands effectively, maintain grid stability, and support the sustainable expansion of the EV network. Soft computing algorithms are robust, adaptive in nature, and very efficient in handling the complexity of real-world problems. The authors of [22,24,27,31] used some traditional techniques like Genetic Algorithm (GA), Particle Swarm Optimization (PSO), and Cuckoo Search Algorithm to determine the size of EVCSs. However, these techniques are often facing certain challenges like parameter tuning challenges, lower convergence rates, lack of robustness, etc. To mitigate these limitations, in the proposed planning model the optimal number of chargers is determined using the Harris Hawk Optimization (HHO) technique as it exhibits a balanced exploration and exploitation phase [32]. In [33,34], the authors used several simulation tools like the CARLA simulator to model the realistic driver behavior.
Besides this, the impact analysis of the planning in terms of cost-benefit analysis and emission evaluation is also necessary to prove the superiority of the model [7]. Cost-benefit analysis helps CS owners and DNOs to make informed decisions by comparing the financial costs and benefits associated with the CSs. This helps to determine whether the investments are economically viable or not [35]. Meanwhile, emission evaluation is also crucial for assessing the environmental impact of EV infrastructure. Together, these analyses ensure that the planning is financially beneficial and environmentally sustainable, which is largely missing in the previous work [36].
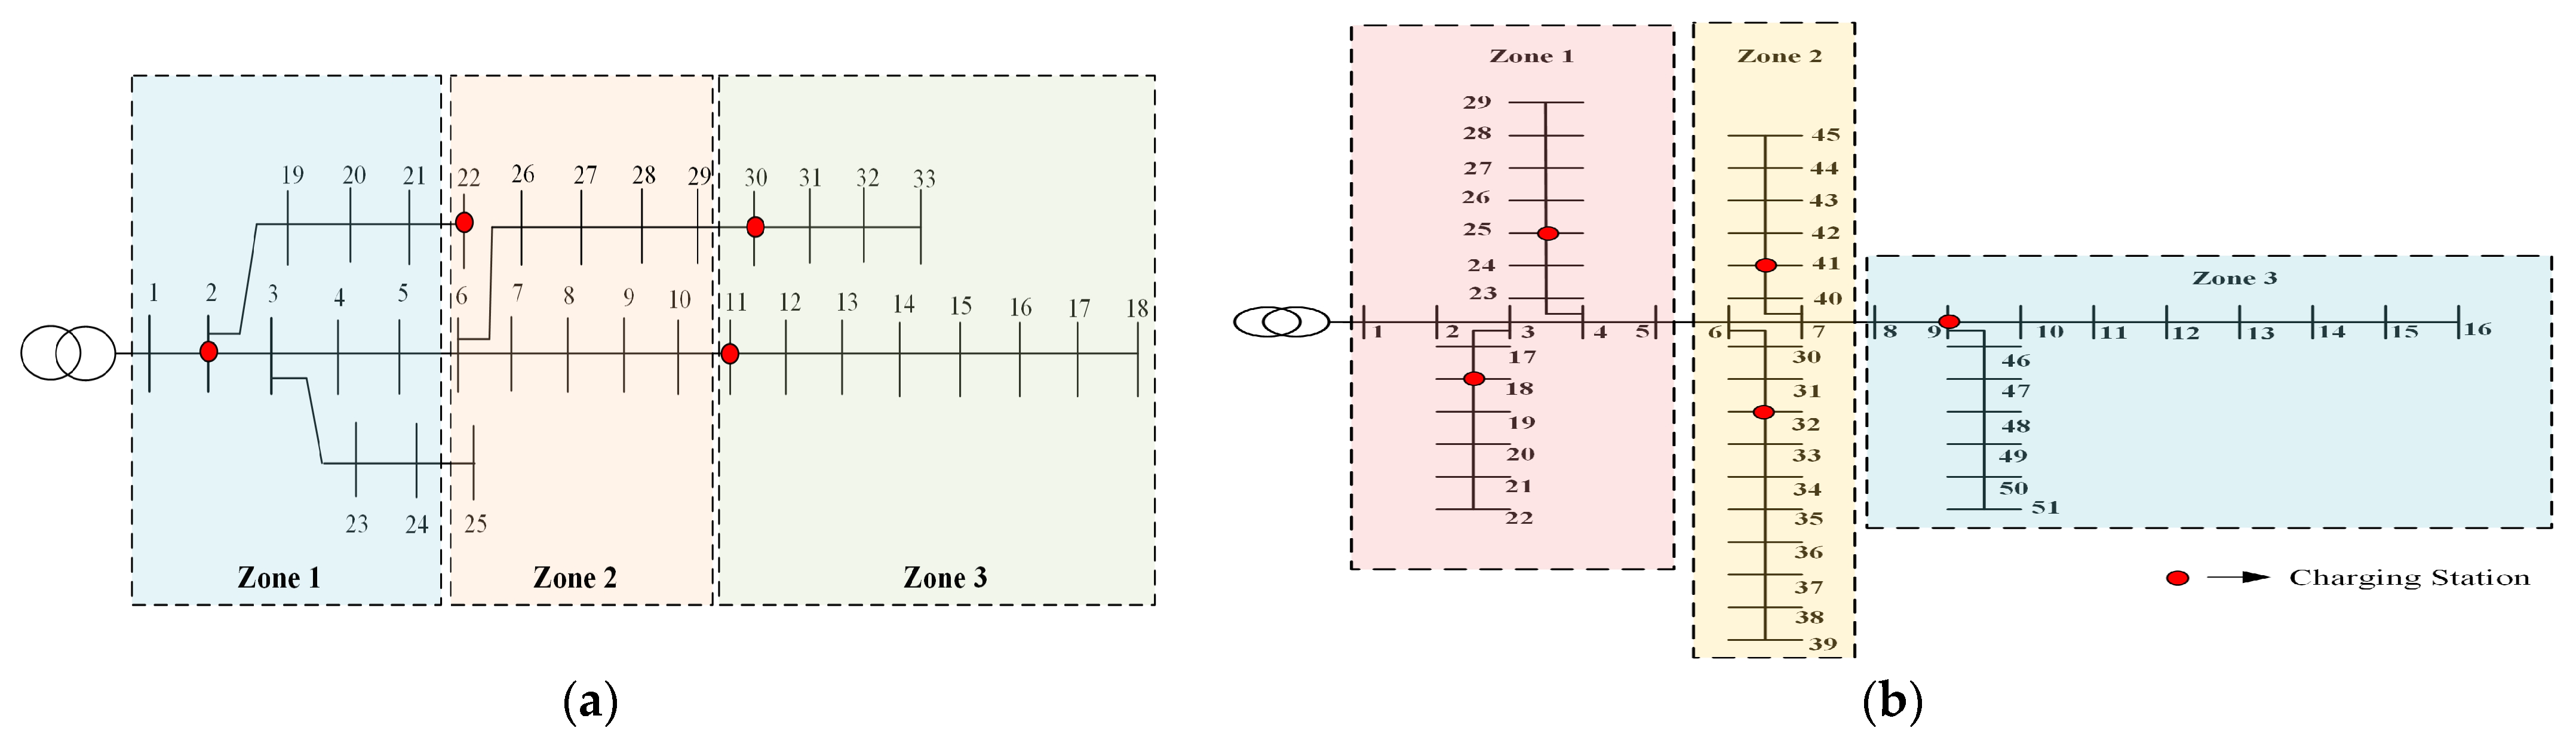
The research presented herein addresses a critical gap in the field of planning ultra-fast EVCS. To the best of the authors’ knowledge, the strategic multi-scenario-based planning of ultra-fast EVCSs has not been explored before from the perspective of CS owners, DNOs, and EV owners. In the present study, CS locations are identified using zonal division and the Voltage Stability Index (VSI) strategy to ensure an effective EV service by deploying the CS throughout the planning area. The overall work is tested on a 33-bus radial DN and a 51-bus real Indian rural DN [37,38]. The optimal number of chargers present in each CS is determined using the HHO technique while minimizing the installation, operational cost of the CS, and energy loss cost to provide advantages to the CS owners and DNOs. To handle the unpredictable EV charging behavior and fluctuating energy prices, the 2m-PEM is employed. For more practical analysis, new ultra-fast charging compatible vehicles available in India are used for the analysis. Further, an analysis of the revenue generated from selling electricity to EV users is conducted alongside a cost-benefit assessment to demonstrate the profitability of the proposed methodology. Additionally, to assess the social benefit, carbon emissions from both the EV and conventional vehicles are quantified.
The novelty of this research lies in its comprehensive approach, which not only considers the technical feasibility of ultra-fast CSs pertaining to voltage deviation, power loss, power flow constraints, etc., but also addresses economic and environmental aspects, which is crucial to CS owners and DNOs. Additionally, to alleviate range anxiety among EV users, a zonal division and VSI-based CS deployment strategy is adopted, featuring 150 kW ultra-fast chargers at all CSs. By highlighting this unexplored area, this research aims to pave the way for enhanced strategies that can empower DNOs to efficiently plan future power system networks. Moreover, a cost-benefit analysis is evaluated using the Return on Investment (ROI) index, which helps the CS owners determine the viability and profitability of their investments in the planning. Furthermore, ultra-fast chargers significantly enhance EV usability by reducing charging time, improving convenience for long-distance travel, and supporting high-demand scenarios such as peak travel times of EV users.
To address the research gap drawn from the literature survey, the main contributions of the research work are as follows:
a. 
Considering practical aspects like annual EV growth and system load growth, a comprehensive multi-scenario-based long-term planning model of EV ultra-fast CSs is developed, taking into account the techno-economic and social benefits of different stakeholders while satisfying power system security constraints;
b. 
To enhance the realism of the planning, uncertainty modeling is performed using real data of electricity prices and data related to new ultra-fast charging compatible EVs. To efficiently capture the intermittent nature of uncertain variables, multiple scenarios are generated using the 2m-PEM by employing the mean and standard deviation of a large dataset;
c. 
Considering the uncertain parameters, a unique objective function is formulated to minimize the installation cost, operational cost of CSs, and energy loss while determining the optimal number of ultra-fast chargers using the HHO technique. To evaluate the financial and environmental benefits of the planning, an ROI-based cost-benefit analysis and a carbon emissions assessment are conducted;
d. 
To reduce the range anxiety of the EV user, a zonal division and VSI-based strategical placement technique are adopted to deploy the ultra-fast CSs in a distributed manner across the entire planning area.

2. Uncertainty Modelling

To increase the practicality of EVCS planning, it is essential to address the stochastic nature of both EV charging behavior and electricity prices. The charging behavior of an EV refers to the distance traveled by the EV before reaching the CS, SOC on arrival, EV charging time, etc.

2.1. Uncertain Parameters

The uncertain parameters considered in the current planning method are the EV driving distance (dd) before reaching the CS, SOC on arrival (SOC), battery capacity ( C a p b ) , and electricity prices ( C e l c ) . The SOC and the total charging time ( t c h ) [39] can be calculated using Equations (1) and (2):
S O C = 1 d d R G e v
t c h = 1 S O C × C a p b P c h × η b
where R G e v refers to the range of the EV i.e., the maximum distance the EV can cover with 100% SOC, P c h denotes the power rating of chargers, which is taken as 150 kW, and η b represents the efficiency of the battery, which is considered as 95% in the current planning. Below are the details of the uncertain variables considered for this planning problem.
EV distance traveled (Miles). In this problem, the distance (dd) traveled by the vehicle is considered to follow a normal distribution. The mean (μ) is considered as 52.5, and the standard deviation (σ) is taken as 20.1 [14].
f d d , μ , σ = 1 σ   2 π e d d μ 2 2 σ 2
Battery capacity (kWh). The battery capacity ( C a p b ) of the vehicle follows a normal distribution, with a μ of 82.1 and a σ of 8.561 [28]. The probability density function is defined as follows:
f C a p b , μ , σ = 1 σ 2 π e C a p b μ 2 2 σ 2
Electricity price (Rs/kWh). The electricity price follows the normal distribution where μ and σ are taken as 5.06 and 0.93, respectively [40]. The probability density function can be expressed as follows:
f C e l c , μ , σ = 1 σ   2 π e C e l c μ 2 2 σ 2

2.2. 2m-Point Estimate Method

This study employs the 2m-PEM to manage the uncertain parameters related to the CS planning model. Following the determination of the μ and σ, the 2m-PEM generates two probability concentrations ( C p ) for each uncertain input variable, as given in Table 1. Consequently, 2 × m scenarios can be produced, where m denotes the number of uncertain parameters. Scenario generation can simplify programming complexity and reduce computational burden by producing discrete data points that represent the actual dataset. In the present analysis, three uncertain variables are considered, resulting in six possible scenarios. The C p of each uncertain parameter is calculated as follows:
C p = μ + ζ C p × σ p = 1 ,   2
where ζ C p is the p t h standard location and can be calculated using Equation (7):
ζ C p = ε z 2 + 1 3 p × m + ε z 2 2 p = 1 ,   2   and   m = 3
where ε z refers to the skewness coefficient of the uncertain parameters. In the current planning model, ε z is taken as 10%.

3. Voltage Stability Index (VSI)

The VSI is a crucial tool for evaluating the voltage stability of power systems, particularly under economic and operational constraints. It provides a straightforward, quick, and effective method to measure how close a power system is to voltage collapse, identifying the most vulnerable buses within the network. Figure 1 shows the one-line diagram of a radial DN.
By analyzing the power flow and impedance characteristics of the radial DN, as depicted in Figure 1, the VSI is calculated as given in Equation (8):
V S I   r = V s 4 4 ×   P r × X s r Q r × R s r   2 4 ×   P r × R s r + Q r × X s r × V s 2
where s is the sending end bus, r is receiving end bus, V S I   r represents the VSI of that receiving end bus, R s r denotes the line impedance between the sending and receiving end bus, and X s r represents the line reactance between the sending and receiving end bus. V s denotes the voltage at sending end bus while P   r and Q   r represent the total active power and reactive power fed through the receiving end bus. For safe power system operation, the value of the VSI must be higher than 0. The bus whose VSI value is close to zero is considered an unhealthy bus while the bus with a VSI value close to one is considered a healthy bus.

4. Objective Function and Constraints

This section thoroughly describes the objective functions and constraints employed in the multi-scenario planning of ultra-fast charging stations.

4.1. Objective Function

In the present work, the objective functions are developed considering the benefits of the CS owner and the DNO. Further, to make the analysis more practical, increasing EV penetration and system load growth is also taken into account while formulating the objective function. The uncertain charging time and fluctuating electricity prices are also incorporated into the objective function. The details regarding the objective functions are as follows:
(a)
Cost of charging station ( C C S )
This paper aims to minimize the cost of the CS, which is advantageous for the EVCS owner. The total cost of the CS encompasses both installation ( C I N S ) and operational ( C O P R ) expenses, as detailed below:
C C S = C I N S + C O P R
Installation cost ( C I N S ). The installation cost is influenced by various factors, such as the total area of the CS ( A i c s ), expense of the site ( C A r ), the cost of chargers ( C c h ) , and additional charges related to the CS ( C o t h e r ). The total area required for the CS includes space for each charger ( A i c h ) and spaces for parking the vehicles ( A i p ). Additional costs encompass costs for a new electricity connection, technician services, labor, and management [6]. The overall installation cost of the CS is calculated using Equations (10)–(12):
C I N S = R c c i = 1 N c s A i c s × C A r + N i c h × C c h + C o t h e r
A i c s = A i c h × N i c h + A i p
where R c c is the cost conversion factor of the installation cost, operational cost, and energy loss cost, and can be calculated as follows:
R c c = w 1 + w N y r 1 + w N y r 1
where w denotes the discount rate and N y r indicates the total planning years. N c s and N i c h refer to the number of ultra-fast CSs and the corresponding number of chargers.
Operational cost ( C O P R ). Operational costs are determined by several factors, including the number of chargers, their power ratings ( P c h ), the total charging time at the station ( t c h ), and the electricity rates ( C e l c ) for buying the electricity. Operational costs are calculated for each scenario throughout all planning years using Equation (13):
C O P = y r = 1 N y r s n = 1 N s n R c c i = 1 N c s N i , y r , s n c h × P c h × t i , y r , s n c h × C i , y r , s n e l c × t s n
where t s n indicates the time period of each scenario.
(b)
Energy loss cost ( C E N G )
This study also aims to minimize energy loss costs, which is advantageous for the DNOs. Minimizing energy loss costs plays a pivotal role in boosting efficiency and conserving resources within power system planning and can be calculated as follows:
C E N G = y r = 1 N y r s n = 1 N s n R c c P y , s n L × t s n × C i , y r , s n e l c
where P L represents the overall power loss within the system.
Since the range of all the objective functions is different, to achieve an equivalent objective function, it is essential to normalize each objective function so that all the individual objective functions fall under the same scale [8]. In the current study, each individual objective function is normalized between 0 and 1 using Equation (15):
N O = O O m i n O m a x O m i n
where N O represents the normalized objective function and O m a x and O m i n indicate the maximum and minimum value of the individual objective function, respectively. The total objective function ( C T   ) is mathematically represented as follows:
C T = m i n [ N C C S + N C E N G ]
The average number of EVs ( N E V ) that can be accommodated in each charging station over 24 h can be calculated from the number of chargers present in each CS and the time required to charge the vehicle as shown below [41]:
N i EV = N i c h × 24 t c h

4.2. Constraints

Equality and inequality constraints are vital aspects of the power system that need to be maintained for satisfactory power system operation. For the placement and sizing of EVCS, constraints related to EVs and ultra-fast CSs are given below.

4.2.1. Equality Constraints

Power balance constraints. The total power demand of a charging station, along with the existing system load ( P s y s t ) and the system’s power losses ( P L ), should not exceed the available generating power ( P G r i d ). The following power balance equation must be maintained to ensure fair and efficient grid operation:
y r = 1 N y r s n = 1 N s n i = 1 N c s N i , y r , s n c h × P c h + P y r , s n s y s t + P y r , s n L = P y r , s n G r i d

4.2.2. Inequality Constraints

Power flow constraints. Power flowing ( P F l ) through each line (l) of the DN should not exceed the maximum limit ( P F m a x ) for safe and secure operation as given below:
P F y , s c l < P F m a x
Voltage constraints. The voltage magnitude (V) of each bus of the DN should be maintained between the minimum ( V m i n ) and maximum ( V m a x ) limit as expressed in Equation (20). In the present planning, V m i n is taken as 0.9 p.u. while V m a x is considered as 1.1 p.u.:
V m i n V y , s c V m a x
Battery SOC constraints. To extend the lifespan of the vehicle’s battery, it is essential to keep the battery’s SOC within its upper ( S O C m a x ) and lower limits ( S O C m i n ). The constraint for the battery SOC can be expressed as follows:
S O C m i n S O C S O C m a x
where S O C m i n and S O C m a x are taken as 20% and 90%, respectively, for the present planning problem.
Number of charger constraints. The number of ultra-fast chargers at each station should be kept within a specified minimum ( N m i n c h ) and maximum ( N m a x   c h ) limit as given in Equation (22):
N m i n c h N i c h N m a x   c h ;   i = 1 ,   2 , ,   N c s
where N m i n c h and N m a x   c h are taken as 1 and 3, respectively.
Number of CS constraints. In the current planning problem, the minimum number of CSs ( N c s   m i n ) required in each zone of the planning area should follow the constraints as shown below:
  N c s N c s m i n
where N c s   m i n is considered as 1, i.e., a minimum of one ultra-fast CS should be present in each zone of the planning area for superior EV services.

5. Problem Formulation

Determining the favorable location for CSs and the optimal quantity of chargers within each station is crucial for efficient power system operation during the planning of EV ultra-fast CSs. To address the practical challenges in the placement and sizing of CSs, a 33-bus radial DN and a real 51-bus Indian rural DN are employed as the test system for the analysis. The input parameters of the problem are the bus data and line data of the electrical network, uncertain EV charging behavior, and fluctuating electricity prices. The appropriate location and optimal number of chargers are the output parameters of the current problem. The locations are strategically identified using zonal division and the VSI with the aim of reducing range anxiety by placing a suitable number of CSs in each zone across the network. In this paper, the objective function is developed to benefit the CS owners and DNOs. The multi-scenario planning of EV ultra-fast CSs is resolved by taking the following objectives:
(a)
Allocation of the CS in a distributed manner throughout the network, which reduces the range anxiety of the EV users;
(b)
Minimization of installation and operational costs of the CS, which is beneficial from the CS owner’s point of view;
(c)
Minimization of energy loss cost, which benefits the DNOs.

6. Harris Hawk Optimization Technique

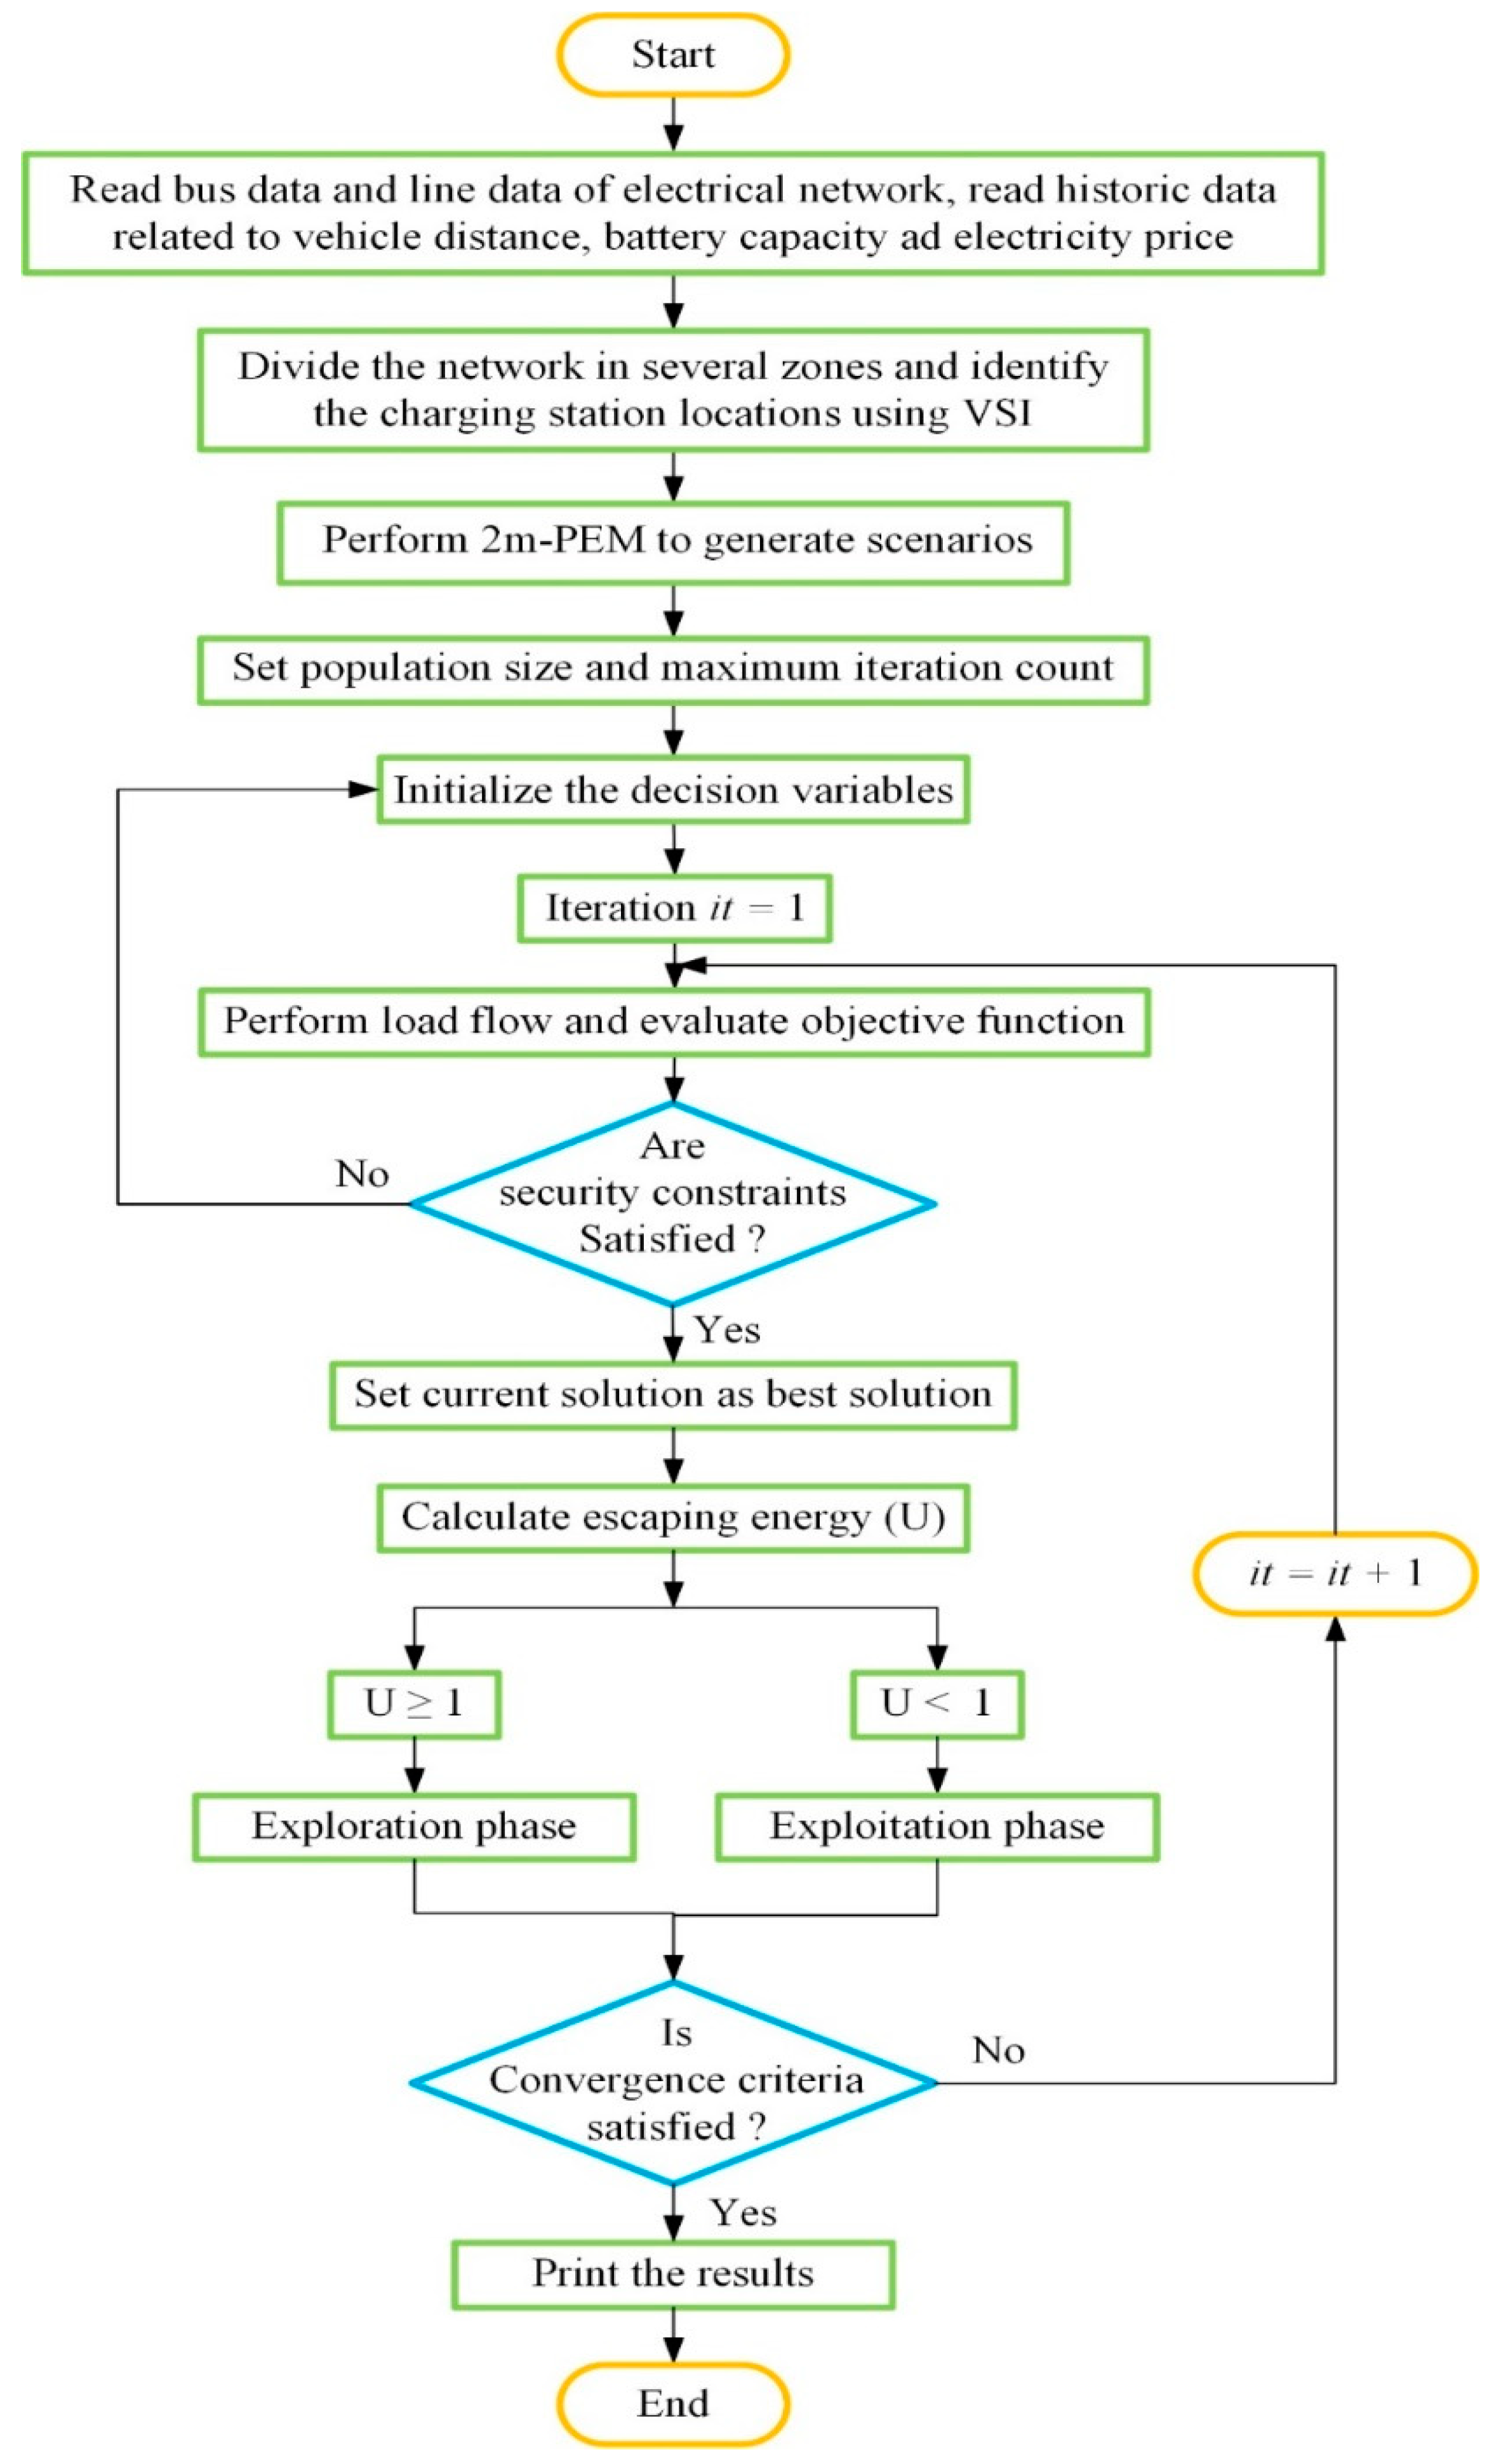
An effective optimization technique must be capable of modeling complex relationships while maintaining a proper balance between the exploration and exploitation phases. Failing to achieve this balance may result in the algorithm becoming trapped in local optima. With this approach in mind, the HHO technique is utilized to address the current multi-scenario planning problem. The conventional HHO technique is outlined below.
HHO is a nature-inspired, population-based optimization method. It draws inspiration from the hunting strategies and cooperative behaviors of Harris hawks [32]. The algorithm finds the optimal solution through two main phases: exploration and exploitation.
The transition between the exploration phase and the exploitation phase depends on the value of escaping energy ( U ). The escaping energy is calculated as follows:
U = 2 U 0 × U 1
U 1 = 1 i t i t m a x
where U 0 denotes the initial energy of the target and i t and i t m a x represent the current and maximum number of iterations, respectively.
If U 1 , the algorithm shifts to the exploration phase; otherwise, it enters the exploitation phase.
Exploration phase: During this phase, hawks thoroughly explore the various locations based on the position of the other family member (x ≥ 0.5) and based on the position of the target (x < 0.5).
P i t + 1 =   P r n d i t r 1 × P r n d i t 2 r 2   P i t , x 0.5 P r a b i t P a v g i t r 3 L B + r 4 u b l b , x < 0.5
P a v g i t e r = 1 T q = 1 T P q i t
where P ,   P r n d , and P a v g indicate the current position, random position, and average position of hawks, respectively, and P r a b refers to the position of the target or rabbit. x, r 1 , r 2 ,   r 3   a n d   r 4 are the random values between 0 and 1, lb and ub represent the lower and upper bound, respectively, and T denotes the total number of hawks.
Exploitation phase: The exploitation phase takes place in four stages. The details of the stages are given below.
Soft besiege. This step is performed by the hawks when r ≥ 0.5 and | U | ≥ 0.5.
P i t + 1 = P i t U ×   J   P r a b i t P i t
P i t = P r a b i t P i t
where J = 2 1 r 5 indicates the jump strength of the rabbit and r and r 5 represents the random value between 0 and 1, P represents the difference in the position of the hawk and rabbit.
Hard besiege. The hawk performs hard besiege when r ≥ 0.5 and | U | < 0.5.
  P i t + 1 = P r a b i t U P i t
Soft besiege with progressive rapid dives. This step occurs when | U | ≥ 0.5 and r < 0.5.
  P i t + 1 = K i f   K < P i t L i f   L < P i t
K = P r a b i t U × J P r a b i t P i t
At this stage, the HHO technique integrates the concept of levy flight ( l f ) to mimic the zigzag deceptive movements observed in rabbits during their escape phase:
  L = V + S × l f D
where D refers to the dimension of the search space and S refers to the random vector.
Hard besiege with progressive rapid dives. This step occurs when | U | < 0.5 and r < 0.5.
P i t + 1 = K i f   K < P i t L i f   L < P i t
K = P r a b i t U × J P r a b i t P a v g i t
L = V + S × l f D
The l f can be calculated using (37):
l f P = 0.01 × u × δ v 1 β ,   δ = Γ ( 1 + β ) × s i n π β 2 Γ 1 + β 2 × β × 2 β 1 2 1 β
where u and v are the random values between 0 and 1, and β is a constant whose value is set to 1.5 as given in [32].

7. Methodology

In the current study, multi-scenario planning of EVCSs is developed where CSs are allocated strategically. The optimal number of chargers present in each CS is determined using the HHO technique. The methodology of the proposed planning model is discussed below.

7.1. Implementation of VSI and Zonal Division for Finding the Suitable Location of CSs

In the proposed model, zonal division and the VSI are used to maximize network coverage by strategically deploying CSs throughout the network. This approach aims to provide seamless user service and alleviate EV user’s range anxiety. First, the network is divided into several zones based on the size of the network. After that, the VSI value is calculated for each bus using Equation (8). Based on the VSI values, healthy buses are identified in each zone of the network. Finally, the CSs are allocated to the healthier buses in each zone of the network to ensure a safe and secure power system operation.

7.2. Implementation of HHO for Finding the Optimal Number of Chargers

After determining the suitable position for EVCS installation, the optimal size of the CS is calculated using the HHO technique mentioned in Section 6. The number of chargers required in each CS is taken as the decision variable in the current study. This study aims to minimize the installation cost, operational cost, and energy loss cost in order to benefit both CS owners and DN operators while satisfying the security constraints. The EV charging energy demand depends on the number of chargers, charging time, and the power rating of the chargers, as given below:
  E V   e n e r g y   d e m a n d = N c h × P c h × t c h
The charging time of an EV is influenced by several uncertain factors, such as battery capacity, vehicle travel distance, and battery SOC. Therefore, in the present work, vehicle driving distance, battery SOC, battery capacity, charging time, and electricity prices are considered uncertain parameters. To address the stochastic nature of the planning, 2m-PEM is employed to generate multiple scenarios of uncertain parameters. The scenarios are incorporated as input to the optimization technique to determine the optimal number of chargers while minimizing the operational cost and energy loss cost. For simulation purposes, a population size of 100 and a maximum iteration of 100 are chosen. To check the consistency of the solution, the optimization process is repeated for 30 independent runs. The stopping criterion for the optimization is the maximum number of iterations. The lower and upper limits of the number of chargers are taken as 1 and 3, respectively. The flowchart of the methodology is shown in Figure 2, while the solution of decision variables is shown below:
Solution   matrix = N 1,1 C h , N 1,2 c h , . . . N 1 , n c h N 2,1 C h , N 2,2 c h , . . . N 2 , n c h . . . N N , 1 c h , N N , 2 c h , . . N N , n c h
where N denotes the population number and n indicates the dimension of the problem or number of CSs considered in the proposed planning.

8. Results and Discussion

In this section, a comprehensive discussion regarding the outcomes of the current planning problem is performed.

8.1. Test System and Input Data

In order to cater to the CS owners, DNOs, and EV users, a comprehensive planning approach is proposed. The problem related to the CS placement is solved using zonal division and the VSI strategy to ensure comprehensive coverage of the network and enhance EV user satisfaction. The optimal number of chargers present in each CS is determined using the HHO technique to minimize the installation cost, operational cost of the charging station, and energy loss. The feasibility of the proposed method is tested on a 33-bus radial DN and a 51-bus real Indian DN. The 33-bus system consists of 33 buses and 32 lines with a base voltage and base power of 12.66 kV and 100 MVA, respectively [37]. The 51-bus Indian rural DN has 51 buses and 50 lines with a base voltage of 11 kV and a base power of 100 MVA [38]. The real data of the vehicle battery SOC and driving distance are obtained from the National Travel Survey data of the UK [42]. The information on battery capacity and vehicle range used in the study is based on EV models with ultra-fast charging facilities, including the Kia EV 6 [43], BMW iX [44], and Porsche Taycan [45]. In the first year, a total of 300 vehicles were used for the analysis, and a 15% increase in EV penetration was considered for subsequent years to accommodate the increasing EV growth. To ensure effective long-term planning, the modeling process integrates an annual system load growth rate of 6.8%.
Considering the uncertainties related to the distance traveled by the EV, SOC on arrival, battery capacity, charging time, and electricity price within every annual interval, six scenarios are generated using 2m-PEM. The entire time frame for the planning phase is 10 years. In the proposed research, the analysis is performed for an ultra-fast charger with a power rating of 150 kW. Table 2 shows the different input parameters related to the proposed multi-scenario planning model.
The simulation is conducted using MATLAB—version 9.8 (R2020a) on a computer equipped with an Intel i7 processor running at a clock speed of 1.3 GHz and 8 GB of RAM.

8.2. Analysis of Results

Results of CS location obtained using Zonal division and VSI strategy. In order to deploy the CS in a distributed manner across the network, in the proposed method the CS locations are identified using a combination of zonal division and VSI strategy.
Figure 3a,b shows the results of the strategic placement in the 33-bus and 51-bus radial DNs, respectively. The result of the VSI values before and after the allocation of CSs for both test systems are represented in Figure 4a,b. After dividing the 33-bus and 51-bus network into three zones, as shown in Figure 3, healthy buses are selected for CS allocation in each zone based on their VSI values. Further, it is observed from Figure 3 that due to a higher load density, more nodes are chosen for CSs in Zone 3 of the 33-bus DN and in Zones 1 and 2 of the 51-bus DN to accommodate the increased EV demand.
To demonstrate the efficacy of the proposed technique, a comparative analysis is conducted between the results of the proposed method and those obtained from the optimization technique. For this comparison, the locations are determined using the HHO technique, with the aim of minimizing the total cost of the CSs and energy loss without violating security constraints. During the analysis, it is assumed that each CS has a capacity of 150 kW. The result of the location obtained using the HHO technique for both 33-bus and 51-bus systems is given in Figure 5a,b, respectively. Using the HHO technique, some of the identified buses for CS placement are adjacent to each other (i.e., 10, 11, 24, and 25 for the 33-bus system and 19, 20, 32, and 34 for the 51-bus system). On the other hand, a vast portion of the network does not have a single CS, as shown in Figure 5. Though optimization techniques are suitable from the electrical operation point of view, the consecutive allocations are not favorable for EV users, as they increase range anxiety. Therefore, strategic placement ensures that CSs are allocated across the network, avoiding consecutive placements. This comprehensive coverage reduces range anxiety by ensuring that CSs are readily accessible throughout the entire area while also meeting the electrical operation requirements.
Results of the optimal size of the CS obtained using the HHO technique. To develop a robust planning framework, benefits should be provided not only to the EV users but also to the CS owners and DNOs. Therefore, after determining the CS locations strategically, the number of chargers present in each EVCS is obtained using the HHO technique while adhering to all the security constraints. The proposed methodology aims to minimize the total cost related to the CS and energy loss to provide advantages to both the CS owners and DNOs, respectively.
The results of the CS locations, the corresponding number of ultra-fast chargers present in each CS, and the total number of EVs that would use the designated CSs for both 33-bus and 51-bus test systems are given in Table 3. Using the ultra-fast charger, each vehicle takes about 10 min to charge up to 90%. Therefore, in each CS, an average of 144 EVs can be charged daily for both the 33-bus and 51-bus systems over 24 h. From Table 3, it is observed that because of the presence of ultra-fast chargers, each CS is equipped with one charger that can efficiently serve the EV charging demand in the designated zone for both the 33-bus and 51-bus systems. The objective function results in terms of installation cost, operational cost, and energy loss cost for both test systems are presented in Table 4.
Impact Analysis. To demonstrate the financial benefits of the proposed methodology, a cost-benefit analysis in terms of the ROI Index is conducted for both the 33-bus and 51-bus test systems. The ROI index is calculated over a period of 10 years. This analysis is essential for assessing the desirability of the investment. The ROI can be calculated as follows:
R O I = T o t a l   b e n e f i t T o t a l   c o s t
An ROI index greater than 1 signifies that the benefits surpass the costs, indicating that the investment is economically viable. Calculating the ROI index is essential for planning engineers, as it aids in determining which approach to adopt by comparing the returns on investment. Calculating the ROI index allows engineers to evaluate the effectiveness of various options and helps to determine when the benefits surpass the costs. In the proposed planning framework, the costs include installation expenses, operational costs, and energy loss costs, while the benefits come from selling the electricity to EV owners at a rate of INR 15 per kWh. Importantly, the installation cost is only considered for the first year of the planning period, ensuring that the initial capital investment is captured upfront. Subsequent years focus on the ongoing operational costs, energy loss costs, and benefits from electricity sales. Table 5 shows the result of the ROI index of the proposed ultra-fast CS planning for the test networks after 10 years. From the Table, it is observed that, in both the 33-bus and 51-bus systems, the ROI index value is greater than 1. After conducting calculations, it is determined that the break-even point is achieved in the fifth year of planning, and benefits surpass the costs in the sixth year, as indicated by the ROI index evaluation.
To highlight the environmental advantages of EVs in terms of carbon emissions, an analysis is conducted comparing the carbon dioxide (CO2) emissions from EVs and conventional vehicles. In the present planning problem, three different types of newly used EVs, i.e., Kia EV 6, BMW iX, and Porsche Taycan, are considered for the analysis. It is assumed that in the planning area, a total of 300 vehicles are present, of which 26% are a Porsche Taycan, 30% are a BMW iX, and 44% are a Kia EV 6. It is also assumed that 0.91 kg of CO2 is emitted for each kWh of electricity consumption for each EV [46], and 2.77 kg of CO2 is released per liter consumption of petrol in the case of a conventional vehicle [34]. Table 6 shows the comparative results of CO2 emission between EVs and conventional vehicles of the same model. From Table 6, it can be observed that the proposed method results in a 40% reduction in CO2 emissions by EVs compared to the conventional models of the same vehicles. This reduction in CO2 emissions highlights the effectiveness of the proposed planning in promoting EV adoption and advancing toward a more sustainable solution.
Figure 6a,b illustrates the voltage profile before and after the allocation of EVCSs in the 33-bus and 51-bus DNs, respectively. From the Figures, it is observed that in both the test systems, the voltage is within the permissible limit, as given in Equation (19), after the deployment of the CS. Figure 7 shows the power loss after the allocation of CSs in the 33-bus and 51-bus DNs. The Figure reveals that more power loss occurred in the 33-bus DN compared to the 51-bus DN after the deployment of the EVCS.
The current planning model indicates that each CS can accommodate an average of 144 vehicles per day while maintaining voltage security within acceptable limits, as shown in Figure 6. However, an increase in the number of EVs could degrade the voltage profile, potentially leading to grid instability. To address these challenges, grid reinforcement will be necessary to sustain superior power system performance and reliability. This could involve upgrading existing infrastructure, such as transformers and conductors, to handle the higher loads. Additionally, the integration of advanced technologies such as renewable energy sources, energy storage systems, and demand response programs will be essential to support the increased demand.
Therefore, the analysis underscores the effectiveness of the proposed methodology across all types of radial distribution systems, demonstrating its applicability and benefits for both test systems. The methodology effectively identifies suitable locations for CS placement and an optimal number of chargers, resulting in improved efficiency and cost-effectiveness, which benefits EV users, DNOs, and CS owners. Additionally, it leads to lower CO2 emissions in both test systems, contributing to greater environmental sustainability as compared to conventional vehicles.

8.3. Algorithm Comparison

In Figure 8, the comparative convergence characteristics of the HHO and other existing optimization algorithms are illustrated. Table 7 presents a comparison of the results regarding convergence rate, convergence time, μ, and σ across different algorithms for solving the planning of ultra-fast EVCSs. In Table 7, the convergence rate indicates the iteration number when the algorithm achieves convergence. The analysis reveals that HHO algorithms proved to be less expensive than other algorithms as it takes less time to converge for the current problem.
To showcase the effectiveness of the developed algorithm, a statistical analysis was performed, and the results are shown in Table 7. Since the current problem is a minimization problem, a better-quality solution is obtained by obtaining the minimum values of μ and σ. From the Table, it is observed that HHO has the lowest value for μ and σ among all the mentioned algorithms.
To prove the consistency of the proposed HHO technique, 30 independent runs are performed for each mentioned algorithm, including HHO. The consistency of all the algorithms is evaluated based on the maximum, minimum, and average results after 30 trials.
If the maximum, minimum, and average values are close to each other, the optimization technique is considered to be consistent. Table 8 shows that, in the proposed method, the difference between the maximum, minimum, and average values is less compared to other algorithms. Therefore, the HHO technique performs the best in terms of the consistency of the result.

9. Conclusions

In the present research work, a comprehensive multi-scenario planning model for EV ultra-fast CSs is developed over a period of 10 years to provide benefits not only to the CS owners but also to the DNOs and EV owners. The proposed work aims to minimize the total cost in terms of installation, operational cost, and energy loss cost, utilizing the HHO technique while satisfying security constraints. To enhance the practicality of the modeling, the proposed planning incorporates the annual EV growth and annual system load growth. To make the analysis more realistic, this study is performed considering the uncertainties that are handled by 2m-PEM. Incorporating multiple scenarios into the planning process effectively addresses the uncertainties of varying parameters by capturing their intermittent nature and providing a more realistic representation of actual conditions. This method simplifies the program by offering a flexible framework that can adjust to different situations.
The research work is tested on 33-bus DN and 51-bus real Indian DN. The test results reveal that the CSs are strategically positioned during the planning phase with the help of the zonal division and the VSI, ensuring comprehensive coverage of the area. The zone-wise division allows for the allocation of CSs across the entire network. The VSI helps to identify suitable bus locations, avoid adjacent placements, and ensure healthier bus selections, which will enhance the EV user’s satisfaction.
Again, the HHO technique effectively identifies the optimal number of ultra-chargers with minimum installation, operational, and energy loss costs. To evaluate the financial and environmental benefits of the planning, a cost-benefit analysis in terms of an ROI index and a carbon emission analysis is performed, respectively. The result of the ROI shows that the proposed model is financially viable as the break-even point is achieved in a fifth of the planning period. The carbon emission analysis shows that adopting EVs could reduce environmental pollution by emitting 40% less carbon dioxide in the environment compared to conventional vehicles. Furthermore, the average daily capacity of each CS has been evaluated, and from the analysis, it is revealed that the proposed planning framework effectively meets EV charging needs while adhering to security constraints. However, a significant increase in EV charging demand could violate the power system security constraints. This situation may necessitate grid reinforcement to ensure system reliability and maintain secure operations. Overall, the conclusion can be drawn that VSI-based zone-wise allocation of ultra-fast CSs addressed the EV user’s need and optimized the installation, operational, and energy loss costs, effectively addressing the CS owner’s and DNO’s needs, respectively.
To prove the efficacy of the HHO technique, a comparative assessment was conducted, considering other existing algorithms. The results confirmed that the proposed algorithm is reliable and effective, excelling in convergence rate, computational efficiency, solution quality, and consistency. In the future, simulation tools such as GridLAB-D, OpenModelica, and PowerFactory will be utilized to model realistic EV driver behavior, traffic patterns, and routing. These simulations will provide insights into how varying user demands and vehicle flows are managed and can also assess the impact on the distribution network. Additionally, future work will involve implementing simulation components for modeling electric vehicles, vehicle usage, charging station infrastructure, and demand-side management using the aforementioned simulation tools.

Author Contributions

Conceptualization, S.N., S.R.G. and P.A.; methodology, S.N., S.R.G. and P.A.; software, S.N.; validation, S.N., S.R.G., P.A. and F.L.; formal analysis, S.N., S.R.G., P.A. and F.L.; writing—original draft preparation, S.N. and S.R.G.; supervision, S.R.G., P.A. and F.L.; investigation, S.N., S.R.G., P.A. and F.L. All authors have read and agreed to the published version of the manuscript.

Funding

This research received no external funding.

Data Availability Statement

The data for the 33-bus DN and the 51-bus real Indian DN utilized in this study can be found in [36,37].

Acknowledgments

We extend our heartfelt gratitude to the School of Electrical Engineering, KIIT Deemed to be University, Bhubaneswar, for their unwavering support and encouragement.

Conflicts of Interest

The authors declare no conflict of interest.

References

  1. Chen, T.; Zhang, X.-P.; Wang, J.; Li, J.; Wu, C.; Hu, M.; Bian, H. A Review on Electric Vehicle Charging Infrastructure Development in the UK. J. Mod. Power Syst. Clean Energy 2020, 8, 193–205. [Google Scholar] [CrossRef]
  2. Ahmad, A.; Qin, Z.; Wijekoon, T.; Bauer, P. An Overview on Medium Voltage Grid Integration of Ultra-Fast Charging Stations: Current Status and Future Trends. IEEE Open J. Ind. Electron. Soc. 2022, 3, 420–447. [Google Scholar] [CrossRef]
  3. Leone, C.; Longo, M.; Fernández-Ramírez, L.M. Optimal Size of a Smart Ultra-Fast Charging Station. Electronics 2021, 10, 2887. [Google Scholar] [CrossRef]
  4. Cheng, J.; Xu, J.; Chen, W.; Song, B. Locating and Sizing Method of Electric Vehicle Charging Station Based on Improved Whale Optimization Algorithm. Energy Rep. 2022, 8, 4386–4400. [Google Scholar] [CrossRef]
  5. Nandi, S.; Ghatak, S.R.; Acharjee, P. Placement of EV Fast Charging Station in Distribution System Based on Voltage Stability Index Strategy. In Proceedings of the 2022 IEEE 6th International Conference on Condition Assessment Techniques in Electrical Systems (CATCON), Durgapur, India, 17 December 2022; pp. 46–51. [Google Scholar]
  6. Jin, Y.; Acquah, M.A.; Seo, M.; Han, S. Optimal Siting and Sizing of EV Charging Station Using Stochastic Power Flow Analysis for Voltage Stability. IEEE Trans. Transp. Electrif. 2023, 10, 777–794. [Google Scholar] [CrossRef]
  7. Yuan, N.; Yu, Z.; Zhang, Y.; Chang, H.; Kang, H. Review of Electric Vehicle Ultra-Fast DC Charging Station. In Proceedings of the 2022 7th Asia Conference on Power and Electrical Engineering (ACPEE), Hangzhou, China, 15–17 April 2022; pp. 1–9. [Google Scholar]
  8. Pal, A.; Bhattacharya, A.; Chakraborty, A.K. Allocation of Electric Vehicle Charging Station Considering Uncertainties. Sustain. Energy Grids Netw. 2021, 25, 100422. [Google Scholar] [CrossRef]
  9. Sannigrahi, S.; Ghatak, S.R.; Acharjee, P. Point Estimate Method Based Distribution System Planning Using MOPSO Technique. In Proceedings of the 2020 IEEE International Conference on Power Electronics, Smart Grid and Renewable Energy (PESGRE2020), Cochin, India, 2–4 January 2020; pp. 1–6. [Google Scholar]
  10. Pal, A.; Bhattacharya, A.; Chakraborty, A.K. Planning of EV Charging Station with Distribution Network Expansion Considering Traffic Congestion and Uncertainties. IEEE Trans. Ind. Appl. 2023, 59, 3810–3825. [Google Scholar] [CrossRef]
  11. Franzese, P.; Iannuzzi, D.; Mottola, F.; Proto, D.; Pagano, M. Charging Strategies for Ultra-Fast Stations with Multiple Plug-in Electric Vehicle Parking Slots. In Proceedings of the 2020 AEIT International Annual Conference (AEIT), Catania, Italy, 23 September 2020; pp. 1–6. [Google Scholar]
  12. Attaianese, C.; Di Pasquale, A.; Franzese, P.; Iannuzzi, D.; Pagano, M.; Ribera, M. A Model-Based EVs Charging Scheduling for a Multi-Slot Ultra-Fast Charging Station. Electr. Power Syst. Res. 2023, 216, 109009. [Google Scholar] [CrossRef]
  13. Bucarelli, M.A.; Geri, A.; Maccioni, M.; Gatta, F.M.; Bragatto, T.; Paulucci, M. Impact of Ultrafast EV Charging Stations on the Electrical Distribution Grid: A Case Study in Terni. In Proceedings of the 2023 IEEE International Conference on Environment and Electrical Engineering and 2023 IEEE Industrial and Commercial Power Systems Europe (EEEIC/I&CPS Europe), Madrid, Spain, 6 June 2023; pp. 1–6. [Google Scholar]
  14. Ahmad, F.; Iqbal, A.; Asharf, I.; Marzband, M.; Khan, I. Placement and Capacity of EV Charging Stations by Considering Uncertainties With Energy Management Strategies. IEEE Trans. Ind. Appl. 2023, 59, 3865–3874. [Google Scholar] [CrossRef]
  15. Han, X.; Wei, Z.; Hong, Z.; Zhao, S. Ordered Charge Control Considering the Uncertainty of Charging Load of Electric Vehicles Based on Markov Chain. Renew. Energy 2020, 161, 419–434. [Google Scholar] [CrossRef]
  16. Yan, D.; Ma, C. Optimal Sizing of A PV Based Electric Vehicle Charging Station Under Uncertainties. In Proceedings of the IECON 2019—45th Annual Conference of the IEEE Industrial Electronics Society, Lisbon, Portugal, 14–17 October 2019; pp. 4310–4315. [Google Scholar]
  17. Kim, S.; Hur, J. A Probabilistic Modeling Based on Monte Carlo Simulation of Wind Powered EV Charging Stations for Steady-States Security Analysis. Energies 2020, 13, 5260. [Google Scholar] [CrossRef]
  18. Liu, X. Bi-Level Planning Method of Urban Electric Vehicle Charging Station Considering Multiple Demand Scenarios and Multi-Type Charging Piles. J. Energy Storage 2022, 48, 104012. [Google Scholar] [CrossRef]
  19. Chen, L.; Xu, C.; Song, H.; Jermsittiparsert, K. Optimal Sizing and Sitting of EVCS in the Distribution System Using Metaheuristics: A Case Study. Energy Rep. 2021, 7, 208–217. [Google Scholar] [CrossRef]
  20. Jamatia, P.; Bhattacharjee, S.; Sharma, S. Optimal Allocation of EV Charging Station in Distribution Network. In Proceedings of the 2022 4th International Conference on Energy, Power and Environment (ICEPE), Shillong, India, 29 April 2022; pp. 1–6. [Google Scholar]
  21. Pal, A.; Bhattacharya, A.; Chakraborty, A.K. Allocation of EV Fast Charging Station with V2G Facility in Distribution Network. In Proceedings of the 2019 8th International Conference on Power Systems (ICPS), Jaipur, India, 20–22 December 2019; pp. 1–6. [Google Scholar]
  22. Lazari, V.; Chassiakos, A. Multi-Objective Optimization of Electric Vehicle Charging Station Deployment Using Genetic Algorithms. Appl. Sci. 2023, 13, 4867. [Google Scholar] [CrossRef]
  23. Wang, Y.; Liu, D.; Wu, Y.; Xue, H.; Mi, Y. Locating and Sizing of Charging Station Based on Neighborhood Mutation Immune Clonal Selection Algorithm. Electr. Power Syst. Res. 2023, 215, 109013. [Google Scholar] [CrossRef]
  24. Zhou, G.; Zhu, Z.; Luo, S. Location Optimization of Electric Vehicle Charging Stations: Based on Cost Model and Genetic Algorithm. Energy 2022, 247, 123437. [Google Scholar] [CrossRef]
  25. Kathiravan, K.; Rajnarayanan, P.N. Application of AOA Algorithm for Optimal Placement of Electric Vehicle Charging Station to Minimize Line Losses. Electr. Power Syst. Res. 2023, 214, 108868. [Google Scholar] [CrossRef]
  26. Hadian, E.; Akbari, H.; Farzinfar, M.; Saeed, S. Optimal Allocation of Electric Vehicle Charging Stations with Adopted Smart Charging/Discharging Schedule. IEEE Access 2020, 8, 196908–196919. [Google Scholar] [CrossRef]
  27. Altaf, M.; Yousif, M.; Ijaz, H.; Rashid, M.; Abbas, N.; Khan, M.A.; Waseem, M.; Saleh, A.M. PSO-based Optimal Placement of Electric Vehicle Charging Stations in a Distribution Network in Smart Grid Environment Incorporating Backward Forward Sweep Method. IET Renew. Power Gener. 2023, 1–15. [Google Scholar] [CrossRef]
  28. Zeb, M.Z.; Imran, K.; Khattak, A.; Janjua, A.K.; Pal, A.; Nadeem, M.; Zhang, J.; Khan, S. Optimal Placement of Electric Vehicle Charging Stations in the Active Distribution Network. IEEE Access 2020, 8, 68124–68134. [Google Scholar] [CrossRef]
  29. Krishnamurthy, N.K.; Sabhahit, J.N.; Jadoun, V.K.; Gaonkar, D.N.; Shrivastava, A.; Rao, V.S.; Kudva, G. Optimal Placement and Sizing of Electric Vehicle Charging Infrastructure in a Grid-Tied DC Microgrid Using Modified TLBO Method. Energies 2023, 16, 1781. [Google Scholar] [CrossRef]
  30. Ahmad, F.; Iqbal, A.; Ashraf, I.; Marzband, M.; Khan, I. Placement of Electric Vehicle Fast Charging Stations Using Grey Wolf Optimization in Electrical Distribution Network. In Proceedings of the 2022 IEEE International Conference on Power Electronics, Smart Grid, and Renewable Energy (PESGRE), Trivandrum, India, 2 January 2022; pp. 1–6. [Google Scholar]
  31. Chowdhury, A.; Roy, R.; Mandal, K.K. Techno-Socio-Economic Improvements Due to Optimal Location of EV Charging Station at IEEE 22 Bus Using Cuckoo Search Algorithm. In Proceedings of the 2022 22nd National Power Systems Conference (NPSC), New Delhi, India, 17 December 2022; pp. 77–81. [Google Scholar]
  32. Heidari, A.A.; Mirjalili, S.; Faris, H.; Aljarah, I.; Mafarja, M.; Chen, H. Harris Hawks Optimization: Algorithm and Applications. Future Gener. Comput. Syst. 2019, 97, 849–872. [Google Scholar] [CrossRef]
  33. Xiang, Y.; Wang, S.; Su, T.; Li, J.; Mao, S.S.; Geimer, M. KIT bus: A shuttle model for CARLA simulator. In Proceedings of the 2021 IEEE Industrial Electronics and Applications Conference (IEACon), Penang, Malaysia, 22–23 November 2021; pp. 7–12. [Google Scholar]
  34. Dosovitskiy, A.; Ros, G.; Codevilla, F.; Lopez, A.; Koltun, V. CARLA: An open urban driving simulator. In Proceedings of the 1st Annial Conference on Robot Learning, Mountain View, CA, USA, 13–15 November 2017; pp. 1–16. [Google Scholar]
  35. Roy Ghatak, S.; Sannigrahi, S.; Acharjee, P. Multi-Objective Approach for Strategic Incorporation of Solar Energy Source, Battery Storage System, and DSTATCOM in a Smart Grid Environment. IEEE Syst. J. 2019, 13, 3038–3049. [Google Scholar] [CrossRef]
  36. Gupta, R.S.; Anand, Y.; Tyagi, A.; Anand, S. Sustainable Charging Station Allocation in the Distribution System for Electric Vehicles Considering Technical, Economic, and Societal Factors. J. Energy Storage 2023, 73, 109052. [Google Scholar] [CrossRef]
  37. Kakueinejad, M.H.; Heydari, A.; Askari, M.; Keynia, F. Optimal Planning for the Development of Power System in Respect to Distributed Generations Based on the Binary Dragonfly Algorithm. Appl. Sci. 2020, 10, 4795. [Google Scholar] [CrossRef]
  38. Gampa, S.R.; Das, D. Optimum Placement and Sizing of DGs Considering Average Hourly Variations of Load. Int. J. Electr. Power Energy Syst. 2015, 66, 25–40. [Google Scholar] [CrossRef]
  39. Ni, X.; Lo, K.L. A Methodology to Model Daily Charging Load in the EV Charging Stations Based on Monte Carlo Simulation. In Proceedings of the 2020 International Conference on Smart Grid and Clean Energy Technologies (ICSGCE), Kuching, Malaysia, 4 October 2020; pp. 125–130. [Google Scholar]
  40. Average Cost of State Electricity Supply in India from Financial Year 2010 to 2022. Available online: https://www.statista.com/statistics/808201/india-cost-of-state-electricity-supply/#:~:text=During%20financial%20year%202022%2C%20the,Indian%20rupees%20per%20kilowatt%2Dhour (accessed on 24 July 2024).
  41. Awasthi, A.; Chandra, D.; Rajasekar, S.; Singh, A.K.; Raj, A.-D.-V.; Perumal, K.M. Optimal Infrastructure Planning of Electric Vehicle Charging Stations Using Hybrid Optimization Algorithm. In Proceedings of the 2016 National Power Systems Conference (NPSC), Bhubaneswar, India, 19–21 December 2016; pp. 1–6. [Google Scholar]
  42. National Travel Survey. Available online: https://www.gov.uk/government/collections/national-travel-survey-statistics (accessed on 24 July 2024).
  43. Kia. Available online: https://www.kia.com/in/service/ev-owners/charging-infra.html#:~:text=DC%20Charge,or%20at%20public%20charging%20stations (accessed on 24 July 2024).
  44. BMW. Available online: https://www.bmw.in/en/all-models/bmw-i/bmw-ix-new/2021/bmw-ix.html#range-charging (accessed on 24 July 2024).
  45. Porsche. Available online: https://www.porsche.com/international/models/taycan/taycan-models/taycan/ (accessed on 24 July 2024).
  46. Roy Ghatak, S.; Sannigrahi, S.; Acharjee, P. Comparative Performance Analysis of DG and DSTATCOM Using Improved PSO Based on Success Rate for Deregulated Environment. IEEE Syst. J. 2018, 12, 2791–2802. [Google Scholar] [CrossRef]
Figure 1. One-line diagram of a radial DN.
Energies 17 04204 g001
Figure 2. Flowchart of the methodology of the proposed work.
Energies 17 04204 g002
Figure 3. Strategic allocation of EVCSs in the (a) 33-bus radial DN and (b) 51-bus real Indian DN.
Energies 17 04204 g003
Figure 4. Bus-wise Voltage Stability Index values for (a) 33-bus radial DN and (b) 51-bus real Indian DN.
Energies 17 04204 g004
Figure 5. Allocation of EVCSs in the (a) 33-bus radial DN and (b) 51-bus DN using optimization technique.
Energies 17 04204 g005
Figure 6. Voltage profile of (a) 33-bus radial DN and (b) 51-bus real Indian DN before and after allocation of ultra-fast CS.
Energies 17 04204 g006
Figure 7. Power loss before and after allocation of ultra-fast CS in 33-bus and 51-bus radial DN.
Energies 17 04204 g007
Figure 8. Convergence comparison of algorithms.
Energies 17 04204 g008
Table 1. C p values for each uncertain parameter.
Uncertain Parameters C p
p = 1p = 2
SOC0.36150.8957
C a p b 95.535765.3663
C e l c 6.72253.4878
Table 2. Input parameters related to the objective function.
ParametersValueParametersValue
A c h 17.38 ft2 C A r Rs 2000/ft2
A p 1000 ft2 C c h Rs 1,890,000
N y r 10 years C o t h e r Rs 5,826,730
r0.08 t s n 2 months
Table 3. Result of locations for CS placement, the corresponding number of chargers, and the total number of EVs that would use the CSs using the proposed method.
Test SystemCS LocationNo. of Chargers in Each CSNo. of EVs per CSTotal no. of EVs
33-Bus21144576
111144
221144
301144
51-Bus91144720
181144
251144
321144
411144
Table 4. Financial analysis for 150 kW ultra-fast CS.
Test System Installation   Cost   ( Rs × 10 6 ) Operational   Cost   ( Rs × 10 7 ) Energy   Loss   Cost   ( Rs × 10 8 ) Total   ( Rs × 10 8 )
33-Bus2.01575.24411.06631.6109
51-Bus2.30267.45521.01771.7862
Table 5. Cost-benefit analysis for ultra-fast CS.
Test System Total   Cost   ( Rs × 10 8 ) Total   Benefit   ( Rs × 10 8 ) ROI
33-Bus1.08651.34721.2493
51-Bus1.14071.44421.2661
Table 6. Comparison of CO2 emissions from EVs and conventional vehicles over 10 years.
Test SystemVehicle TypeCO2 Emission (kg)
33-BusEV 6.6417 × 10 7
Conventional 1.1433 × 10 8
51-BusEV 7.1646 × 10 7
Conventional 1.1433 × 10 8
Table 7. Comparison of results of different algorithms.
Performance IndicesHHOEPSOPSOGA
Convergence rate26303240
Convergence time (s)204211220241
Mean0.02130.02870.03110.0421
Standard deviation0.00170.00210.00320.0043
Table 8. Comparison of the robustness of different algorithms after 30 trials.
Performance IndicesHHOEPSOPSOGA
Maximum0.02220.02940.03210.0433
Minimum0.02010.02660.02890.0398
Average0.02090.02810.03090.0419
Disclaimer/Publisher’s Note: The statements, opinions and data contained in all publications are solely those of the individual author(s) and contributor(s) and not of MDPI and/or the editor(s). MDPI and/or the editor(s) disclaim responsibility for any injury to people or property resulting from any ideas, methods, instructions or products referred to in the content.

