1. Introduction
The current rating of cables is usually determined by an analysis of the installation conditions with constant parameters along its route. Detailed information on this approach can be found in international standards [
1] (see also explanatory sources such as [
2]). However, in many cases, deviations from this arrangement may appear: one example is the crossing of regions with disadvantageous thermal properties. A solution for this is described in [
3], where the analysis is executed by means of a network of thermal resistances.
The situation is quite different in the vicinity of joints. A common approach to the thermal analysis of a cable circuit is to ignore its presence. The argument is that a greater thickness of the insulation is compensated by the larger diameter of the joint enclosure and by the necessary greater distances, which facilitate heat dissipation to the environment. The balance between these two factors varies with cable and joint design as well as with cable size and installation conditions. For the direct buried cables, the calculated ampacity for a joint may be 3% lower than that for a 350 kcmil cable but 1.5% higher for a 1000 kcmil cable [
4].
Another argument often raised when one needs to justify neglecting the presence of the joint is that a longitudinal heat transfer, present in the joint area because of the temperature difference between the joint and the cable outside, also helps lower conductor temperatures.
Nevertheless, as early as 1980, researchers tried to build mathematical models representing heat transfer phenomena in a cable joint [
5]. Since the pioneering work of Aziz and Riege [
5] required many assumptions and was generally difficult to apply, the subsequent wave of research in this area involved the application of numerical methods [
6,
7,
8,
9,
10,
11].
The application of numerical models, in particular boundary methods and finite element approaches, ensures the relatively accurate analysis of heat transfer in the vicinity of cable joints but at the expense of the increased complexity of models and difficulty with the proper modeling of cable components and their environment. An accurate cable and joint model would normally require a 3D analysis, which may lead to computer memory and convergence limitations.
Therefore, in recent years, additional research has been conducted on the development of improved analytical models [
12,
13], expanding on the original work of Azis and Riege, as reported in [
14]. The latest modeling effort in this area is presented in [
15], where the network model proposed in [
3] allows for the unsymmetric construction of a cable joint to be modeled. It does not consider the presence of neighboring joints from the other phases of a cable circuit. Thus, these studies do not yet provide a comprehensive model needed for the analysis of real-world installations. Additionally, they do not address a representation of real situations in which more than just two sections, a joint and a cable, are present or installations where the spacing between the phases increases in the joint bay area.
The brief state-of-the-art research presented above clearly indicates that there is a need for a model that can represent a number of cable sections in the vicinity of a joint. An example of such an installation, presented in more detail later in the paper, is a joint used to connect two different cable types or sizes necessitated by the changing environment along the route or a replacement of an older failed cable section by a new cable construction.
The paper is organized as follows.
Section 2 presents an installation in which a joint is used to connect two different cable sizes. In this example, the soil conditions also changed on one side of the joint, so that five thermally differing sections must be considered. An analytical model for the thermal analysis of a cable joint is presented in
Section 3, followed by a numerical analysis in Chapter 4 of the example presented in Chapter 2. Chapter 5 offers a comparison of the analytical and numerical results for a joint installation. Chapter 6 present our conclusions.
When cables are installed in ducts, the joints are normally positioned at manholes. Heat transfer by convection is greater in a manhole than in a duct, and, thus, the ampacity in the manhole is higher than in a duct. Therefore, this paper considers directly buried cables and joints only.
2. Example with a Transition Joint and Changing Soil Parameters
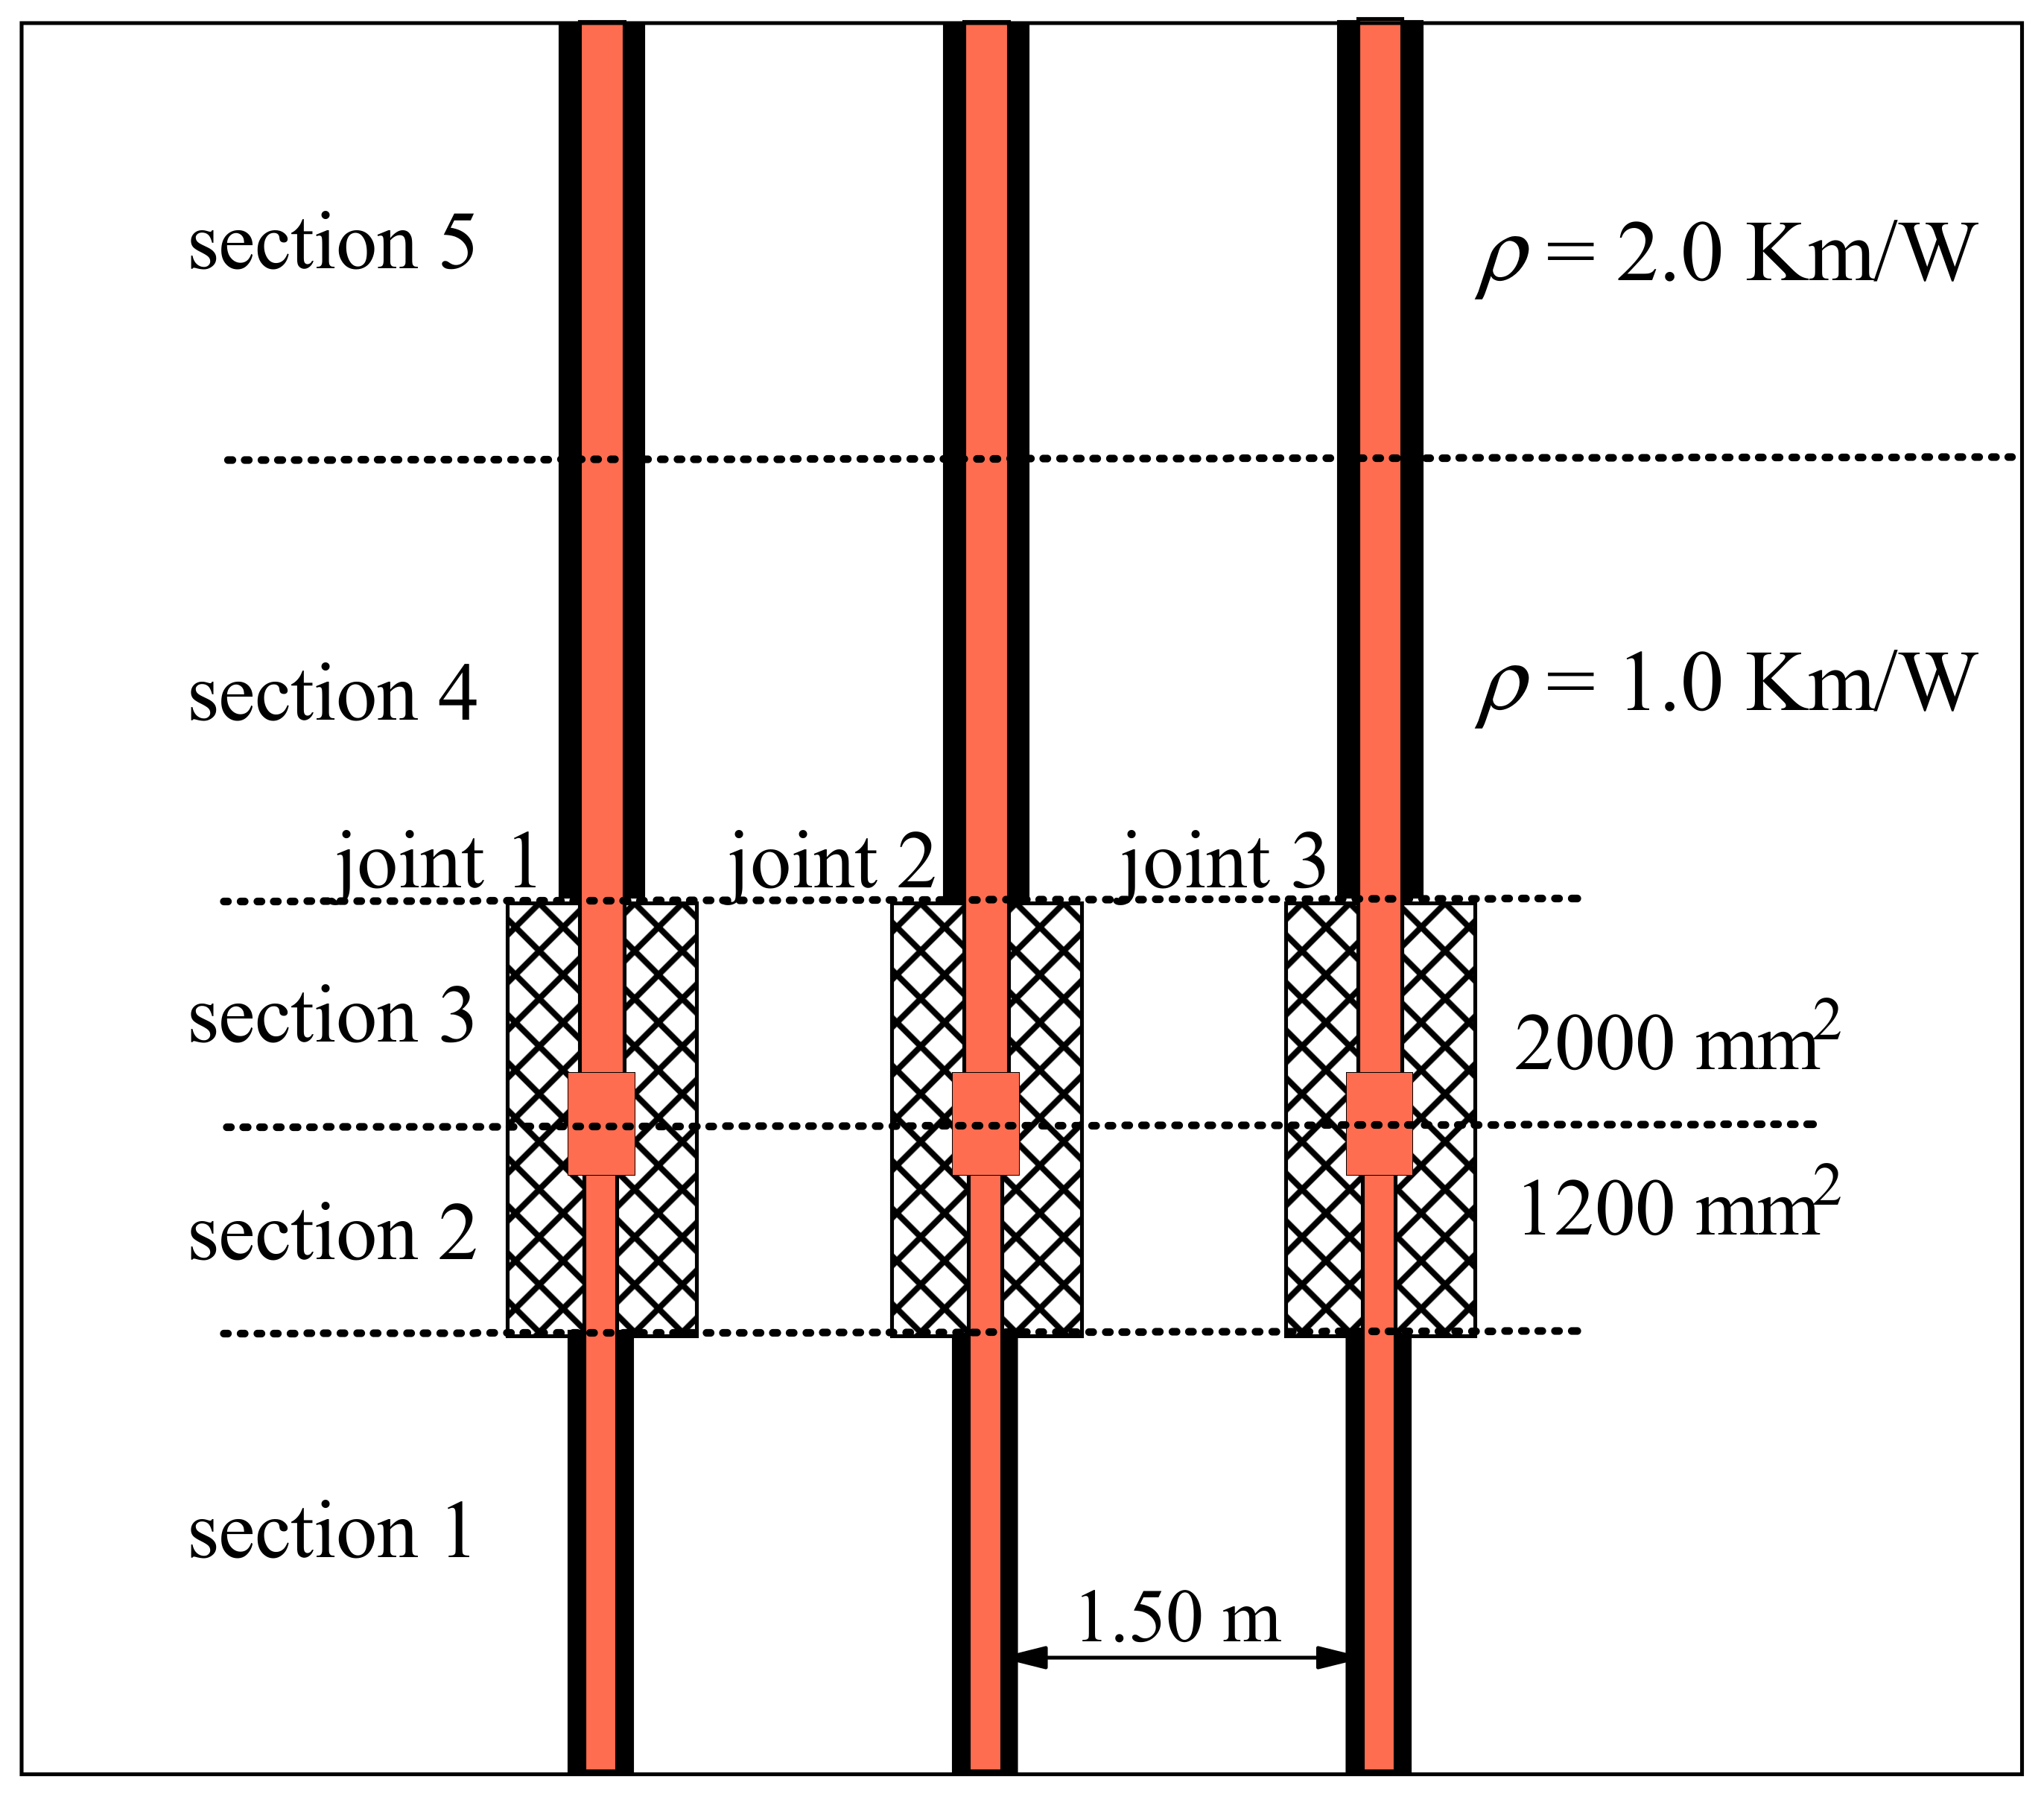
In the following, we examine a five-section cable arrangement, as presented in
Figure 1. The line is composed of three single-phase 220 kV XLPE-insulated cables with a conductor cross section of 1200 mm
2, which are replaced in the joint area by a 2000 mm
2 cable with the same construction as the remaining components. This replacement is necessitated by the thermally unfavorable section 5, as shown in
Figure 1. This section of the route has a thermal resistivity of 2.0 km/W, whereas all the remaining parts of the right-of-way are characterized by the thermal resistivity of the soil, which is equal to 1.0 km/W. Cables and joints are laid at a depth of 2.0 m with a distance between the phases equal to 1.5 m. The ambient temperature is 20 °C.
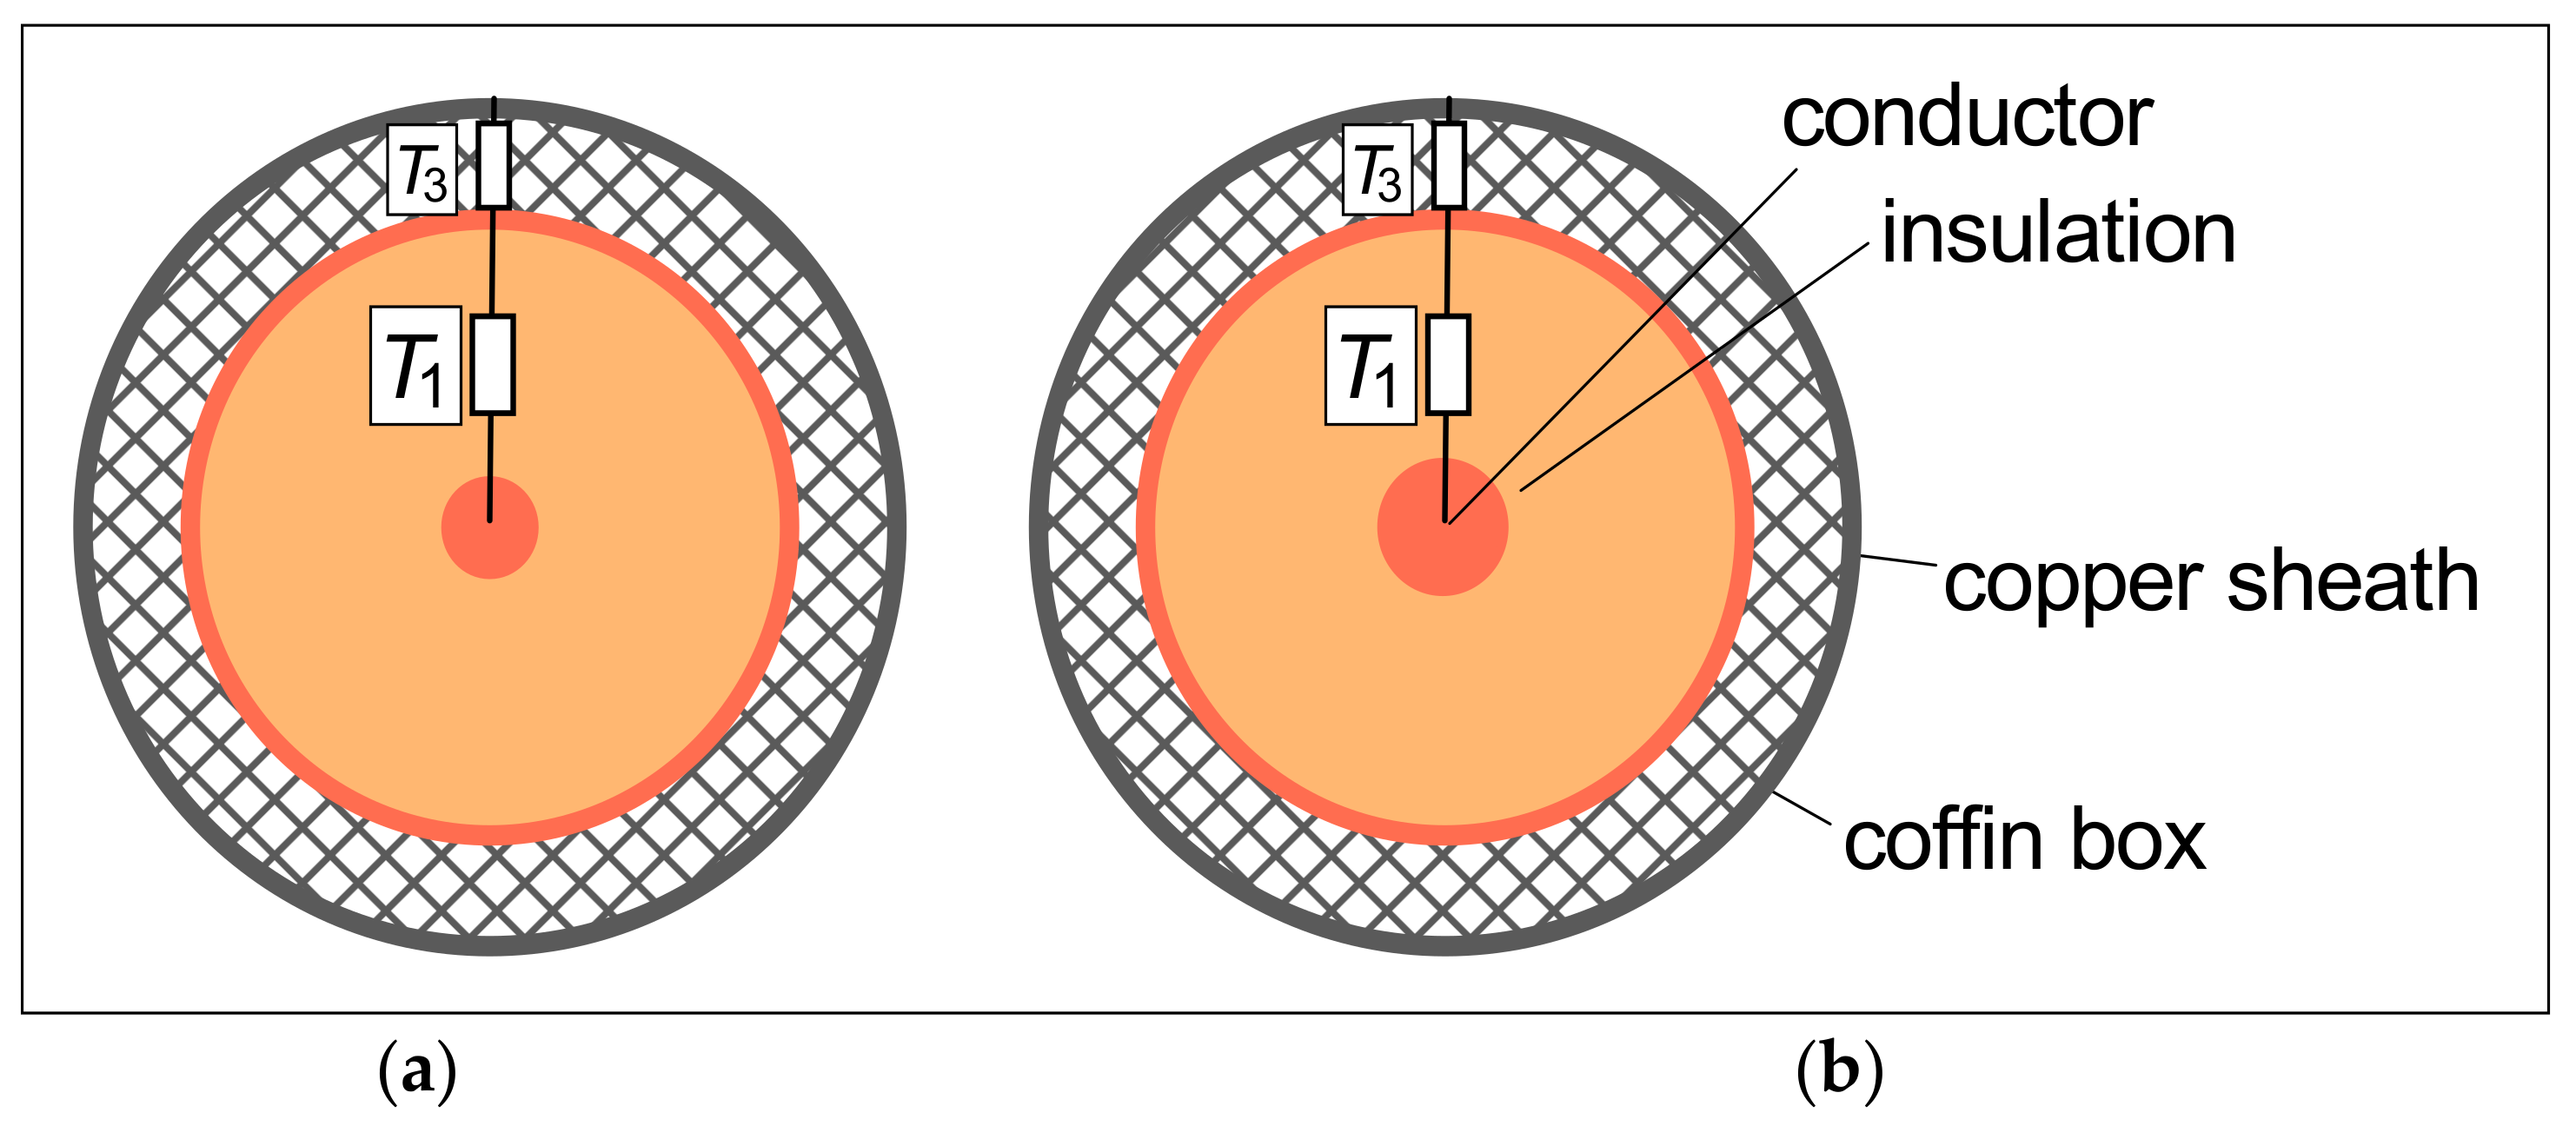
Even though the developments presented in the next chapter do not require any simplifications in the modeling of the cable or the joint construction, for illustrative purposes, the joint construction is simplified here into the two sections 2 and 3 with different conductor cross sections (see
Figure 2). The detailed joint construction—consisting of several layers with different materials—is represented in a coaxial arrangement with an inner insulation characterized by a mean value of the thermal resistivities, enclosed by a metallic housing and an outer enclosure. The data for the two parts of the joint are presented in
Table 1.
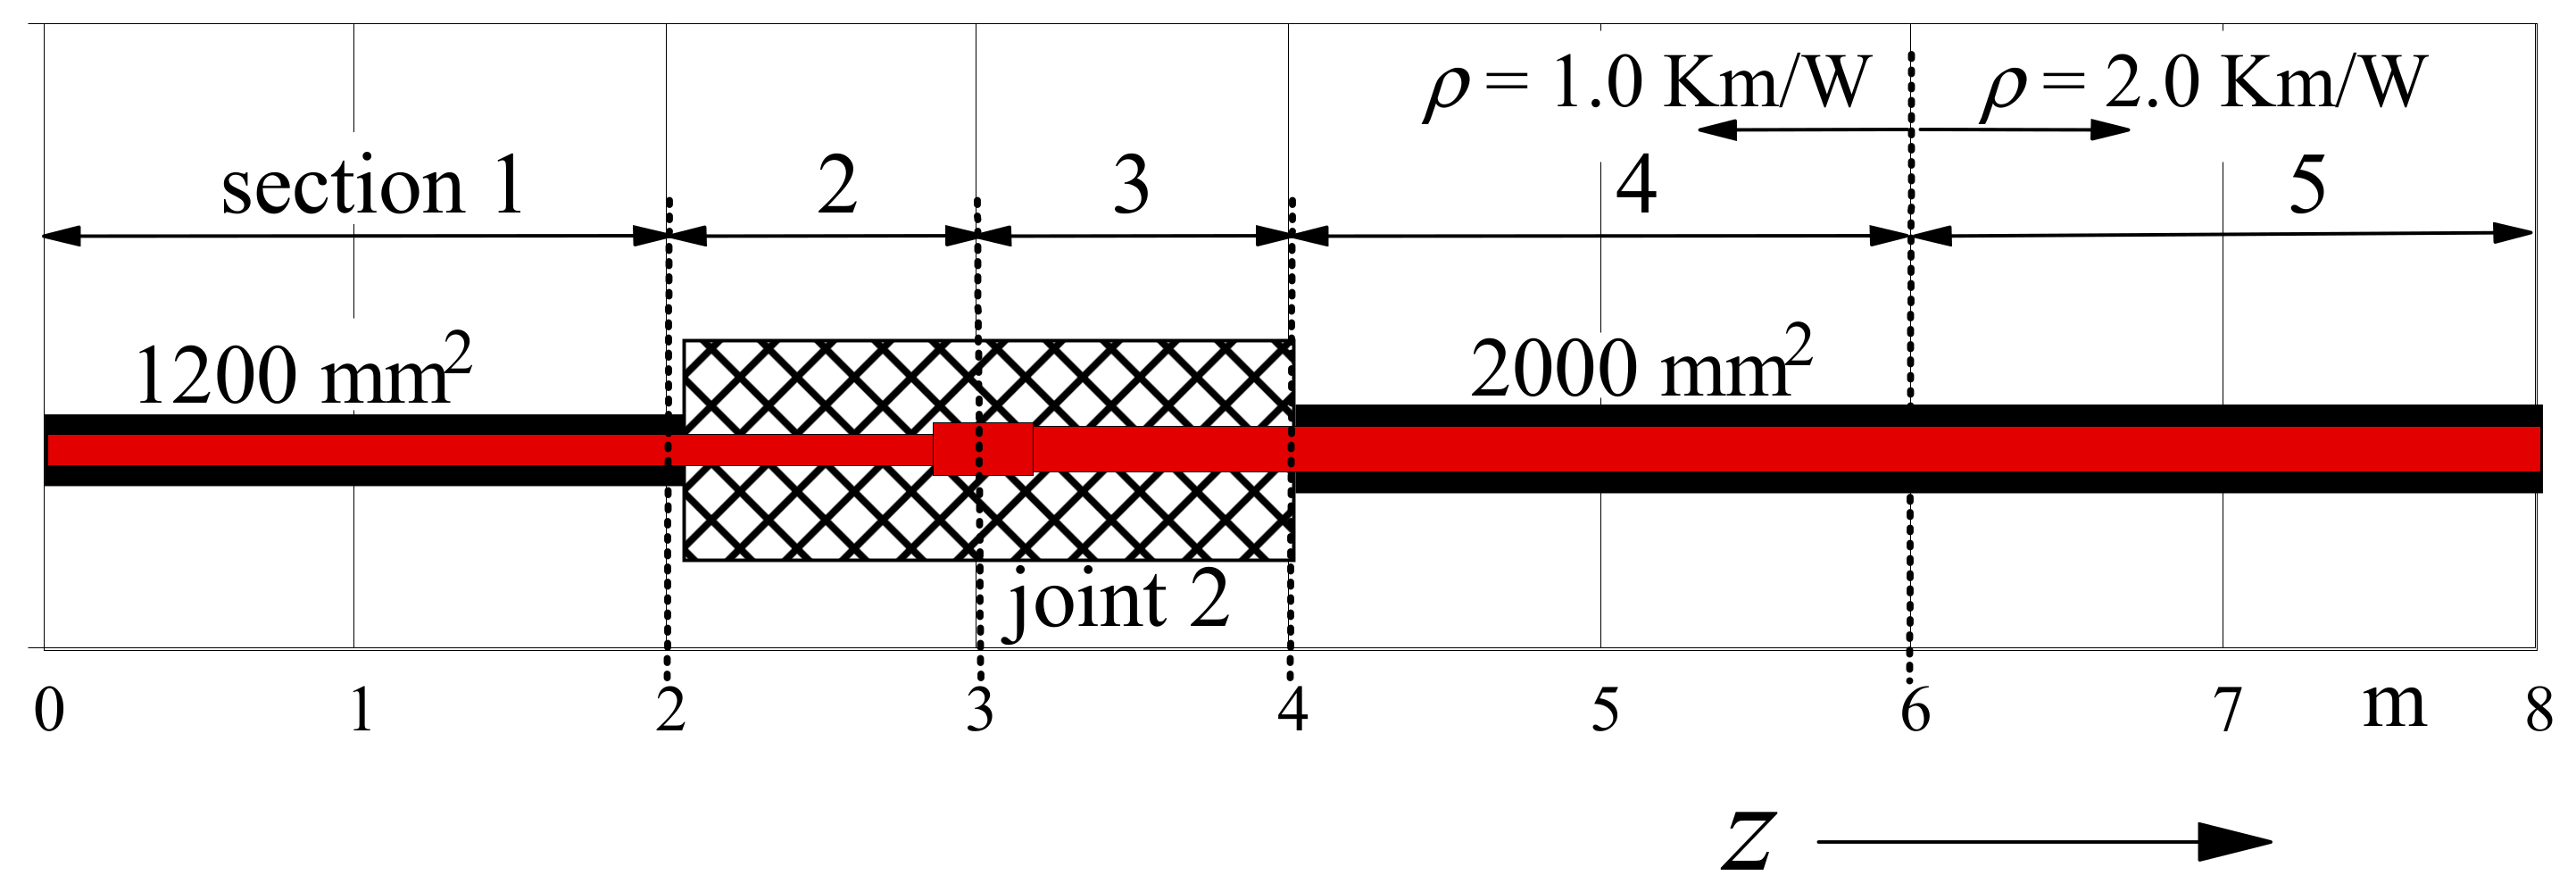
The longitudinal arrangement and the lengths of the considered sections are shown in
Figure 3 and
Table 1.
3. Development of the Model
The solution is found in two steps:
- (a)
First, the distribution of the “uninfluenced”, which means without consideration of the longitudinal heat flow or temperatures θu, is determined. This can be achieved using different methods:
In this paper, and similar to [
16,
17], the simplest method is chosen. In each section,
θu is determined by considering the line sources in this section, which represent the cable. Normal Kennelly formulae and thermal resistances are used, as described in IEC 60287.
The second possibility is to represent each cable section by means of finite line sources, as described and used in [
18].
The third possibility is to represent the cable run by point sources, i.e., very short subsections (e.g., 0.02–0.04 m) and to determine the resulting thermal field, as described in [
19].
- (b)
The second step is the consideration of the longitudinal heat fluxes along the sections. This is carried out using the following equations:
For each section, we can derive differential equations for the conductor temperature and for the longitudinal heat flux, as shown in [
18]. The longitudinal heat flow in the conductor (
θ =
θc) is given by:
The increase in the longitudinal heat flow:
decreases the radial heat flow
Wr(
z) across the thermal resistance
Tr:
resulting in a conductor temperature as follows:
from which we obtain the differential equation for the conductor temperature:
with
In (4), represents the uninfluenced external temperature increase caused by all cables, and in (5), θu is the uninfluenced conductor temperature of created for all cables, meaning without longitudinal heat fluxes.
As described above, we will first assume that each cable section
i has a constant conductor temperature and constant conductor losses
Wi. Therefore, with a given, constant right-hand value
in (5), for each section,
i, a general solution becomes:
The longitudinal heat flux is equal to
If we first consider the boundary condition of a constant heat flux at each boundary of the sections
i and
i+1 with
z =
zi, we obtain the following:
with the abbreviations
;
The boundary condition of a constant temperature at the same boundary yields:
In contrast to [
18], (9) contains the differing factors
vi of the sections, so that for further processing, we have to multiply (10) with the factor
:
Adding (9) and (11) on the one hand, and subtracting them on the other hand, leads to the following equations for the coefficients
Ai and
Bi:
where
.
Additional boundary conditions are given as follows:
- (a)
First section i = 1: from ; follows: ;
(in the next example, symmetry is given in the first section with and thus ).
- (b)
Last section i = ns = 5: from follows: .
Thus, in (12) and (13), we have general formulations as follows:
The recursive application of (14) for
i = 2…
ns leads (with
) to the determination of
A1. The principle is shown in the following. We first obtain the following in the next step as follows:
and
where
and
where
These calculation steps (19) and (20) are repeated up to
i =
ns, in our example up to
i = 5, where the boundary condition
Ans = 0 will be used:
Now, A1 can be inserted into (14) for the calculation of all the other coefficients Ai and Bi with i = 2…ns. By means of these coefficients, now the temperature distributions can be determined in all sections.
4. Numerical Example Results
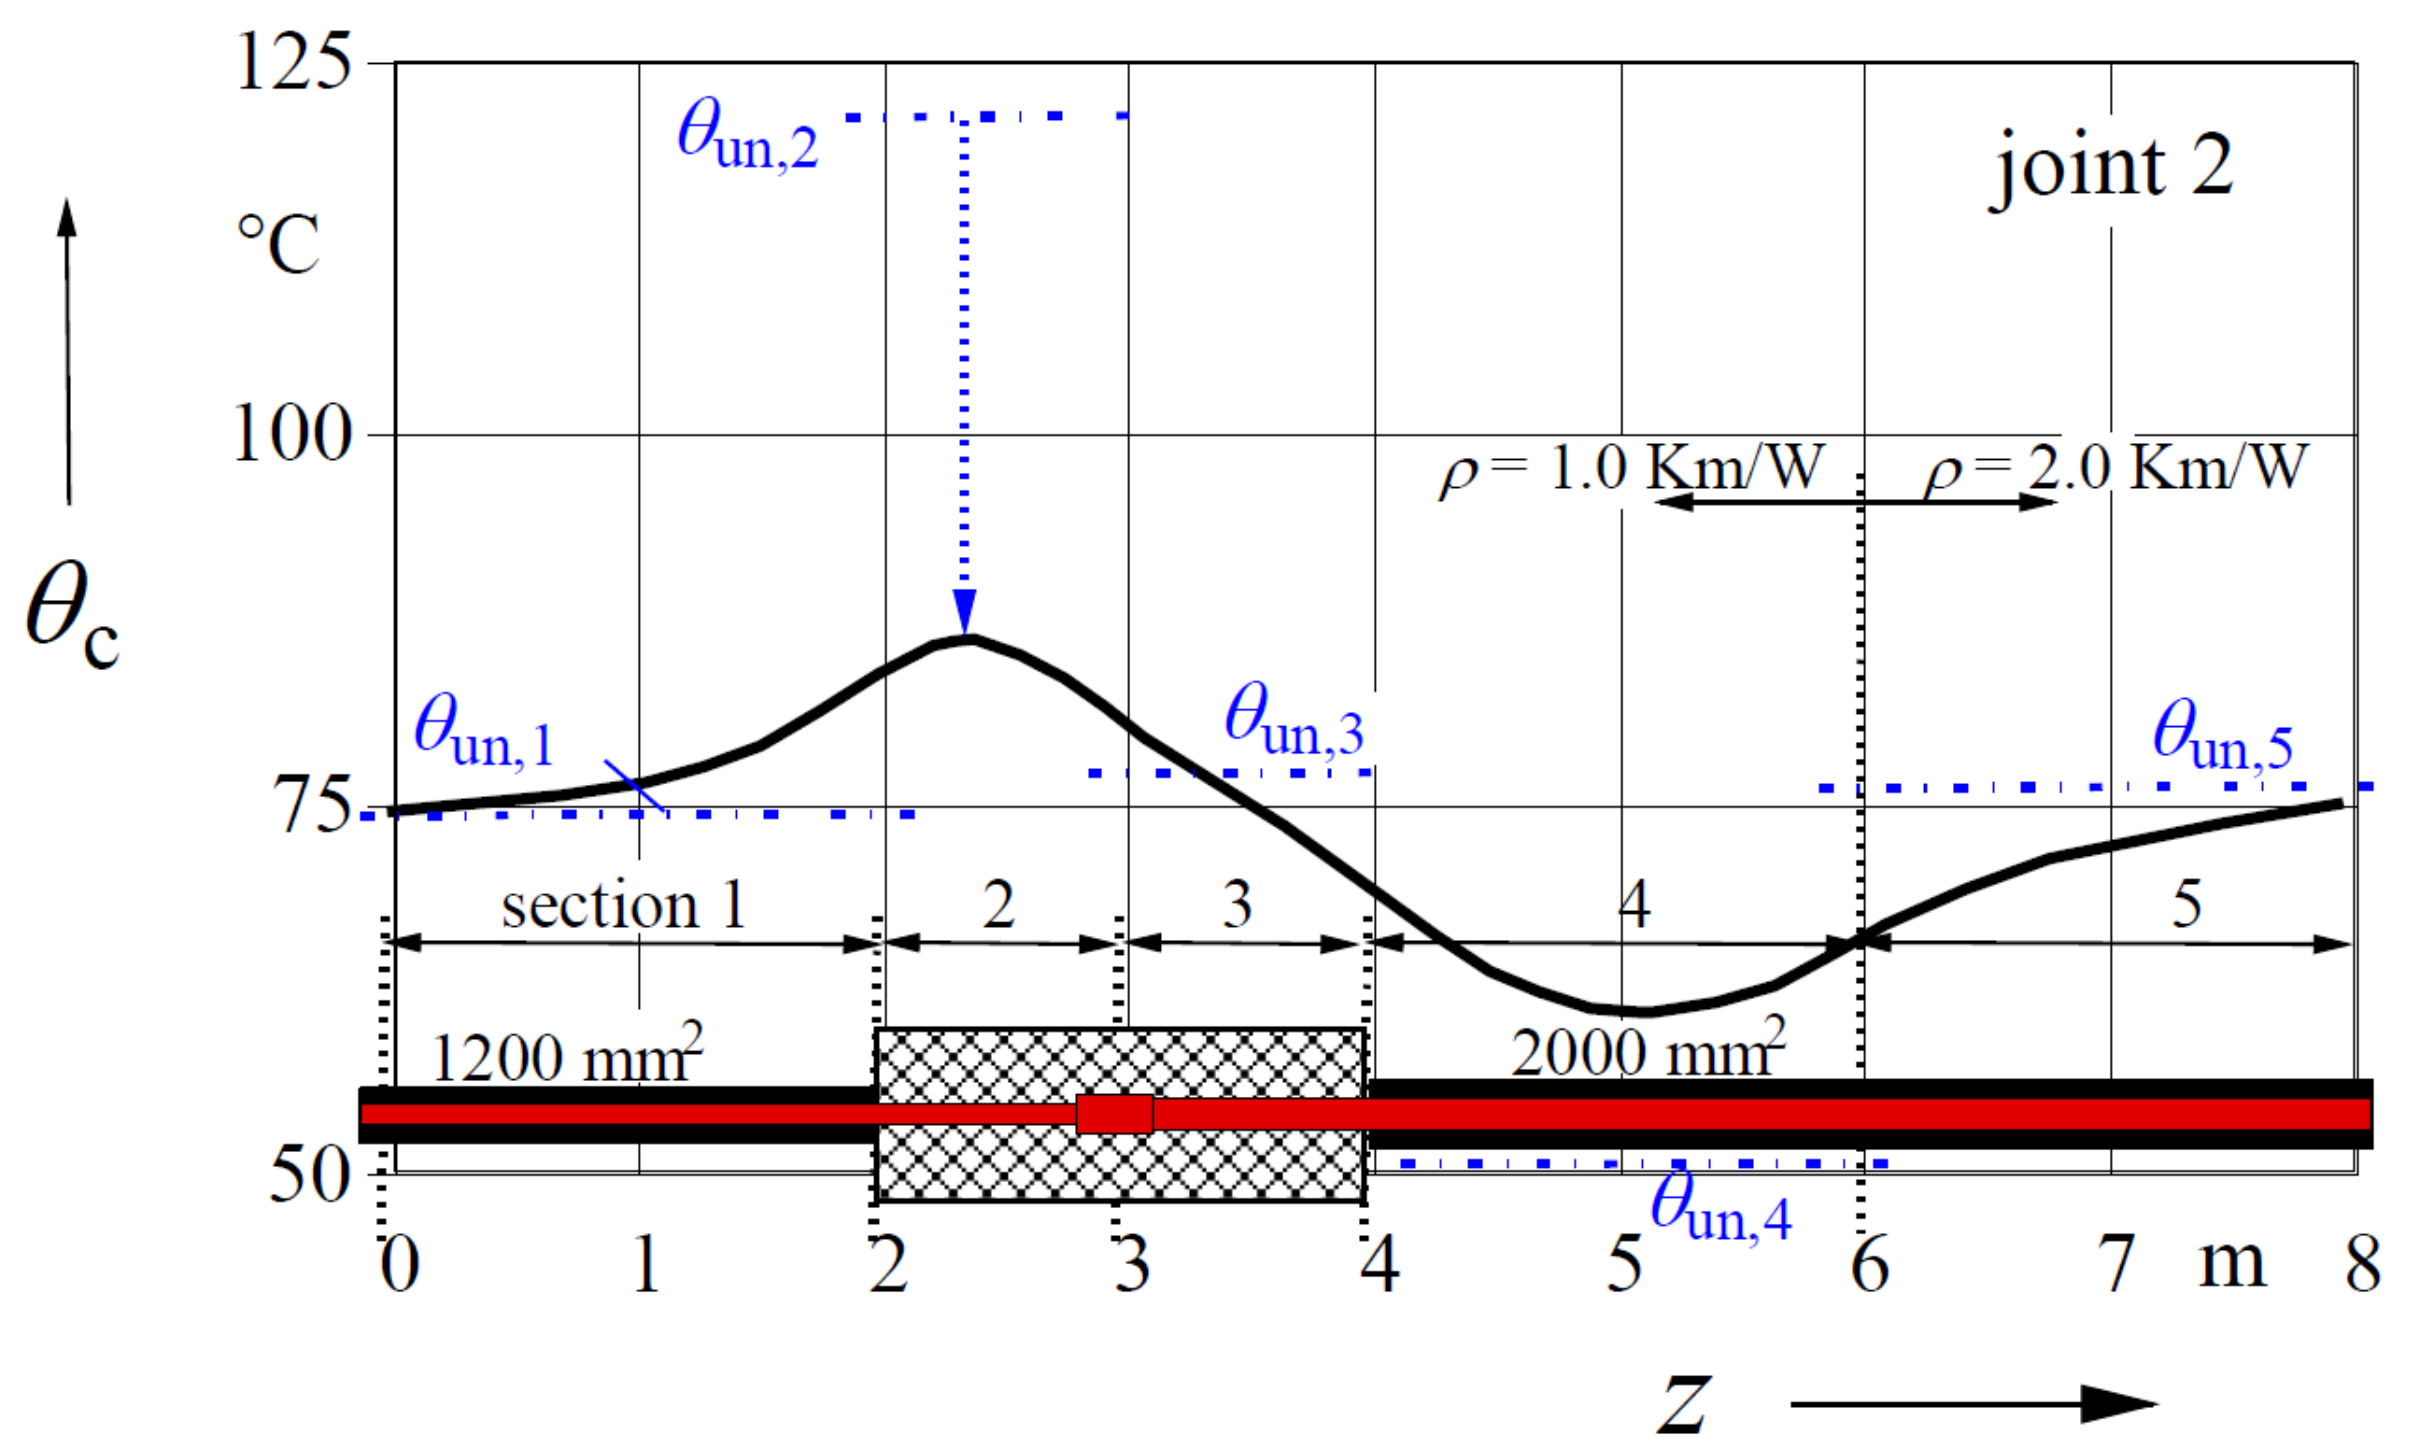
We will return to the example presented in Chapter 2. For a continuous current of 1350 A,
Figure 4 shows the longitudinal distribution of the conductor temperature
θc. Some results of the calculation are shown in
Table 1.
We can see from
Figure 4 that, in the left part of the joint (
Section 2), with a conductor cross section of 1200 mm
2, the conductor temperature increases because of the larger volume of the insulation. Ultimately, it would be increased to
θun,2 = 121.1 °C if the longitudinal heat flux was neglected; that is, far beyond the permitted limit of 90 °C.
In
Section 4, the enlarged cross section of 2000 mm
2 first results in a decrease in the temperature to
θun,4 = 51.0 °C but then increases (because of the higher thermal resistivity of the soil) against a final value of
θun,5 = 76.3 °C in
Section 5.
5. Two-Zone Problem
In many cases, a two-zone problem is encountered, where a zone with differing, mostly unfavorable conditions is embedded in an area of normal conditions. As an example, the arrangements shown in
Figure 1 and
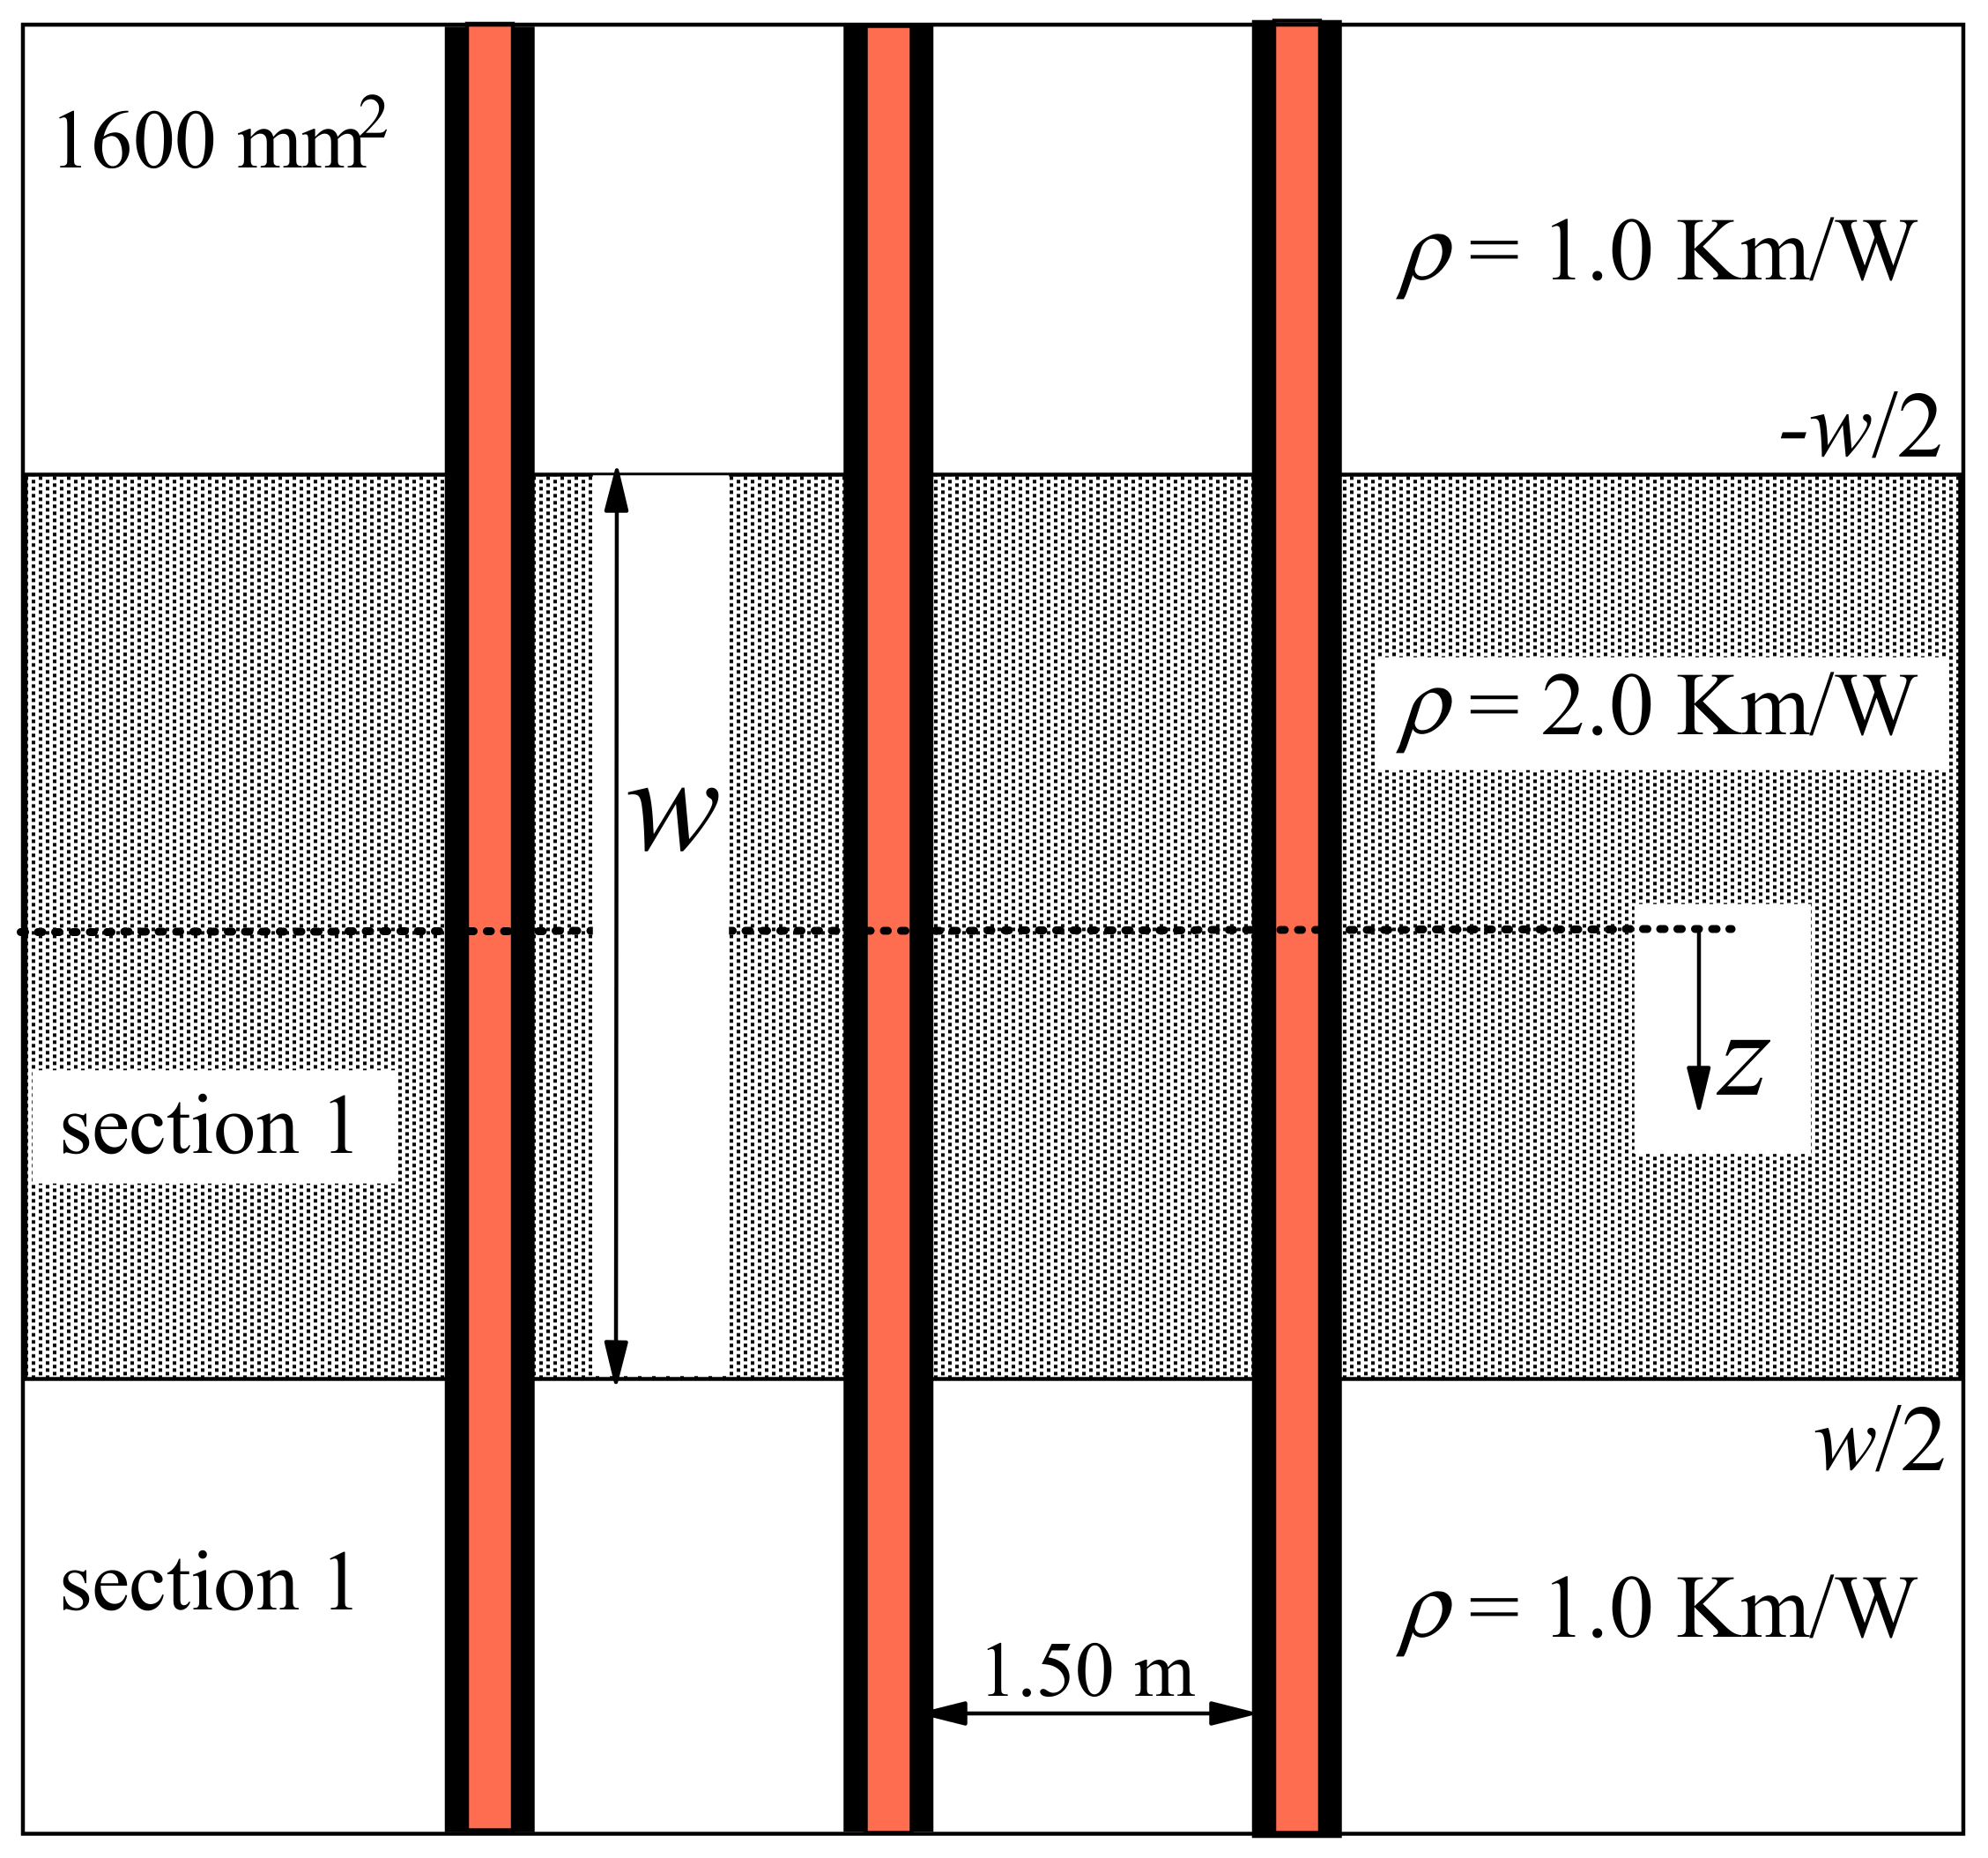
Figure 3 are without joints, and thus modified. Therefore, a band with width
w and soil resistivity of 2.0 km/W is surrounded by ”normal” soil with a resistivity of 1.0 km/W. As a modification of the example above, the question is now whether a solution without joints is possible if cables with 1600 mm
2 copper conductors are used. The arrangement is shown in
Figure 5. This type of problem appears quite often in practice; therefore, the possibility of a quick and simple analysis is shown here.
With the boundary conditions,
B1 =
A1 and
A2 = 0, the above equations lead to the following solutions:
where
z1 =
w/2 and
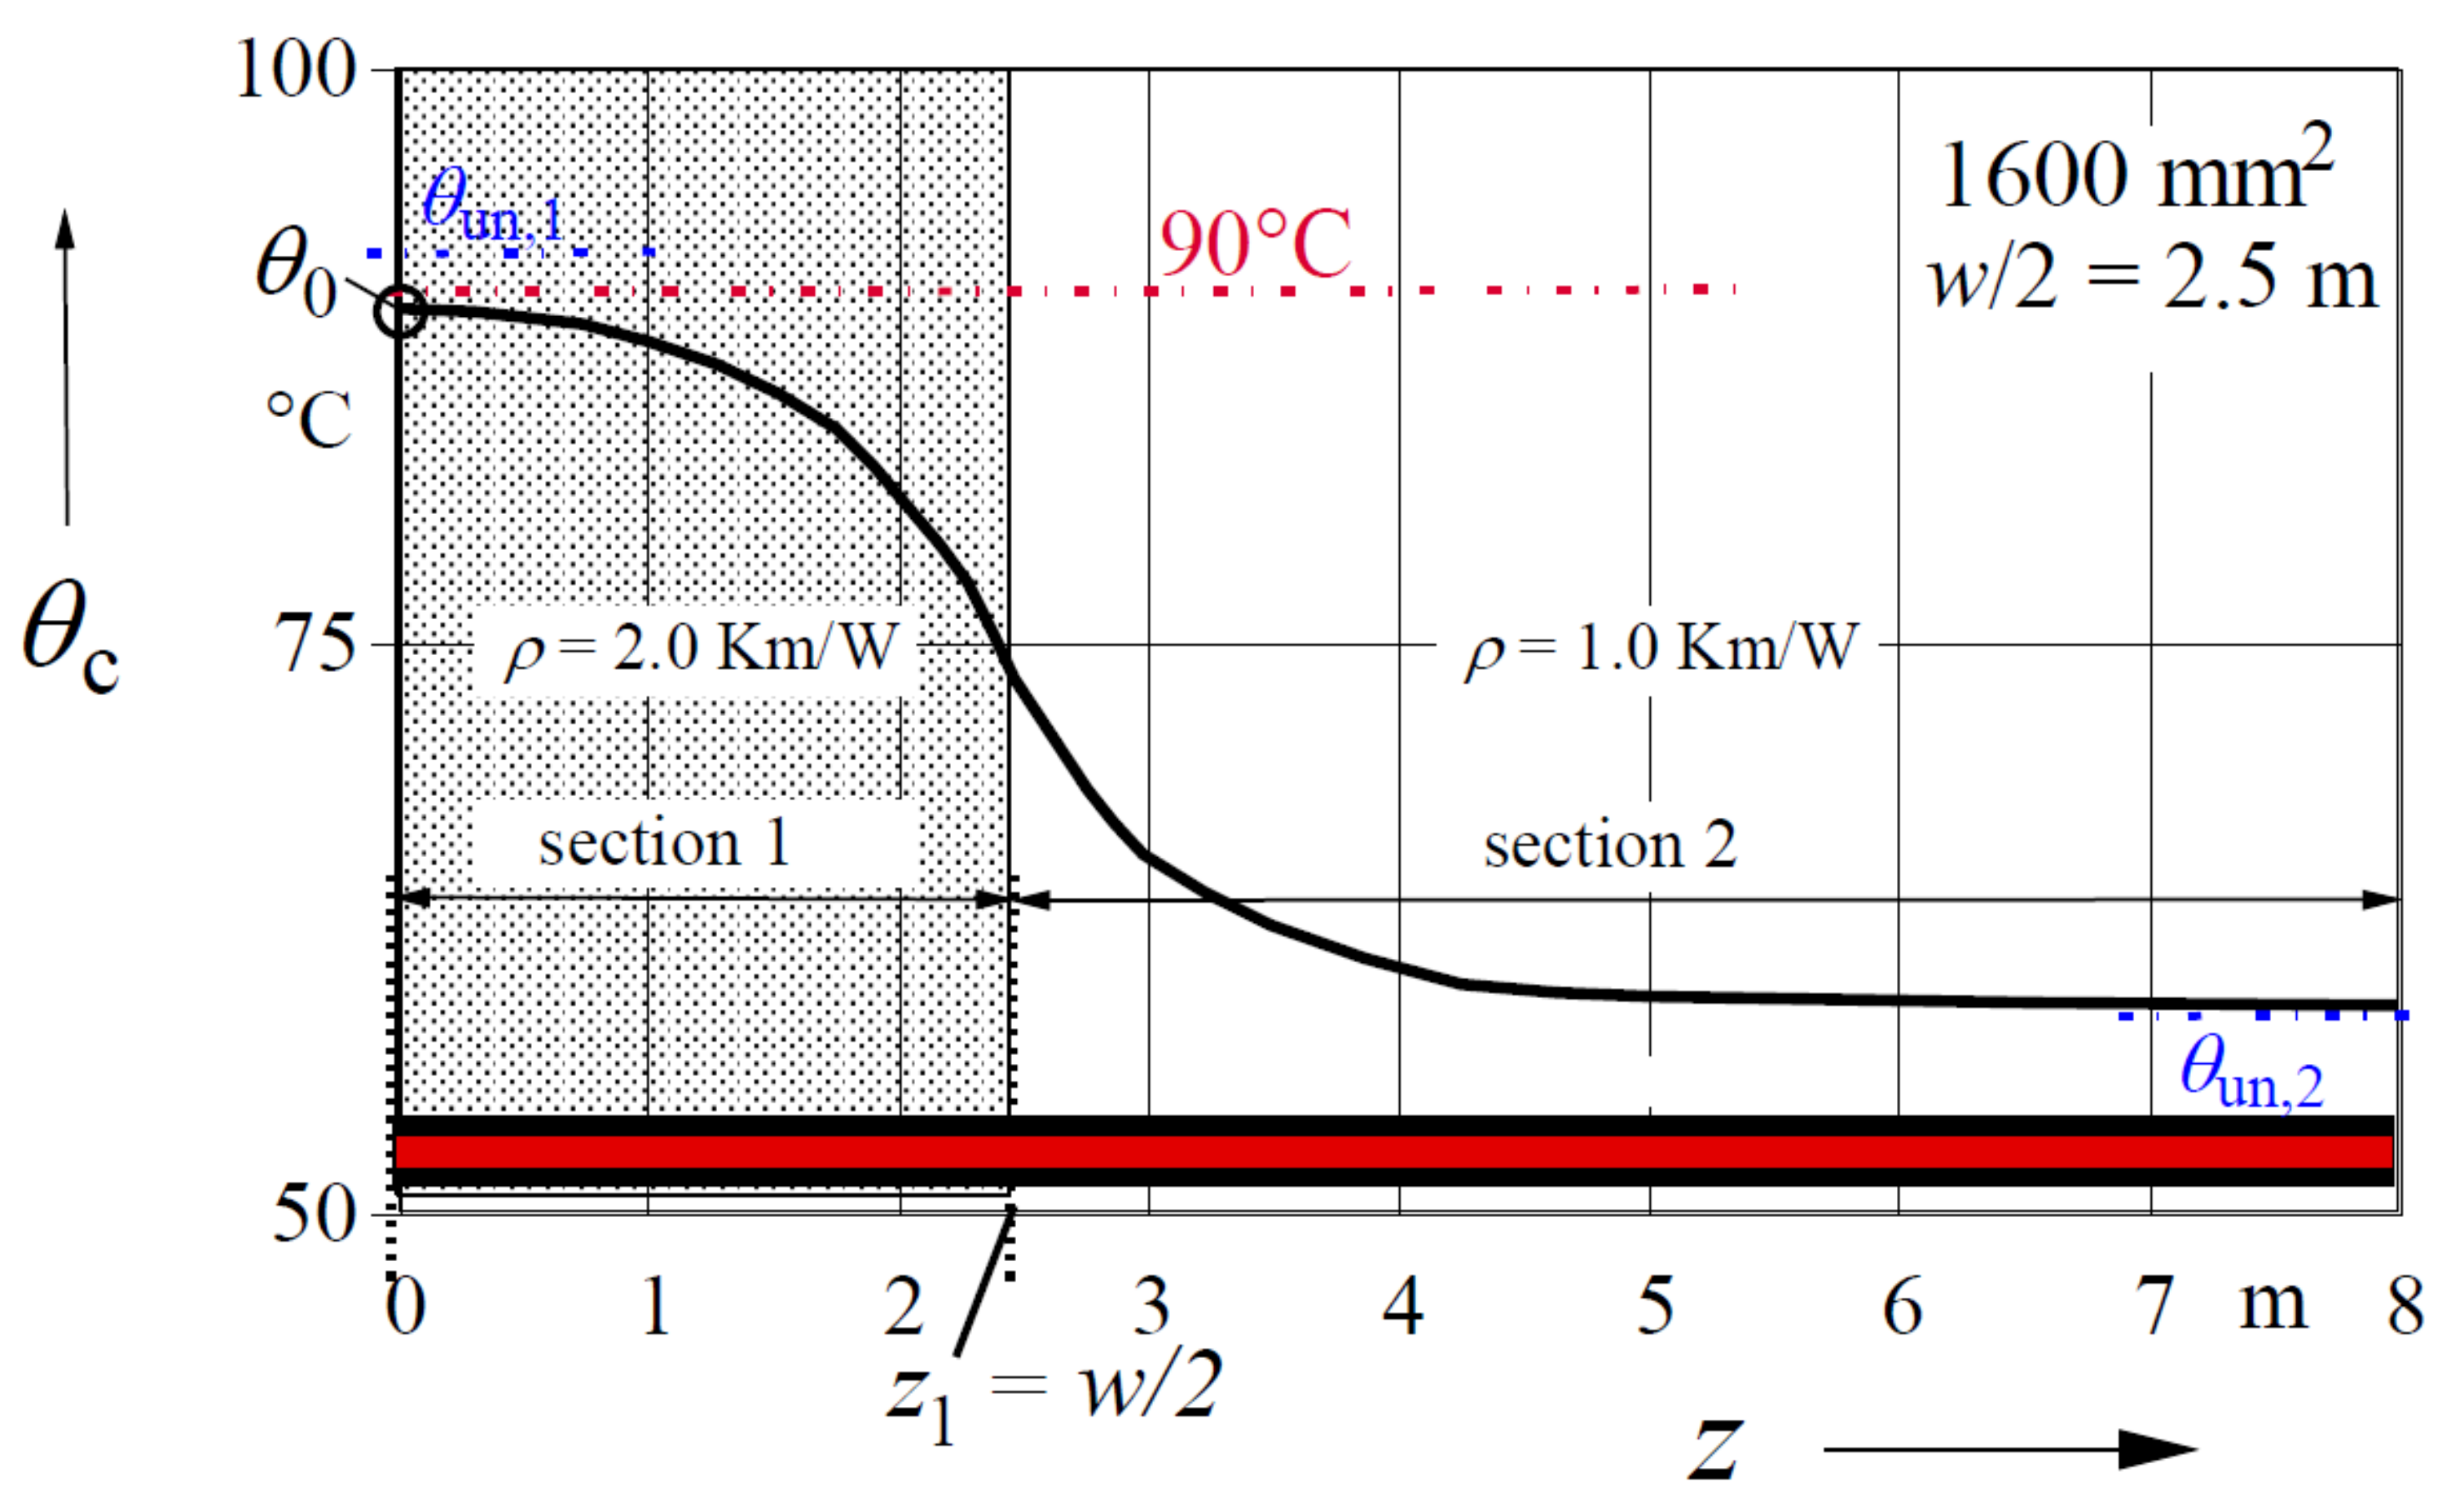
Figure 6 shows the run of the conductor temperature for a width
w = 5.0 m. Most interestingly, and in the most cases, the searched result of this problem is the maximum temperature
θ0 in the middle of the band (
z = 0). For this, we obtain from (24) the following solution:
since
;
;
.
Thus, (25) offers a simple possibility for a quick analysis of the question: if for the given band width w the chosen conductor cross section is sufficient, the values
Tri,
TL, and
θui is delivered by any rating program. For the considered example, they are listed in
Table 2.
Figure 5 and
Figure 6 show the conductor temperature along the cable, while in
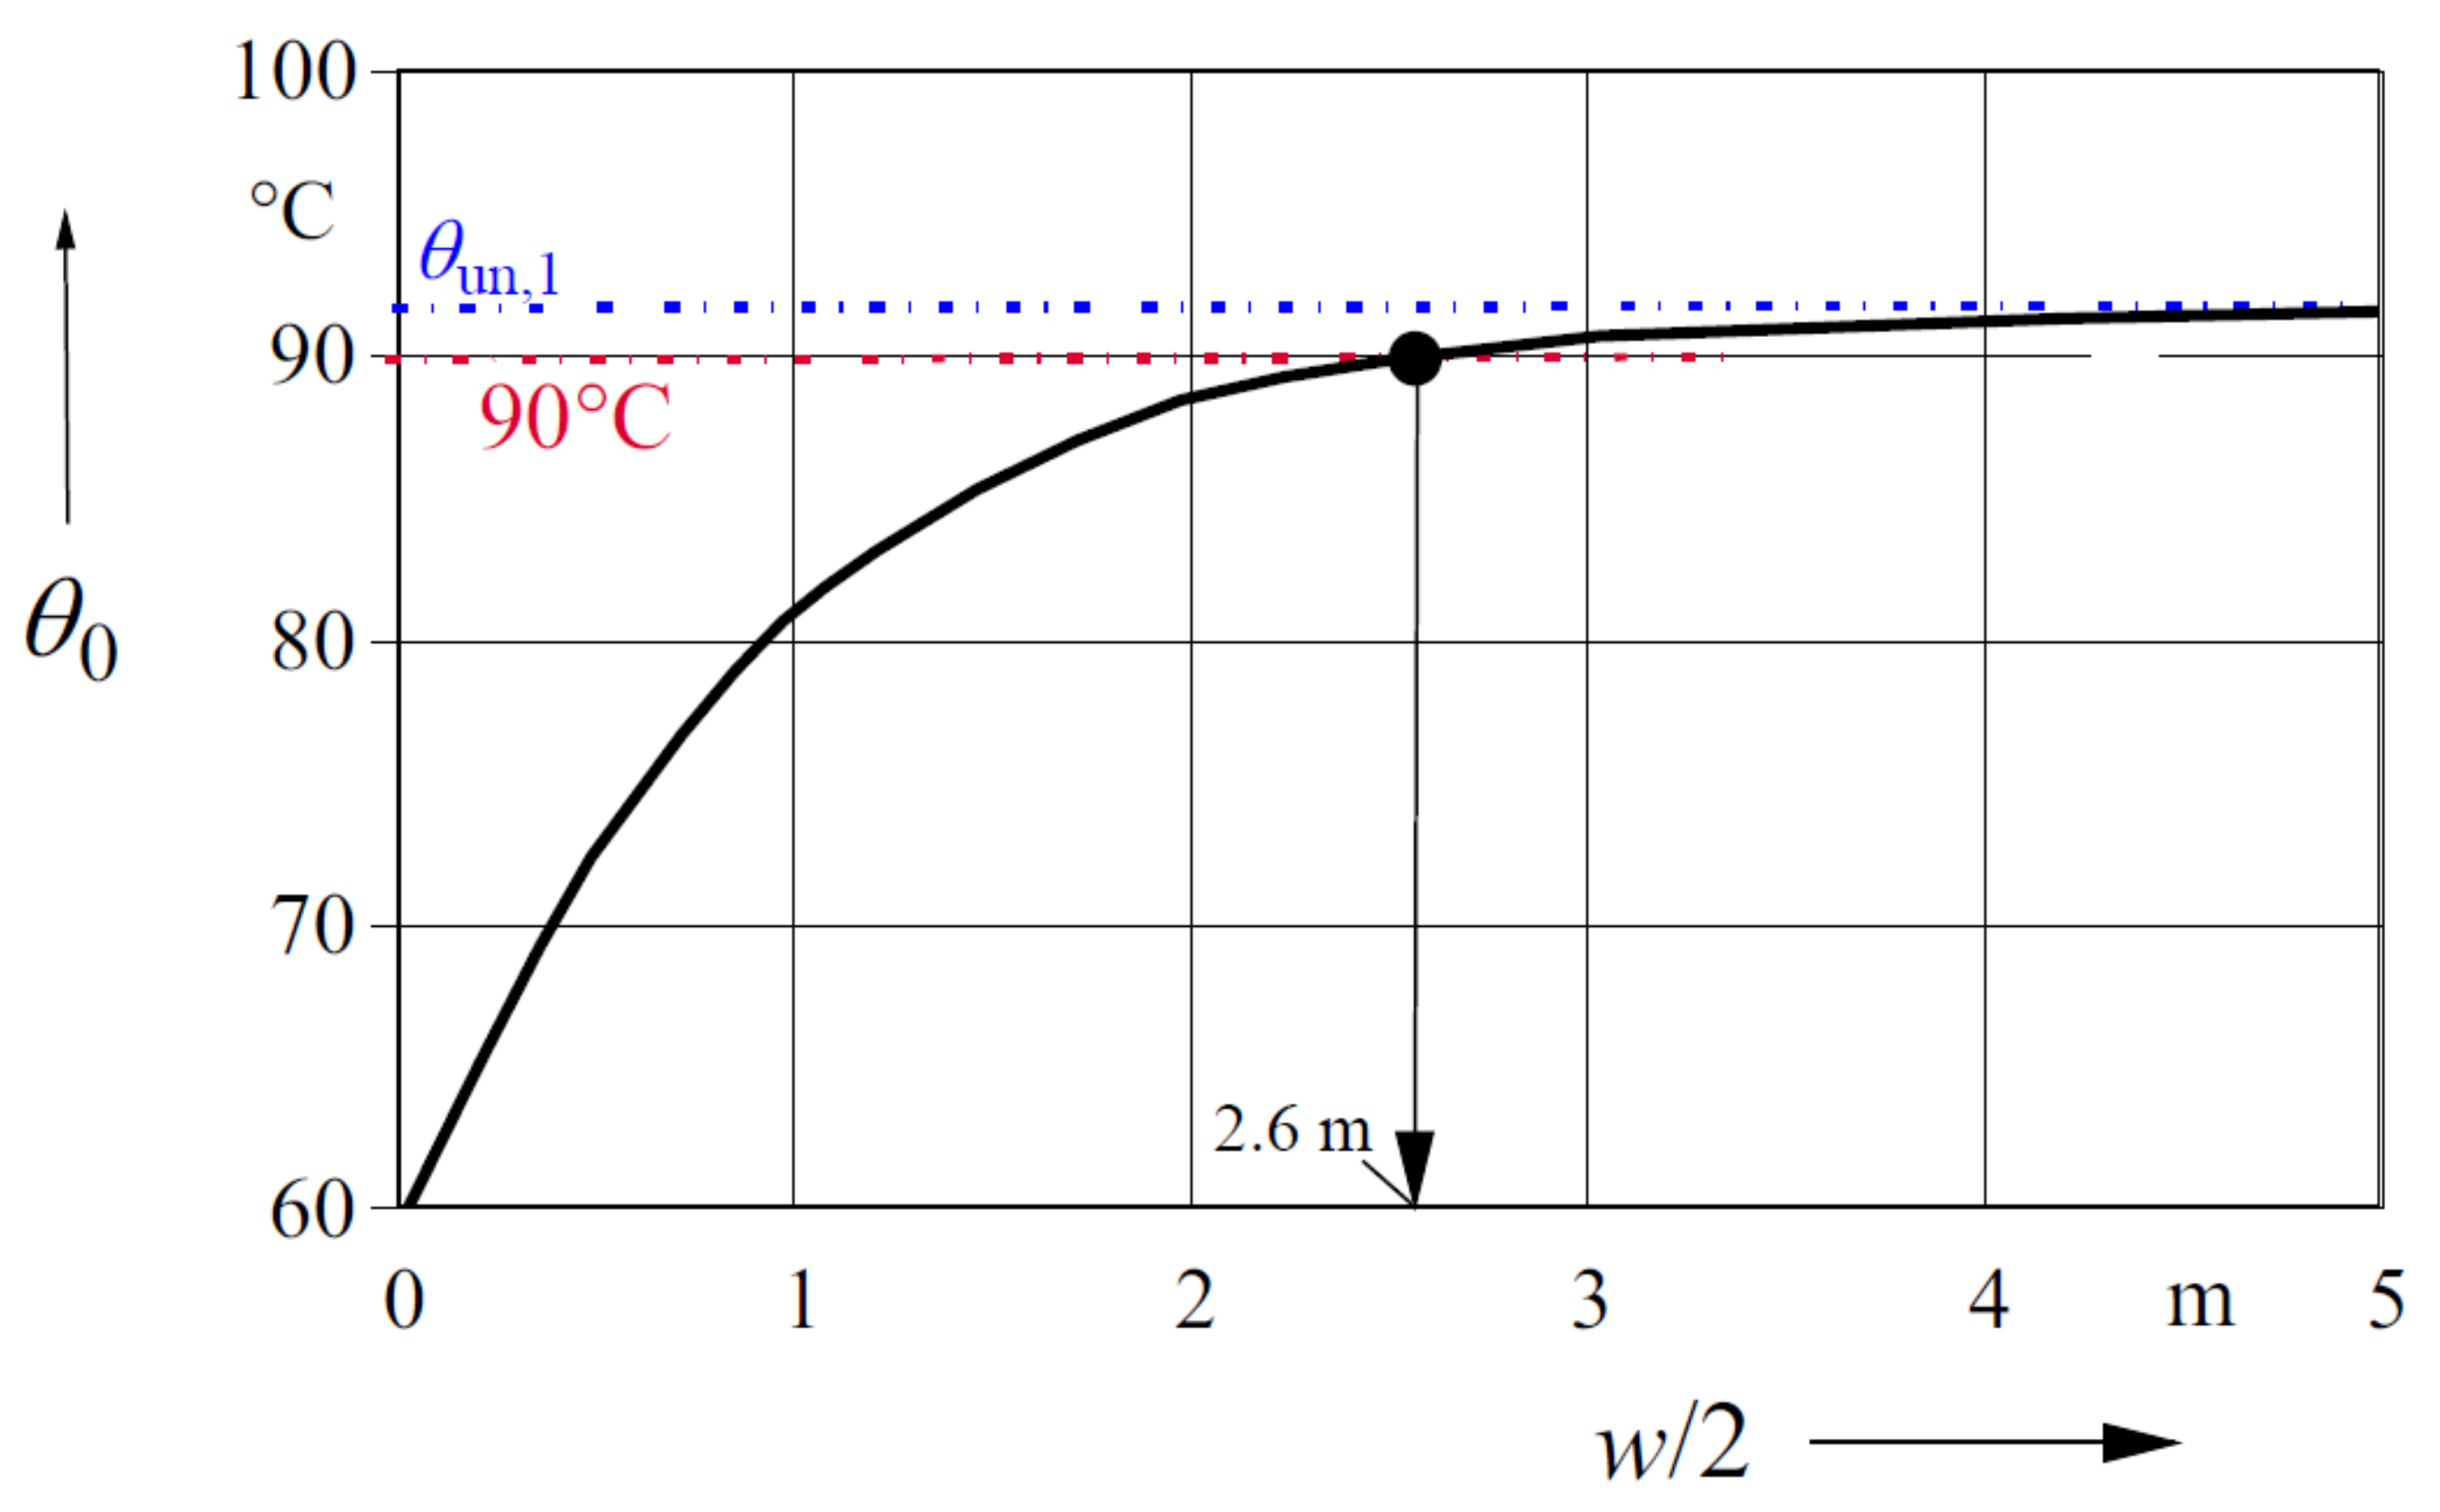
Figure 7, the maximum conductor temperature
θ0 is shown as a function of half of the band width w. It can be recognized that the cables with a cross section of 1600 mm
2 can be used for the band widths of up to 5.2 m in unfavorable thermal conditions, without exceeding the permissible conductor temperature of 90 °C.
6. Model Verification
A verification of the model was performed by comparing the analytical results with the three-dimensional FEM calculation. Consider an arrangement of three joints of a 132-kV-XLPE-cable, as shown in
Figure 8.
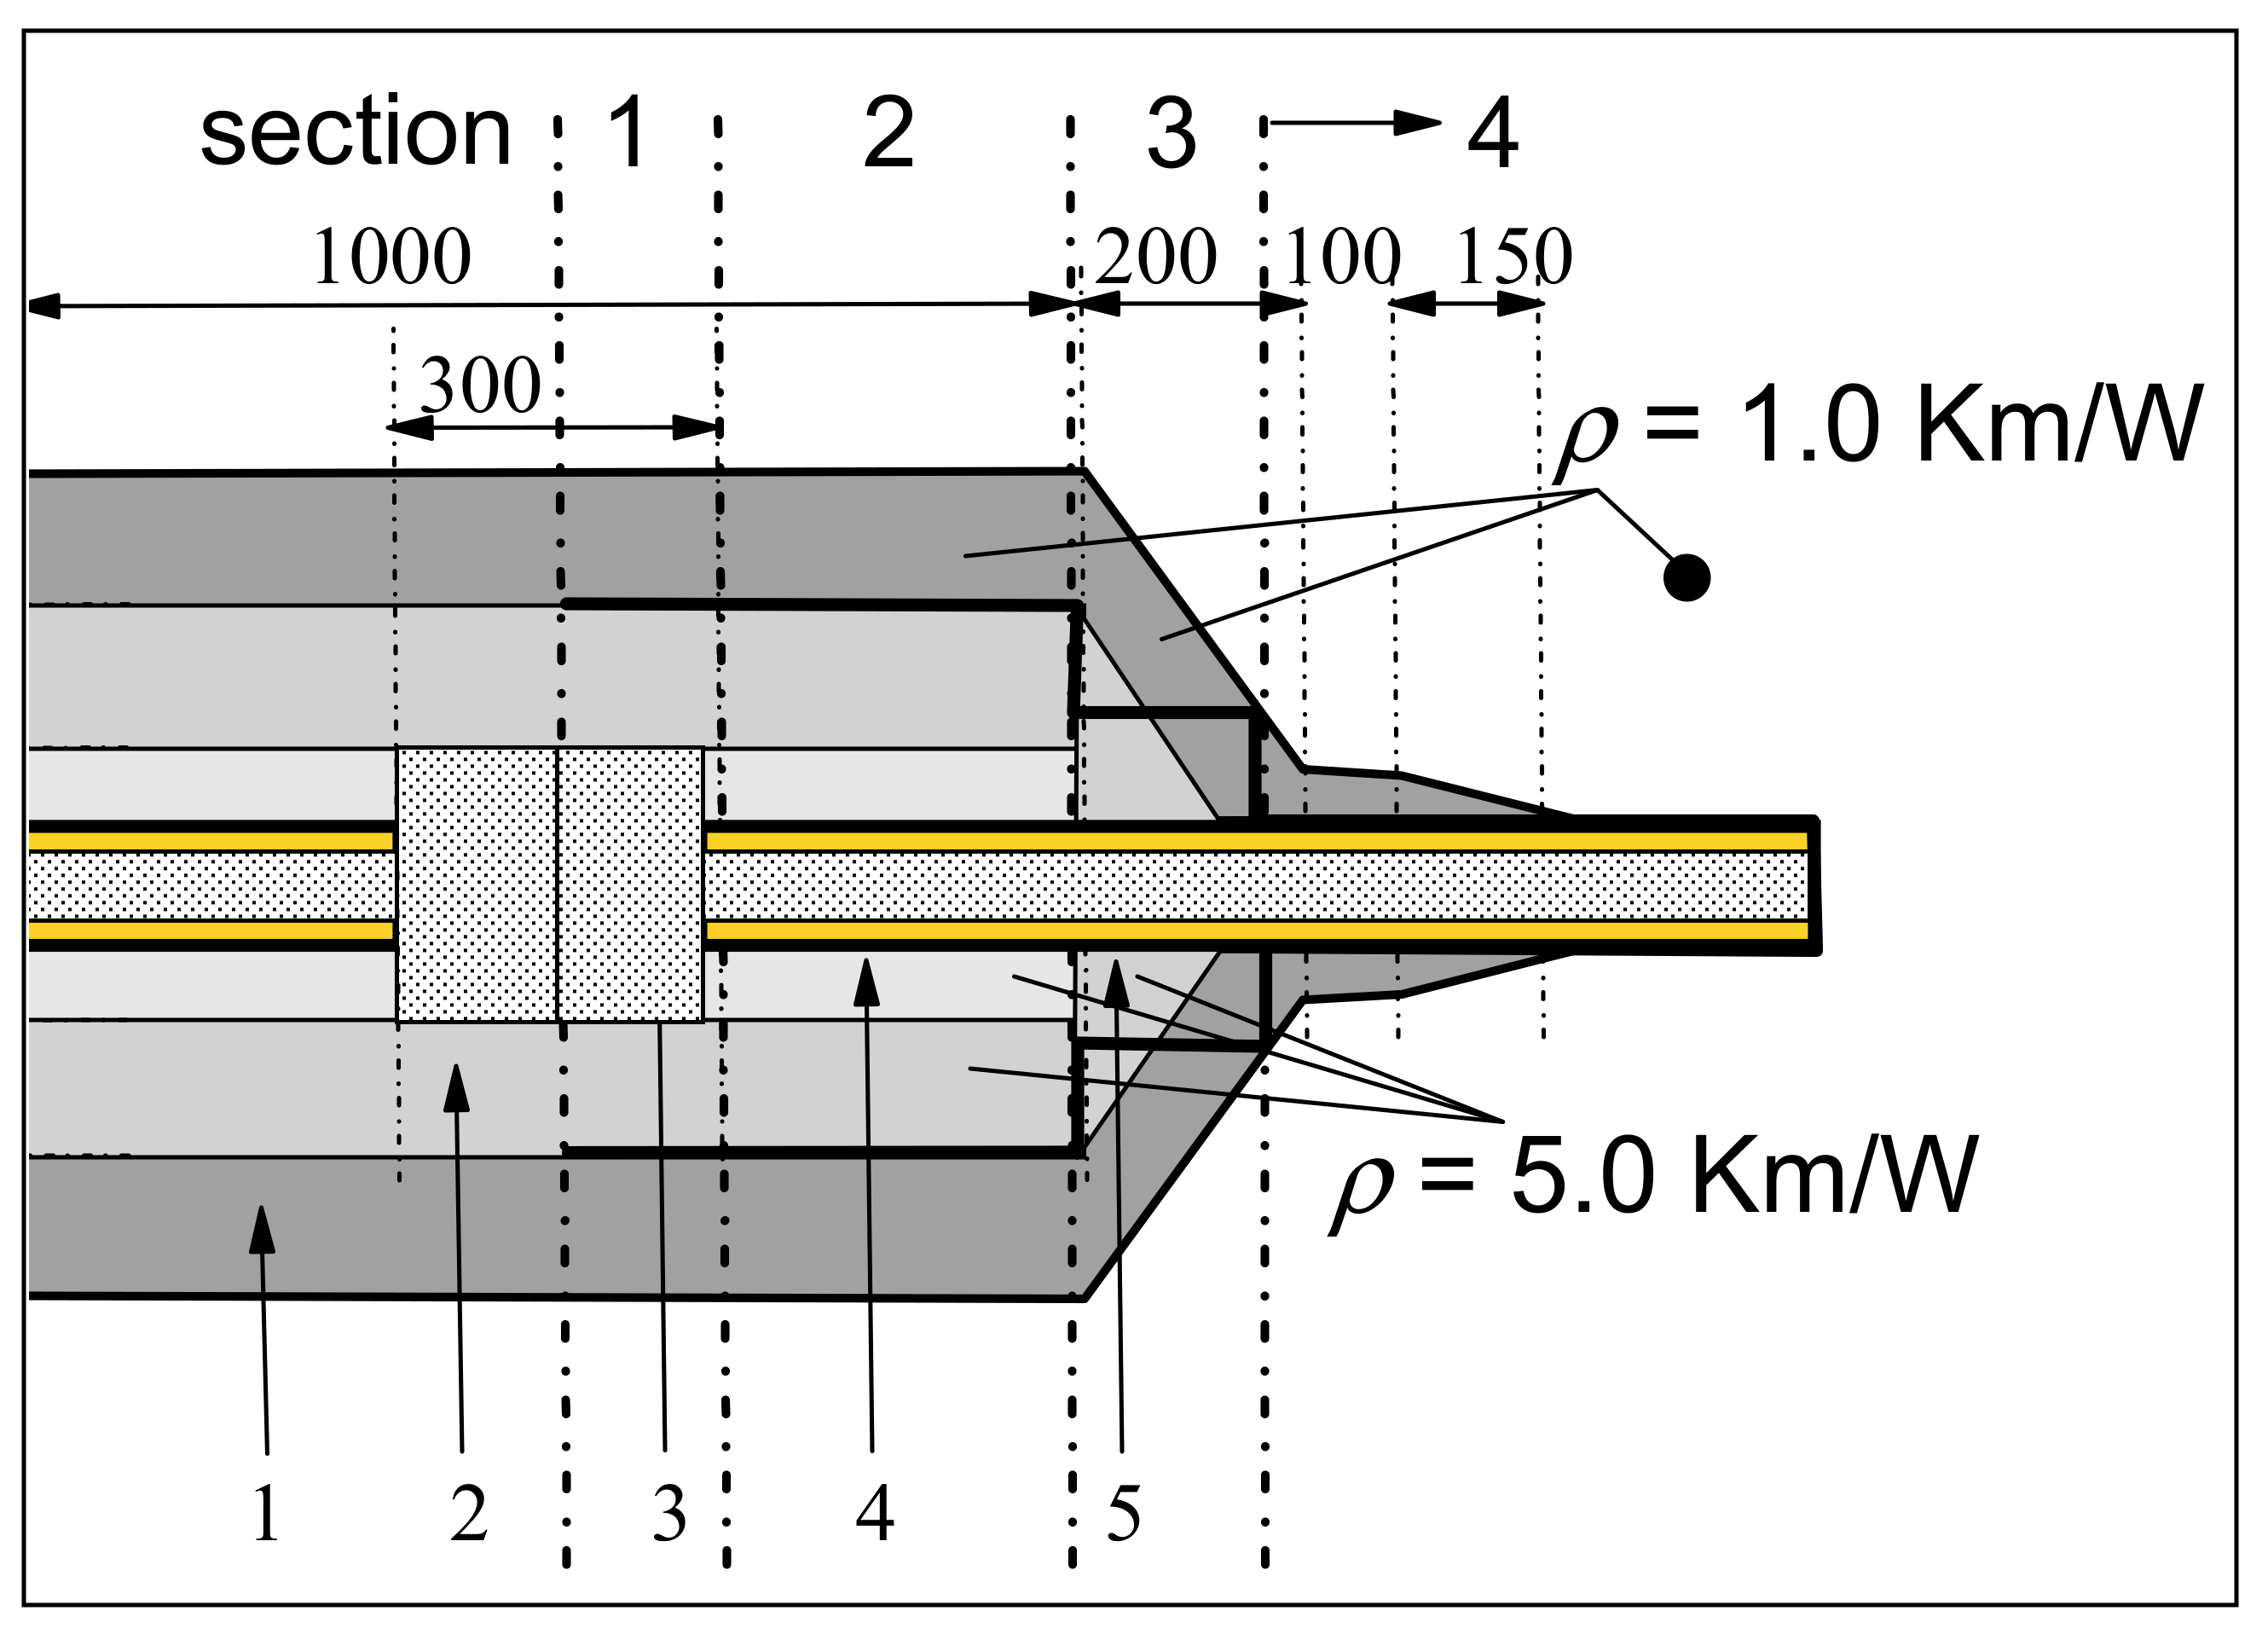
The construction of the joints is shown in
Figure 9.
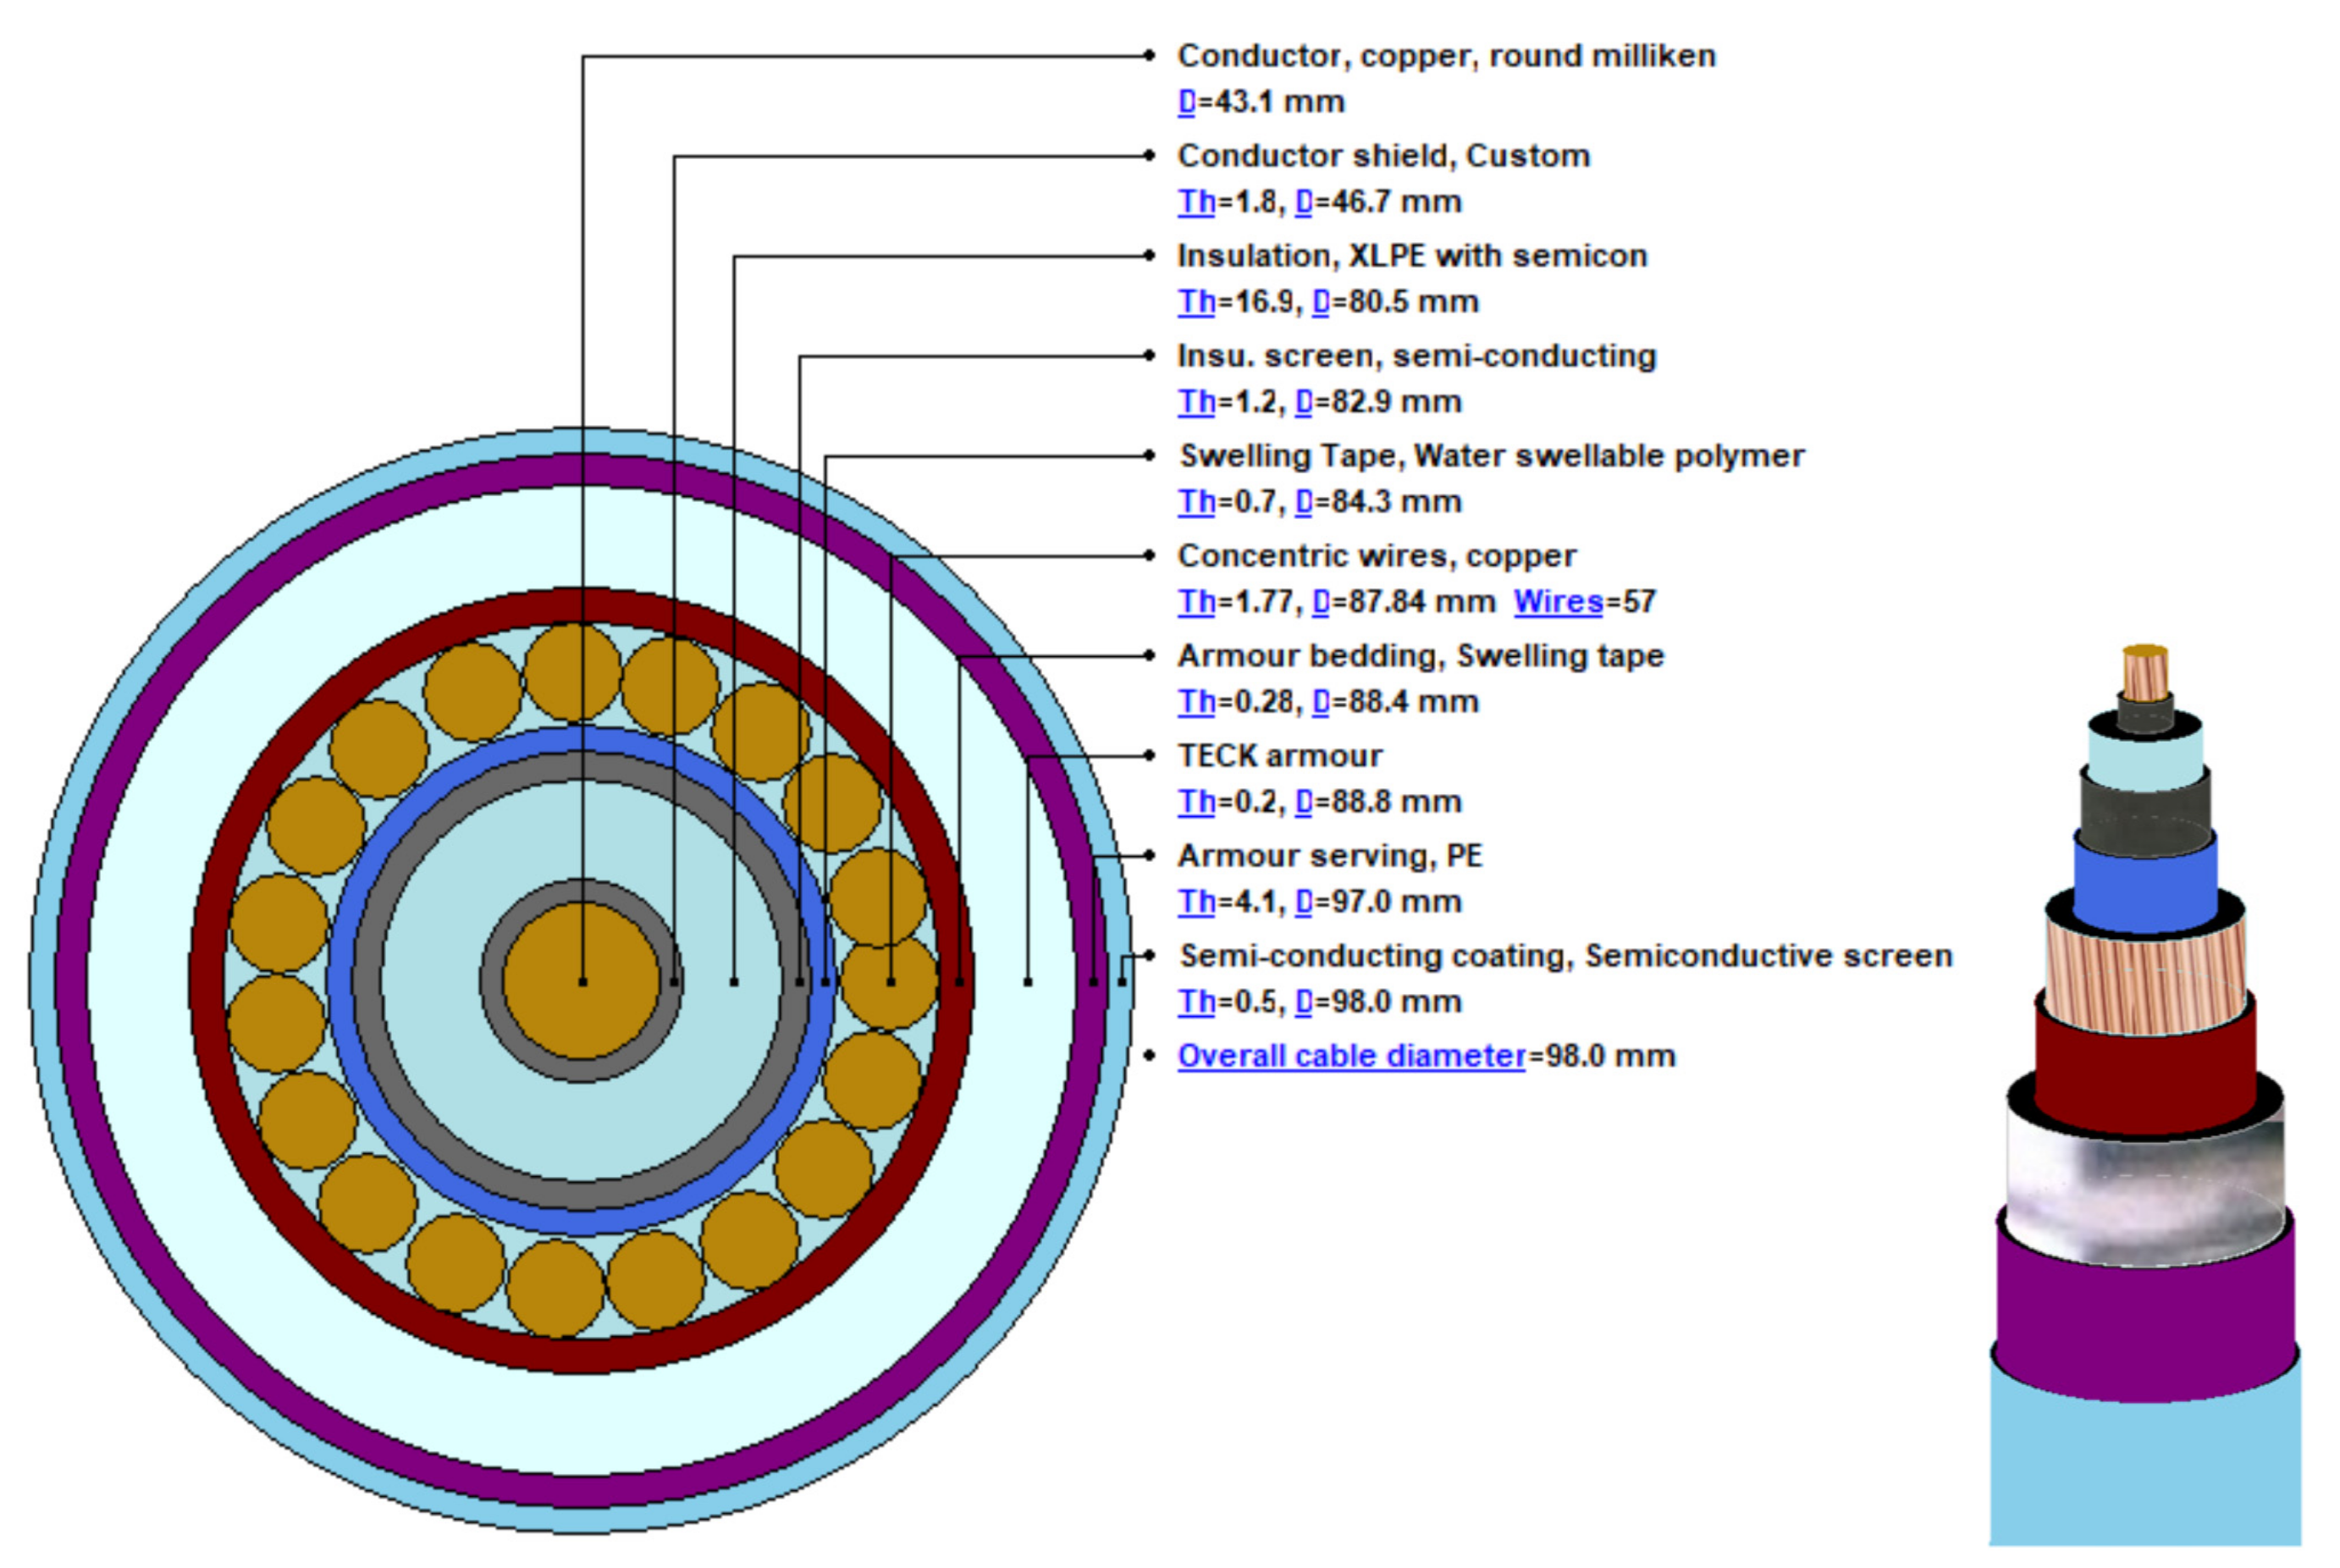
The connected 132 kV XLPE cable with a segmental 1200 mm
2 copper conductor is described and discussed in CIGRE TB 880 [
20]. The data for this cable are shown in
Figure 10.
The parameters used for the simulations are included in
Table 3.
A 3D FEM analysis was performed using the COMSOL Multiphysics software v.6.2 [
21]. The heat transfer problem numerically solves the heat conduction equations:
where
θ is the temperature (°C),
is the heat generated inside the cable (W/m),
is the thermal diffusivity of the medium (m
2/s), with ρ as the thermal resistivity of the material (km/W) and c (J/m
3) its specific volumetric heat capacity. In the steady-state conditions considered here, the right hand side of (26) is equal to zero.
The boundary conditions associated with (26) can be expressed in two different forms. If the temperature is known along a portion of the boundary, then
where
is the known boundary temperature that may be a function of the surface length
s. If heat is gained or lost at the boundary due to convection
or a heat flux
q, then
where
n is the direction of the normal to the boundary surface,
h is a convection coefficient, and
is an unknown boundary temperature. The solution of these equations yields the temperatures at all points of the region, including the cable conductor.
The cables and the joints are 1 m apart, with a soil thermal resistivity of 1.0 km/W and an ambient temperature at the top boundary of 20 °C. The remaining boundaries are no flux surfaces. The conductor current is set at 1458 A, whereas the screen losses are zero with the assumption of cross bonded installation with equal minor section lengths.
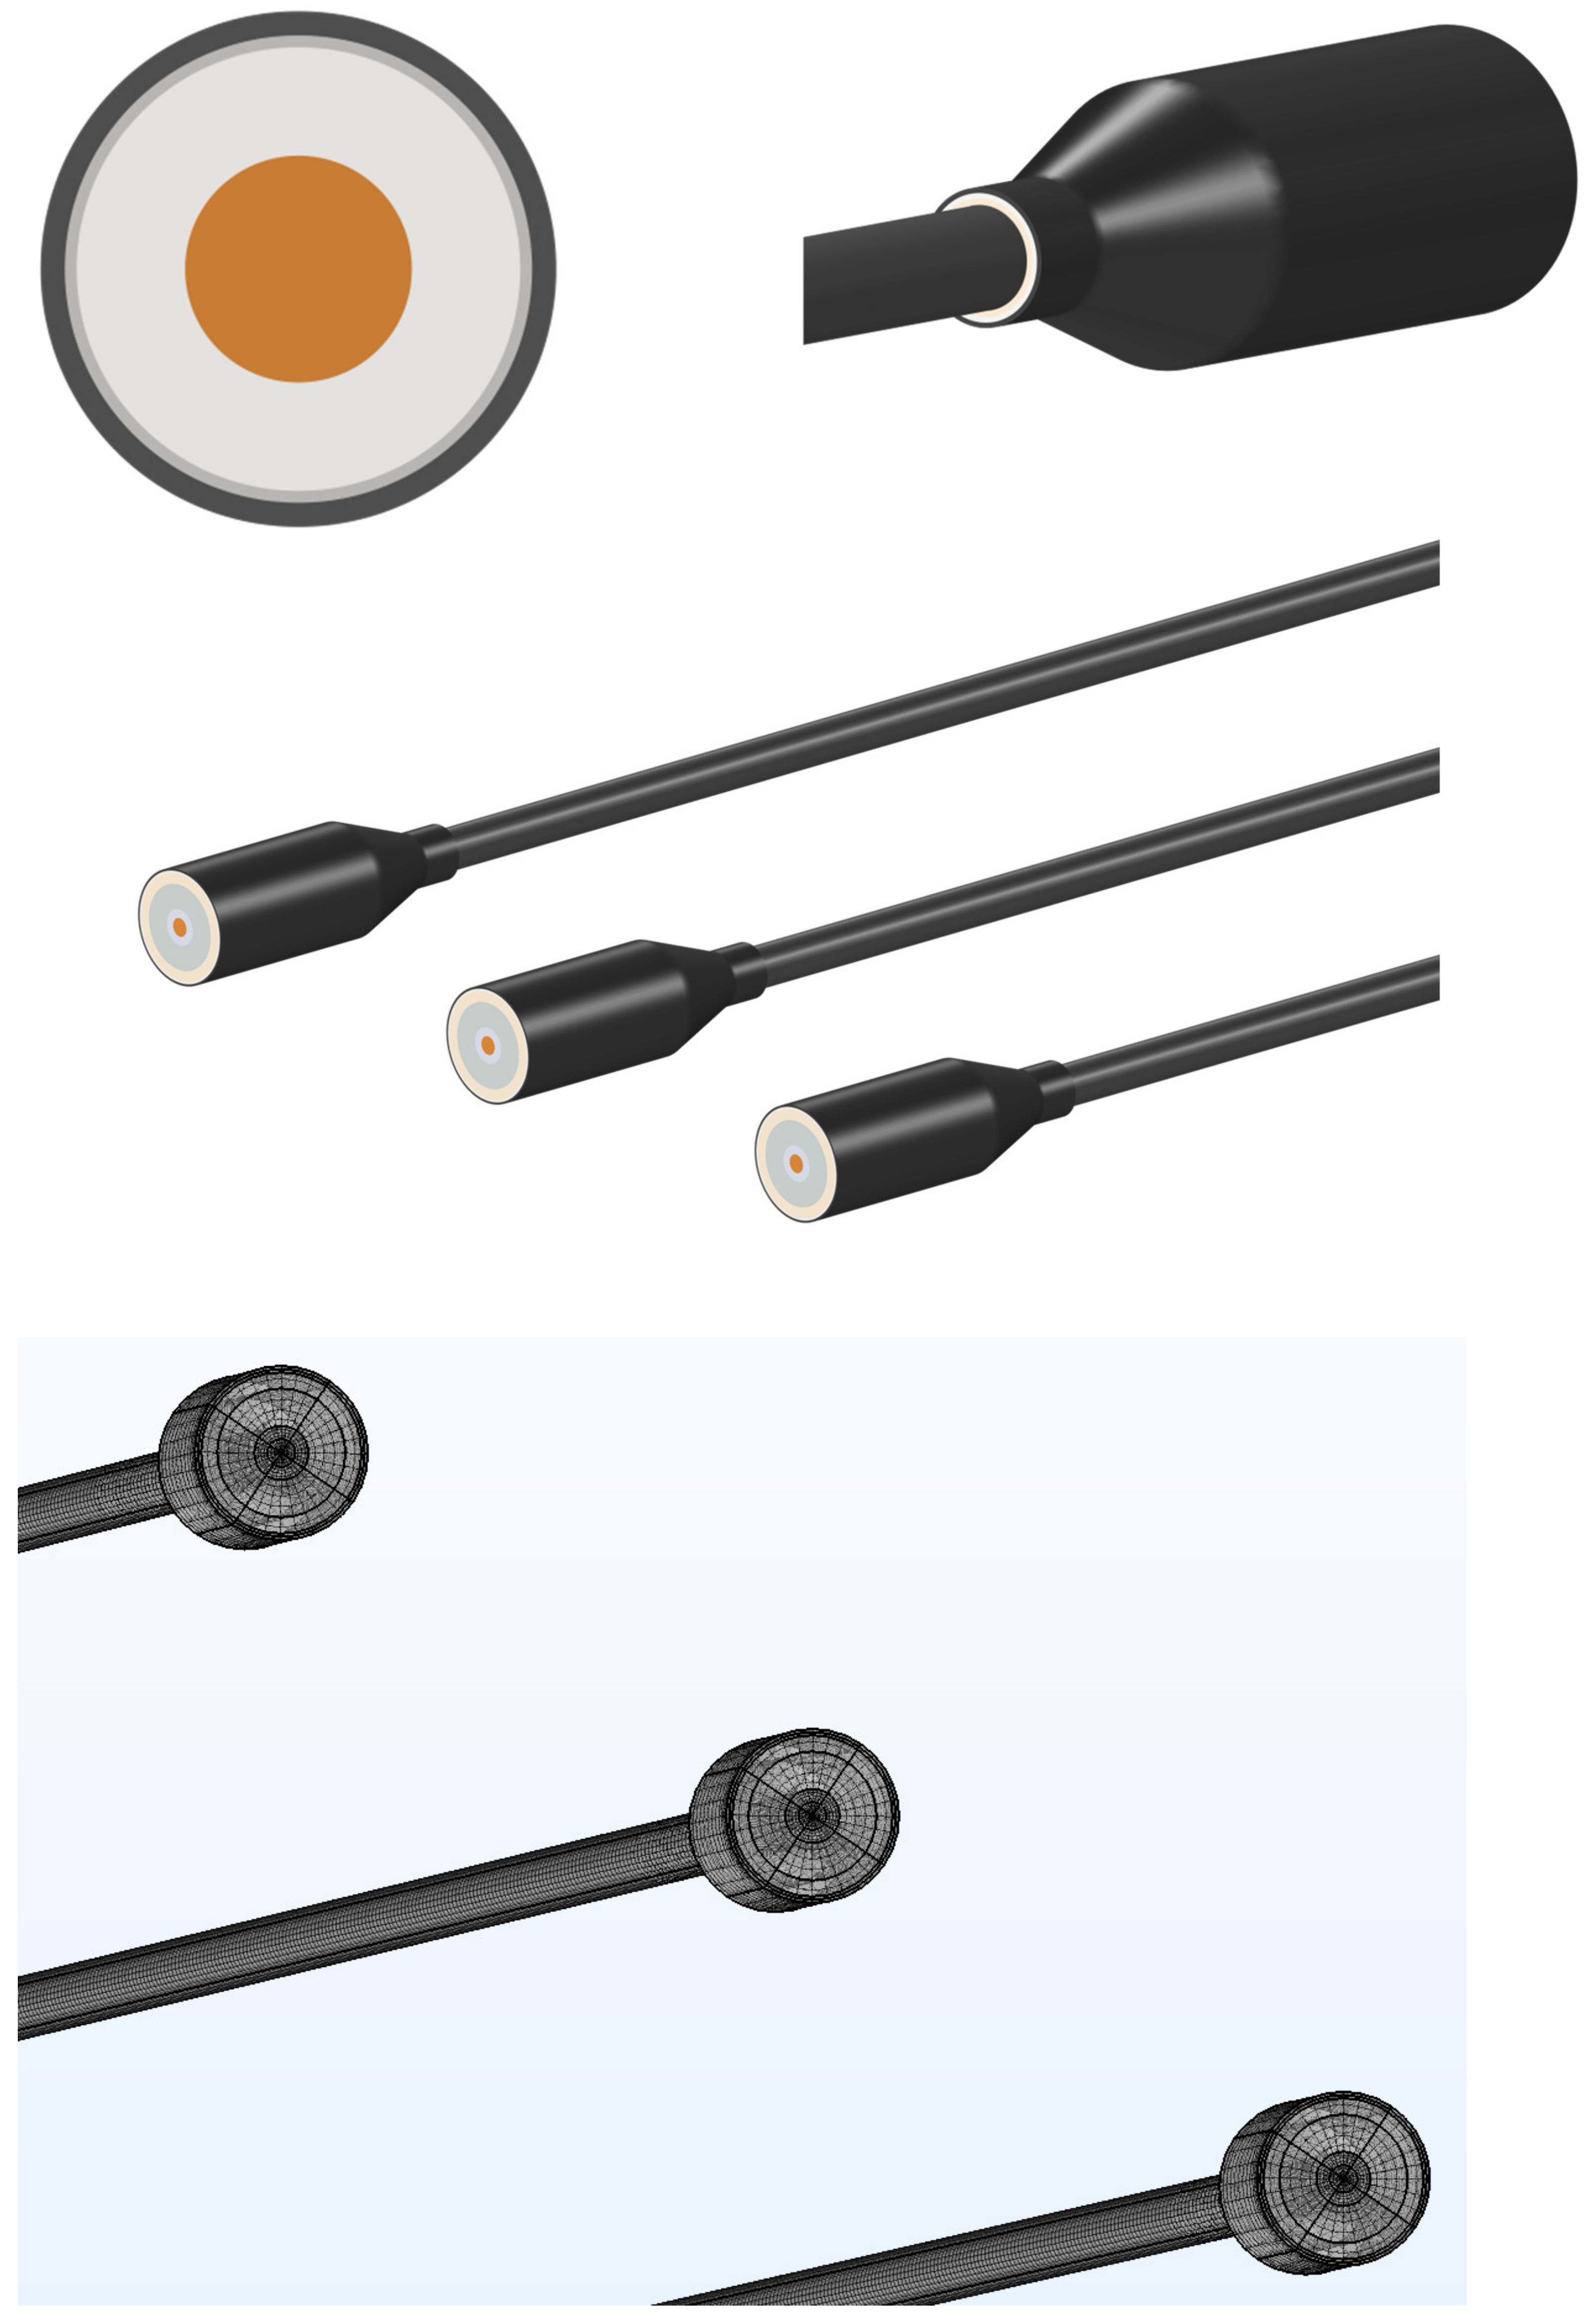
Figure 11 illustrates the models and the mesh created in the FEM program.
Figure 12 shows the temperature field of the installation.
Figure 13 shows the representation of the joint in the analytical calculations. Since the considered system is symmetric, it is sufficient to represent only one half of the arrangement, beginning with the center plane of the joint. The parts of the joint with a thermal resistivity deviating from the ambient value of 1.0 km/W are represented by cylinders, as shown in
Figure 13. Only four sections are required here.
Figure 14 shows a comparison of the distributions of the conductor temperatures in the middle joint (“center”) as well in the outer joints (“leading”, “lagging”) for a load current of 1458 A.
7. Conclusions
In this paper, we address the problem of laying conditions along a cable route. The two most common situations encountered in practice are the presence of cable joints and circuits crossing regions with unfavorable thermal conditions. In the first case, the question is “When calculating the cable rating without the consideration of the joints, are we committing an error, which might result in the cable overheating?”. To answer this question, we need to be able to calculate the conductor temperature in the joint and its vicinity. The theory presented in Chapter 3 addresses this problem. The numerical example presented in this chapter shows that if the joint is treated as a regular cable with increased insulation thickness, the conductor temperature increases to about 121.1 °C if the longitudinal heat flux is neglected, thus far beyond the permitted limit of 90 °C. This underlines the importance of modeling a three-dimensional heat flow in such cases.
A related problem is the question: “What is the maximum length of a thermally unfavorable region so that the selected conductor design, based on “normal” region conditions, is still adequate from the ampacity point of view?”. This problem is addressed in Chapter 5.
A method is presented, which allows cable temperatures to be determined along sections of the route with differing thermal parameters. In principle, the number of these sections is unlimited. The application of this method is shown in an example of a transition joint and changing soil parameters, i.e., for five sections.
A frequently occurring situation is the two-zone problem, where a zone with unfavorable conditions is embedded in an area of normal conditions. In this case, normally the maximum temperature, occurring in the middle of the arrangement, will be of crucial interest. In this context, a simple possibility for a quick analysis is derived, which needs only a few parameters and can be achieved by normal algorithms for ampacity calculations. In the numerical example presented in Chapter 5, the length of the section with unfavorable thermal conditions (thermal resistivity of the soil is double of that in the remaining sections of the route) extends to about 5 without exceeding the permissible conductor temperature of 90 °C.
In another example of a joint arrangement, a comparison is shown between the results of a three-dimensional FEM analysis and those of the proposed analytical method. The results show a very good agreement.
