1. Introduction
The research aims to examine the impact of climate change on medium-sized photovoltaic systems up to the end of the century. Through simulation-based impact analysis, the study seeks to uncover the relationship between the annual output performance and the key input values, namely, the annual daily average global horizontal irradiance and the annual average air temperature. It aims to identify the fundamental differences between the mid-century and end-century results. The objective is to compare three fundamentally distinct climate scenarios. The study examines the progression of photovoltaic technology in three Central European settlements under three possible climate scenarios, simulated up to the year 2100. These scenarios derive from the Representative Concentration Pathways (RCP) family and project different climate trajectories [
1].
The research’s background lies in the fact that climate change affects renewable energy sources, including photovoltaic electric energy production. This is partly due to significant changes in the number of sunny hours per year and the annual average temperature due to climate change. The number of sunny hours significantly impacts the performance of photovoltaic modules, directly influencing the annual electricity output of photovoltaic systems. Another underlying factor is that PV panels are based on semiconductor technology, which means that rising temperatures reduce the efficiency of PV cells.
Climate change is influenced by various other renewable energy sources as well. The influence of climate change on the capacity for wind energy differs across different geographical areas. North America is projected to have an increase in wind speeds, whereas the Mediterranean region is likely to see a drop. Long-term wind speed growth is forecasted in Northern Europe. The correlation between climate fluctuation and wind power generation is intricate, and the precise geographical distribution and magnitude of the effects are yet unknown [
2].
Contrary to the disputed information, the UK Intergovernmental Panel on Climate Change forecasts a decline in worldwide wind speeds in the upcoming decades. According to the body’s calculations, the average annual wind speed is projected to decrease by a maximum of 10 percent by the year 2100 [
3].
Precise wind velocity information is crucial for the effective planning and functioning of wind turbines. Nevertheless, the absence of wind speed data collected at the height where operations take place, along with irregular reanalysis data, impedes the dependability of wind source and condition projections based on models [
4].
Hydropower is a crucial kind of renewable energy, but it can be negatively impacted by alterations in hydrological conditions caused by climate change, such as variations in river flow and reservoir storage [
5].
Geothermal energy relies on the thermal properties of the Earth’s crust. The greater the depth from which the heat originates, the more reliable and consistent this energy source becomes. Climate change mostly impacts the uppermost layer of the earth’s crust, and this influence is mainly indirect, resulting from the production of precipitation and water flow on the surface [
6].
Climate change has the potential to impact bioenergy production both directly and indirectly. Variations may arise in the growth, productivity, and accessibility of plants utilised as biomass feedstock. Severe weather phenomena like droughts and floods can have a substantial impact on the production and distribution of biomass. Climate change can have an impact on the overall health of forests and their propensity to produce biomass. This, in turn, can affect the long-term sustainability and availability of bioenergy [
7].
2. The World’s Growing Energy Demand
Global energy demand is projected to increase significantly in the future. While energy demand was 178,899 TWh in 2022, it is expected to rise to 250,488 TWh by 2050, representing an average annual growth rate of 1.1% [
8,
9]. One reason for this increase is the expected population growth from 8 billion to 9.7 billion by 2050 [
10]. Another reason is the rapid growth of industry, which could more than double the global economy by 2050 compared to 2016, thanks to improvements in productivity [
11]. The Earth’s population has increased by 2 billion in just one generation, with developing countries being the most affected. This, naturally, has led to a rapid increase in energy demands. Each region and country responds to this challenge according to environmental and geographical conditions. The availability of energy resources is a limiting factor in meeting the energy needs of industry and the population [
12]. Many regions distant from energy networks struggle with energy shortages. In numerous regions, available energy resources are highly polluting and nearing depletion. In such regions, ecosystems have already been damaged due to the use of fossil fuels. Developing countries, in addition to the increasing energy demands of their populations and industries, must also contend with international expectations regarding climate protection. At the current level of technology, renewable energy sources cannot fully meet the required energy demand. Hence, fossil energy carriers will remain with us for some time.
Due to its low carbon dioxide emissions, nuclear energy will play a significant role in climate protection efforts in the future. However, the issue of decommissioning nuclear power plants is not yet fully resolved [
13]. The long-term use of fossil energy sources can lead to climate change, increasing the likelihood of severe natural disasters and harming ecosystems—and the entire planet [
14].
The significance of mining in relation to renewable energy is often underestimated. It is important to acknowledge that a significant portion of the raw materials required for renewable energy comes from mining. Another area in which mining is intricately connected to the generation of renewable energy is the retrieval of fossil fuels. For a reliable electricity supply, it is necessary to have not just a majority of renewable energy providers but also an increased number of fossil-fuel power plants. The output of renewable energy sources, such as solar electricity generation, is dependent on weather conditions. However, to ensure a consistent supply of electricity, additional power plants are needed. These power plants mostly rely on fossil fuels. Hence, the environmental ramifications of renewable energy sources should be regarded as a composite of their effects.
The greenhouse gas emissions per unit of generated (electric) energy is a crucial metric for comparing different energy-generating technologies. When comparing different energy sources, coal emits 820 g per kilowatt-hour (g/kWh), natural gas emits 490 g/kWh, photovoltaics emit 41–48 g/kWh, geothermal energy emits 38 g/kWh, hydroelectric energy emits 24 g/kWh, nuclear energy emits 12 g/kWh, and wind energy emits 11–12 g/kWh of CO
2 equivalent. It is evident that fossil fuels are the primary source of greenhouse gas emissions. Regarding the allocation of carbon dioxide emissions resulting from the burning of fossil fuels, approximately 45% originates from coal, around 35% from oil, and roughly 20% from gas [
15].
It is important to remember that every power-producing technology releases greenhouse gasses at some point in its life cycle. This applies to fossil fuels, which not only release greenhouse gases during energy production, but also make a substantial contribution to the emissions of climate-altering gases during the mining process. However, it is important to acknowledge that the manufacturing of materials utilised in renewable energy technologies, as well as the extraction of their raw materials, results in the release of greenhouse gases.
The total eradication of coal mining and industrial utilisation yields undesirable consequences. Various strategies are under consideration to mitigate the adverse ecological consequences of coal mining. One of the most effective ways to decrease carbon emissions is by using phytoremediation technologies to restore crop cover. Additionally, it is beneficial to establish coal deposits in areas that have been re-cultivated in technogenically contaminated coal mining regions. These findings have the potential to contribute to success not only in coal mining but also in the extraction of gas and oil [
16].
Mining corporations may greatly diminish the impact of climate change and greenhouse gas emissions on mines by implementing more advanced and effective management techniques. Resources and production frequently result in a reduced carbon footprint. This can be attributed to the implementation of innovative technology, the proactive measures taken by management to conserve energy, and the adoption of legislative decisions aimed at mitigating greenhouse gas emissions [
17].
During coal mining, significant emissions are generated from the area where coal plants are located. Hydrocarbon gases are classified and organised based on their absorption properties, and this classification is available without any cost. Once the majority of methane, which is the most easily evaporated part of hydrocarbon gasses, has escaped from the coal deposit, denser hydrocarbons, including ethane, propane, butane, pentane, and hexane, start to be released. All of these gases are highly potent greenhouse gases, contributing significantly to the greenhouse effect caused by carbon dioxide. Methane is a greenhouse gas that is 20 times more potent than carbon dioxide [
18].
Currently, the mining industry in the Russian Federation is obligated to disclose information regarding its carbon impact. Since the European Union heavily relies on Russia for its supplies, the carbon footprint of the EU is indirectly affected by the extent of Russian mining and its associated emissions [
17].
Potential alterations in climate variables in the future could have a substantial impact on the capacity of the energy sector to transition effectively in order to alleviate climate change. This encompasses activities such as mining, energy generation, transformation, transportation, and ultimate utilisation [
19].
3. Electric Energy Production with Renewable Energy Sources
This chapter discusses the current and future trends in renewable electric energy production. It highlights that the increasing demand for electricity globally is being met by expanding renewable energy sources. Renewables are projected to become the dominant source of electric energy production by early 2025, surpassing coal [
20,
21]. Our modern society and economy are inconceivable without electricity, which is increasingly utilised in various sectors such as electric vehicles and heat pumps. In many places, electricity replaces fossil fuel-based heating (electrification of heating). Energy production is the largest emitter of carbon dioxide globally, emitting 36.8 Gt in 2022 and 37.4 Gt in 2023 [
22]. The primary challenge of energy transition in utilising renewable energy sources is the drastic reduction in carbon dioxide emissions while ensuring affordable access to energy for consumers [
22]. The significance of wind and solar energy is demonstrated by their production increasing by 213 TWh in the first half of 2023, significantly surpassing the global electricity demand of 59 TWh during that period. Without the utilisation of wind and solar energy, global carbon dioxide emissions would have increased by 154 million tons (2.6%) instead of the measured 12 million tons (0.2%) [
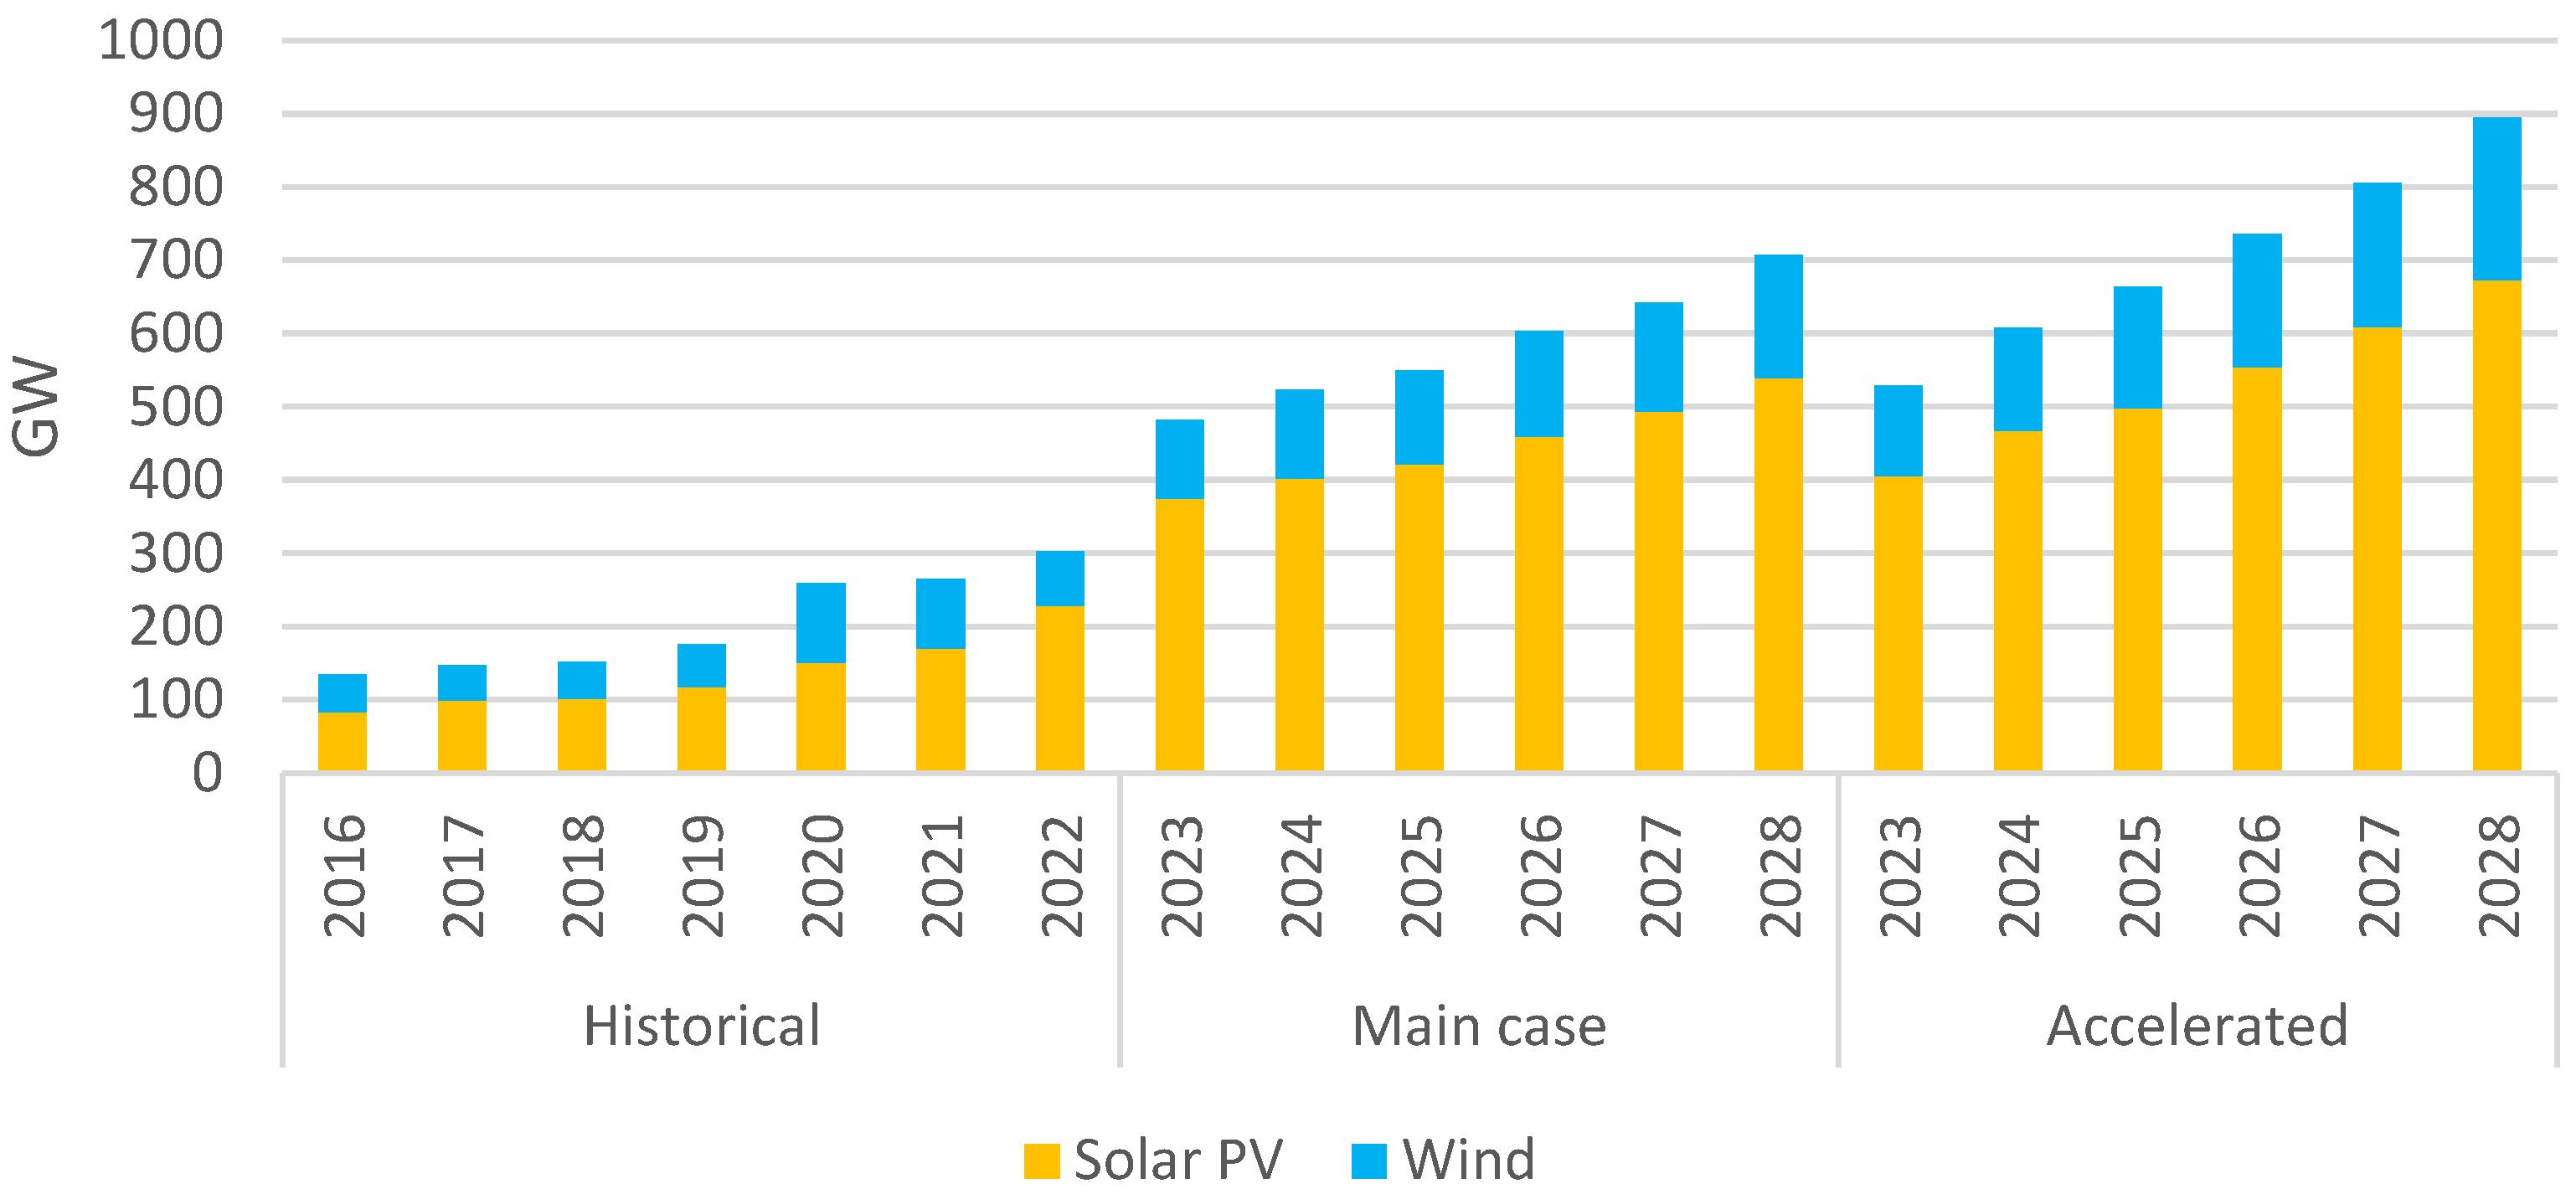
23]. According to the IEA’s 2022 study, global renewable capacity is expected to increase by approximately 2400 GW between 2022 and 2027, representing a 75% growth, equivalent to all of China’s installed energy capacity.
The past five years have seen a significant acceleration in the utilisation of renewable energy. One reason is the increased prices of fossil fuels and electricity, making renewable technologies more attractive. Another reason is the Russian–Ukrainian war, which increased demand for energy security, particularly in EU member states [
24]. In 2022, the previous year’s energy forecasts for 2022–2027 were revised upwards by nearly 30%. This revision was attributed to China’s 14th Five-Year Plan, the Europe REPower plan, and amendments to the United States’ Inflation Reduction Act (IRA) at the end of 2021 [
24,
25,
26,
27].
According to the IEA’s 2023 study, 2023–2028 will see more renewable energy capacity realised than combined in the past 100 years. Nearly 3700 GW of renewable energy capacity will be constructed during this period. Five energy turning points are highlighted for the years 2023–2028:
- -
By 2024, the combined electric energy production from wind and solar will exceed hydropower production.
- -
In 2025, renewable energy production will surpass coal-based energy production, becoming the largest source of electricity.
- -
Around 2025–2026, wind and solar energy will surpass global nuclear electric energy production.
- -
By 2028, renewable energy sources will account for over 42% of the world’s electric energy production, with the share of wind and solar energy doubling to reach 25% [
28].
Based on
Figure 1, the existing policies and market conditions in 2022, it is projected that worldwide capacity will increase to 2.5 times its current level by 2030. This results in the achievement of the triple objective. Through the successful resolution of present obstacles and the expeditious execution of established policies, governments can effectively bridge this disparity.
To ensure a more favourable timetable, it is necessary to develop a distinct action plan for each country. However, these measures can typically be categorised into four groups:
- -
Mitigating policy uncertainty and implementing novel policy measures in response to the evolving macroeconomic landscape;
- -
There is a need to expedite the development of the network infrastructure;
- -
Streamline administrative obstacles and licensing protocols, including challenges related to societal acceptance;
- -
It is imperative that we provide assistance to economies that are in the process of developing.
By resolving these issues, the report’s optimistic scenario might result in a threefold growth in renewable energy capacity by 2030, compared to the levels seen in 2022 [
29].
3.1. Solar Energy
Solar energy is one of the most advantageous renewable energy sources on Earth.
3.1.1. Advantages
It is one of the most widely used energy sources, as it can be easily converted into electricity and transported and is versatile in its applications. The conversion of solar energy—as the main source—can be classified into several main types:
- -
Photovoltaic (PV) solar energy directly converts sunlight into electric energy using photovoltaic modules. This technology is based on the photovoltaic effect.
- -
Solar thermal energy (STE), where solar energy is utilised directly in heat. Its most common applications include space heating and water heating.
- -
Concentrated solar power (CSP) harnesses the sun’s heat energy by concentrating sunlight using lenses and mirrors. A heat exchanger produces steam, which drives a steam turbine to generate electricity.
- -
Passive solar energy uses sunlight and solar heat without the use of active mechanical systems. Factors such as favourable building orientation and shading elements reduce energy costs.
- -
Building-integrated photovoltaics (BIPV) systems, where PV panels are integrated into building elements such as walls, roofs, and windows. They are also used in exterior boundary elements like fences [
30].
One significant advantage of solar energy is that it is inexhaustible. Apart from the manufacturing and installing photovoltaic modules, no harmful emissions occur. The efficiency of photovoltaic modules is continually improving, and the production cost per unit of electricity generated is decreasing. However, the efficiency of their application is strongly influenced by the location of use, as sunlight hours and solar irradiation vary geographically. Additionally, the energy demand of a particular region is crucial because favourable environmental conditions alone are insufficient if the region’s electricity consumption capacity is low [
31].
Electric energy production with photovoltaic systems offers a climate-friendly alternative to traditional energy production technologies. Minimal greenhouse gas emissions are produced during the conversion of solar energy into electricity, contributing to the global reduction in greenhouse gas emissions [
32].
Household and medium-sized solar power systems have no adverse effects on the immediate environment and ecosystem. Such solar energy is a clean energy source, with significantly less impact on air and soil quality compared to any other conventional energy production system [
33]. However, these favourable aspects may not always apply to large-scale solar power plants. Poor site selection may harm wildlife, fragment habitats, and occupy agriculturally valuable areas [
34].
There are already implemented projects that aim to maintain biodiversity in an environmentally friendly manner. Examples include insect (bee)-friendly solar farms, which function as “pollinator gardens”. Some solar power plants operate in a way that fosters diverse wildlife habitats under photovoltaic modules [
35].
Photovoltaic systems are well-suited for providing electricity to rural areas (villages, medium-sized settlements). Their efficiency can be enhanced when combined with wind energy. The performance of such hybrid systems is significantly better than that of standalone solar or wind systems. Another important advantage is that these systems reduce the load on the national electricity grid [
36]. Photovoltaic systems increase the energy independence of communities relying on external energy sources and contribute to greater energy security. In the future, combining photovoltaic systems with batteries will play a significant role. Renewable energy production, including solar power systems, helps reduce the amount of imported electricity. The decentralised placement of these systems can reduce the grid’s vulnerability [
37].
The central areas of major cities are unsuitable, or at least not ideal, for extensive solar energy generation due to congestion and the need to preserve historical monuments. Furthermore, these cities are not suited for residential buildings that aim to generate solar power. Yet, incorporating suburban or dilapidated areas is a valuable attempt to mitigate the carbon footprint of these cities through the utilisation of solar energy. When considering places near the city, it is advisable to prioritise locations where the metropolis is unlikely to expand. These sites are well-suited for the installation of gasoline systems of medium and large sizes, as described in reference [
38].
In addition, vulnerable locations include vegetation, assembly halls, storage facilities, logistics facility rooftops, and unoccupied land. Their dimensions make them well-suited for solar cells of medium size. These investments greatly decrease the company’s environmental impact. Also, their products are also more environmentally friendly [
39].
These energy producers also improve access to energy and enhance operational security, facilitating electricity access in remote areas where the central grid is unavailable. They also play a significant role in regions where the central grid is accessible but frequent power outages occur.
3.1.2. Disadvantages
The primary and most significant issue with solar systems is their reliance on weather conditions. The generation of energy is strongly reliant on the magnitude and duration of sunlight. Cloudy weather leads to a substantial decrease in output volume, resulting in disruptions in production control. Another evident fact is that solar systems do not generate electricity during nighttime. The diverse nature of the solar system necessitates the utilisation of additional energy sources and storage facilities. The latter allows us to understand the solar power plant as a provider of electricity through wires.
Solar power plants have a great capacity. This issue can be resolved by implementing smaller-scale solutions that make use of building roofs. However, if the size of the plant exceeds a certain threshold, the amount of available space becomes significantly limited. Consequently, solar power systems with exceptional performance require a significant amount of land space. This issue arises in locations with high population density, particularly in villages and agricultural regions. Hence, occasionally, concessions are necessary in the realm of land utilisation. Indeed, there are currently agricultural lands that serve a dual purpose, as exemplified by the practice of agrovoltaics. One notable drawback of solar systems is the substantial upfront investment expenses. The initial expenses consist of the expenses related to the acquisition of holding structures, solar panel boards, and power conversion equipment. Energy storage serves as a partial solution for managing variations in production, but it also presents a significant obstacle. Furthermore, these additional expenditures contribute to the system’s increased complexity, resulting in higher maintenance expenses [
40].
Lastly, it is worth noting that the production of solar panels, as previously noted, has a substantial ecological footprint. Solar panel manufacturing necessitates a substantial quantity of energy and raw materials. A multitude of chemicals are employed in the production process, and the resultant waste is highly detrimental to the environment. This compromises the long-term viability of solar system lifecycles [
41].
3.1.3. Forecast
In the future, solar-wind hybrid systems and accompanying batteries will play a significant role alongside a well-chosen portfolio [
42]. Independence provides security since there is no security without independence [
43]. Deploying solar power systems and their integration into the grid promotes economic growth [
44]. In investment decisions, it is worthwhile to consider the results of life-cycle analyses to determine the most favourable energy investment in a given situation. It may be the case that replacing existing technology with renewables is not valuable until its end of life. In many cases, closing a functioning fossil fuel power plant may result in greater economic and environmental damage than allowing it to operate until the end of its service life [
45].
Regions suitable for photovoltaic technology can further enhance Electric energy production and usage efficiency through network development, the establishment of smart grids, and the integration of storage systems.
The state supports the renewable energy sector through various means such as loans, investment incentives, grants, feed-in premiums, feed-in tariffs, subsidy incentives, green certificates, green tariffs, and tax refunds [
46]. State projects create jobs, promote innovation and the development and dissemination of renewable energy technologies, and contribute to sustainable development and establishing a green economy [
47,
48]. The electrification of peripheral areas is a priority in developing many countries’ energy sectors. Renewable energies also play a significant role in this regard [
42].
Solar energy facilitates on-site energy-intensive product processing, particularly in remote, mainly agricultural areas, thus increasing the sector’s competitiveness [
44]. Placing photovoltaic modules in agricultural areas allows for dual land use. The land serves its original purpose of agricultural production while also being used for electric energy production. Many studies treat this latter electric energy production as a “crop” in economic calculations since it is (partly) produced by the land itself. Low agricultural crop cultures can serve as locations for photovoltaic technology, while manual or low-rise mechanical agricultural activities can continue on the ground [
49]. The shading effect of solar systems can contribute to soil moisture retention, reducing the risk of water scarcity in agricultural areas, especially in areas affected by poor water management due to climate change [
50].
Solar energy can also help decarbonise heavy industry. It can reduce energy costs in energy-intensive industries such as mining. These mines typically operate in peripheral areas where high carbon dioxide-emitting diesel generators are commonly used as energy sources. Mining is one of the most energy-intensive industries and is a raw material source for many other sectors. Renewable energy technologies are also important sources of raw materials for mining (e.g., lithium). The demand for such raw materials will increase further as economic growth leads more low-income (GDP) countries to transition into middle-income economies. Due to the high energy demand of mining, it is particularly sensitive to energy costs, so the role of renewables will increasingly be appreciated in this sector [
51,
52].
3.2. The Challenger of Photovoltaic Technology
The greatest challenge of photovoltaic technology lies in its intermittency and variability. The system’s electric energy production fluctuates throughout the day and seasonally throughout the year due to cloud cover, atmospheric transparency, and temperature [
53]. Ensuring reliable satisfaction of consumer demand is significantly hindered by the intermittent nature of production. Digital technology aids in addressing this issue by monitoring and forecasting production within certain limits. These controllers can coordinate solar energy with other energy sources to meet grid demands while maintaining system stability. Controllers employ various new methods, such as Big Data analysis, supported by Fuzzy and AI technologies [
54].
As residential and commercial electricity consumption increases, more solar systems are integrated into the grid. Therefore, surplus energy must be stored when the system is not generating electricity, ensuring a continuous power supply. However, system components and batteries are expensive, often costing more than the solar system. Additionally, their capacity is finite, so during prolonged unfavourable weather conditions, they may deplete, causing the system to go offline [
55].
Grid integration entails additional costs for service providers. They must expand and modernise the grid infrastructure and embrace decentralised energy production. Collaboration with wind energy production must also be considered [
56]. Integrating the national grid often reduces transmission and distribution losses, increasing network stability. Integration reduces the need for new utility construction, further promoting cost reductions. Applied optimisation and predictive technologies enhance system robustness, a major direction in the development of solar technology. Such robustness will be valuable in managing future uncertainties caused by climate change [
57]. With solar systems integrated into the electricity grid, not only does energy flow through the network, but there is also an information flow to aid in control and optimisation. Today, all networks are vulnerable to cyberattacks, necessitating defence measures. Such attacks can lead to severe operational disruptions and, in some cases, network outages. Thus, defence against cyber threats is crucial. Therefore, network information systems are designed robustly with sufficient redundancy. Only in this way can the system be flexible, efficient, and sustainable in the face of future challenges. Such solutions can address future challenges, such as the increasing demand for greater operational security due to climate change [
58].
The electric energy production potential of a region greatly depends not only on its geographical latitude but also on weather factors. Weather conditions, such as whether an oceanic or continental climate prevails at the same latitude, significantly affect the number of sunlight hours. The altitude above sea level also influences energy production. At the same latitude and similar climatic conditions, photovoltaic module electricity yields are more favourable when installed at higher altitudes. Since the efficiency of semiconductor technology, which underlies photovoltaic technology, improves at lower temperatures, efficiency increases with altitude from sea level [
59].
Ground-mounted solar systems, especially utility-scale ones, require large land areas. Therefore, they often compete for land use with agriculture, industry, or real estate development. Additionally, the needs of local communities must be considered. Sometimes, solar installations may disrupt the landscape, especially if the region is a tourist destination. Care must also be taken to avoid fragmentation of habitats and minimise ecosystem disruption [
60]. Solar systems may also have long-term indirect effects. Such indirect effects may include activities displaced by solar facilities relocating to other areas, such as forests or areas rich in biodiversity. The exploitation of solar energy in this way can trigger a chain reaction. This butterfly effect affects everything from urban regions to rainforests [
61].
3.3. Photovoltaic Technology in Hungary
In recent times, photovoltaic technology in Hungary has consistently increased, and due to its rising popularity, further growth is anticipated in the future (
Table 1). These investments and associated network developments contribute to the increasingly necessary energy transition. To encourage the transition and the use of renewable energy sources, the Hungarian government supports the installation of solar power plants and related investments [
46,
62].
In Hungary, solar facilities are predominantly located in the Alföld region, which has the largest area of open land and is most favourable for photovoltaic technology. Additionally, more solar parks are being built around the capital and other major cities. This is partly due to the direct local usage of the generated energy. Moreover, the proximity to cities results in comparatively lower maintenance and logistical costs than solar parks in less accessible areas [
63].
Hungary’s climate is typically continental, featuring hot, dry summers and mildly cold, snowy winters. Hungary experiences four seasons: winter (December, January, February), spring (March, April, May), summer (June, July, August), and autumn (September, October, November). The periods between winter and summer (spring) and between summer and winter (autumn) have been becoming increasingly shorter. The annual average temperature is 9.7 °C, with summer averages of 23–28 °C, and daytime temperatures sometimes exceeding 35 °C are becoming more common. During an average winter, temperatures range from −3 °C to −7 °C, with colder days dropping below −10 °C [
64]. Due to its proximity to major European climatic systems, Hungary is sensitive to climate-related impacts. Occasionally, the polar cold from the north, the oceanic and moist continental climate from the west, the Mediterranean climate from the south, and the dry continental climate from the east influence Hungary [
65].
3.4. The Solar Energy Situation in the Great Hungarian Plain Region
The Great Hungarian Plain (its Hungarian name is ’Alföld’) is the largest plain in Central Europe, encompassing a significant portion of Hungary and parts of neighbouring countries. The climate here is drier and warmer than in other parts of the country. This internal variation is reflected in the solar system production data. One of the most significant impacts of climate change in the Hungarian Alföld is manifested in temperature increases [
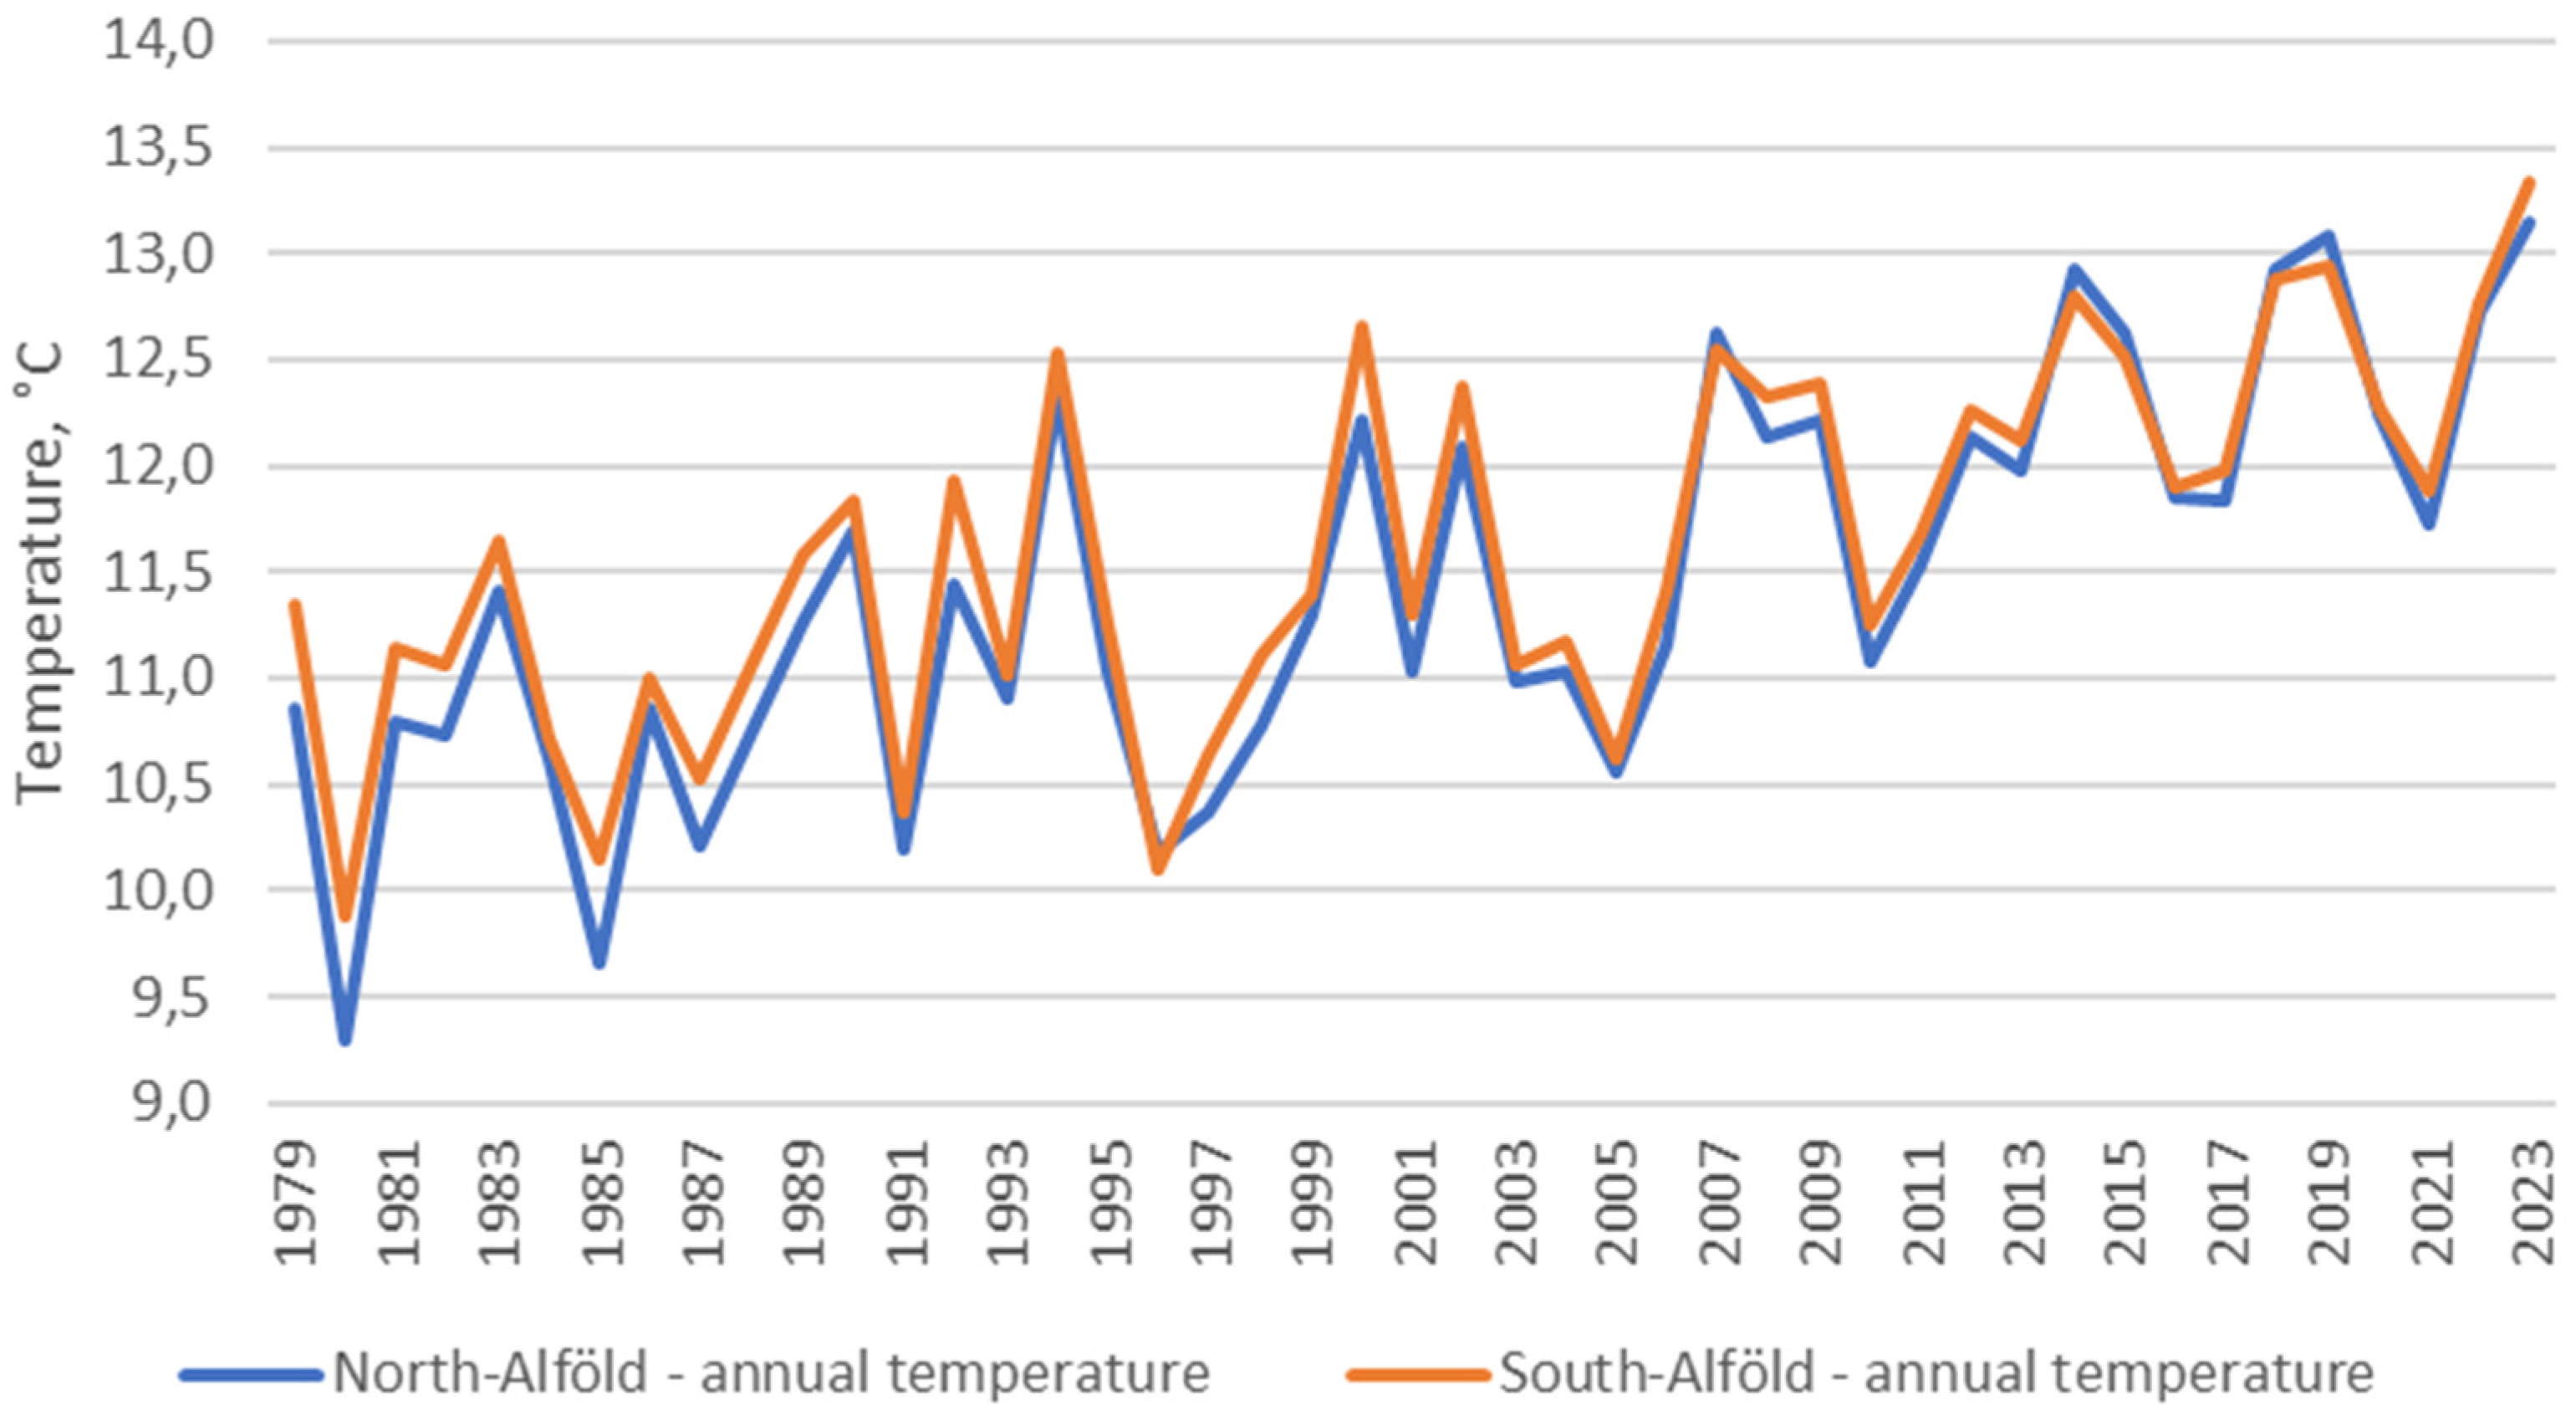
66]. As in many places worldwide, the average temperature on the Alföld is rising (
Figure 2). Hotter summers and milder winters are becoming more frequent, leading to significant changes in the ecosystem. Heatwaves and drought periods are also becoming more common. Such extreme weather conditions can have severe consequences for agriculture and water management. These extremes pose new challenges for renewable energy sources as well. The rise in average temperature reduces the efficiency of solar systems. Extreme heat waves are becoming more frequent, causing increased environmental exposure for solar systems and reducing their lifespan [
67].
The Alföld region is characterised by a high number (>2000 h) of sunny hours and radiation values compared to other parts of the country (
Figure 3). This is especially true for the southern areas of the Alföld, where sub-Mediterranean microclimates are beginning to form [
69].
Linear temperature trend from 1979 to 2023:
Northern Great Plain (Észak-Alföld):
Southern Great Plain (Dél-Alföld):
Linear regression analysis of solar radiation data from 1979 to 2023:
Northern Great Plain (Észak-Alföld):
Southern Great Plain (Dél-Alföld):
Although the linear trend offers insights into temperature and solar radiation in the short term, uncertainty is growing over the long run. Also, it is important to note that individual RCP scenarios are likewise subject to inherent uncertainty, let alone the uncertainty surrounding the precise RCP route that climate change will follow in the future. The level of uncertainty is contingent upon various economic parameters, including GDP, land utilization, and emission factors such as greenhouse gases.
Alongside the increase in temperature, the seasonal distribution of precipitation will also change in the Alföld region [
70]. Furthermore, other extreme weather events (droughts and heavy rainfall) will influence the energy sector. These, often in conjunction with energy management, will significantly impact water management, agriculture, and industry [
71].
Decreasing precipitation and its varying distribution and increased drought incidents elevate the risk of water shortages. These factors adversely affect the operation of thermal power plants involved in electricity production. It is essential to ensure the continuous supply of cooling water in the future, primarily available in rivers and reservoir lakes. These bodies’ yield and water levels can become erratic during climate change. River flows will experience greater variability and become less predictable. The phenomena of critically low water levels, accompanied by floods, will become increasingly common [
72].
Future strategies must prepare for the occasional reduced production mode of thermal power plants. For reservoirs and cooling lakes, it is crucial to maintain water levels above critical thresholds. Additional redundancies must be integrated into the system to avoid the issues above. These could include extra water intake options or increased cooling capacities, such as incorporating Heller-Forgó cooling towers. Although Heller-Forgó towers are commonly associated with nuclear power plants, they are only part of the cooling system. Heller-Forgó towers are hyperboloid chimneys shaped like rotational hyperbolas, which use vertical drafts to cool circulating water at the base. However, these measures are cost-increasing and will reflect in the energy prices, rippling through to the costs of industrial production, products, and services [
73]. Photovoltaic systems that do not require water usage can assist in resolving these issues. It is advisable to disregard water-cooled photovoltaic modules, as they are generally not cost-effective. Moreover, water cooling of solar systems increases system complexity, which could lead to additional faults. Repairing such faults in the sparsely populated regions studied in the article can present significant challenges [
74].
Looking ahead, in the Alföld region, exploiting alternative, particularly renewable, energy sources is a critical issue. Among these, the production of solar electricity could be the key. Utilising renewable energy sources not only promotes environmental sustainability but can also bring economic benefits to the region. Implementing solar systems in the area could provide numerous advantages in response to climate change. Medium-sized solar systems, especially those implemented in rural areas, have the most favourable environmental impact compared to other energy systems, including other renewables. Furthermore, solar energy is a renewable resource that can be utilised within communities in small to medium-sized energy production units [
75].
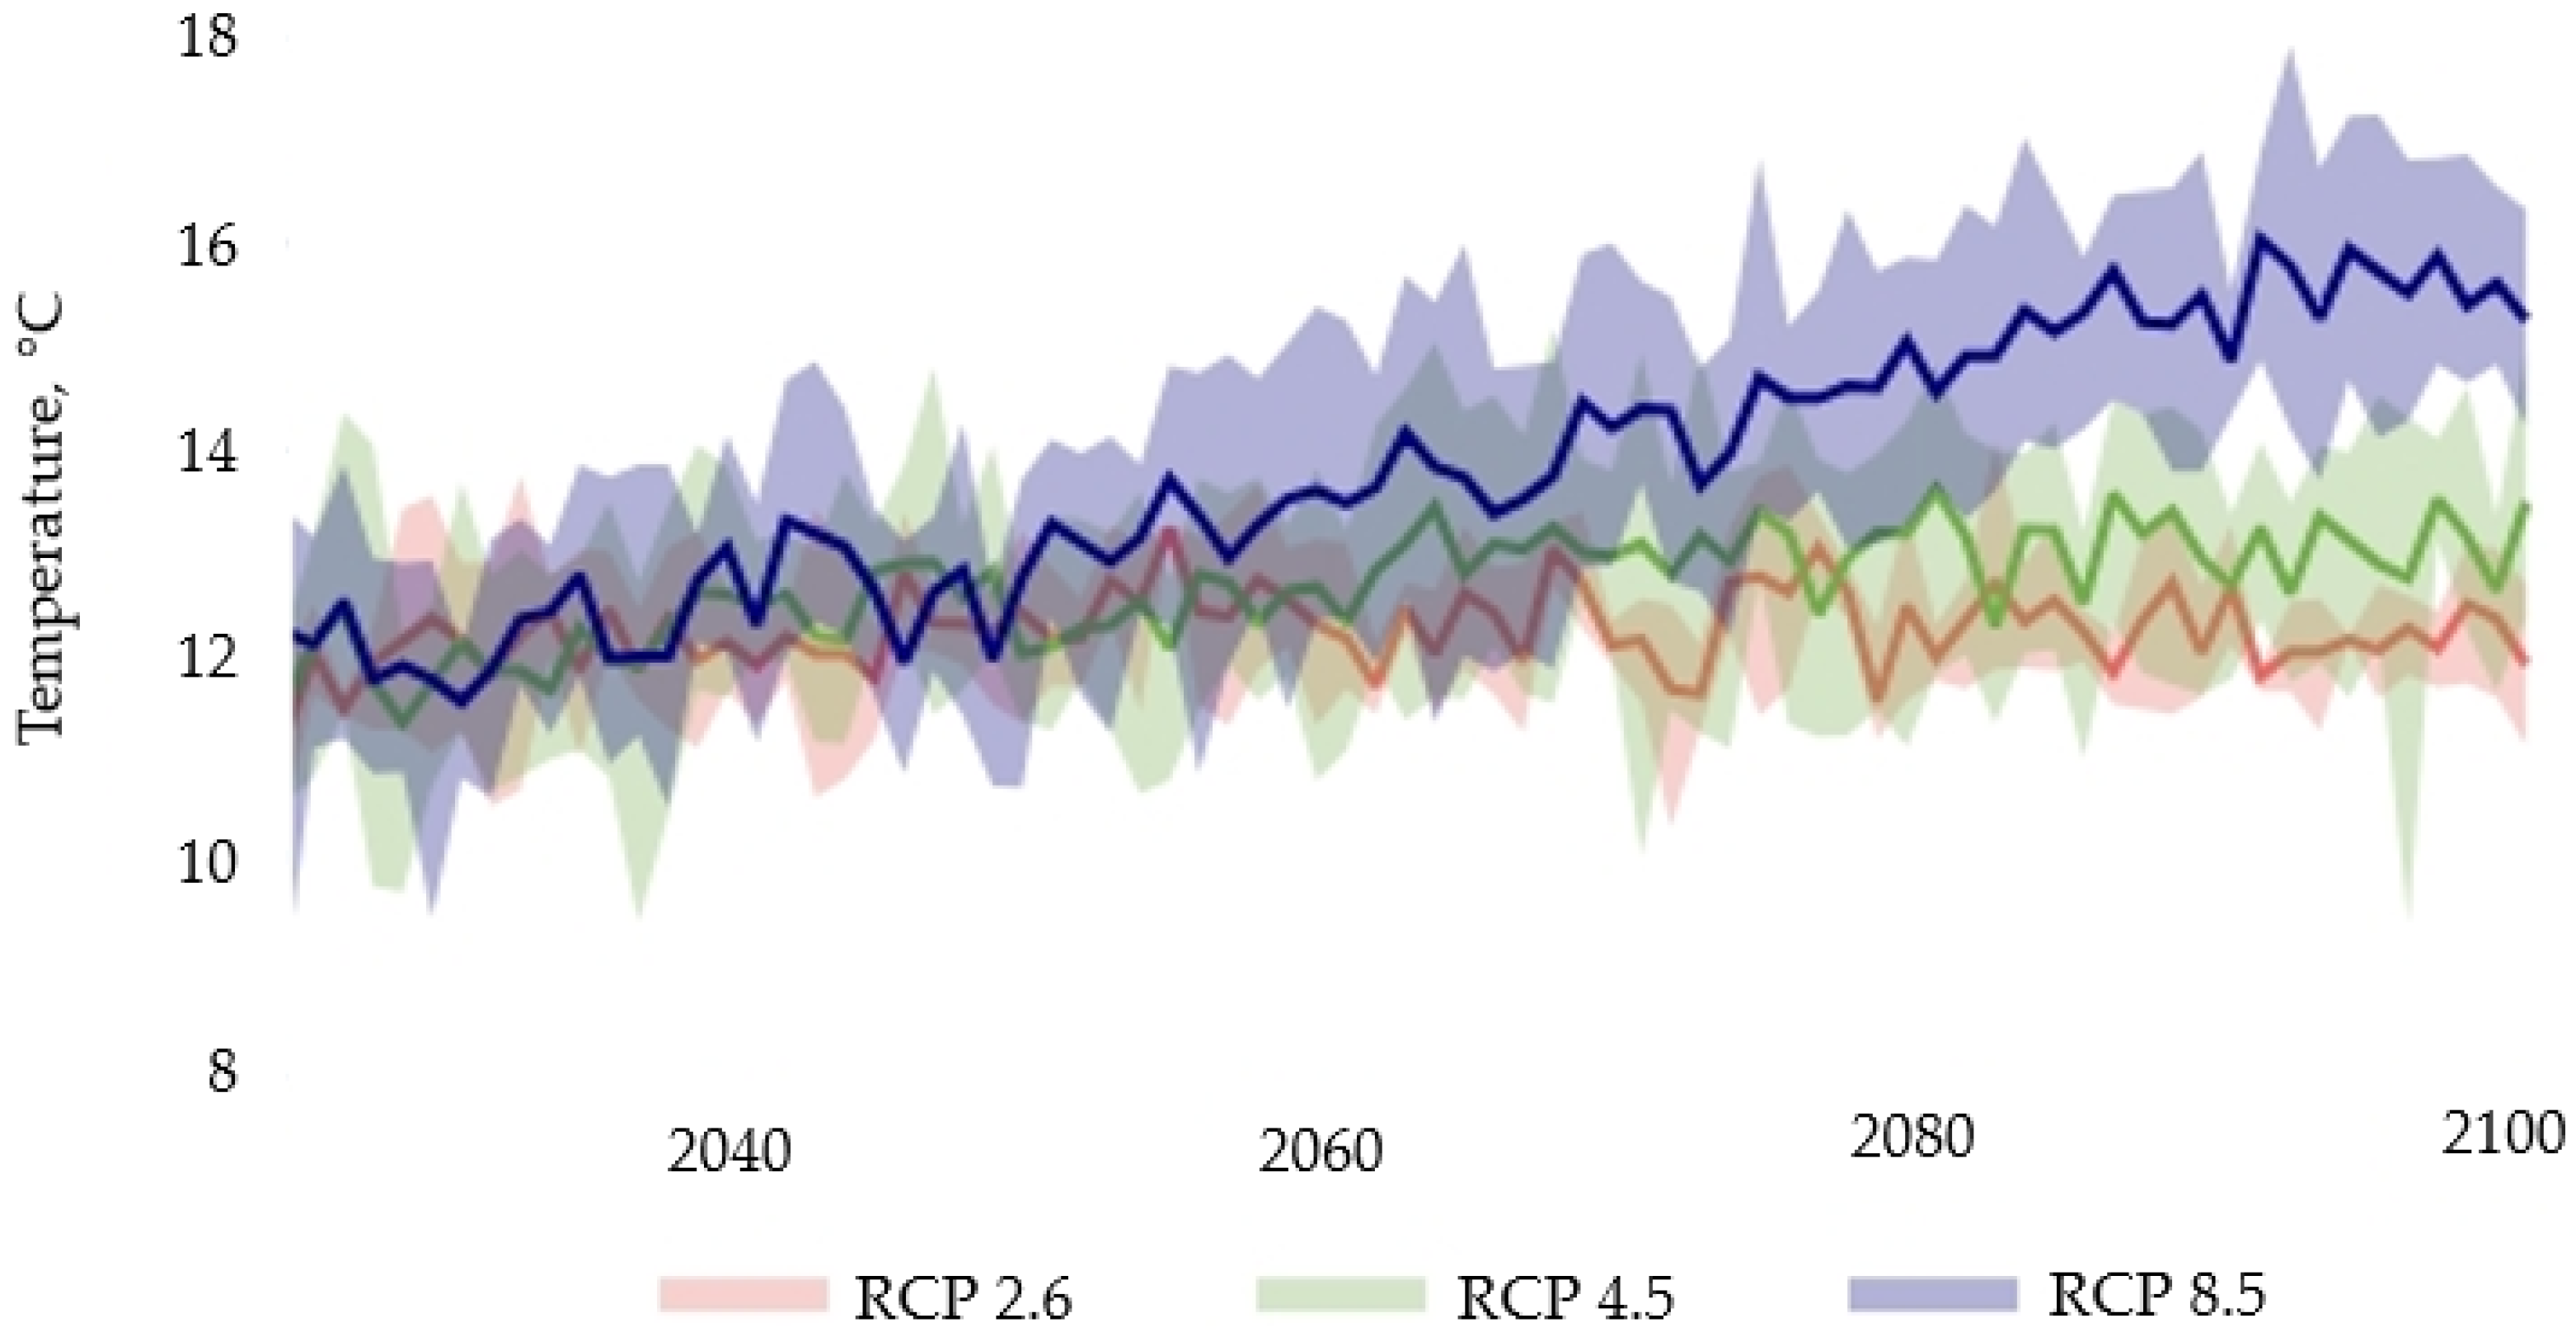
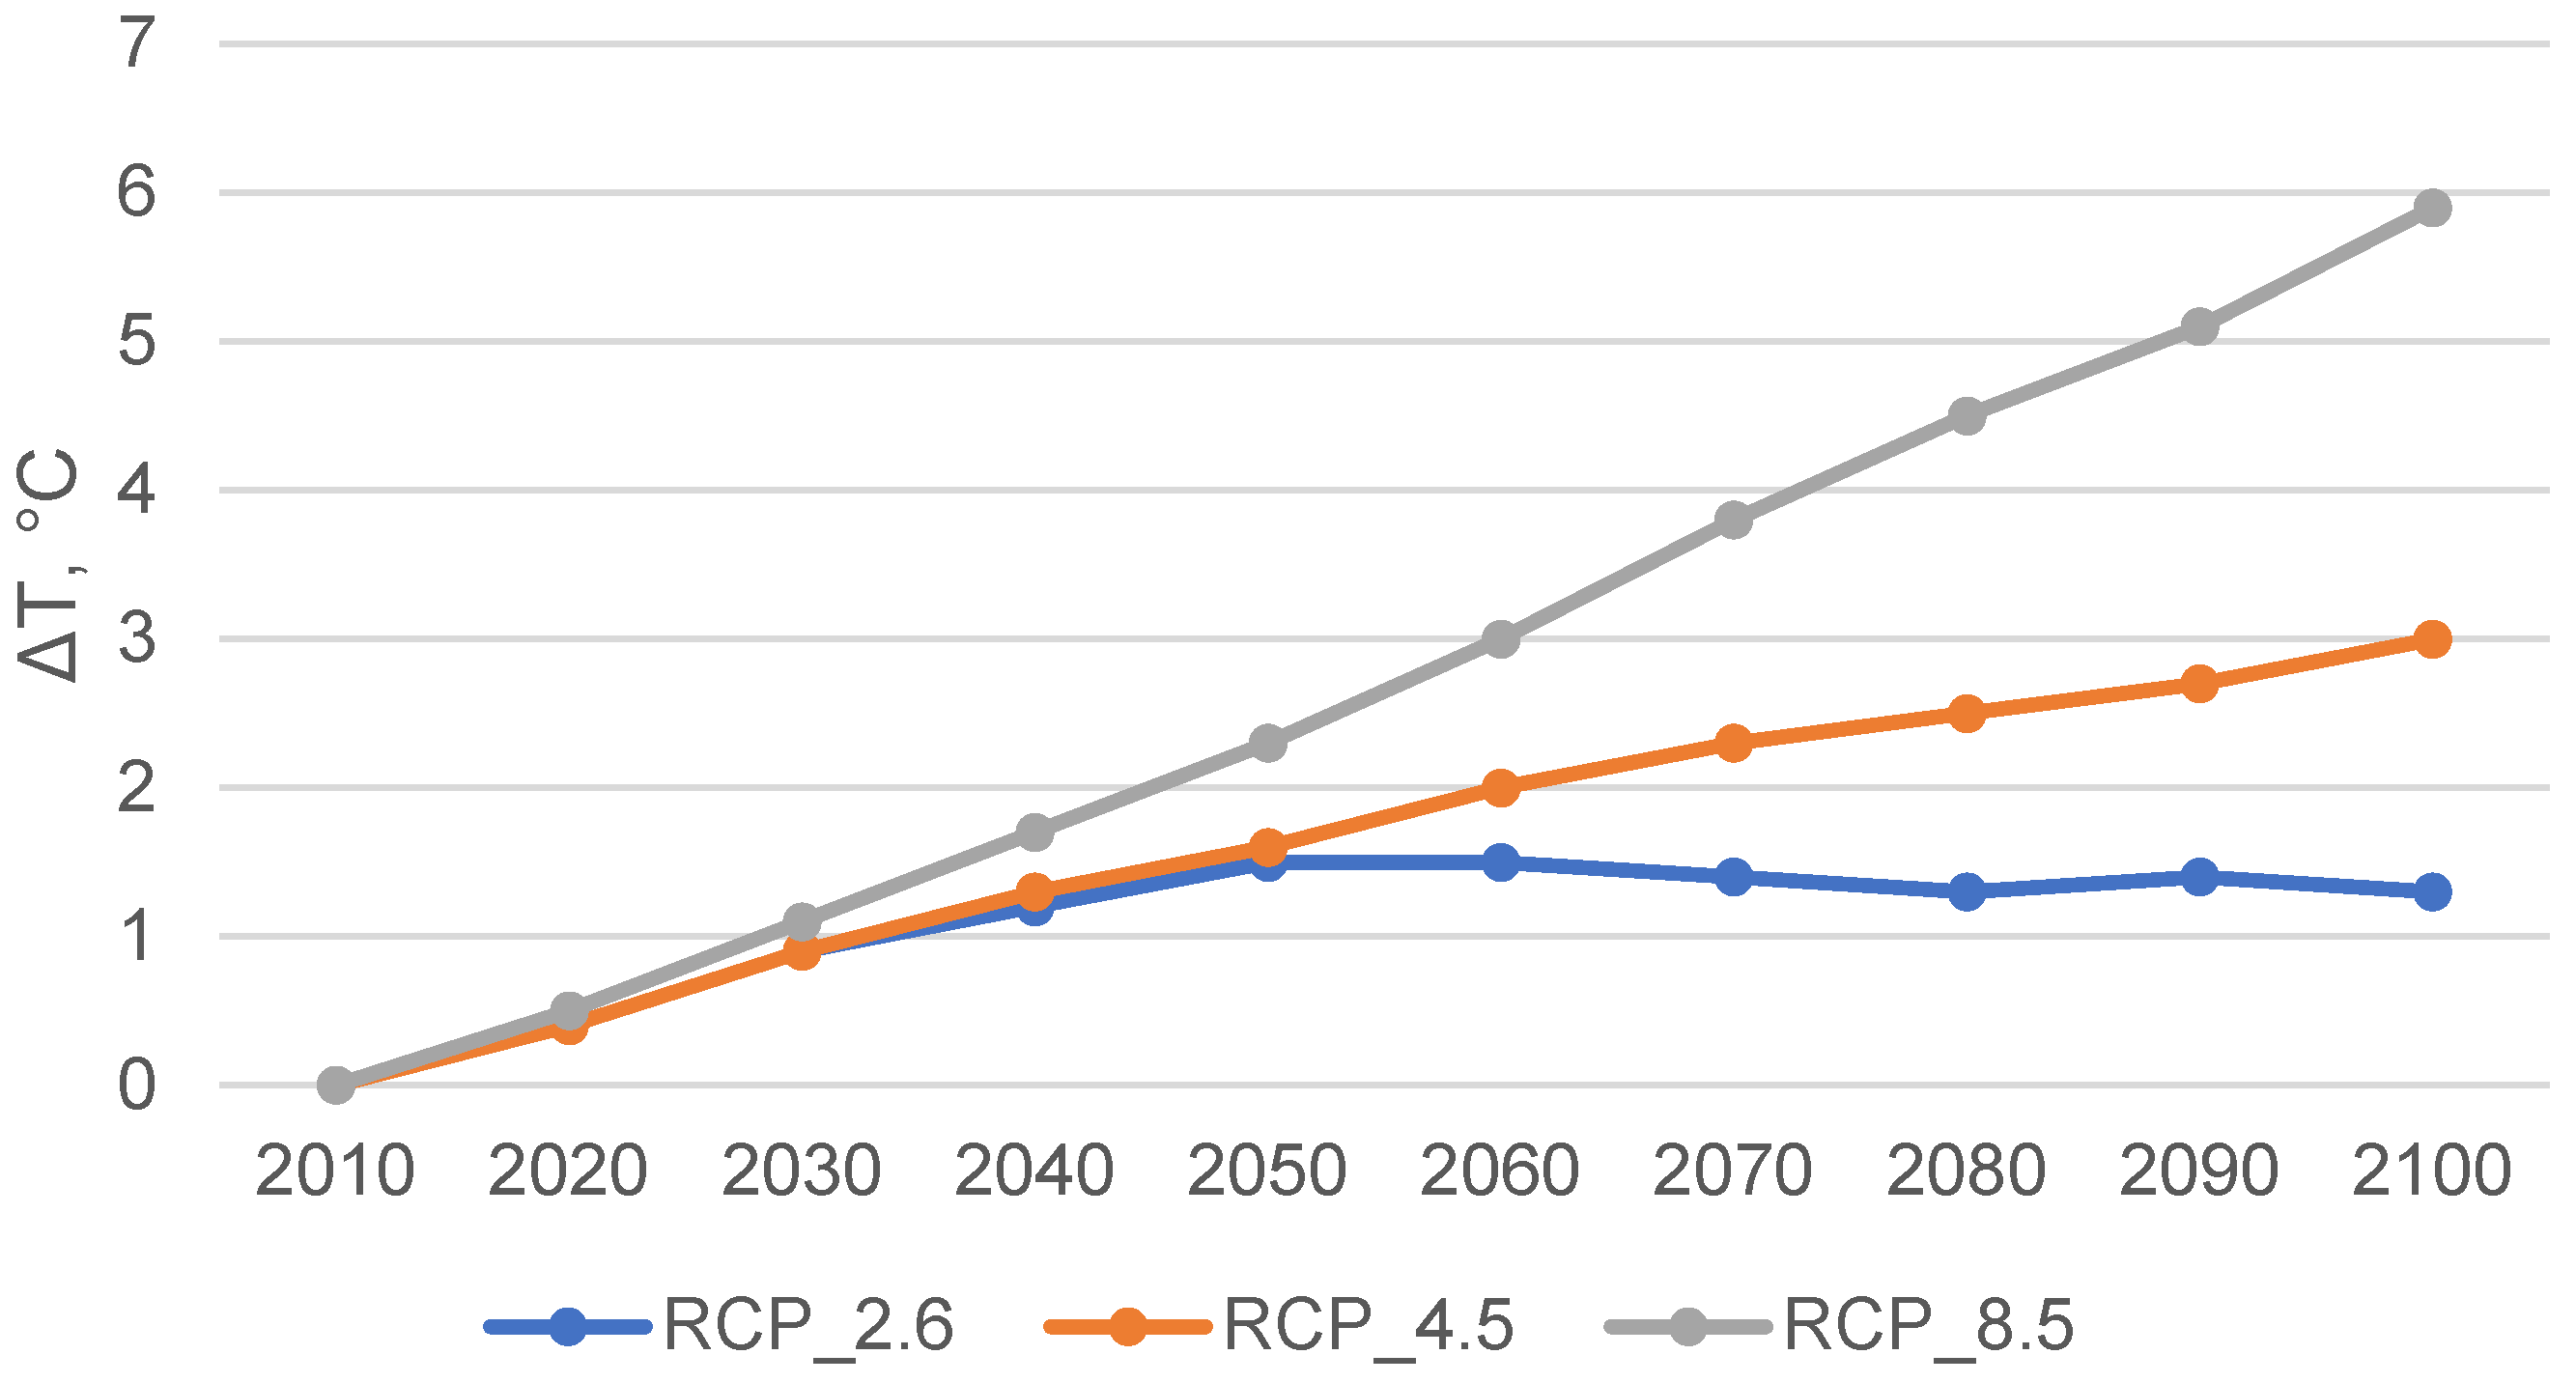
A significant factor in the development of electric energy production with photovoltaic systems is temperature change. The temperature rise adversely affects the efficiency of solar systems. Lower efficiency results in reduced electric energy production.
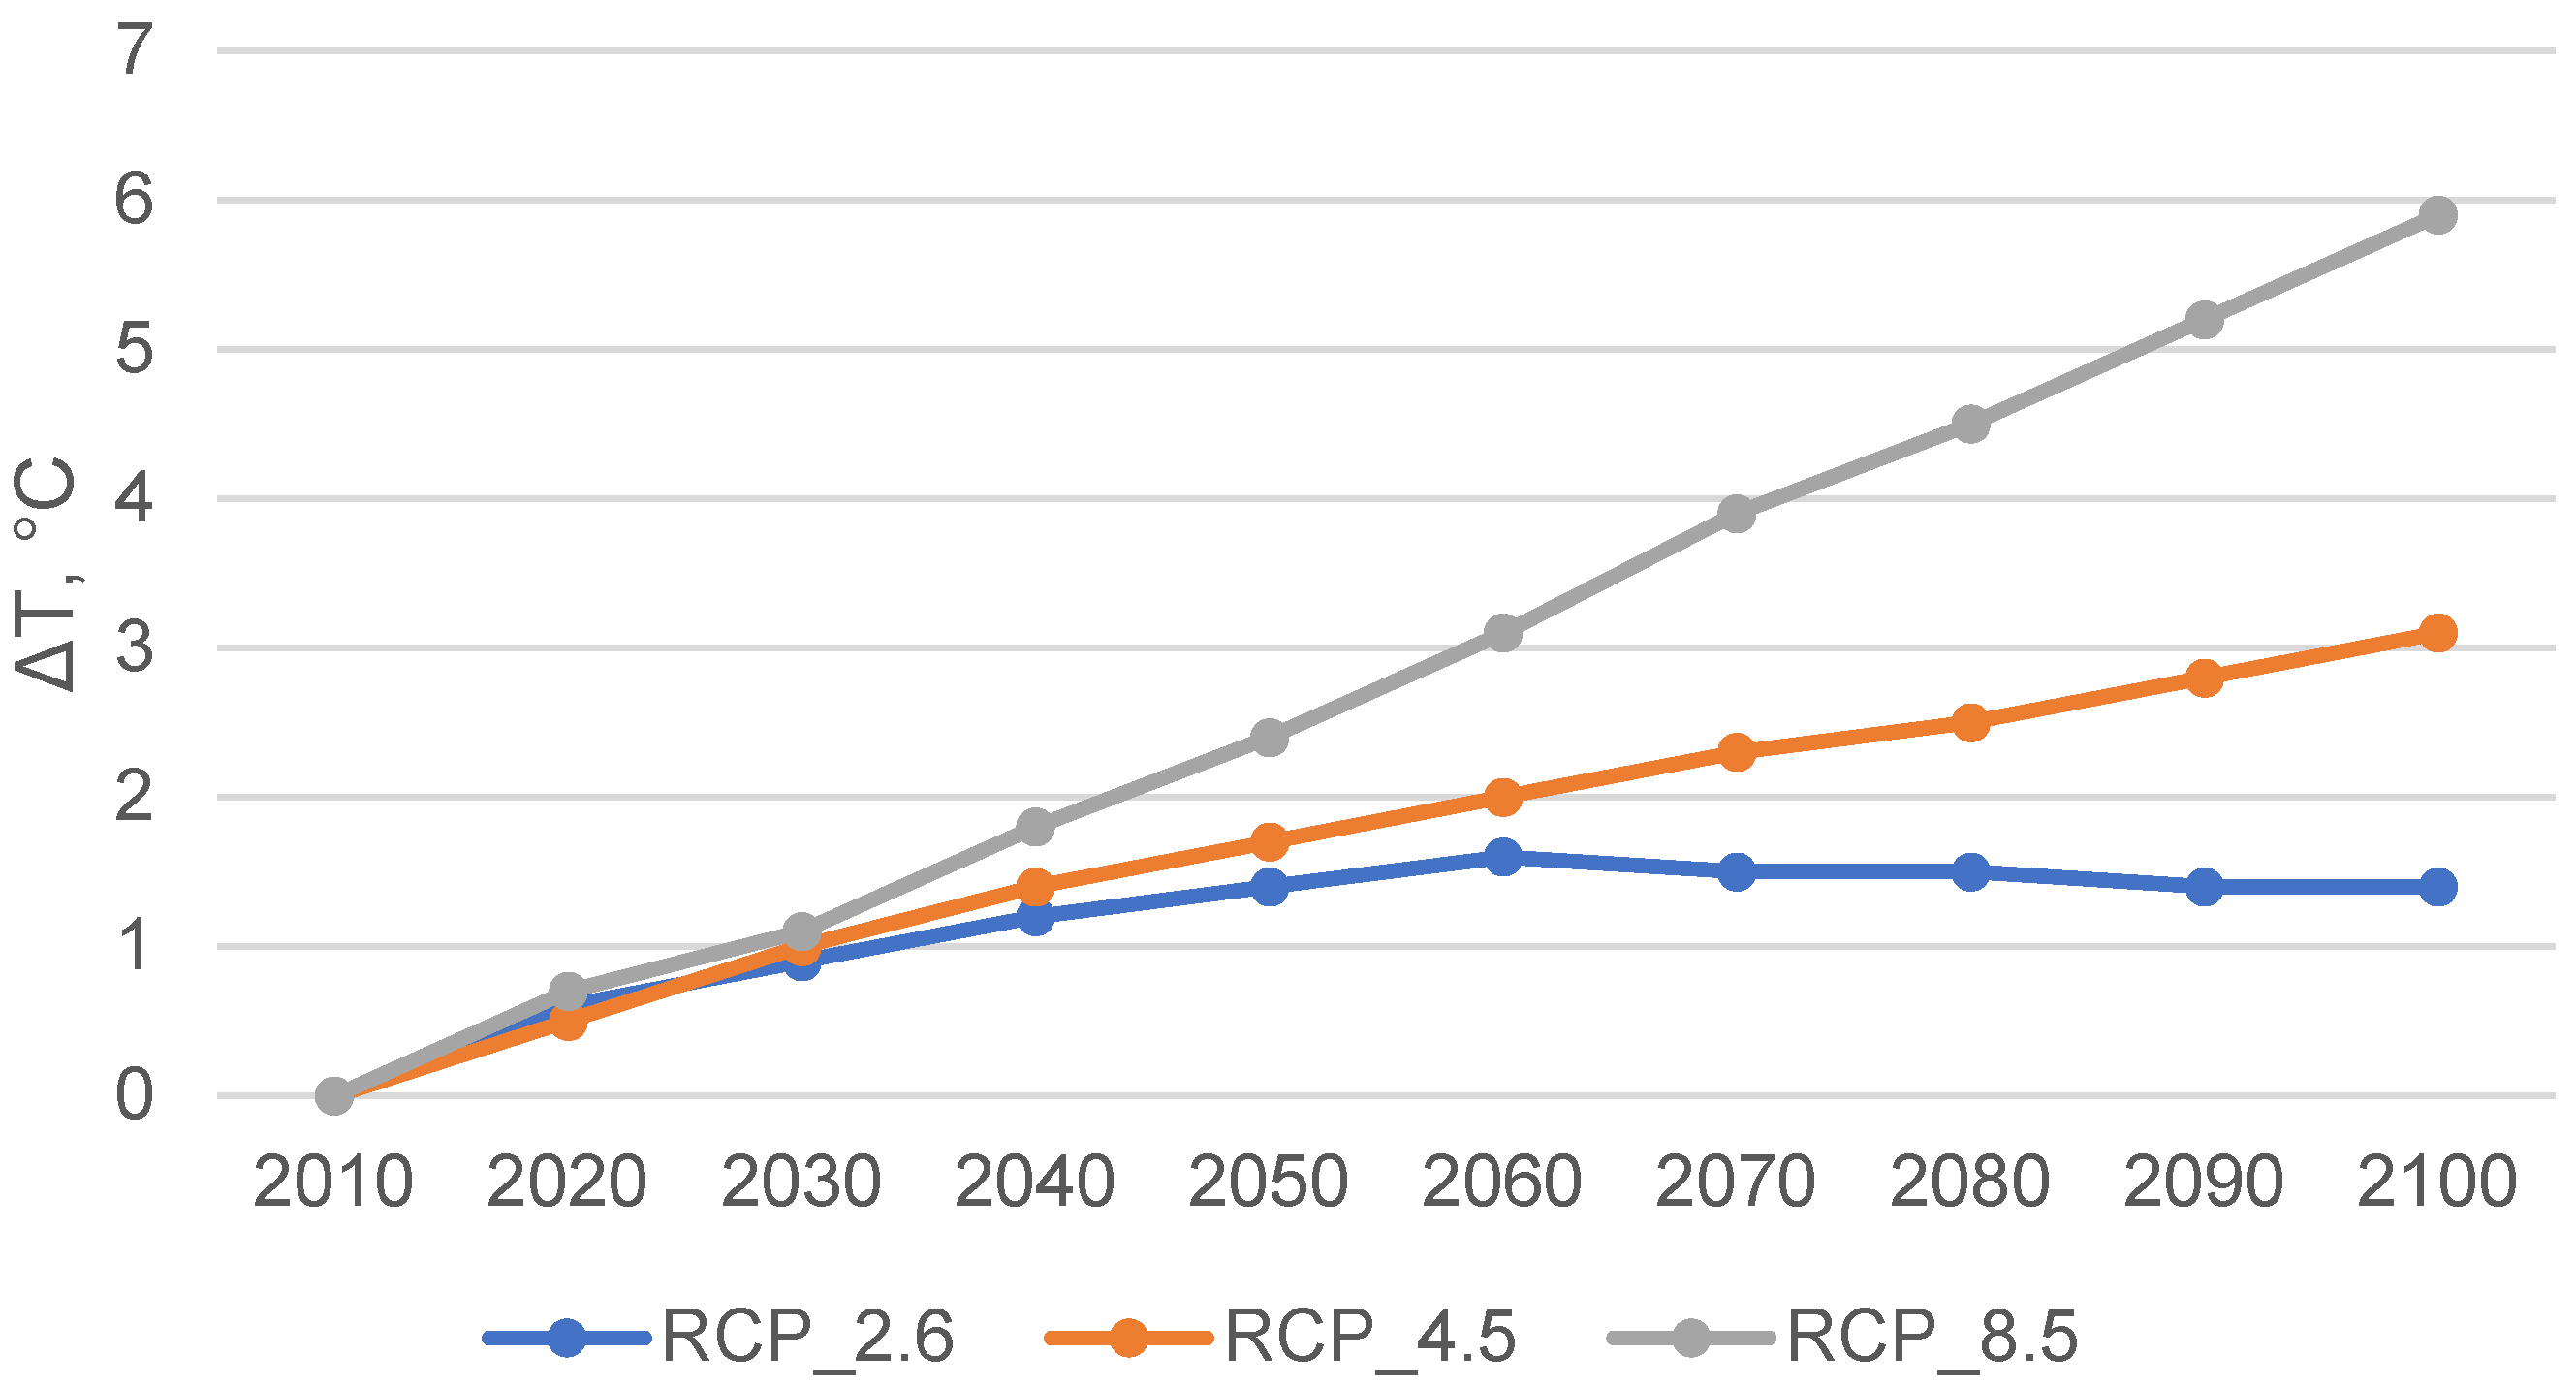
Figure 4 illustrates the annual mean temperature results in the Copernicus climate prediction database prepared for Hungary. The graph clearly shows that the RCP 2.6, RCP 4.5, and RCP 8.5 climate scenarios predict increasingly higher annual mean temperatures by the end of the century.
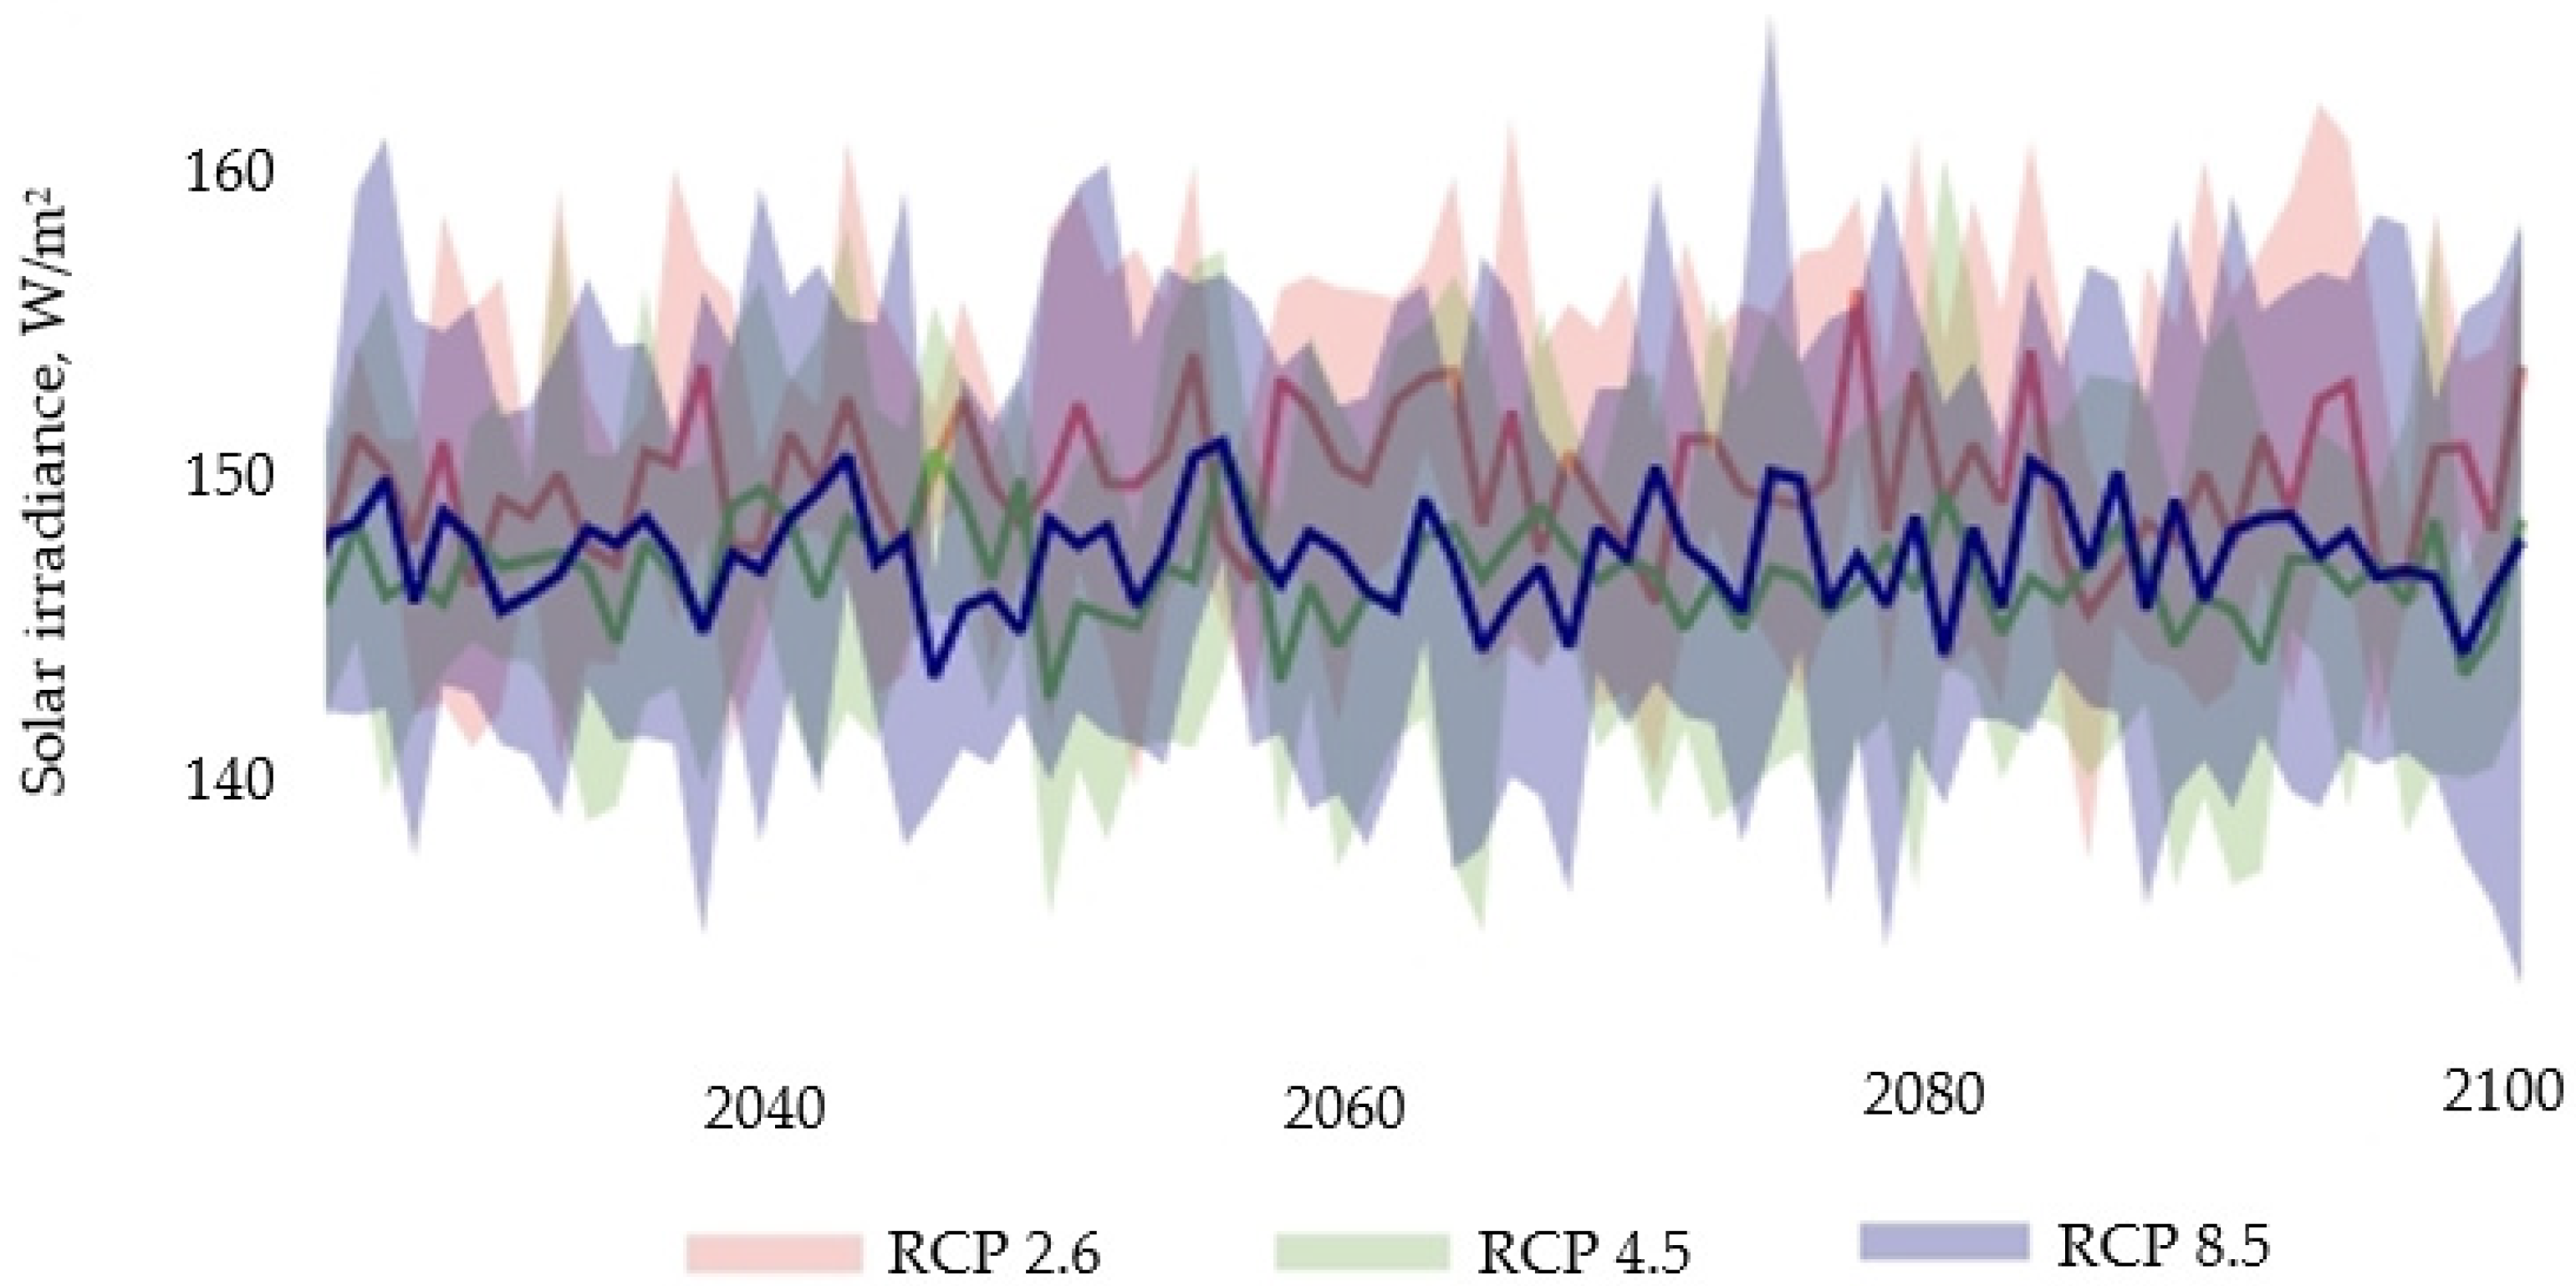
Another important consequence of climate change for photovoltaic technology is the variation in the amount of solar radiation. Due to climate change, the number of sunny hours changes.
Figure 5 in the Copernicus climate prediction database prepared for Hungary shows the radiation results. The graph illustrates that the RCP 2.6 and RCP 4.5 climate scenarios predict nearly identical annual average irradiation values up to 2100. This indicator is slightly higher in the RCP 8.5 climate scenario than the previous scenarios by the end of the century.
4. Materials and Methods
To determine the energy production of solar systems, it is first necessary to understand the various components of solar radiation and energy sources. DNI, DHI, and GHI are commonly used abbreviations in solar energy analysis to describe different components of solar radiation. Each term represents a specific value relating to the amount of solar energy reaching the Earth’s surface [
77].
4.1. Components of Solar Radiation
Direct Normal Irradiance (DNI) refers to solar radiation coming directly from the direction of the Sun without being scattered or absorbed by the Earth’s atmosphere. It signifies the amount of solar energy directly reaching the Earth’s surface, usually measured in watts per square meter (W/m2). It is crucial for solar technologies that utilise direct sunlight, such as concentrating solar power (CSP) systems or sun-tracking systems. DNI values are higher on clear, cloudless days with a clean atmosphere.
Diffuse Horizontal Irradiance (DHI) represents the amount of solar radiation that reaches the Earth’s surface after being scattered and diffused by the atmosphere. This occurs as sunlight scatters off molecules, aerosols, clouds, and other atmospheric components. DHI is measured in watts per square meter (W/m2). It is relevant for solar technologies that can utilise both direct and scattered sunlight, such as photovoltaic (PV) systems or solar collectors.
Global Horizontal Irradiance (GHI) signifies the total amount of solar energy received on a horizontal surface, including both direct and diffuse components. This value is a function of Direct Normal Irradiance (DNI) at the solar zenith angle and Diffuse Horizontal Irradiance (DHI). GHI is typically measured in watts per square meter (W/m2) and provides a comprehensive picture of the total solar energy available at a location. GHI is frequently used in assessing solar resources, calculating the performance of photovoltaic modules, and designing photovoltaic systems.
In summary, DNI represents the direct solar radiation received without scattering, DHI represents the diffused solar radiation post-scattering, and GHI represents the total solar radiation on a horizontal surface. These parameters help determine the characteristics and distribution of solar radiation at a specific location, enabling the analysis and design of photovoltaic systems. GHI is the most important parameter for calculating the PV electricity yield. Both DHI and DNI are, in fact, components of GHI, mathematically represented as:
where:
GHI: Global Horizontal Irradiance,
DNI: Direct Normal Irradiance,
DHI: Diffuse Horizontal Irradiance,
φ: Solar zenith angle.
The Global Tilted Irradiance (GTI) is also considered, which, unlike a horizontal surface parallel to the ground, accounts for a small amount of solar radiation reflected from the ground onto a tilted surface. GTI provides an approximate value for calculating the energy yield of fixedly installed tilted PV panels. The optimal angle refers to the angle at which solar modules should be set for maximum annual electric energy production [
78].
4.2. Calculating the Performance of Photovoltaic Modules
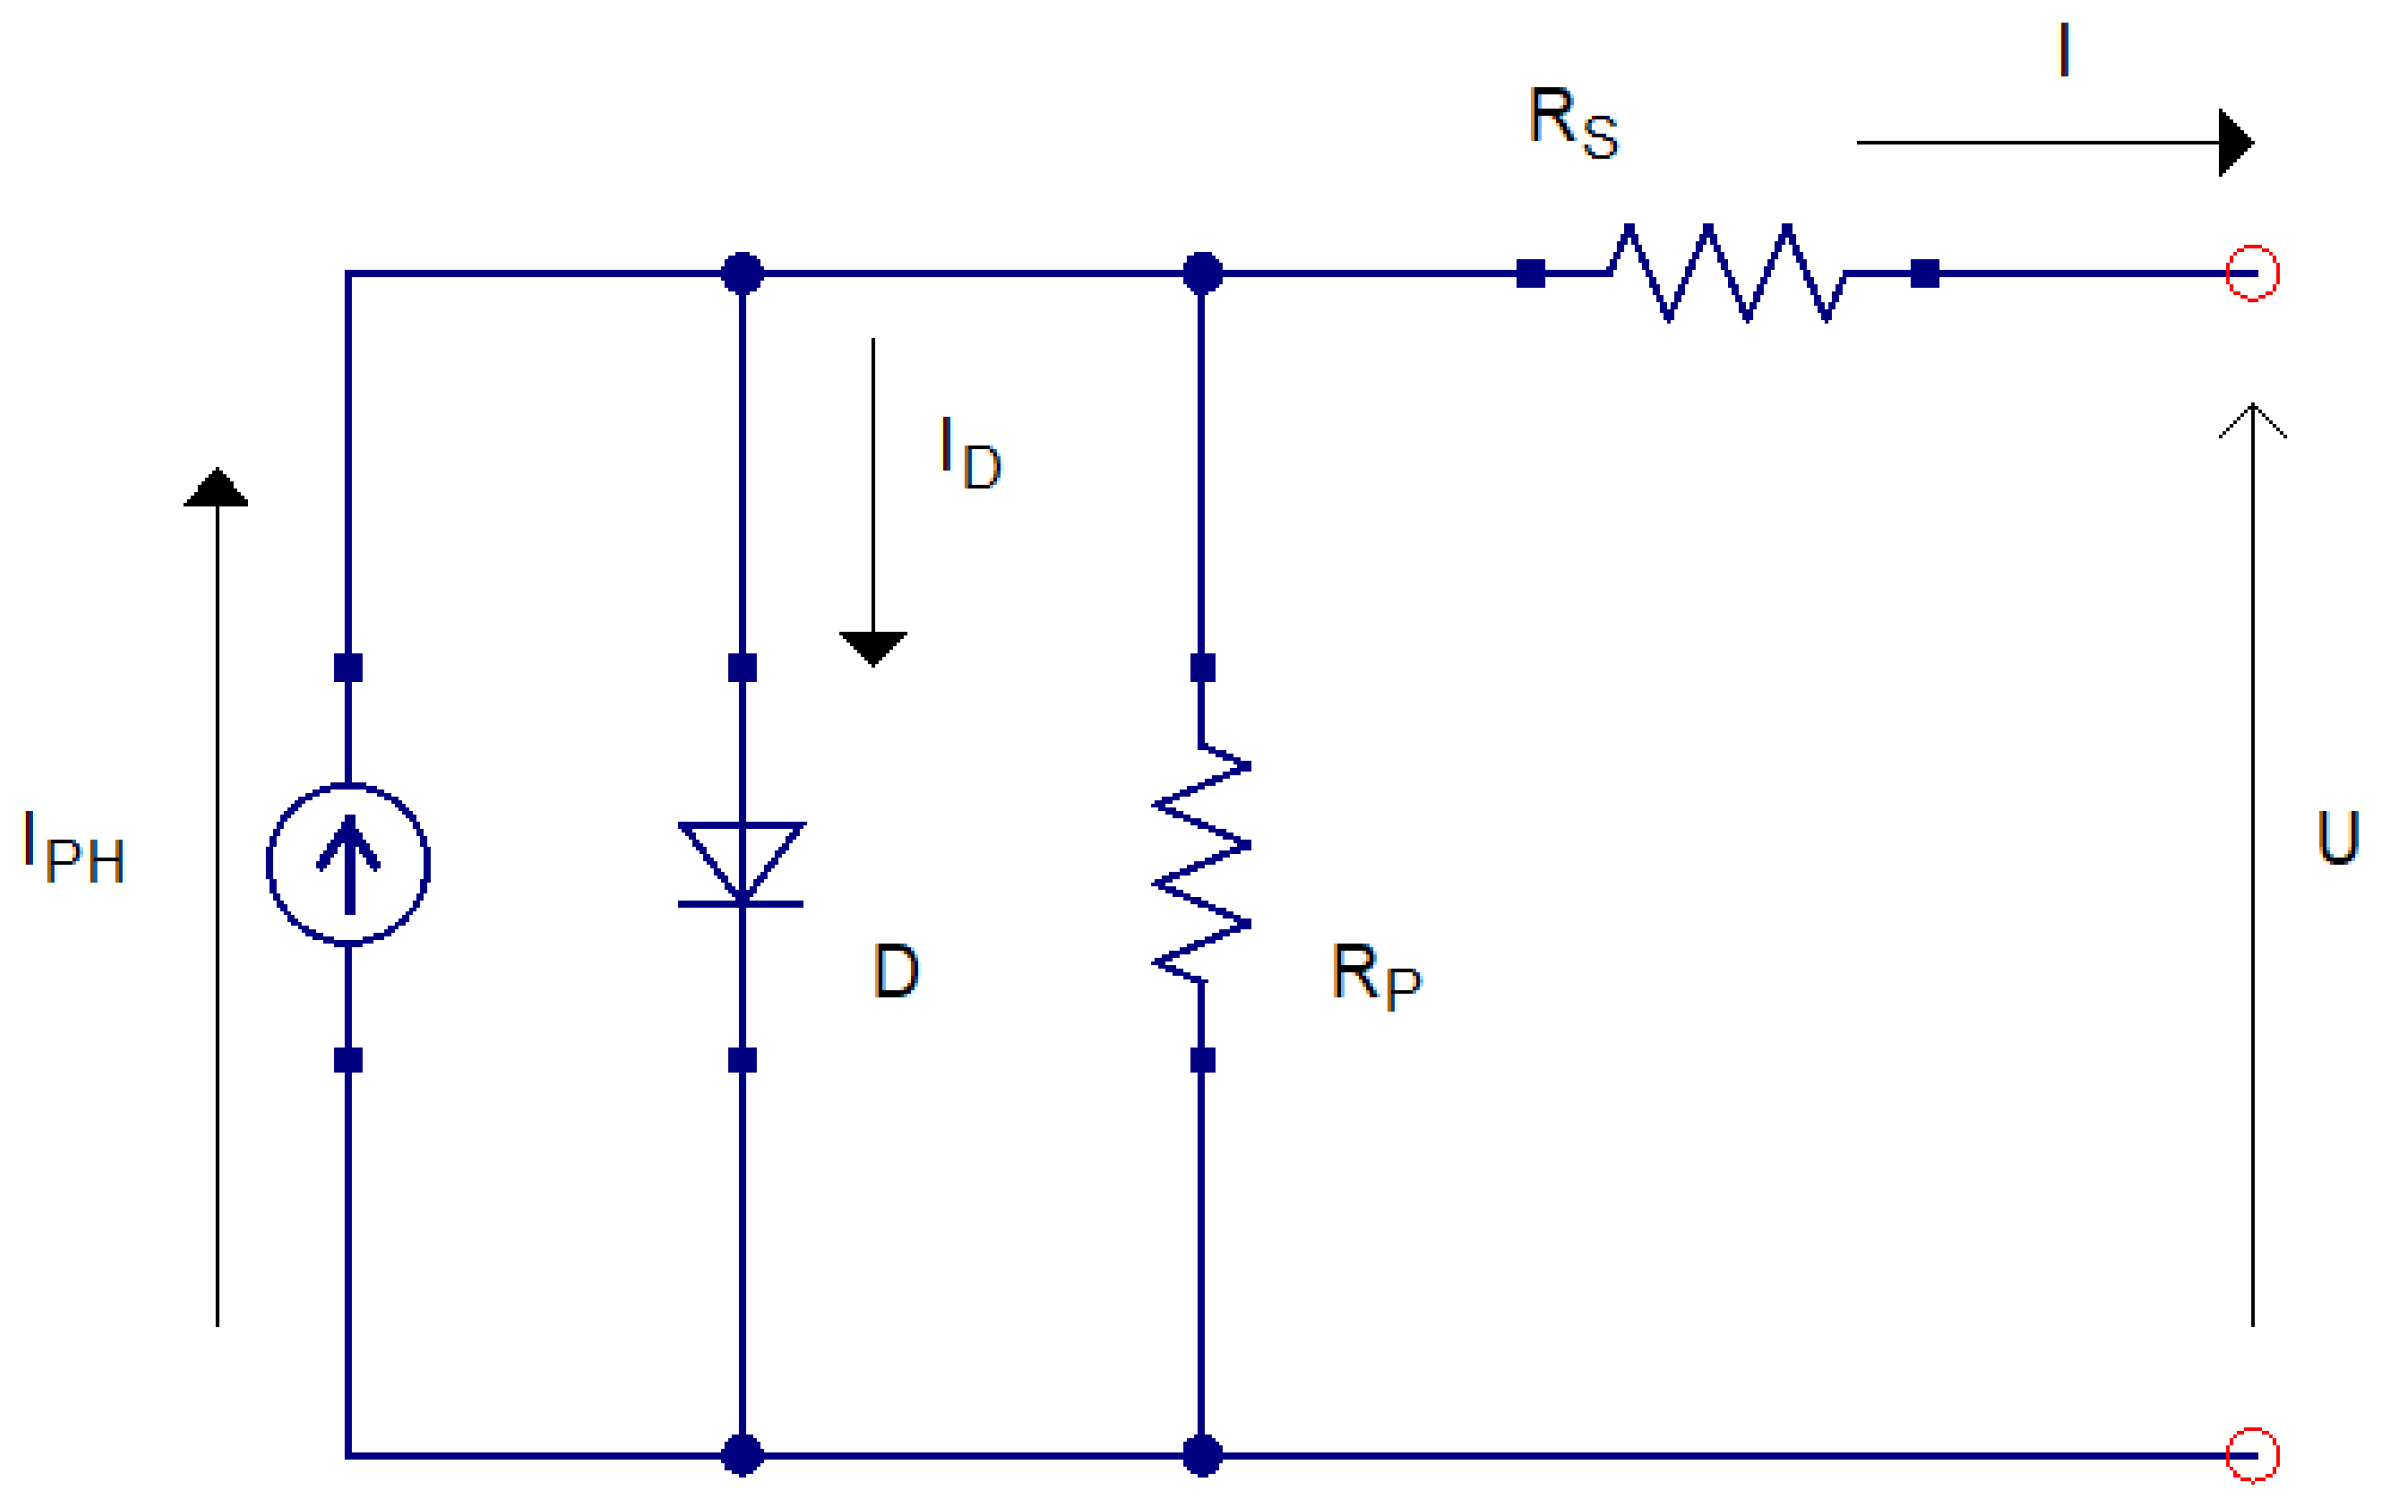
To calculate the performance of a photovoltaic module system, we need to understand the instantaneous current and voltage. This requires knowledge of the single-diode model of solar cells (
Figure 6):
The electrical model of a photovoltaic module consists of four main components:
IPH, the current source, which is the source of the photocurrent:
where:
is the cell area,
H irradiation reaching the cell
ɳ is the proportionality factor.
D, the diode, a nonlinear element that reflects dependency on bandgap and recombination losses,
Rp, parallel resistance, represents losses caused by conductors,
Rs, series resistance, indicates losses due to non-ideal conductors [
80].
The relationship between current I and voltage U for a single cell is expressed by the following Equations (7) and (8):
where:
temperature,
T (in Kelvin), the Boltzmann constant
k, and the elementary charge
e are used to calculate the maximum power points and behaviour at different temperatures.
In a module, several cells are connected in series to form a string, and several strings are connected in parallel. Connecting cells in series increases the voltage (Equation (9)) while connecting cells in parallel increases the current (Equation (10)):
Therefore, the overall performance calculation through the
U I equation can only be solved iteratively.
Figure 7 illustrates a typical voltage–current curve.
The criteria for a 330 W solar panel include a maximum power voltage (Umpp) of 30 V. This is determined by the fact that 60 cells are connected in a series, resulting in each Umpp being 0.5 V, as stated in Equation (11).
The maximum current that can be produced by the parallel solar panels is 11 A, with each panel contributing 5.5 A. This is calculated using Equation (12).
The maximum power point, denoted as Pmpp, is equal to 330 W according to Equation (13).
The open circuit voltage (Uoc) is 36 V, which is the result of 60 cells connected in series, with each cell having a voltage of 0.6 V.
The short circuit current (Isc) is 12 A, with each Isc being 6 A due to the parallel series configuration of Np = 2.
The curve is very sensitive to the following changes:
- -
Conversion efficiency (shifts to higher current output),
- -
Higher temperatures cause lower open-circuit voltage and higher short-circuit current, resulting in a shift towards lower performance at the Maximum Power Point (MPP).
- -
Higher leakage current results in a flatter curve at reverse saturation current.
- -
An increase in series resistance results in higher losses and lower voltage [
81,
82].
4.3. Relative Efficiency of Photovoltaic Modules
Figure 8 illustrates the relative efficiency as a function of the incoming light intensity at various temperatures. These measurements are presented under standard testing conditions, that is, at 25 °C and 1000 W/m
2. The conversion efficiency remains nearly constant across the entire range, with a steep decline occurring only below 100 W/m
2 (
Figure 8). This is because at low irradiance levels—below 100 W/m
2—the Shockley–Read–Hall (SRH) recombination loss occurs at a higher rate in solar cells. This happens because fewer electron–hole pairs are generated, and more of them recombine in the material’s defects. Consequently, the efficiency of the solar cell decreases, especially if the material quality is inadequate. To improve efficiency, it is essential to minimise material defects and impurities and to use appropriate materials and technologies. Due to changes in module temperature, the curve shifts upwards (if colder) or downwards (if warmer) [
82].
The radiation value depicted in
Figure 8 reflects the combined amount of all direct, diffused, and reflected radiation. Efficiency refers to the ratio between the net power created by the solar cell, measured at the output of the solar panel, and the amount of radiation received by the solar cell.
4.4. Maximum Power Tracking in Solar Systems
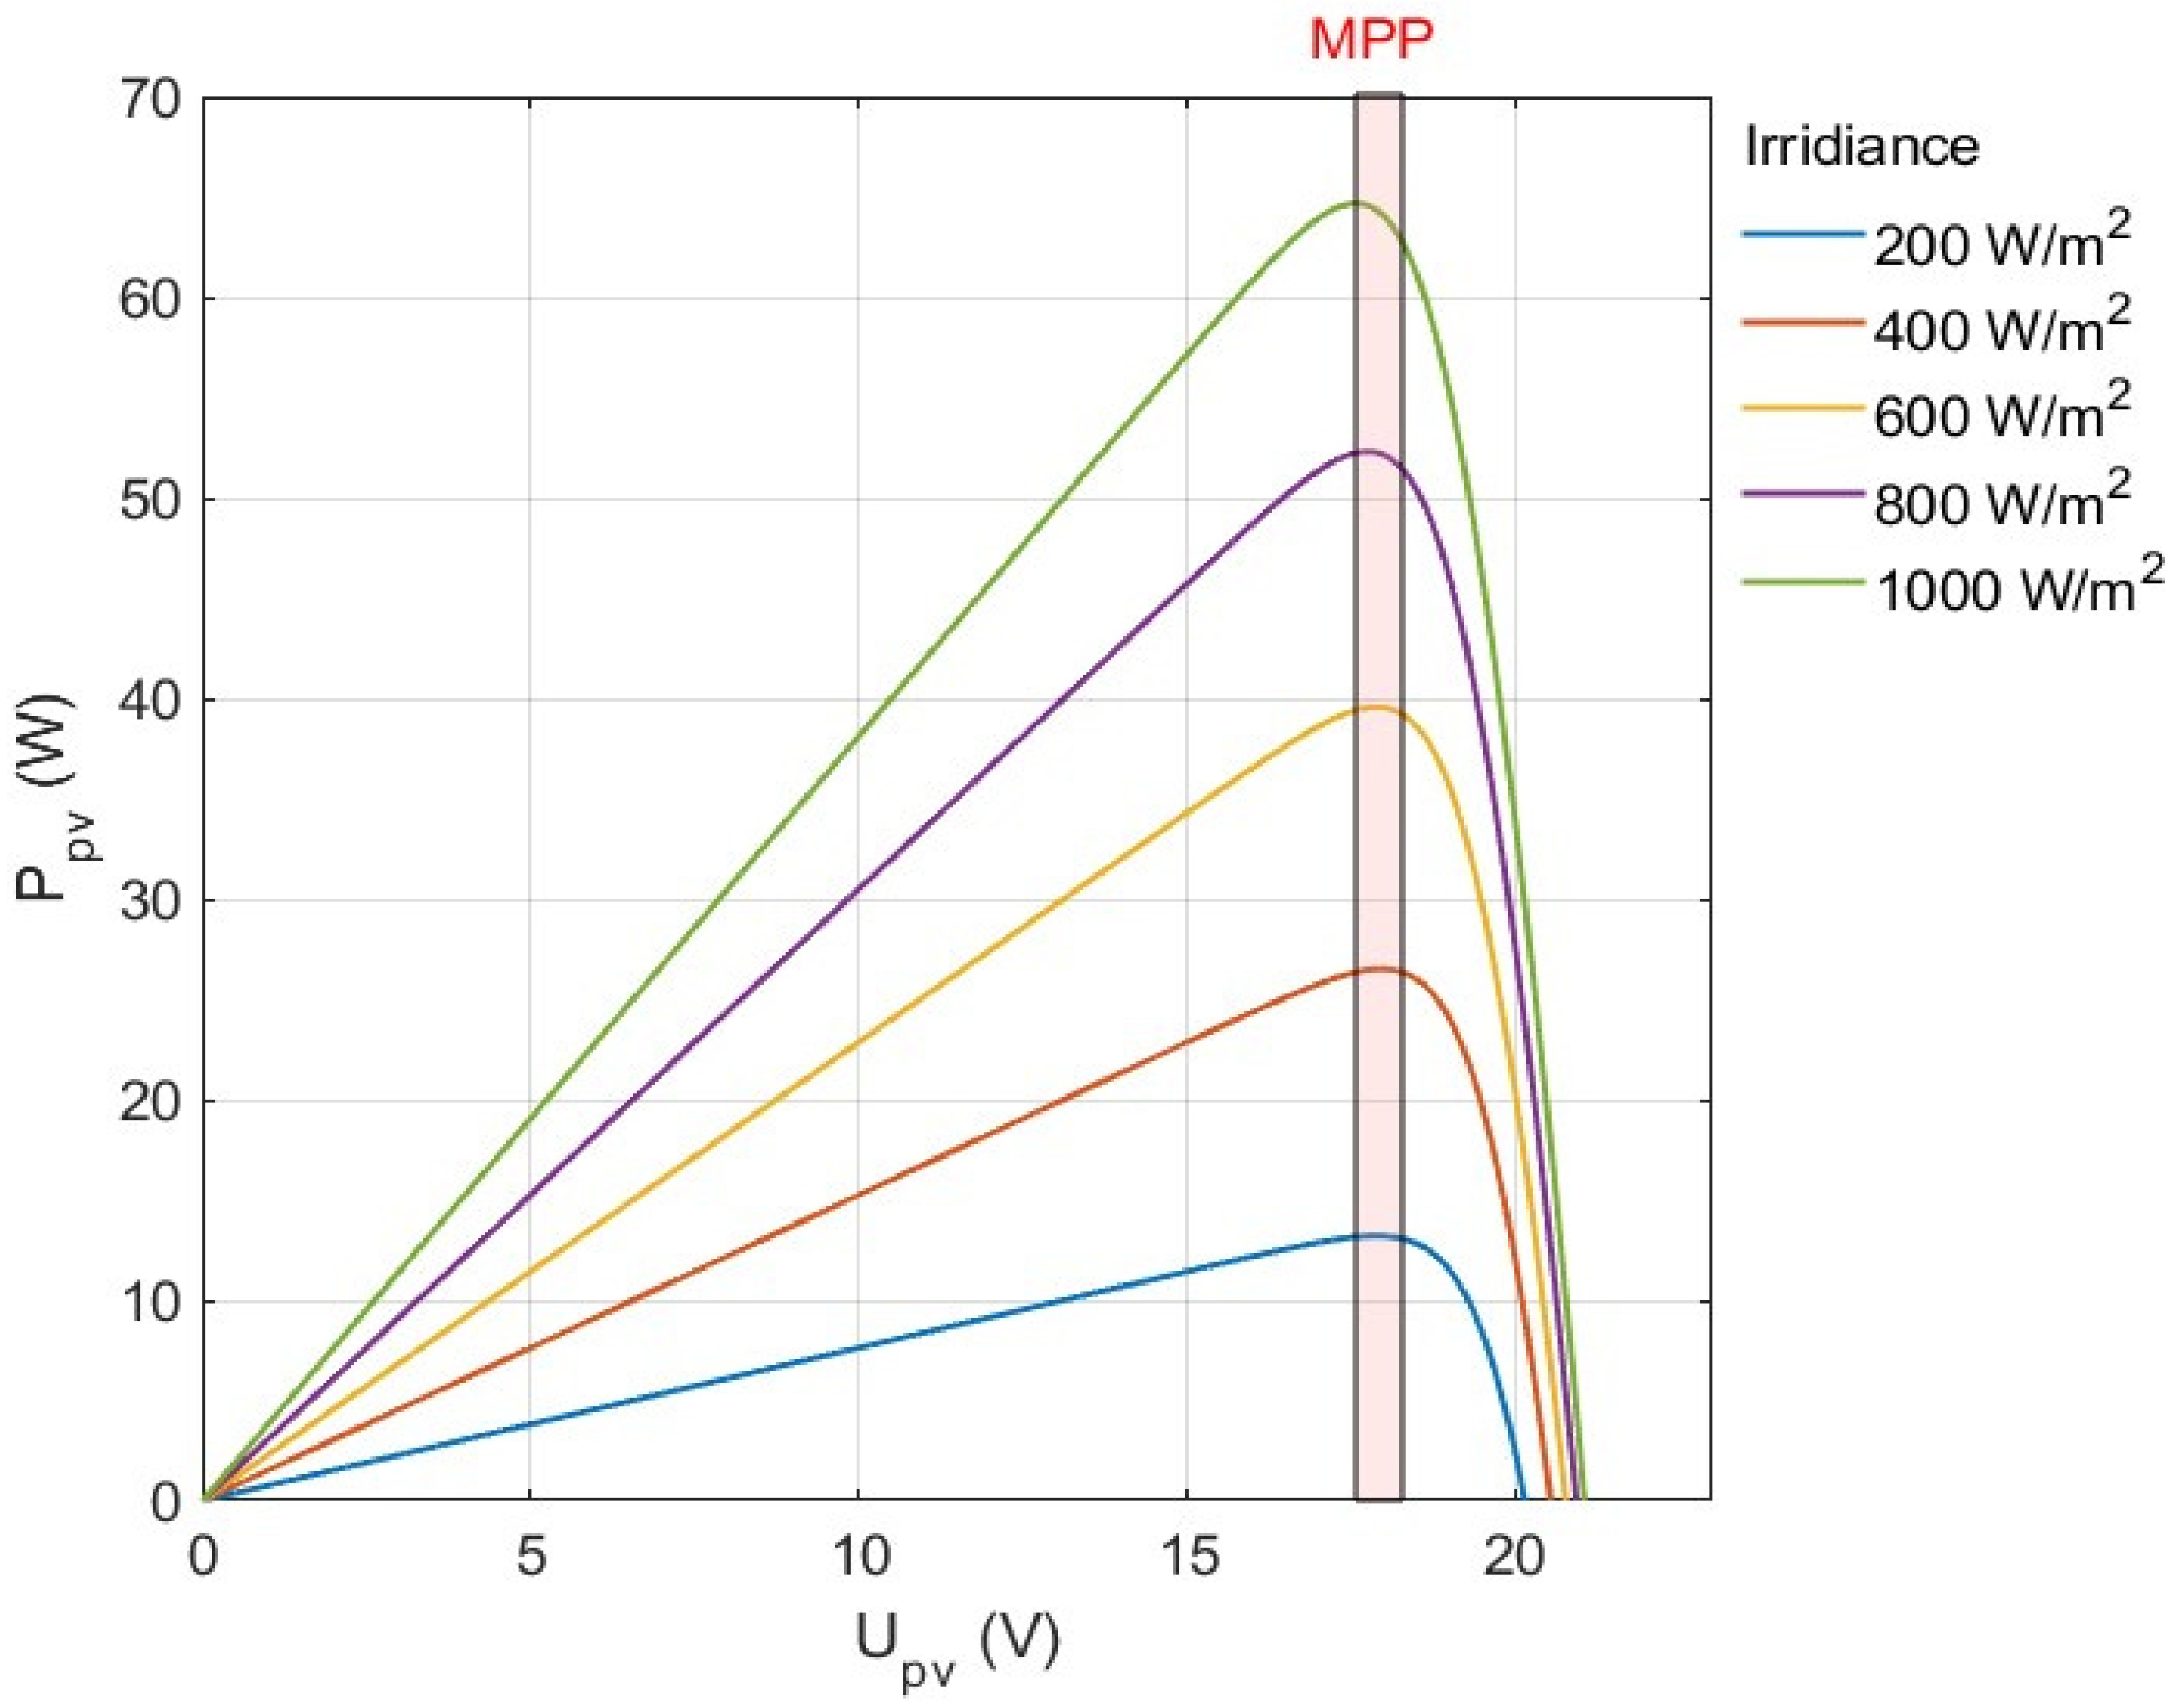
During the day, as light intensity varies, the maximum power point shifts to different voltages and currents (see
Figure 9). This indicates that the solar module will unlikely operate at optimal performance if the voltage is fixed. A Maximum Power Point Tracker (MPPT) is installed between the solar module and the load to ensure optimal operation. Such an MPPT is an adjustable high-frequency DC-DC converter that ensures the interface between the load and the solar module [
82].
4.5. Annual Solar Energy Performance
The annual performance calculation of solar power plants enables constructors, operators, and owners to obtain a realistic view of their facilities’ efficiency and profitability. The calculations include, among other factors, the energy production and efficiency of the solar power plant over a given year. By analysing annual performance, areas needing development can be identified, and the system performance can be optimised.
The annual performance heavily depends on the amount of solar radiation, temperature, and other weather parameters. These data can be acquired from onsite meteorological stations or internationally recognised meteorological databases. Furthermore, precise knowledge of specific data on the solar power plant, such as the size and type of photovoltaic modules, inverters, and other components, as well as any shading or obstacles that may affect performance, is crucial. Solar software and mathematical models greatly assist in these calculations.
The data are available in kilowatt-hours (kWh) and represent the amount of electrical energy produced by the system over a specified period, typically in hourly, daily, or monthly intervals. By summing the total yearly energy production, the annual energy yield of the solar power plant can be determined. Calculating the annual performance and energy yield enables the computation of performance indicators, such as the Performance Ratio (PR) or Capacity Factor (CF). The Performance Ratio is calculated by dividing the actual energy production by the expected energy production, while the Capacity Factor represents the ratio of the actual energy production to the maximum potential energy production of the system [
83].
In addition to energy production, other factors that influence the performance of the solar power plant must be considered. These include system downtime due to maintenance or network issues, contamination accumulated on the photovoltaic modules, and degradation of system components over time. Considering these factors provides a more accurate depiction of the solar system’s operation. Annual performance calculations offer insights into specific problems and anomalies. Analysing energy production on a monthly or seasonal basis can identify factors causing performance reduction. These calculations facilitate the efficient operation and maintenance of solar power plants, ensuring their long-term viability and contribution to sustainable energy production [
84].
4.6. Scenario Scripts and The Representative Concentration Pathways
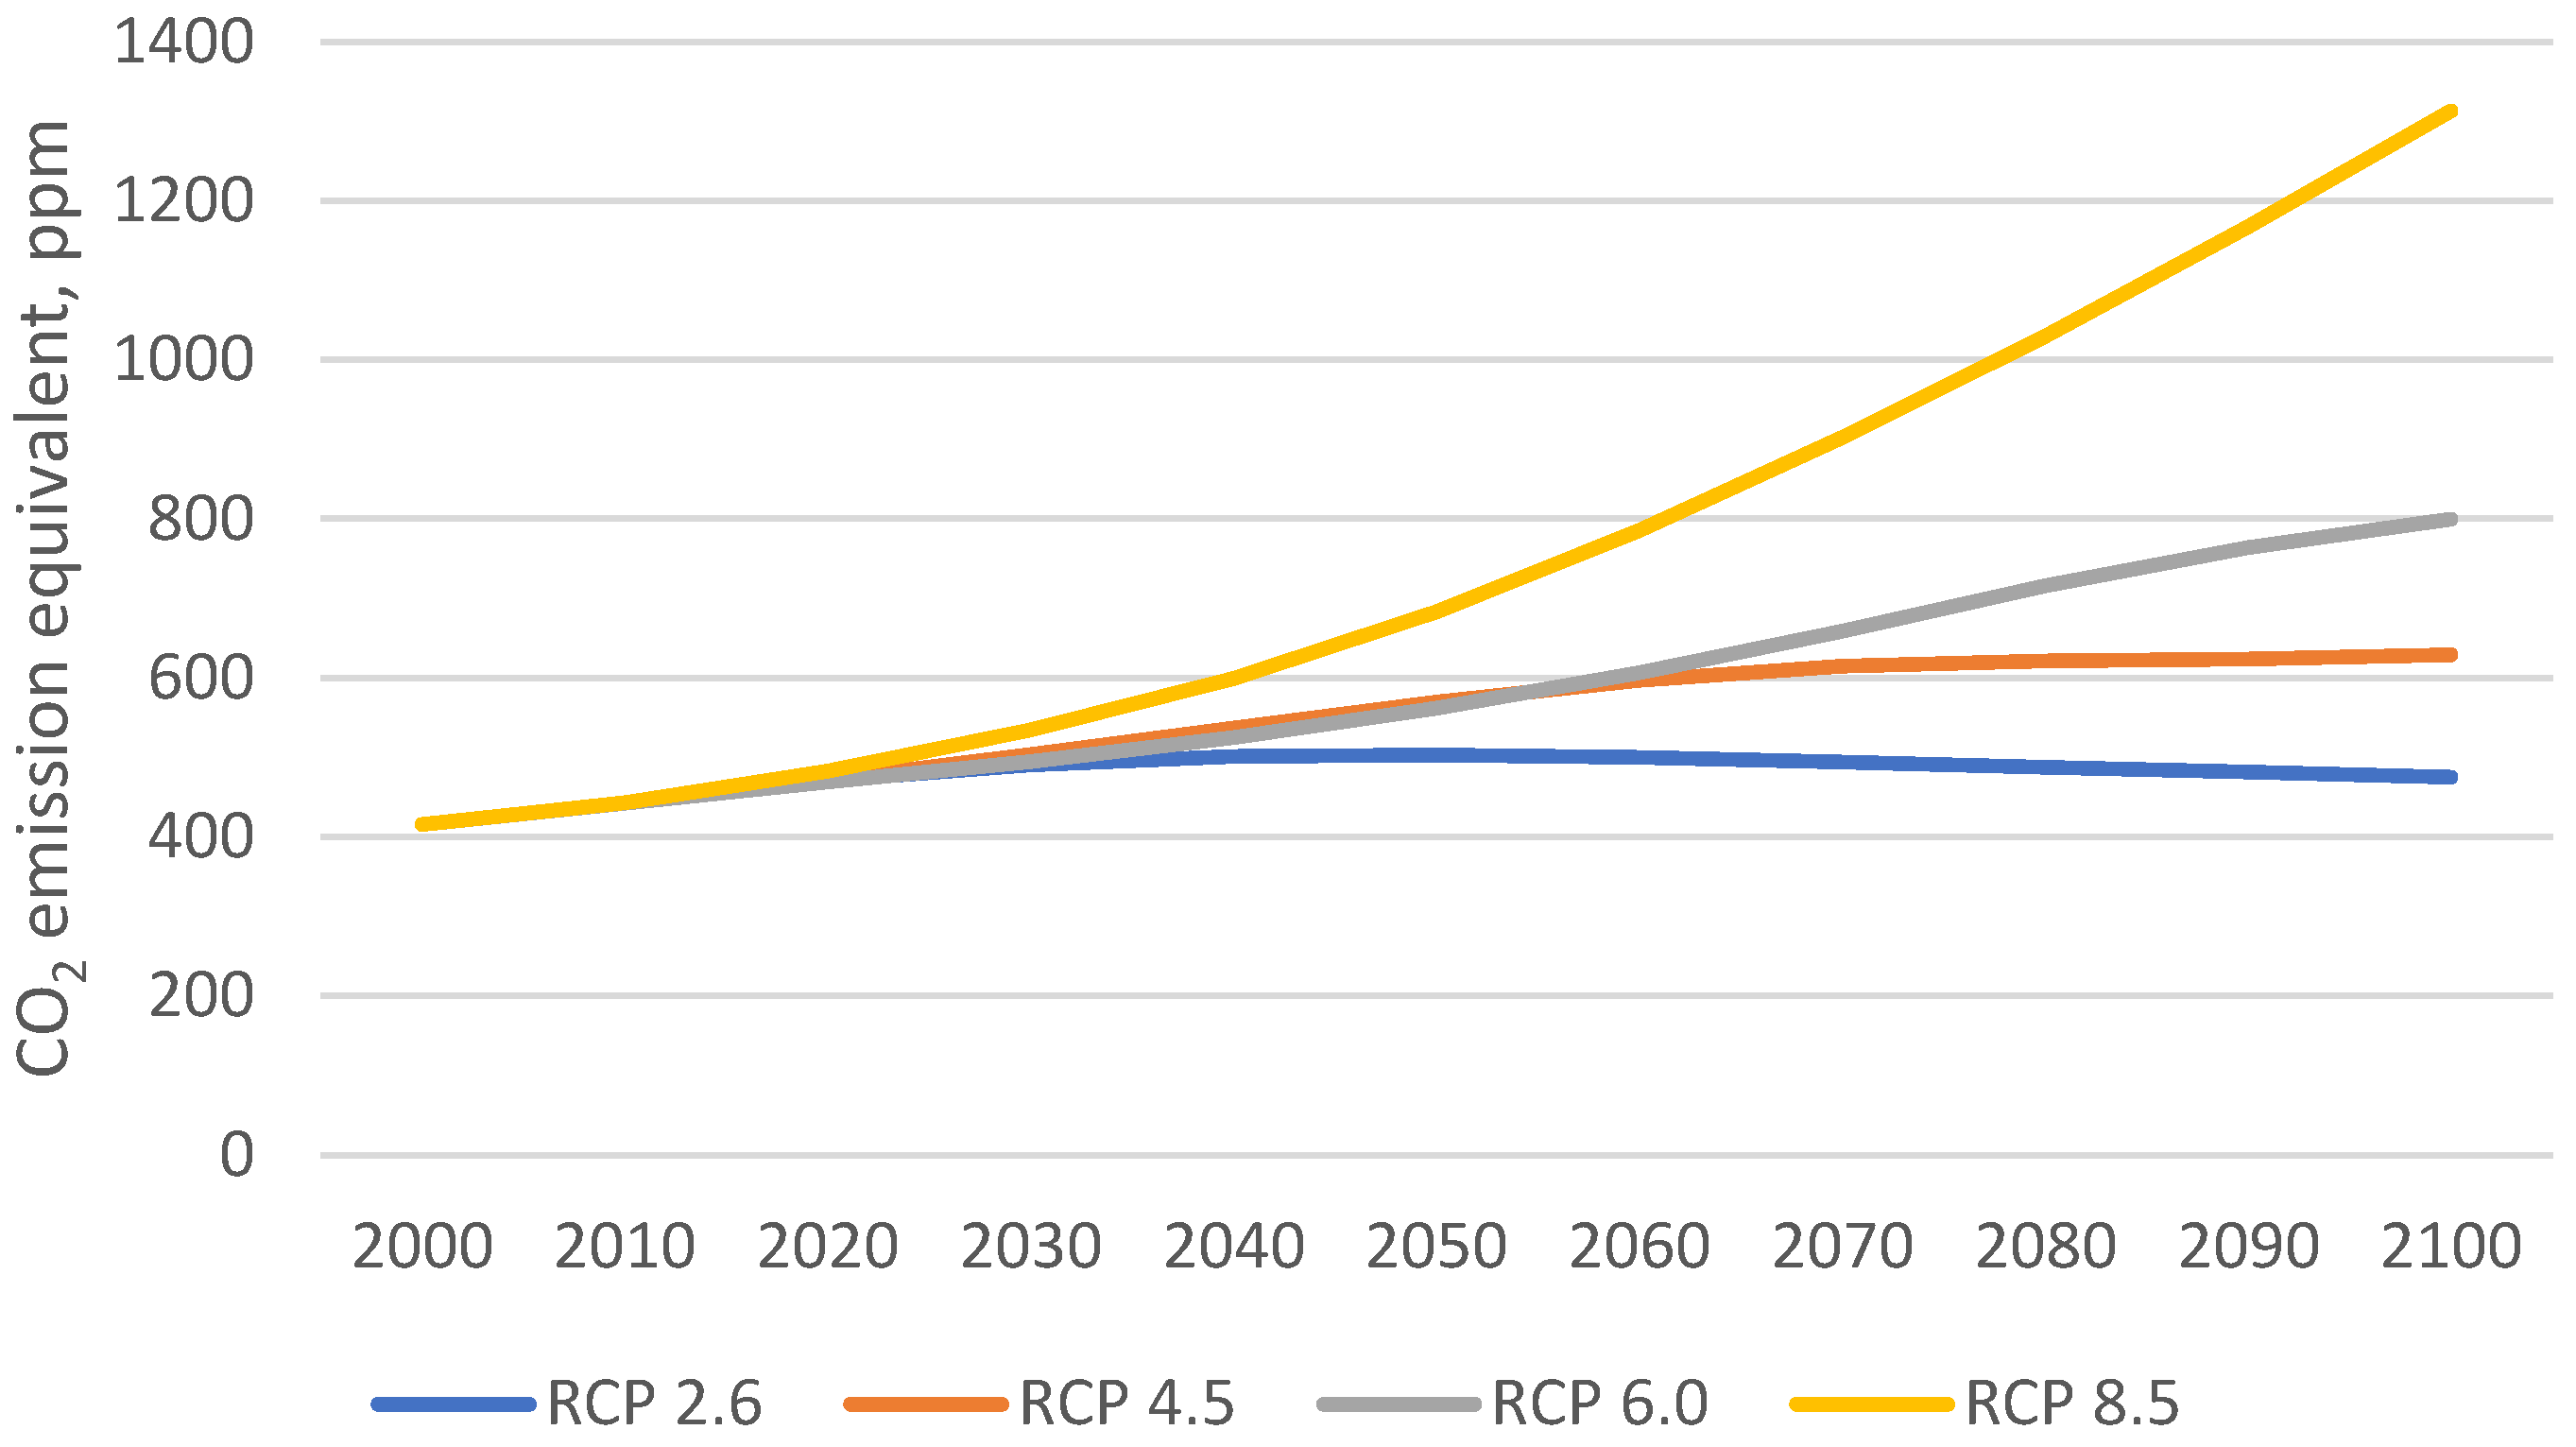
The Representative Concentration Pathways (RCPs) are a set of greenhouse gas concentration trajectories used in climate modelling to forecast potential future climate outcomes. These scenarios describe different possible paths of radiative forcing and emissions and their impacts on climate change (see
Figure 10 and
Figure 11). The scenarios range from the low-emission RCP 2.6 to the high-emission RCP 8.5. Other RCP scenarios, such as RCP 4.5 and RCP 6.0, represent intermediate emission pathways [
85].
The RCP 2.6 scenario assumes that CO
2 emissions will begin to decrease by the 2020s and reach zero by 2100, resulting in a radiative forcing of 2.6 W/m
2 by 2100 (a change in the energy flux directed towards the atmosphere due to human activities). This scenario is likely (66–90% chance) to limit global warming to below 2 °C by 2100 [
86].
The RCP 4.5 scenario assumes that CO
2 emissions will begin to decrease around 2045 and reach approximately half the 2050 levels by 2100, resulting in a radiative forcing of 4.5 W/m
2 by 2100. The RCP 4.5 is more likely to increase global temperature between 2 °C and 3 °C [
87,
88,
89].
The RCP 6.0 scenario assumes that global emissions will peak around 2080 and decline, leading to a radiative forcing of 6.0 W/m
2 and an approximate global temperature rise of 3–4 °C by 2100 [
90].
The RCP 8.5 scenario assumes that global emissions will continue to rise throughout the 21st century, leading to a nearly 4 °C increase in global average temperature by 2100 [
91].
4.7. Meteonorm: The Weather Database
Meteonorm is a comprehensive meteorological database and software package that provides environmental and weather data from various locations worldwide. The program offers historical, current, and forecasted weather data, making it an invaluable tool for the design of energy systems, building performance analysis, and environmental assessment. Meteonorm aggregates data from multiple sources, including terrestrial meteorological stations and satellites. It covers various climatic variables such as temperature, solar radiation, wind speed, humidity, and precipitation. Data are available at various temporal resolutions, including hourly, daily, monthly, and annual intervals.
Users can customise output formats and units according to their needs, and the user-friendly interface simplifies the process of managing and analysing climatic data. Meteonorm’s weather data can be accessed through the Meteonorm 8.0.2 software or the Meteonorm API. The software provides an interface for retrieving, displaying, and exporting data. It allows for selecting specific locations and periods and can generate custom weather files or graphical representations. The Meteonorm API enables users to integrate Meteonorm features into their own software applications. It provides endpoints that allow access to the Meteonorm database. Developers can use API requests to retrieve weather data for specified locations, variables, and time ranges. The API response typically returns the requested data in a structured format, such as JSON or XML.
The Meteonorm program’s Climate Forecast Data Series, combined with Representative Concentration Pathway (RCP) scenarios, offers a robust tool for understanding and simulating future climatic conditions. Using the RCP scenarios, Meteonorm forecasts variables such as temperature, precipitation, wind speed, solar radiation, etc. While these data are indicative and not definitive, they provide a valuable indication of the future trends of various indicators and the results of dependent simulations. These insights are invaluable for applications that include planning renewable energy projects, building design suited to future climatic conditions, agricultural decision-making, and environmental research related to climate change adaptation [
92].
4.8. System Advisor Model: The Simulation Program
The System Advisor Model (SAM) is a versatile simulation program primarily used for photovoltaic applications and is widely employed by researchers and professionals in the renewable energy sector. A key feature of SAM is its ability to simulate the performance of solar systems across different geographical locations, weather conditions, and system configurations. SAM includes a detailed weather database, including long-term historical weather data from thousands of points worldwide. Using these data, SAM provides realistic and accurate forecasts of energy production based on factors such as solar radiation, temperature, shading, and system losses [
93].
Users can customise their simulations by specifying system components such as PV module types, inverters, and storage solutions. This flexibility allows users to optimise their designs for maximum energy output and cost efficiency. Another primary capability of SAM is financial analysis. The program includes financial models considering project costs, incentives, tax credits, and electricity rates. By specifying financial parameters, SAM can provide a comprehensive assessment of the economic viability of solar energy projects. It calculates key financial metrics such as Net Present Value (NPV), Internal Rate of Return (IRR), Levelized Cost of Energy (LCOE), and payback periods. These help users navigate project financing and profitability and make informed decisions. Additionally, SAM can simulate hybrid systems that combine solar energy with other renewable sources like wind or biomass, enabling comprehensive analysis and optimisation of the energy system [
94].
The simulation of a city’s chronology from 2010 to 2100 for an RCP scenario is conducted in SAM using the following method. Initially, radiation and climatic data are generated. The Meteonorm application retrieves the typical meteorological year (TMY) created for the city’s RCP scenario from the central database. The file has a series of ten-year intervals that are commonly found, and it includes a “cvs” extension. The file comprises many data, some of which may not be utilized, recorded on an hourly basis (8760 h). This data contains global horizontal radiation, direct normal radiation, diffuse horizontal radiation, dry-moist air temperatures, relative humidity, wind direction, wind speed, and snow depth.
Prior to initiating the simulation in the SAM 2021.12.2-r2 software, it is important to choose the components of the solar system, including the specific type of solar panels and inverters. When choosing and building the topology, it is crucial to ensure that the voltage and current values of the inverter inputs stay within the specified range. It is imperative to guarantee that these conditions stay within the specified range, even under harsh temperature circumstances. Decreasing temperatures, while keeping the radiation conditions constant, lead to an increase in the voltage across empty air. Additionally, it is imperative to furnish comprehensive information regarding installation specifications, including details on orientation, tilt angle, and the specific type of installation, such as free-standing, fixed, or sun-tracking.
Subsequently, SAM is then ready to be run. Thus, several factors can be ascertained, including the yearly production of electric current which holds significance for us.
4.9. Application of SPSS Statistical Software
Correlation and partial correlation are statistical methods applied in SPSS (Statistical Package for the Social Sciences), which explore the relationships between variables. These methods allow for determining the strength and direction of relationships between variables.
Correlation analysis measures the strength and direction of the linear relationship between two continuous variables. Partial correlation extends this analysis by measuring the relationship between two variables while taking one or more other variables as control variables. This helps assess the relationship between two variables by ignoring the effects of one or more other variables. The correlation coefficient, denoted as r, indicates a strong linear relationship with a value close to −1 or 1, while a value near 0 does not suggest a significant linear relationship. The sign (+/−) indicates the direction of the relationship. The significance level, or
p-value, indicates the statistical significance of the correlation coefficient. A
p-value smaller than the chosen significance level (e.g., 0.05) indicates a significant relationship between the variables. The partial correlation coefficient (r) is interpreted similarly to the correlation coefficient, where values close to −1 or 1 indicate a strong partial linear relationship and values near 0 do not suggest significant relations. The +/− sign indicates the direction of the relationship. It is important to note that correlation does not imply causation. Correlation measures the strength and direction of a relationship but does not establish a cause-and-effect relationship between the variables [
95].
6. Discussion
Specifically, there is no study on the development of the production of solar energy sources in the 21st century discussed in the article on the Carpathian Basin. Similar articles have been produced on geographical regions of Europe to examine the effects of climate change on solar systems in this century.
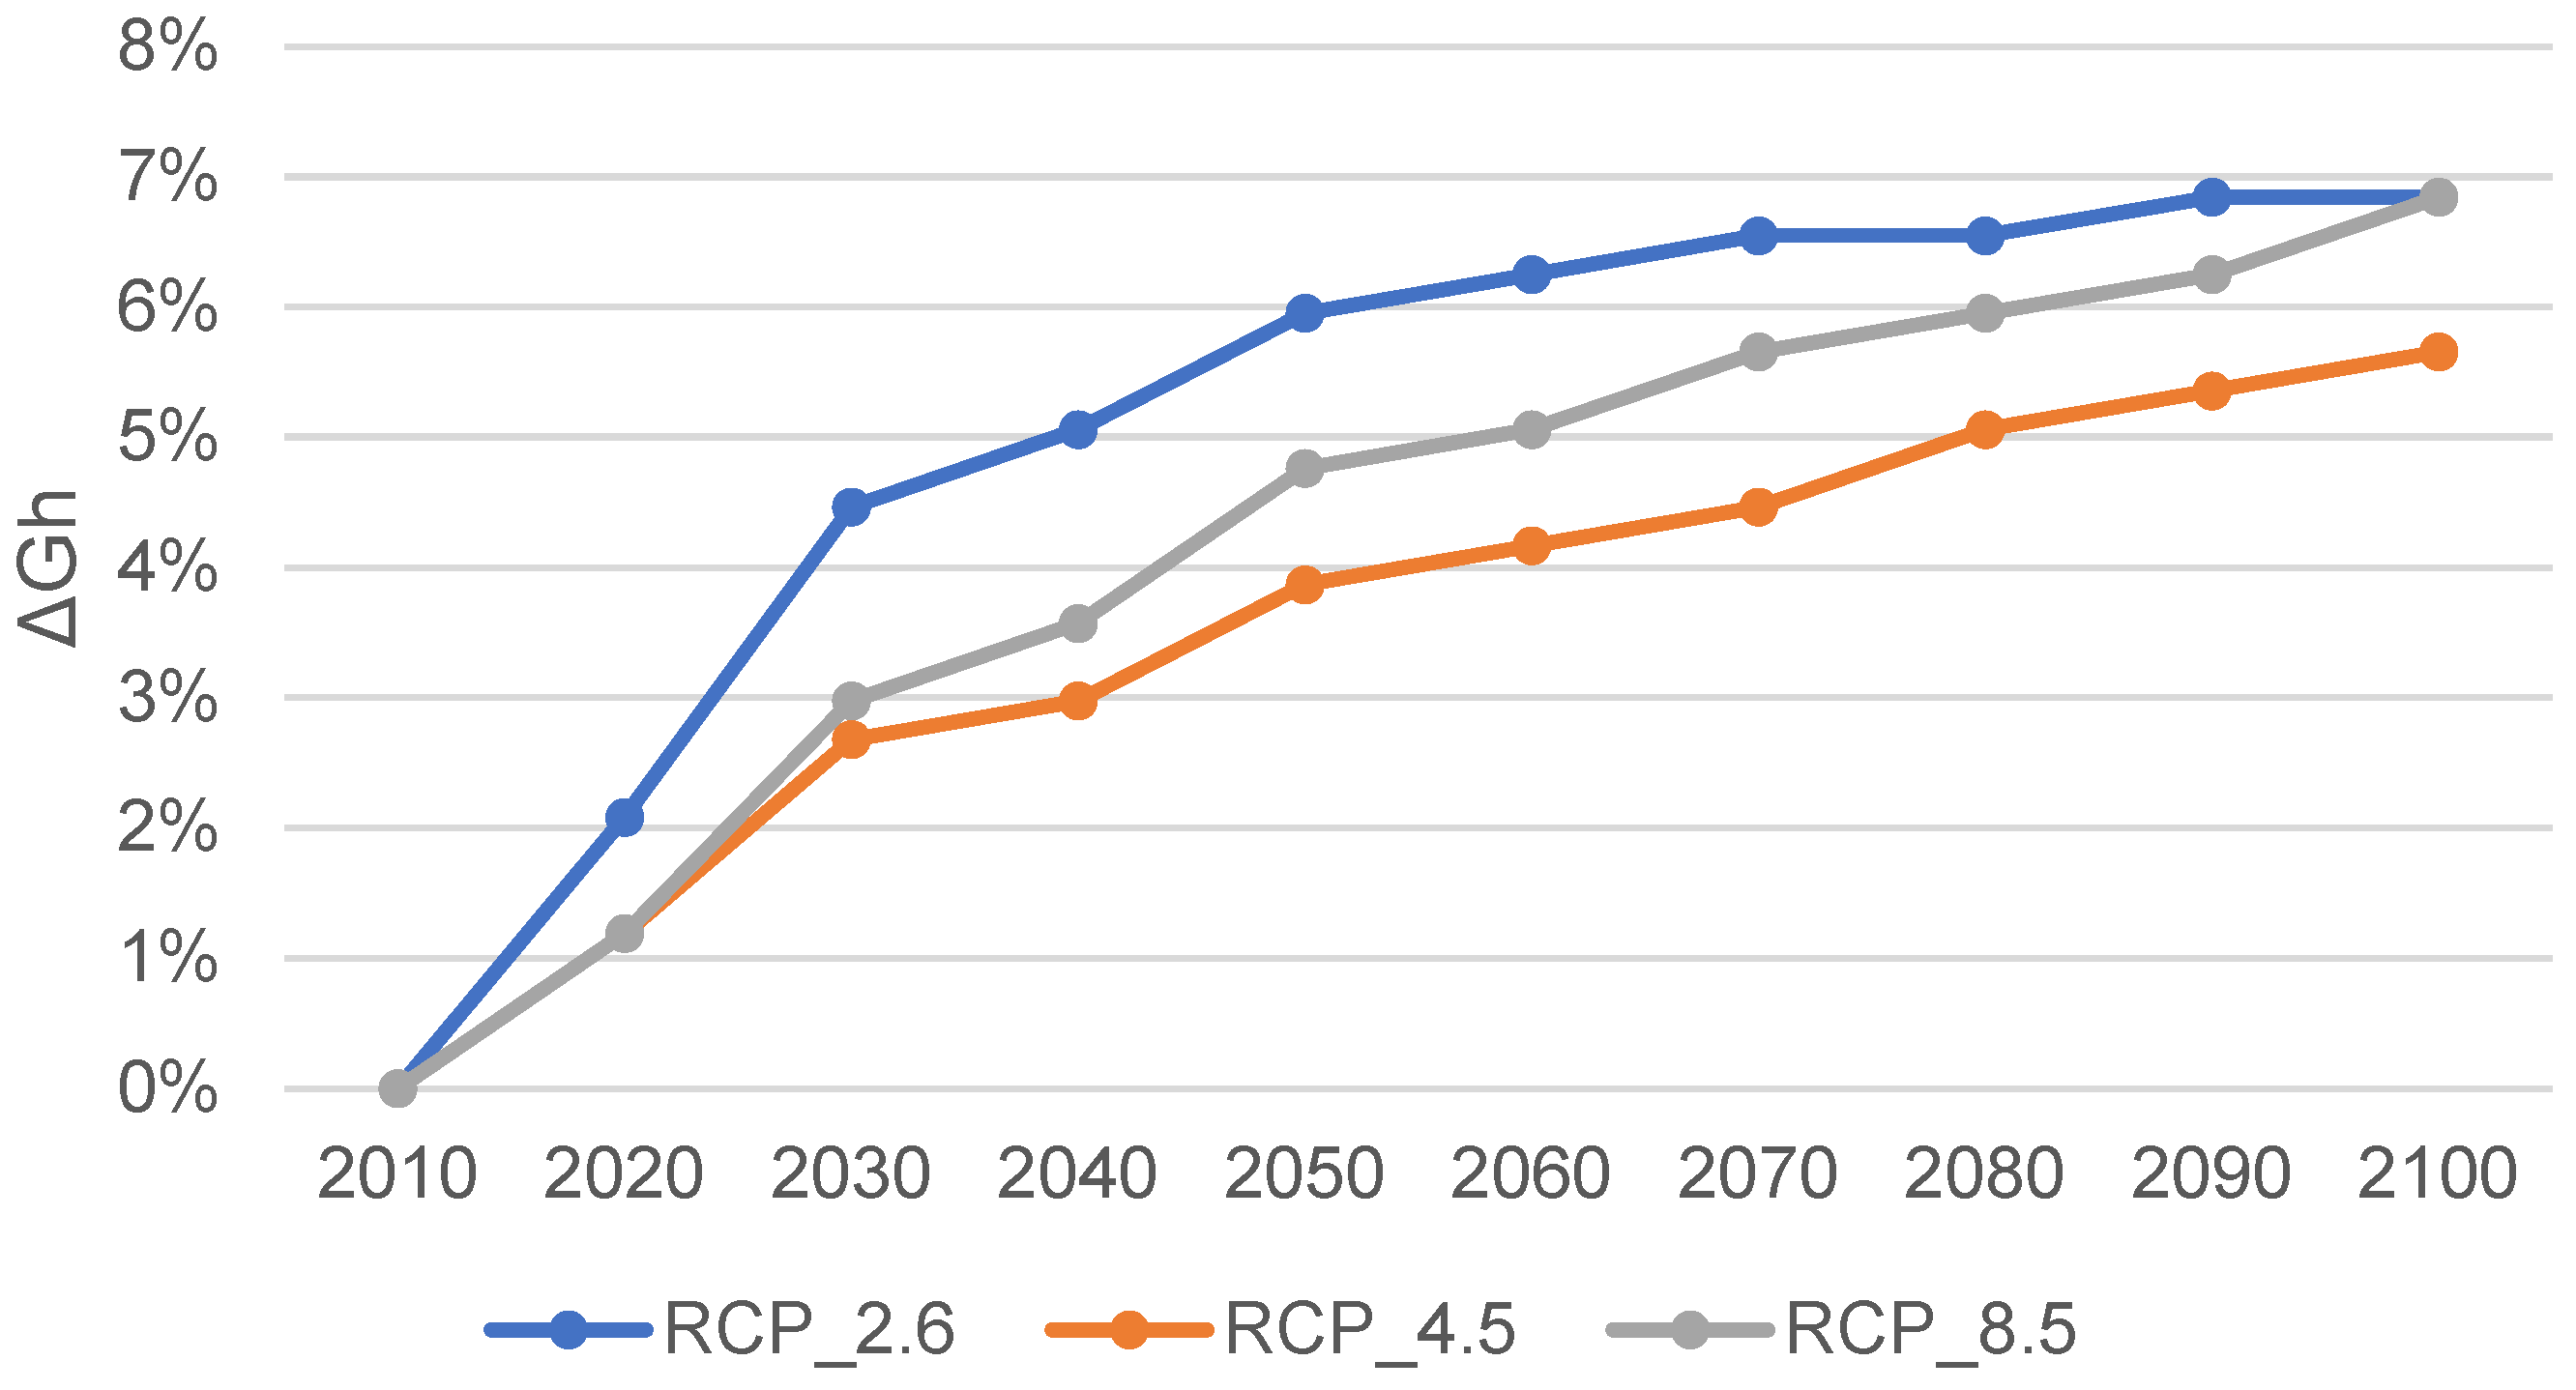
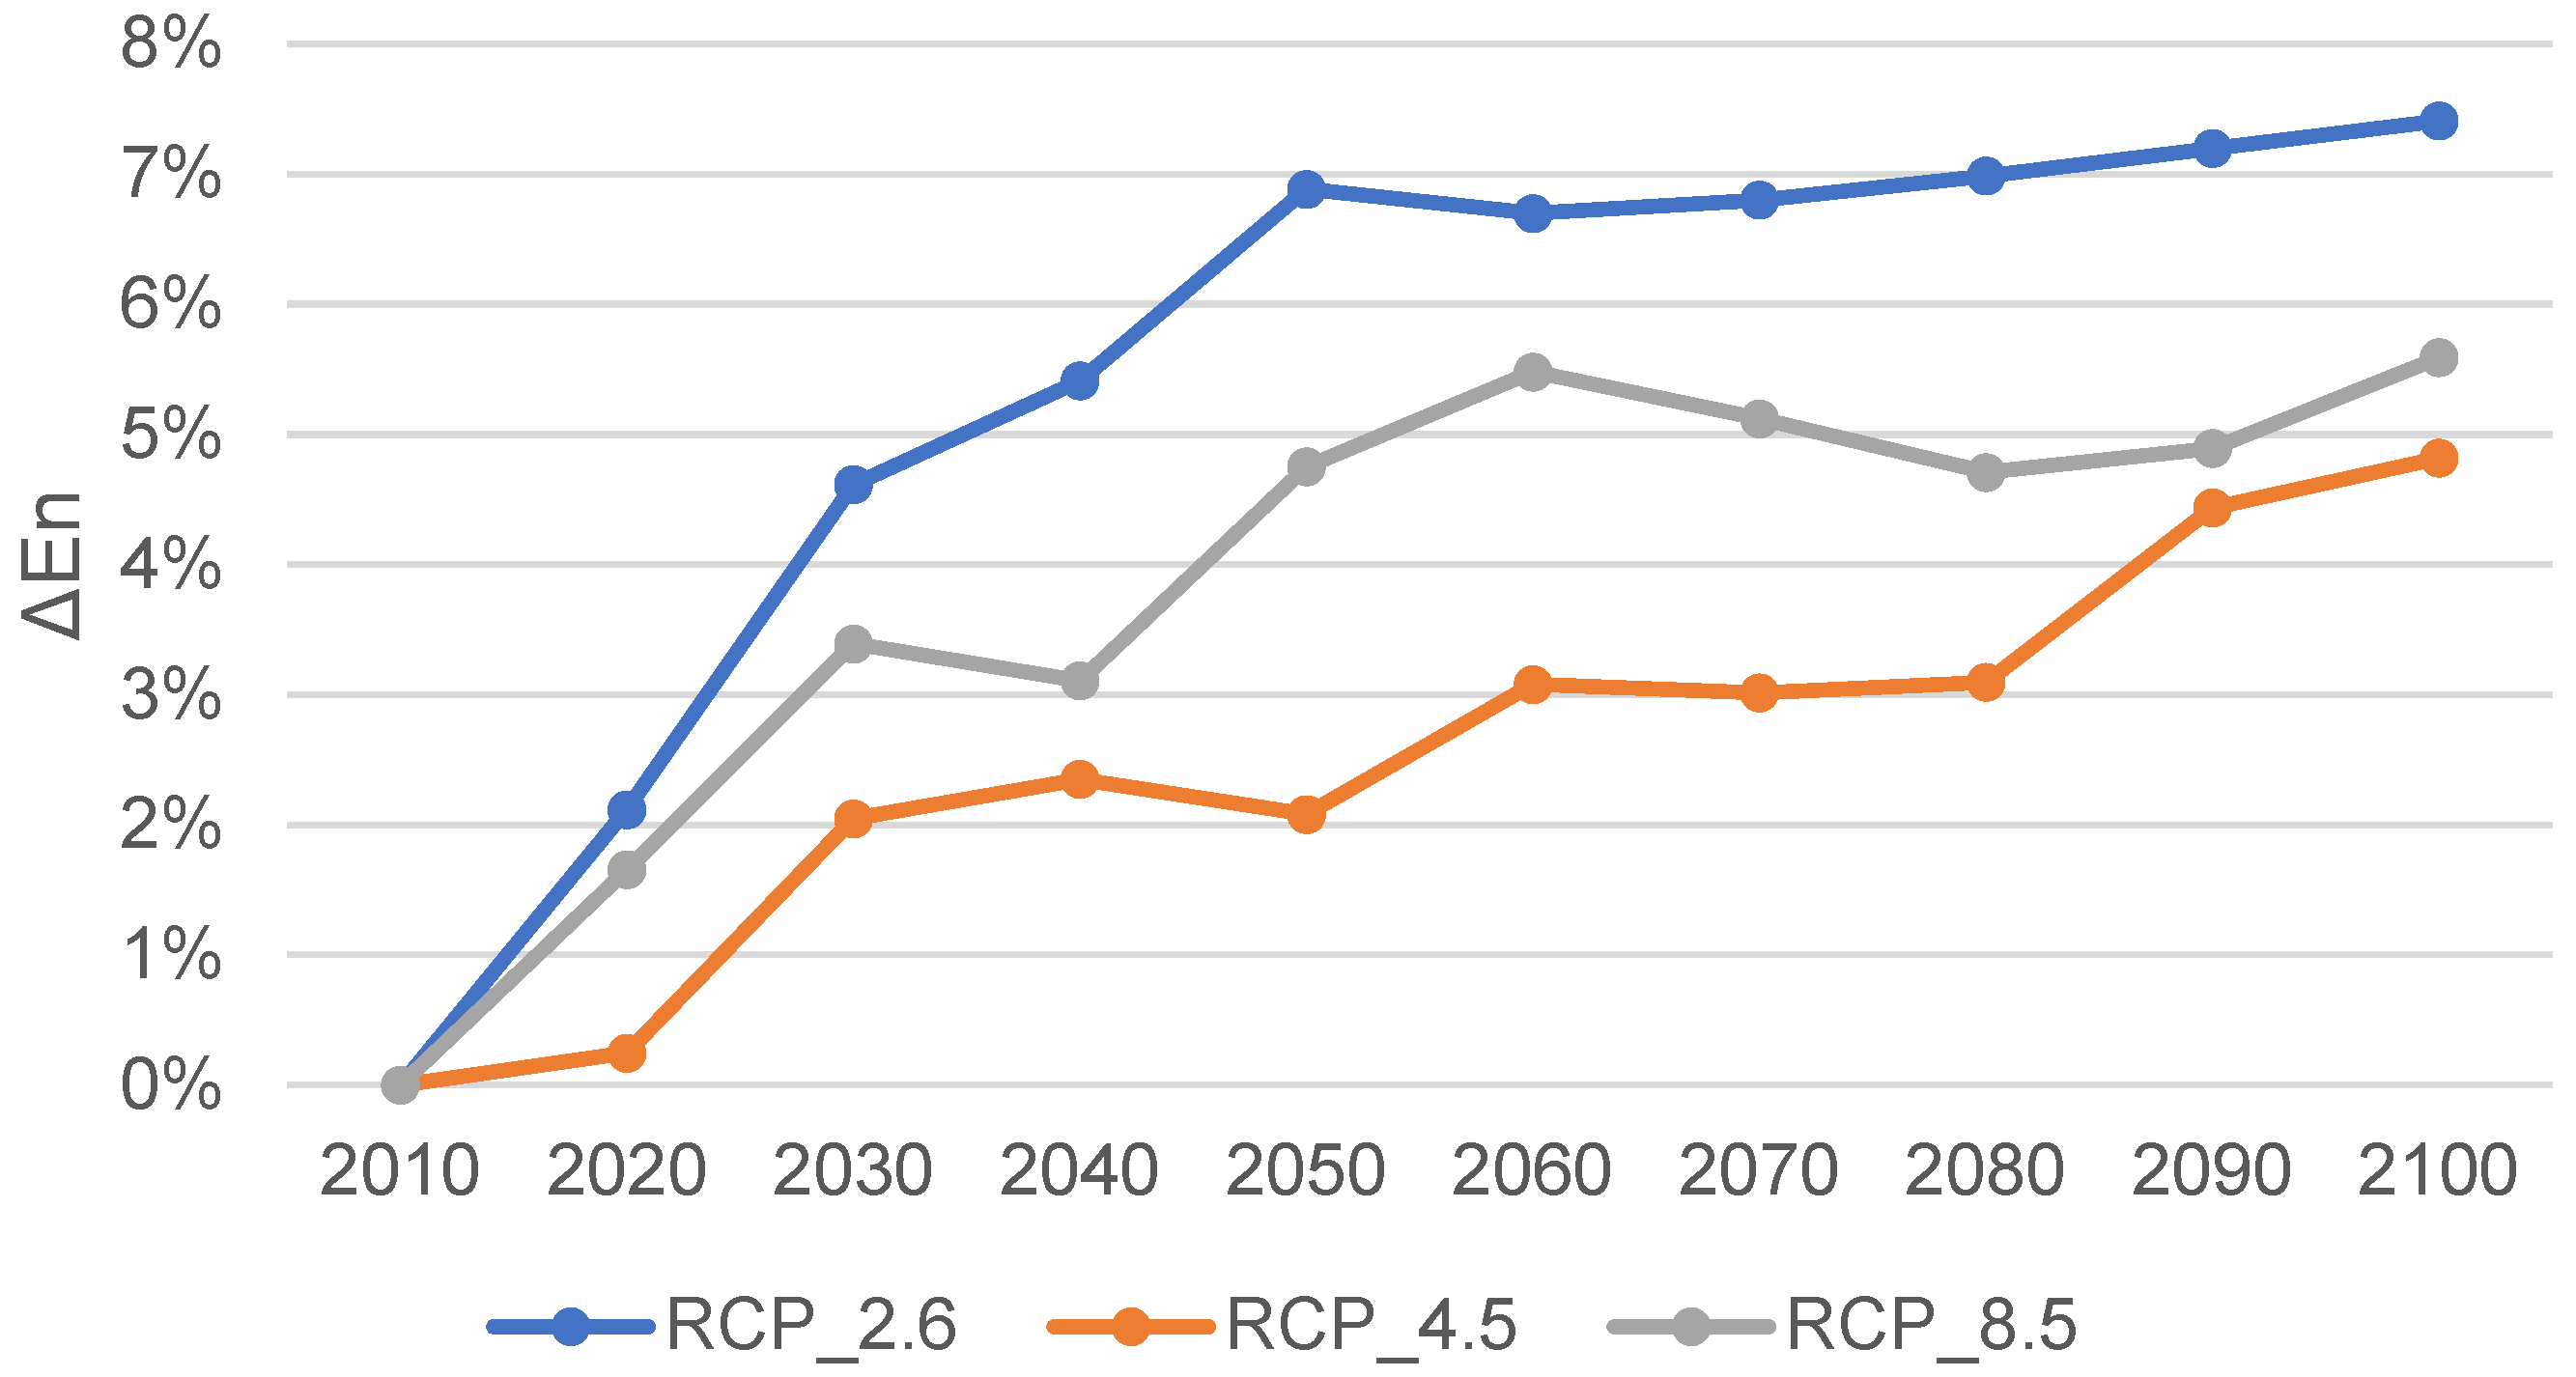
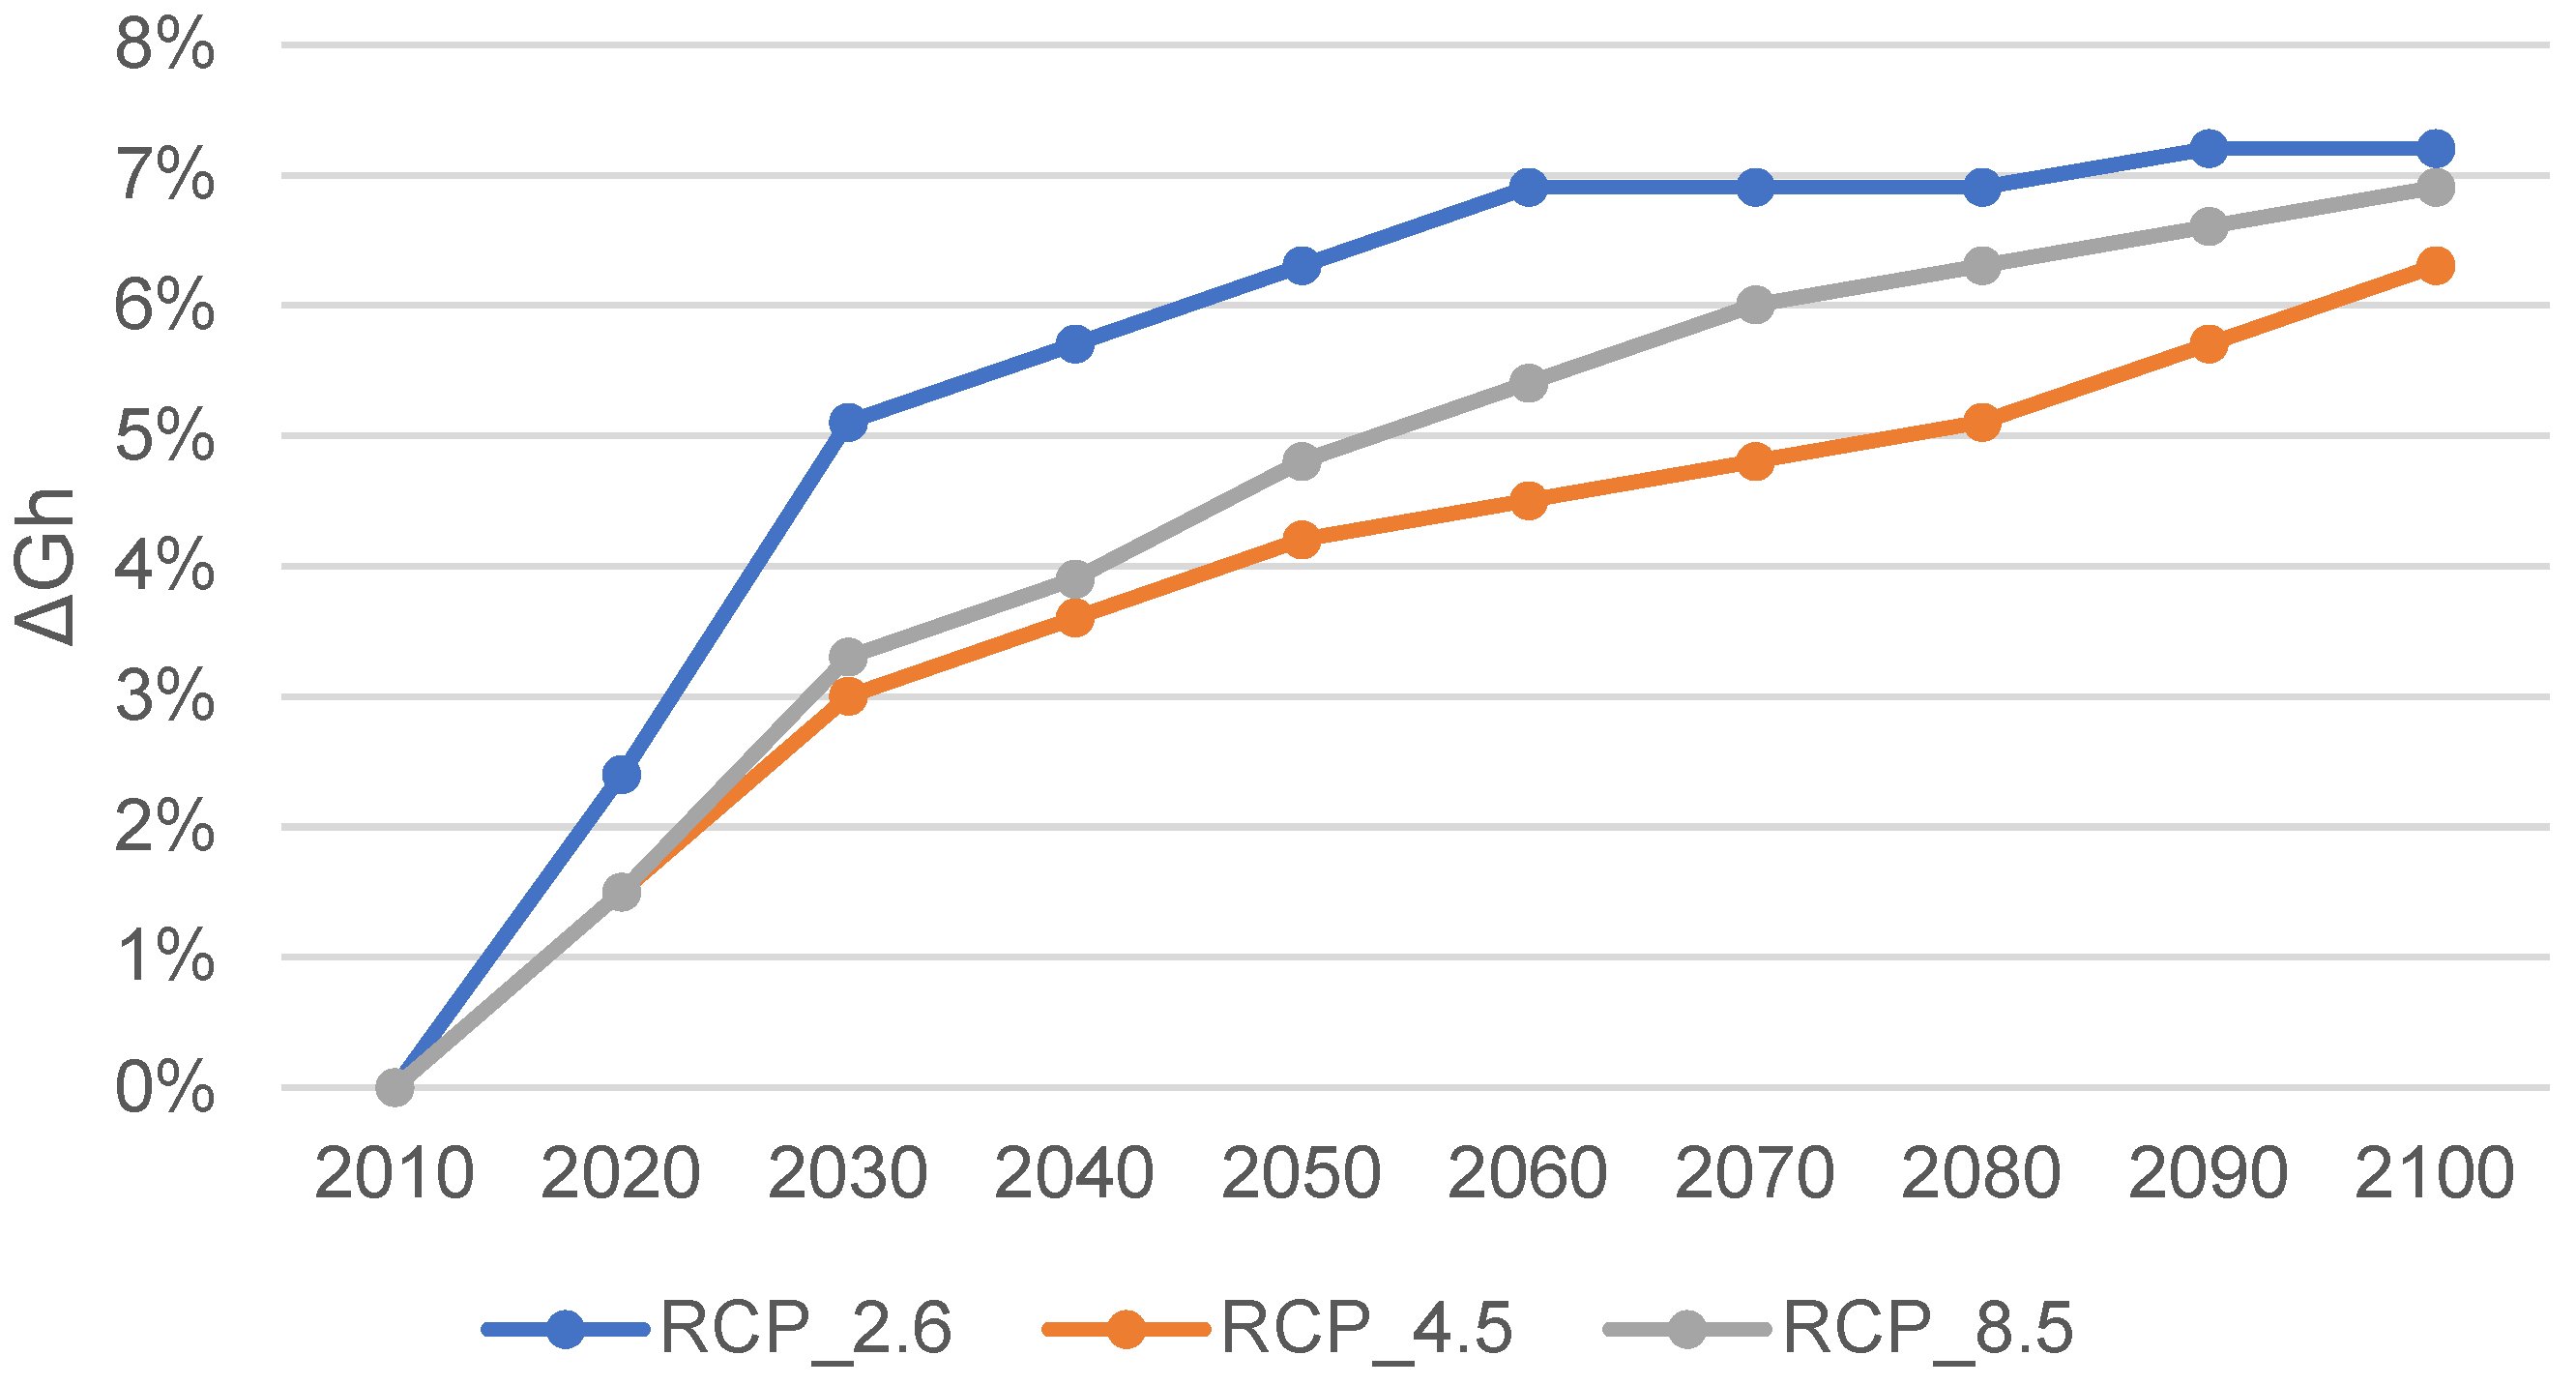
Müller et al. compared current (2007–2027) and future (2060–2080) periods for RCP 4.5 and RCP 8.5 scenarios. The region of intensive solar energy production growth is defined by approximately 55° north latitude in Western Europe and 45° northeast latitudes in Eastern Europe. Hungary is located at 47° north latitude in eastern Europe. Müller et al. put the difference between the two periods between −0.5–2% for Central Europe and between 1.5–3% for Southern Europe. In this article, for these two periods (based on Latvian averages for 2010–2030 and 2060–2080) the RCP 4.5 and RCP 8.5 yield values for Debrecen 2.3% and 3.4%, for Kecs-kemeet 2.4% and 3.8% and for Seged 2.8% and 4.4%, respectively. As a result, the gap between summer and winter production in Europe increases from the south to the north. However, winter low output does not appear with as much weight in annual output as summer changes, as a significant part of output falls during the summer period. Müller and Tsa attribute the main cause of potential changes to the changes in cloudiness [
96].
Dutta et al. also studied PV production for seasons. In their case, they looked at two periods of the century: the near future (2015–2040) and the distant future (2041–2100), based on the historical period (1981–2014). In the remote period, for spring and autumn, PV potential is predicted to increase across Europe, while for the winter period, it will indicate a decrease, which is the strongest for SSP5-8.5. Overall, the researchers estimated that the potential for solar energy will generally increase by an average of 4% to 6% in the near future. In this article, for this period and for RCP 2.6–RCP 4.5–RCP 8.5 for scenarios, 4%–1.5%–2.7% for Debrecen, 4.5%–2.6%–3% for Kecskemét and 4.6%–2.6%–3.1% for Szeged are given. In the distant future, a decrease is expected only in the RCP 8.5 scenario for the winter season and in the Northern European region. With the increasing potential of solar energy, they, like Müller et al., see a decrease in the proportion of clouds [
97].
(SSP-based scenarios are further refinements to RCP scenarios. Combined SSP-RCP scenarios are also used to prescribe global warming targets for basic SSP scenarios, using radiation compulsory levels for RCP scenarios [
98].)
Kazuataka et al. conducted their research in Fukushima Prefecture. As a base period, the 2010s were based on this article. Their climate models were based on RCP 2.6, RCP 4.5 and RCP 8.5. Although it is geographically distant from the region discussed in the article and has a different climate, however, the trends for the future show a surprising similarity. One significant difference between the two studies is that while this article focuses on simulation, Kazuatak et al. are trying to interpolate climate data to the highest possible geographic resolution. The rate of change in solar power generation compared to the base year has also been shown at the annual level. Production potential increases in most cases. In all RCP scenarios, the rate of growth will be greater over time. The 2030s, 2050s and 2070s are relatively high between the summer and winter climate model values. This behaviour is consistent with the speed of change in sunlight. In terms of the annual rate of change, growth is estimated to be approximately 1.7% in 2030 (0.3–3.6%), 3.9% in 2050 (0.5–7.0%), and 4.9% (1.5–9.6%) in 2070, indicating the trend that the further we look, the greater the growth. For the three cities combined in this article (Debrecen, Kecskemét, Szeged), the analysis of the same periods will result in an increase of 2% to 5.8% in 2030, 2.1% to 7.5% in 2050 and 3% to 7.9% in 2070 [
99].
Crook et al. forecast growth of 2–8% in Central Europe and 4–8% for Southeast Europe by 2080, with RCP 4.5-RCP 8.5 for climate scenarios. Unfortunately, it is not clear from the article which of the three settlements discussed in the article may belong to the two regions in the separation of Crook et al. In the article for this period, it was determined as 3–7%, for Debrecen 3.1–4.7%, for Kecskemét 4.0–6.6%, and for Szeged 4.7–6.9% [
100].
Overall, the results of this article support the findings that solar systems will lead to mostly yield increases in the century according to the three main climate scenarios.
7. Conclusions and Recommendations
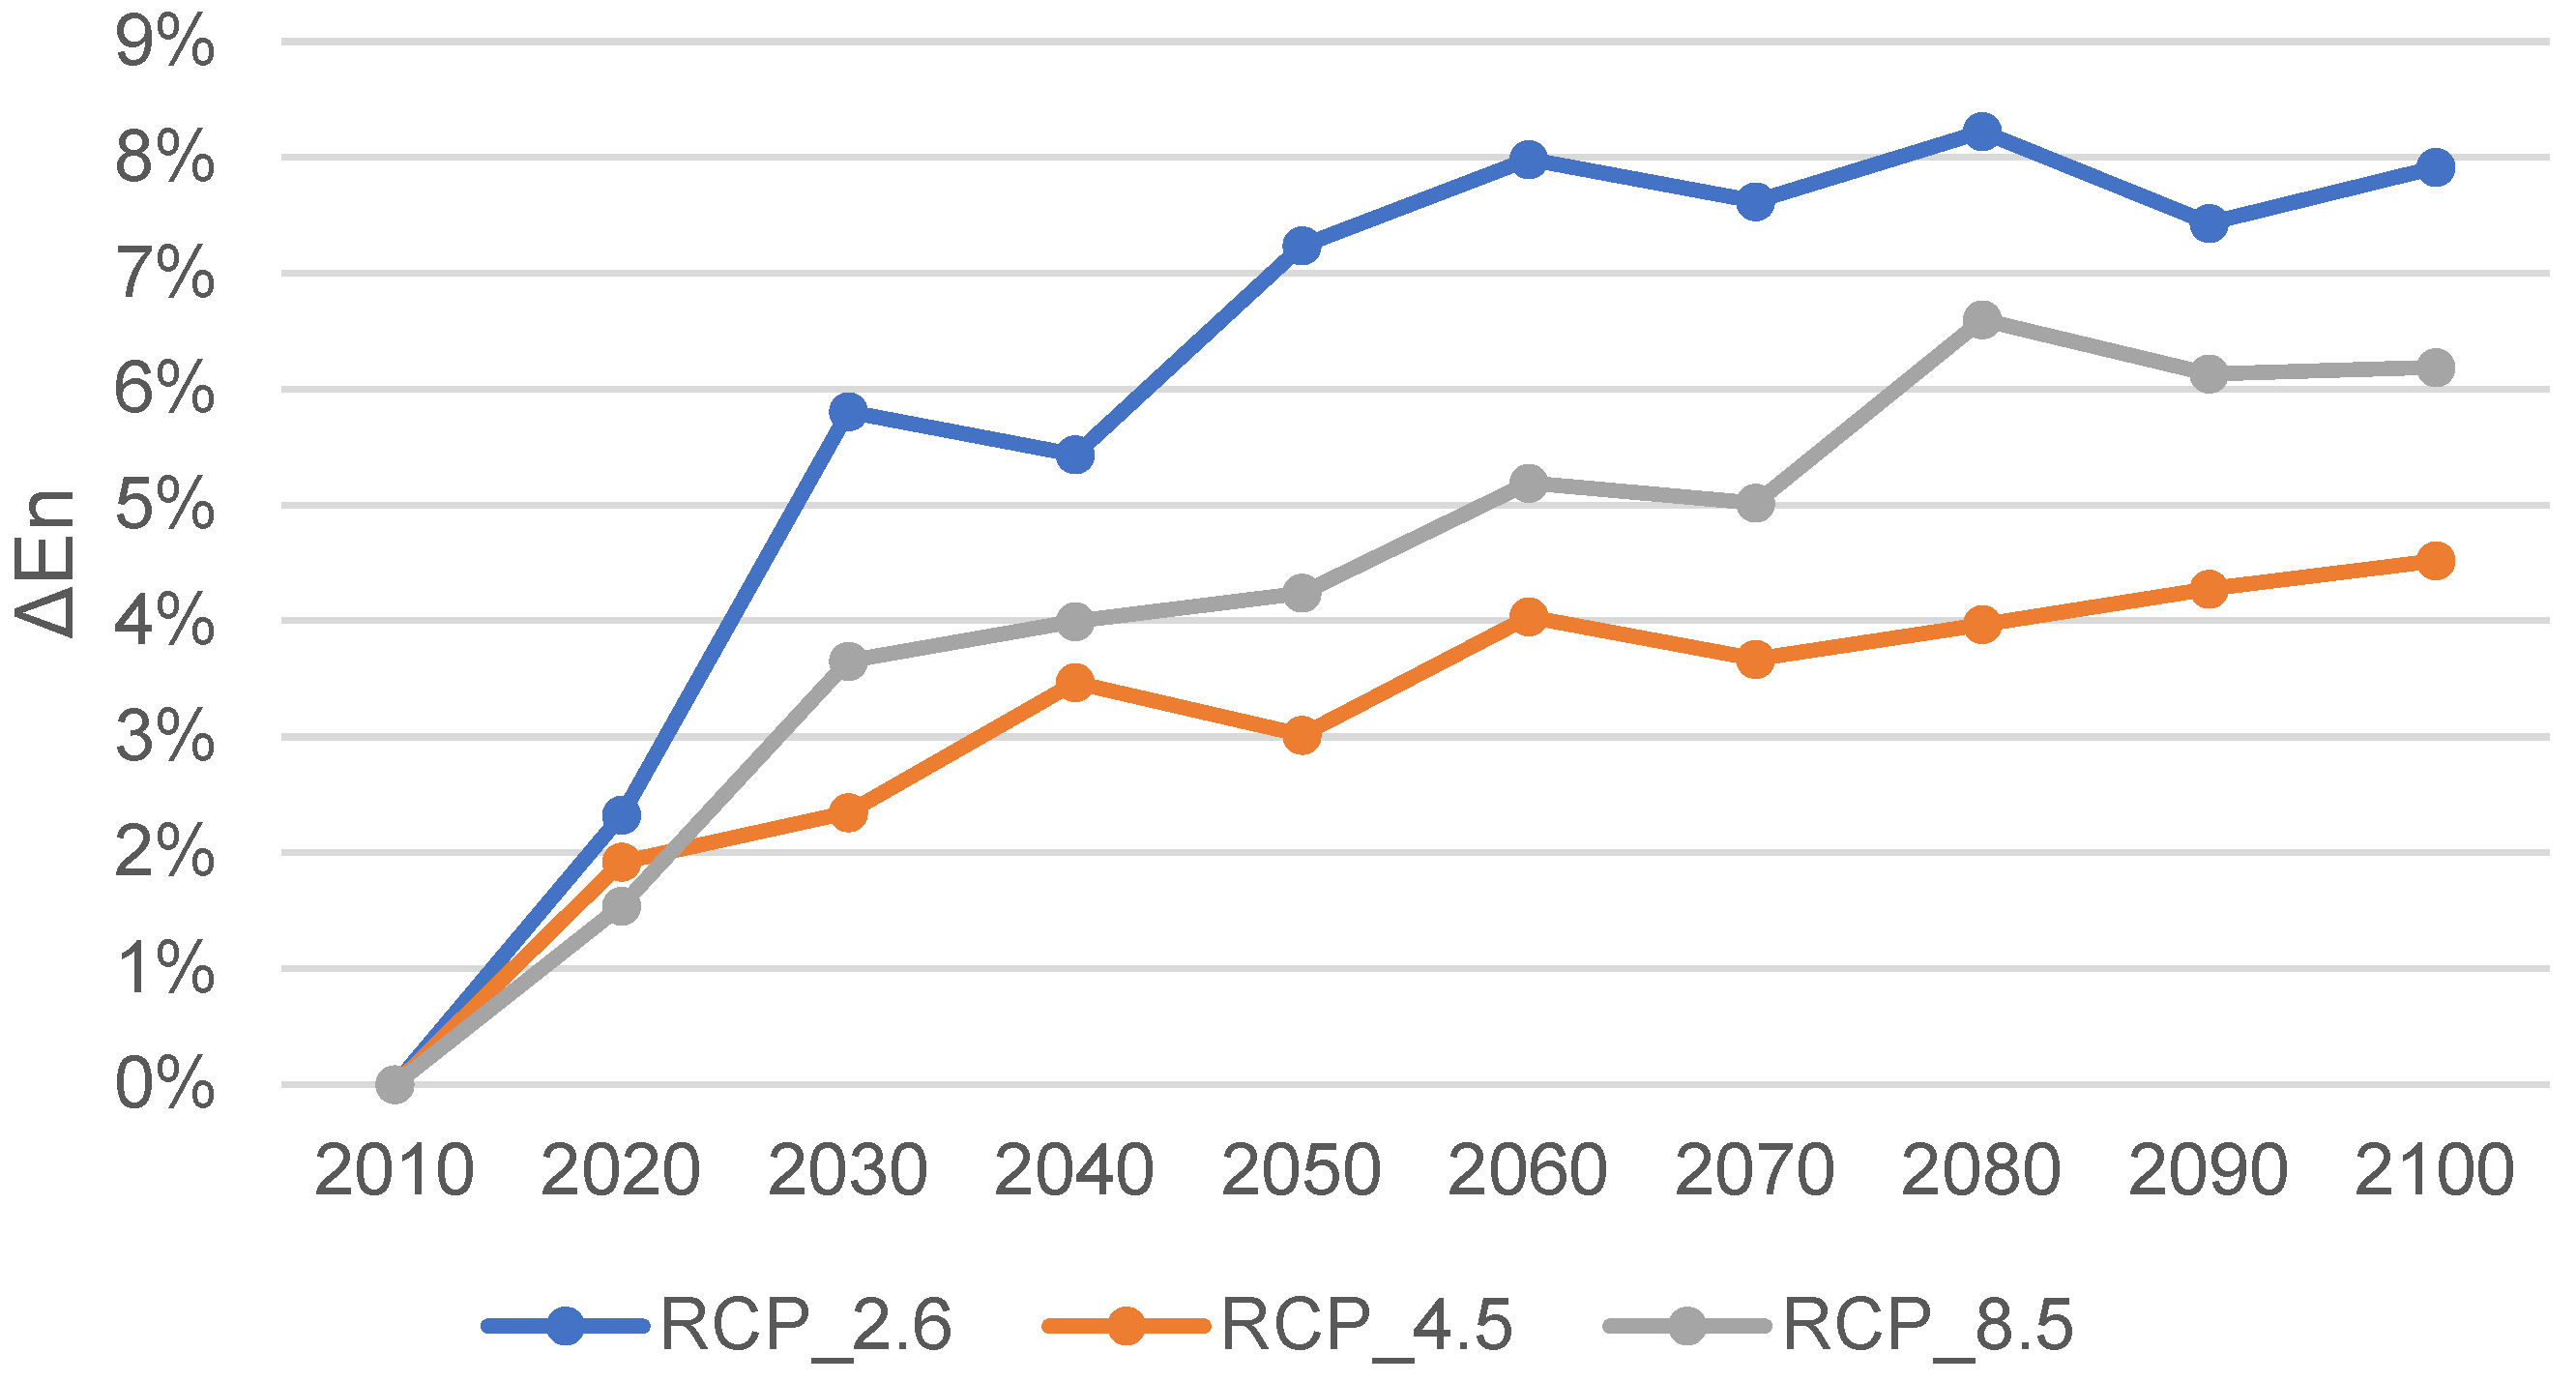
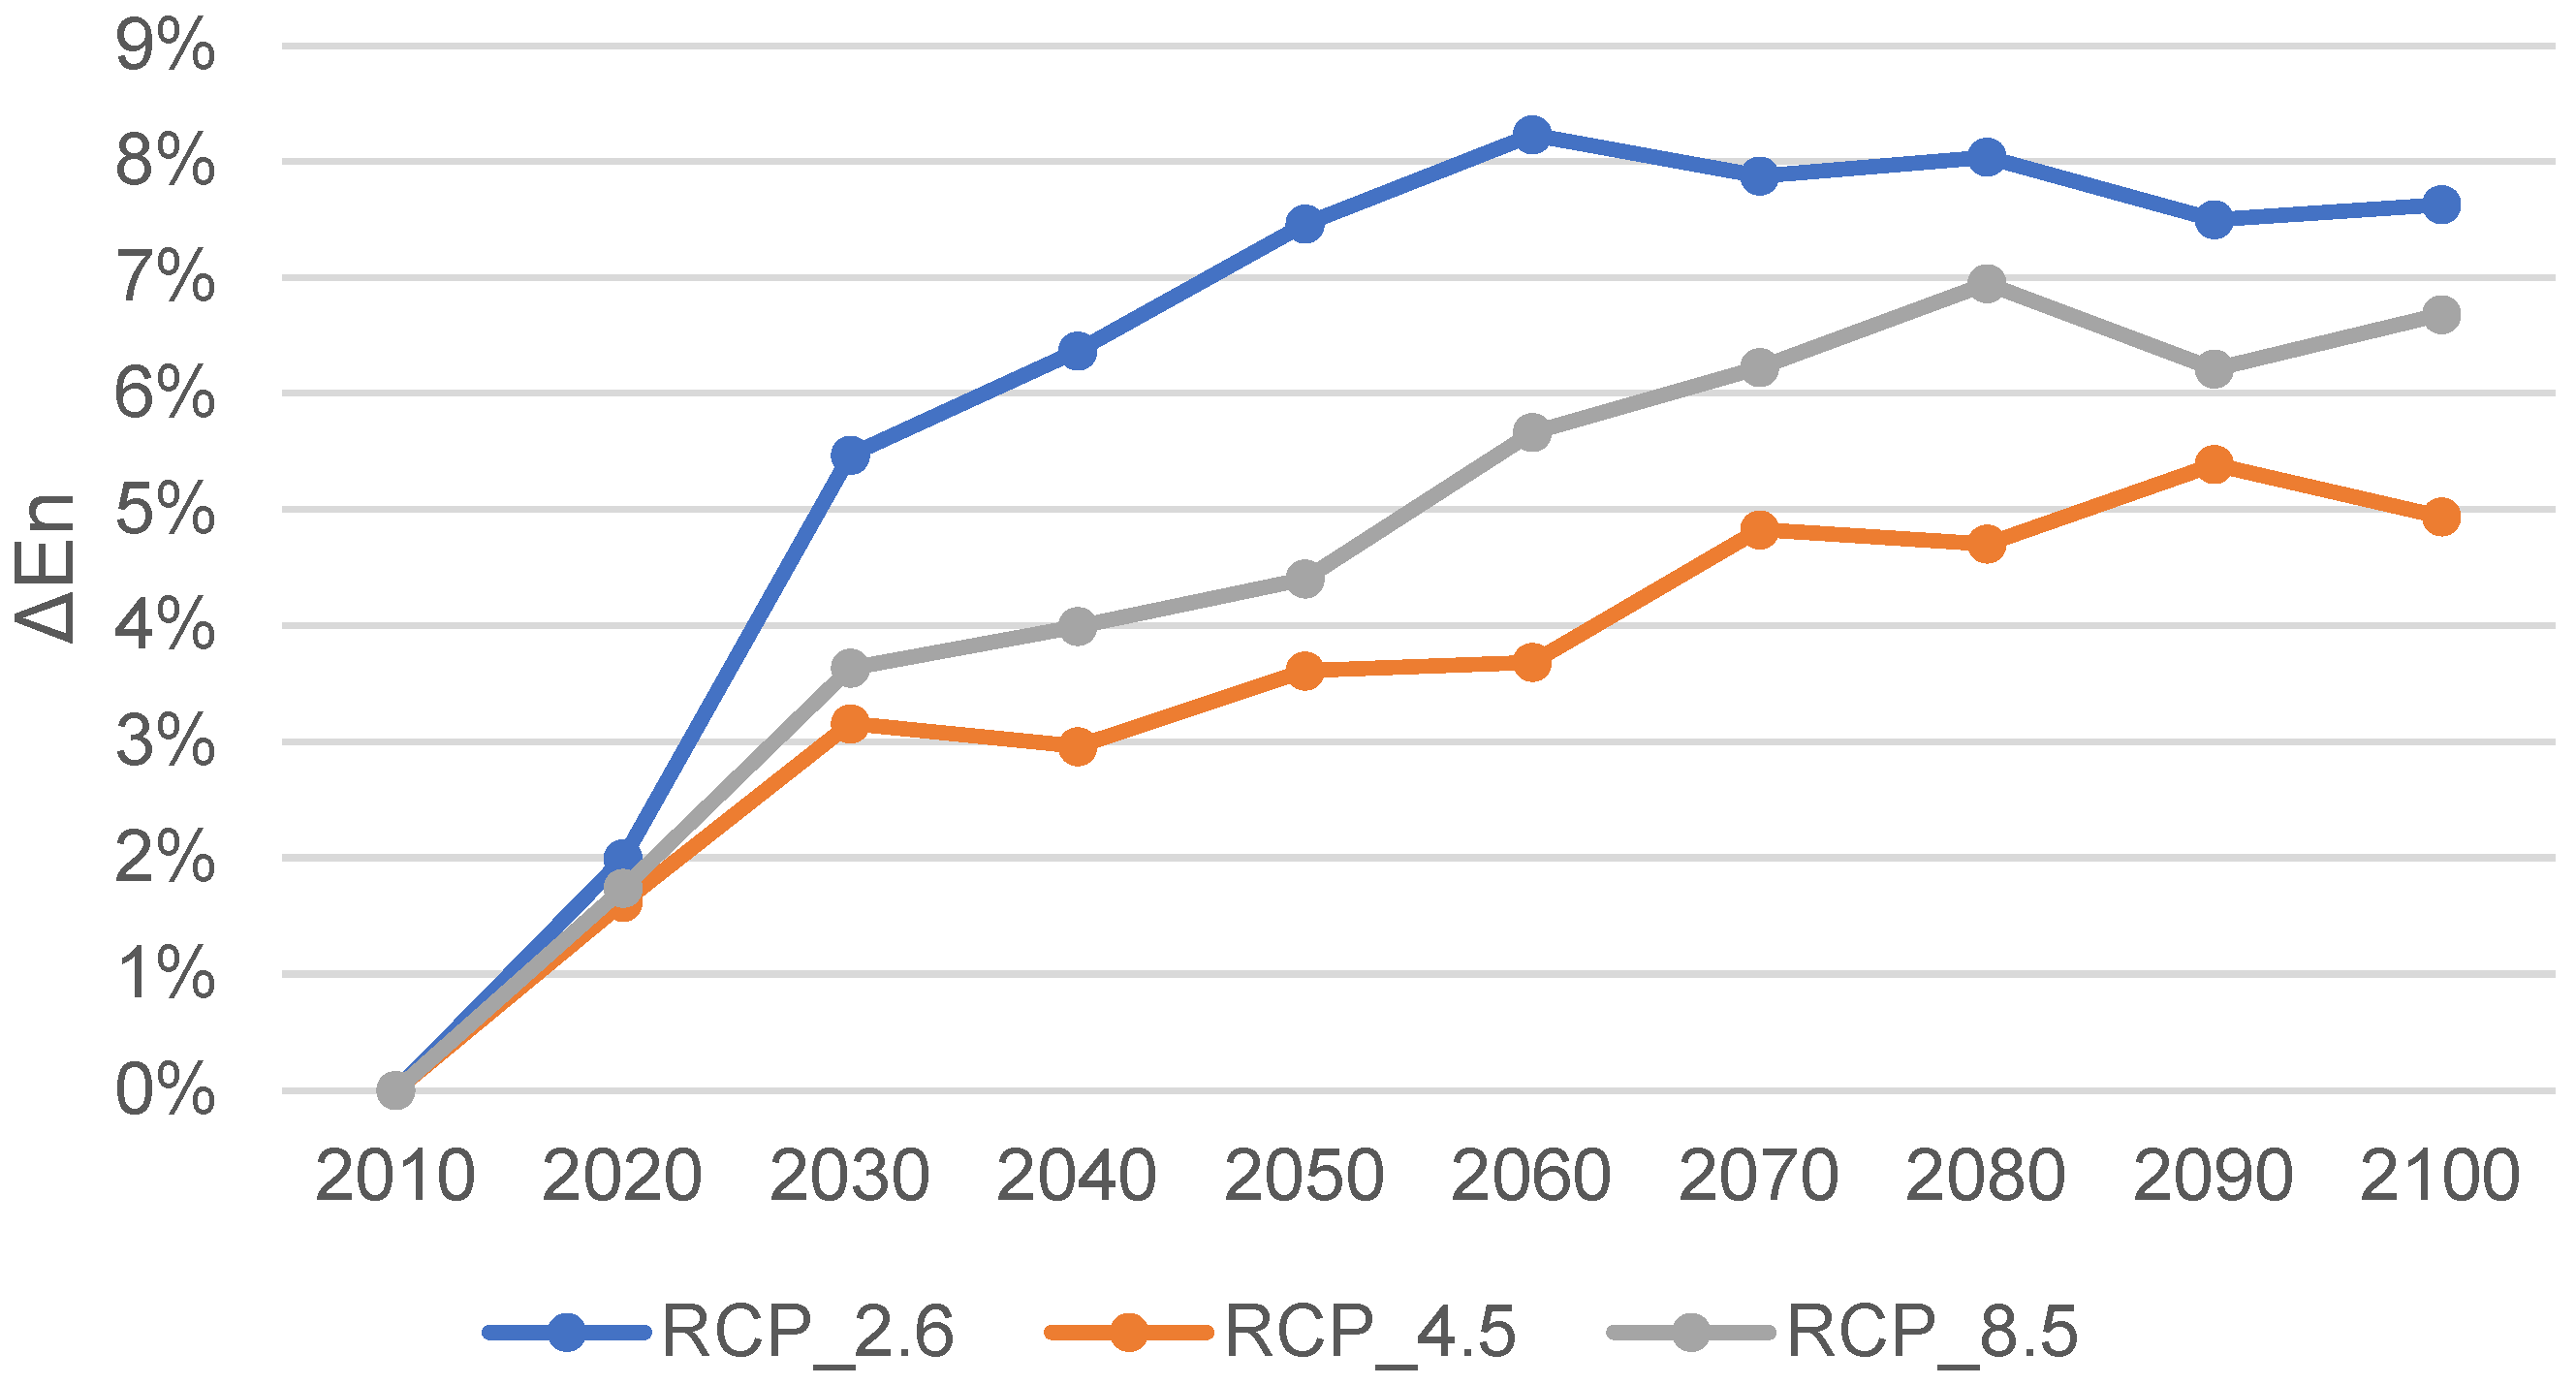
Based on the simulations, it is apparent that the yield from solar power systems will increase in the future. It can also be asserted that escalating warming will detrimentally impact the efficiency of solar power systems in electricity production. This is attributed to the semiconductor-based technology of solar systems. It can be noted that the RCP 4.5 scenario is the least favourable for production efficiency despite being less pessimistic of the two unfavourable climate scenarios—RCP 4.5 and RCP 8.5. This is because, under the RCP 8.5 scenario, the increase in radiation more effectively compensates for the efficiency loss caused by temperature increases compared to the RCP 4.5 scenario.
Future studies should address extreme weather factors associated with climate change. Simulations must be extended to examine short-term transient phenomena, which help model sudden performance drops due to cloud cover, storms, and other transient events. These steep performance decreases significantly impact the energy balance of electrical grids.
The impact of heat waves on production must also be considered. This affects the production of photovoltaic modules and the power conversion inverters. These are mostly located outdoors in the case of small power plants and are based on semiconductor technology, which makes them susceptible to high temperatures. Another important extreme weather factor is severe windstorms, which require reinforced support structures that meet stricter standards. A common consequence of storms is hail, which often causes “hotspot” defects in photovoltaic modules. According to all scenarios, the number of sunny hours increases, leading to increased UV radiation degradation of photovoltaic modules and thus shortening their lifespan.
Research is needed into new temperature-resistant materials and cooling technologies. Developing more resilient photovoltaic modules and new protective systems against extreme weather events is crucial. In the future, adaptive algorithms and forecasting technologies should be employed to manage varying solar irradiance. It is also important to research water-efficient and dry cooling and cleaning systems.
Research should be extended to joint operations with other renewables—primarily wind energy—to enhance the security and cost-effectiveness of electricity supply. All these research efforts can contribute to the more efficient and reliable operation of solar power plants in the future, making them more resilient to the impacts of climate change.
It has been about fifteen years since the widespread use of solar panels in 2010. Within the urban and suburban regions discussed in this article, numerous firms have long been equipped with moderately sized solar panels. The current timeframe is insufficient for evaluating the impact of climate change on solar-powered systems. During that period, there were years characterised by both an average yearly radiation and an average annual temperature. From this, we can create an analytical strategy that allows us to link periods with similar input points in the simulation to specific years that are considered extreme. This enables the comparison of the actual electricity production quantities with those calculated in the simulation.
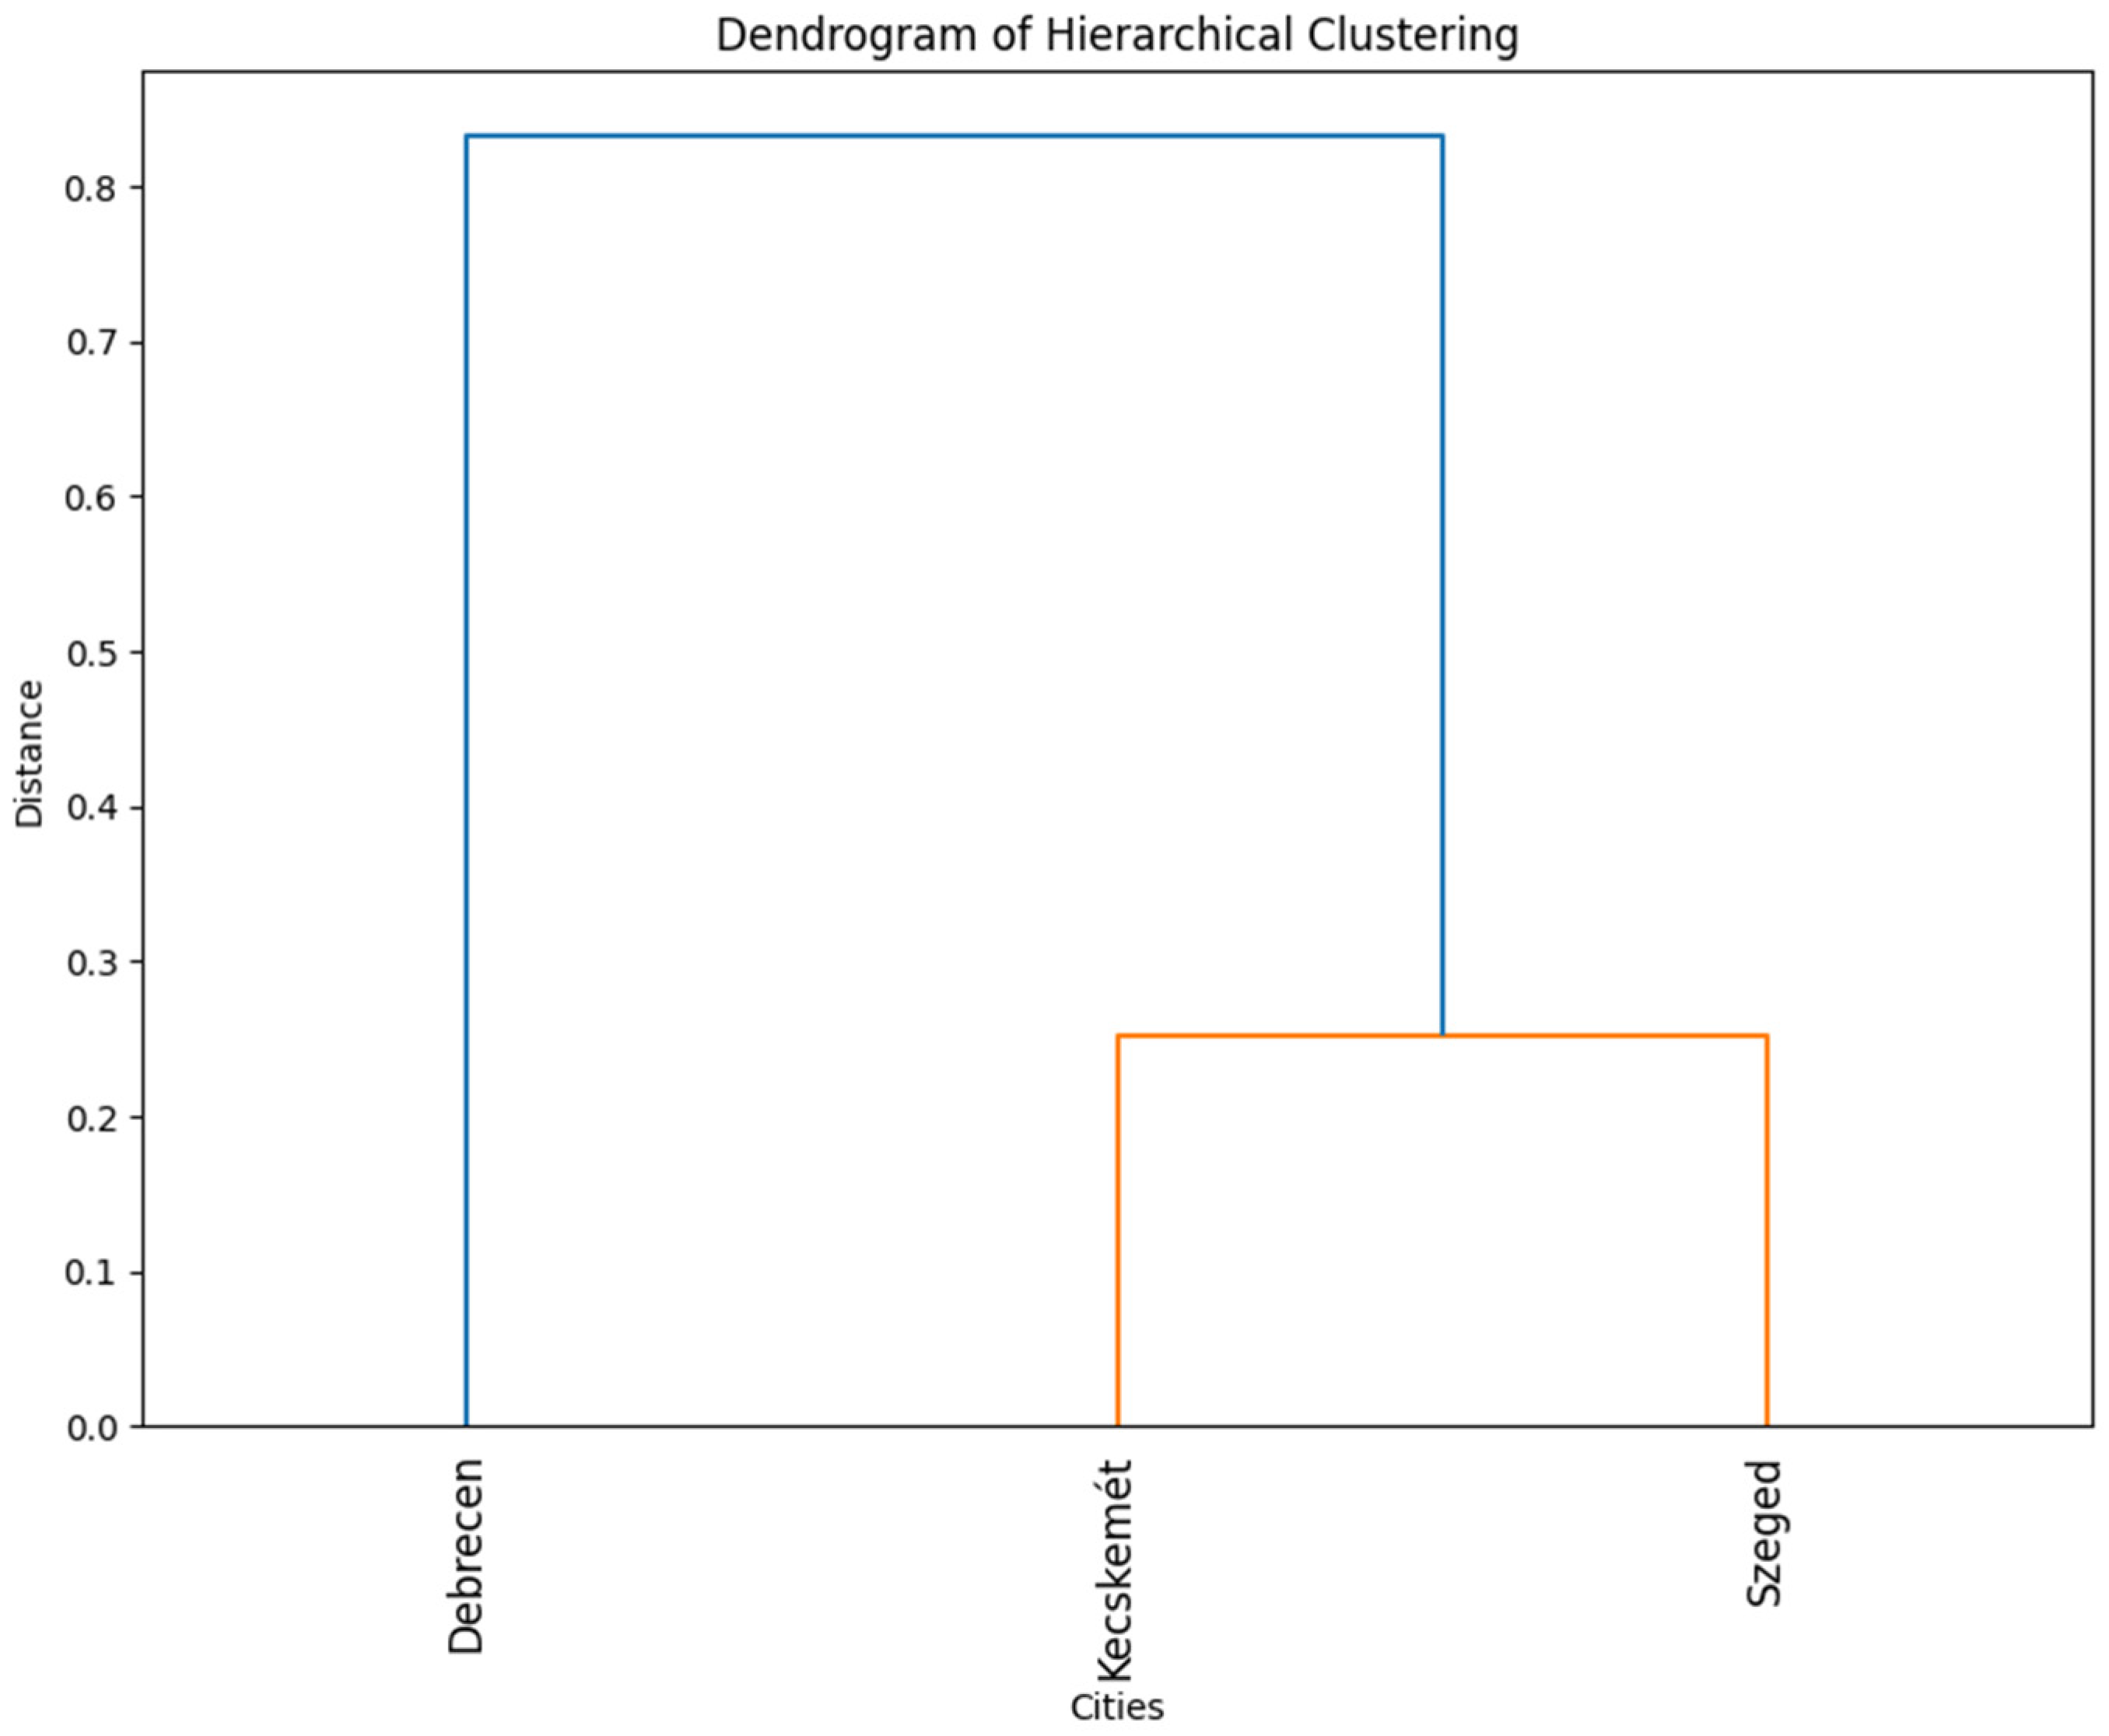
Additional investigation can be expanded to examine broader geographical areas, such as the Carpathian Basin, where the process of clustering can be used to find places that have similar capabilities in terms of current output and their potential for future growth.
This research has the potential to facilitate more extensive investigations into additional renewable energy sources that are influenced by weather and climate conditions. Wind energy, like other forms of renewable energy, is influenced by variations in wind direction and wind speed caused by temperature-sensitive semiconductor technology. Collectively, they have the ability to create portfolios that will enhance their ability to withstand the impacts of climate change.
