Abstract
One of the most affordable and readily available energy sources is solar energy. Humanity is in danger due to the lack of freshwater. Finding novel approaches to these issues that make use of solar energy has grown in popularity as a research area. The previous work presented was made to cool solar cells to increase their performance. The reverse-osmosis system is then fed by the cooling water. This study investigated the ideal conditions for cooling water fed into a reverse-osmosis system. Two identical solar cells were used for the current experiments. Water was used to cool one of the two cells. Measurements were made of the cell surface temperature, output voltage, current, and power. It was calculated to find the electrical efficiency of both cooled and uncooled cells. The cooled cell produced a maximum power of 6.75 W, according to the results. At 1:00 p.m., the gain power reached its maximum. The greatest efficiency gain, 50.2%, was observed at 4:00 p.m. Throughout the work that was presented, there was an 8% decrease in cell surface temperature. The water application value engine (WAVE) was used to simulate a reverse-osmosis system. The program’s findings demonstrated that energy consumption dropped as feed water temperature rose. The findings of a case study conducted in a real water-desalination plant were confirmed.
1. Introduction
Egypt’s renewable water supply deficit will increase from 23 billion cubic meters today to over 50 billion cubic meters by 2050, a more than twofold increase. About 59.25 billion cubic meters of freshwater are renewable annually as of 2017. A discrepancy in the balance of water resources of around 20 billion cubic meters existed between the expected virtual water of about 34 BCM and the overall projected water demand of about 114 BCM. The desalination sector can aid in Egypt’s fight against water scarcity, particularly in areas used for tourism and pleasure. Egypt currently produces roughly 680,000 m3/day of desalinated water, and in 2025, that number is projected to rise to 1,180,000 m3/day. The primary issues with desalination are its costs and the effects it has on the environment because of energy use [1]. People need new sources of energy to replace fossil fuels, which are causing remarkable damage to the environment, and simultaneously, they need to meet the increase in energy demand. Hence, researchers try to keep pace with rapid technological enhancement and rapid population growth. Several sources of new and clean energy that people can utilize, such as wind, solar and biomass energy, etc. Solar energy is considered one of the most used types of new and clean energy. The Earth annually receives solar radiation that is more than the energy consumed by people annually. If humans can use it, it can help to protect the environment, enhance the global economy, and reduce harmful fuel emissions. However, solar radiation must convert into other types of energy to allow storage, transportation, and uses. Solar thermal energy and solar photovoltaic are the two main methods of conversion of solar radiation to other types of useful energy. Solar photovoltaics have low efficiency as cells are affected by temperature.
Numerous researchers attempted to increase its efficiency by applying cooling methods. In keeping with Shafaghat et al.’s [2] research methodology, they utilized the hot water produced by the cooling cell process for the reverse-osmosis (RO) system concurrently. A reverse-osmosis desalination system with photovoltaic-thermal collectors near Shiraz is being examined for its technical, financial, and environmental performance. They found that compared to reverse-osmosis systems without pre-heating, the annual volume of freshwater increases by 5.6%. According to Armendáriz-Ontiveros et al. [3], the solar cells’ temperature was successfully lowered by roughly 6.2, 13.3, and 11.5 °C in the winter, spring, and summer, respectively, thanks to the spray cooling system. A project to construct and test a solar-powered low-pressure reverse-osmosis system (LPRO-PV) was developed by Cervantes-Rendón et al. [4] in their study. After that, the system was installed in Samalayuca, Chihuahua, Mexico, to evaluate the technology’s social impact and viability from a technical standpoint. Experimental research was carried out on a self-contained photovoltaic-powered reverse-osmosis (RO) system by Talebnejad et al. [5]. The goal was to assess the solar system’s thermal and electrical efficiency while also looking at how thermal treatment affects salty water desalination. Five different feeding temperature levels (20, 25, 30, 35, and 40 °C) were used in the study’s experiments.
Kensara et al. [6] conducted experiments on a system comprising a photovoltaic (PV) array linked to an inverter during the day and batteries during the night. The PV system was specifically engineered to accommodate the daily power demand of the high-pressure pumps, which amounts to around 13,649 kWh. The TRNSYS 17 program was used to model the system and simulate its performance throughout the year. Monjezi et al. [7] developed a model that suggests that implementing the proposed method will result in a decrease of 0.12 kWh/m3 in the specific electricity consumption rate of reverse-osmosis (RO) desalination. Additionally, it will enhance the electricity generation capacity of photovoltaic–thermal (PVT) cells, leading to a 6% decrease in the necessary surface area of solar panels. Jbari and Abderaf [8] assessed the most favorable operational parameters of a reverse-osmosis–photovoltaic (RO-PV) system to achieve maximum chlorophenol rejection while minimizing energy use. The study revealed that the most effective parameters were a feed pressure of 9.713 atm, a water recovery rate of 40%, an operational flow rate of 10−4 m3/s, and a temperature of 40 °C. Based on the above information, it can be inferred that a photovoltaic solar panel with a peak power of 280 Wp and a battery capacity of 9.22 kWh is capable of producing 1 m3 of energy every day. Kelley Dubowsky [9] used mirrors for sunlight concentration. An experimental study resulted in a 59% increase in water output.
The improved system developed by Vyas et al. [10] consisted of several components: (i) A photovoltaic array with strategically positioned and aligned north–south V-trough reflectors to increase power output. (ii) A direct contact heat exchanger installed on the back of the photovoltaic modules to actively cool them and protect the terminals from short-circuit and corrosion. (iii) The use of reverse-osmosis feed water as a heat exchange medium, with precautions taken to limit the temperature rise in the feed water. Ntavou et al. [11] conducted experiments on a reverse-osmosis (RO) system in three distinct case studies, using meteorological data specific to each location. The power input was derived from photovoltaics (PV) with a capacity ranging from 10 to 20 kW, indicating that it was feasible to integrate reverse osmosis (RO) with renewable energy sources that had significant intermittent power generation. Freire-Gormaly and Bilton [12] introduced an innovative design tool for reverse-osmosis installations driven by photovoltaics. This tool takes into account the issue of membrane fouling that occurs during intermittent operation, aiming to create systems that are more dependable and durable. The tool uses a genetic algorithm in conjunction with a simulation model consisting of a physical system model and a cost model to assess the cost of the system. Alghoul et al. [13] demonstrated that the most favorable reverse-osmosis (RO) load, membrane type, and design configuration were 600 watts, a membrane size of 400 × 4000 TW30-4040, and a two-stage system, respectively. Raval and Maiti [14] discussed a method for controlling the temperature of a solar PV panel. They proposed using direct contact heat exchange with flowing feed water to reverse osmosis (RO) from the top of the panel. This approach allows for the recovery of energy and improves the performance of the PV panel. Increasing the temperature of the reverse-osmosis (RO) process led to enhanced flow performance of the membrane.
Due to water scarcity, scientists attempted to boost the distilled system’s water productivity. The RO system was one of the most popular systems because it is chemical-free and compact and consumes less energy than other systems. Based on that, several methods were applied to raise the RO units’ productivity. In a study by Shigidi et al. [15], samples were subjected to progressively higher working pressures of 10, 30, and 45 bar and varying flow rates of 2.2, 3.4, and 4.5 L/min at 25, 35, 45, and 55 °C. It was found that increasing the feed’s temperature from 25 to 55 °C significantly increased the permeate flow; it exceeded the initial value by 300 times in the study conducted by Altmann et al. [16]. Even after just 7 days, a seawater reverse-osmosis (SWRO) system operating at 40 °C in its feed water would permanently lose performance, as evidenced by a notable 7.5% increase in specific energy consumption. Using the ROSA program, Shaaban and Yahya [17] examined a total of seven different membrane components. The simulated results produced by the ROSA program were cross-checked against the experimental data. Hawari et al. [18] found that increasing the temperature from 20 to 26 °C and the flow rate from 1.2 to 3.2 L/min resulted in a significant 93.3% increase in the membrane flux. Farhat et al. [19] examined the growth of a biofilm at various water temperatures (10, 20, and 30 °C) using a membrane fouling simulator (MFS) flow cell. Kotb et al. [20] investigated the impact of feed parameters, operation circumstances, and membrane dimensions on the concentration at the membrane wall. Jawor and Hoek [21] investigated the impact of product water recovery and feed water temperature on flux, rejection, and inorganic fouling caused by the development of gypsum scale in simulated brackish water. Additionally, a reverse-osmosis water-desalination model, based on the porous membrane software program Water Application Value Engine (WAVE), was employed to study the effects of temperature on feed pressure, energy consumption, and permeate salinity. This analysis examined the performance of the film Tec sweater membrane model (SW30HRLE-400, DuPont WaterSolutions, Jubail, Saudi Arabia) and how permeate salinity, feed pressure, and energy consumption were affected by feed water temperature. The RO system performance was simulated using WAVE software version 1.81 [22].
According to the review provided above, not much information was provided regarding the combined solar cell and reverse-osmosis system. More experiments are needed to determine how well solar cells perform when cooling water is used. The main idea of this study is to feed the reverse-osmosis system with cooling water. The goal of this study is to concentrate on electrical energy production and electrical efficiency for both cooled and uncooled solar cells. An important area of work is assessing the performance of cells in Cairo’s weather. It is necessary to demonstrate how many liters of freshwater can be produced with a cooling solar cell system by applying the lab study at the level of the entire big station. This study aims to predict the pressure, TDS, and specific power required in an RO system by feeding data from lab work into a simulation program. In short, this study focuses on assembling data from a lab study on solar cell cooling and feeding cooling water to an RO system, where a simulation study was conducted. The results are then applied to a complete station to demonstrate the real effect. Consequently, this work affects the production of distilled water as well as clean electrical energy. Companies and the general public benefit from this work by investing more in the production of clean energy and overcoming water shortages.
2. Experimental Procedures
The system consists of two identical PV cells to facilitate a clear comparison. The type of cell is mono-crystalline. The nominal power of each cell is 10 watts, while its dimension is 345 × 255 × 18 mm3. One of the solar cells is cooled using water, while the other is not cooled. The saltwater comes from a well using a feed pump. Then, that water is used to cool down the solar cell. Heat is transferred from the solar cell to salt water. The membranes remove the salt from the water to produce freshwater. Two solenoid valves that regulate the water flow prior to and subsequent to the solar cell make up the cooling system. The temperature of the water determines when the solenoid valves open and close. Water is transferred from the tank to a duct located at the base of the solar cell via a pipe that has a solenoid valve in it. Through a pipe, the cooling water is transferred to a different tank where the other solenoid valve is located. The RO system receives its supply of cooling water from the other tank. Since the solenoid valve opens and closes at a predetermined temperature that varies throughout the day due to variations in solar radiation, the water flow rate is not controlled; however, the amount of water cooling collected during the work is determined. The duct dimension will be discussed in the application results on the desalination plant part. Figure 1 shows the main components of the used system. Figure 2 is the real photo of the test rig. The technical specification of the photovoltaic module is listed in Table 1. The measurement is given through an automatic system. The solar radiation is given using a digital solar power meter. Multimeters are used to display volt and current values. The output current and voltage of each cell are measured with a multimeter using a variable-load resistor circuit. The temperature was given through thermocouple points recorded by an interface using a laptop. Measurements were taken every 30 min. To record the temperatures, the thermocouples were connected to a PICO TC-08 (PICO Technology Limited, a business registered in St. Neots, UK and Wales) thermocouple data recorder with a temperature precision of 0.5 °C. The PV module current and voltage, which are measured by a variable-load circuit made up of an 80-variable resistance and two digital multimeters, are used to compute the power output of the cells. One of the two multimeters monitors the output current while the other monitors the DC output voltage. In order to monitor normal incidence solar radiation, a TES-1333R (Taiwan-based Tenmars TM-206 manufactures, Taipei, Taiwan) solar power meter that records data with an accuracy of 10 W/m2 is positioned perpendicular to the PV modules. The GT8907 (Shenzhen Jumaoyuan Science And Technology Co., Ltd., Shenzhen, China) Professional Electronic Anemometer monitors wind speed with a precision of 3% and ambient temperature with an accuracy of 0.5 °C. The main source of error in this study is the accuracy of the measurement, as thermocouple data were recorded with a 0.5 °C temperature precision, the solar power meter recorded data with an accuracy of 10 W/m2, and the electronic anemometer measured ambient temperature with an accuracy of 0.5 °C and wind speed with a precision of 3%.
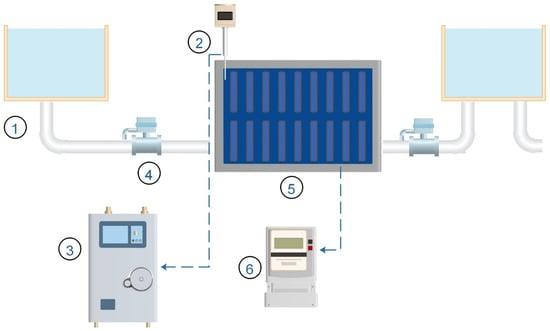
Figure 1.
Test system components: 1—tank, 2—thermocouples, 3—data logger, 4—selinode valve, 5—solar cells with water duct, and 6—multimeter.
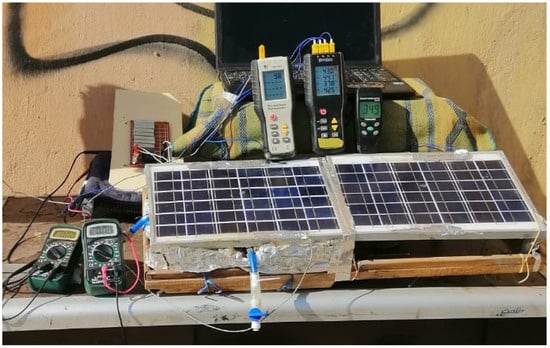
Figure 2.
Real photo of the tested system.

Table 1.
Solar cell technical data.
The thermal efficiency and electrical efficiency of solar cells were calculated. The equations used in this study are as follows [23]:
The total power input from sun radiation to the PV cell was calculated by
The maximum output electricity was calculated by
The electrical efficiency of the PV module was calculated by
where is the electrical efficiency and Pin is the input power to the module
The percentage of power increase was calculated by
3. Uncertainty Analysis
For the current investigation, uncertainty analysis is used to assess how accurate the measurements are. The variables being measured are solar radiation, voltage, and electrical current. Solar radiation meter has an accuracy of 2%. The following equation can be used to calculate the uncertainty of the work with the Holman equation [24].
where is the uncertainty of the parameter X, is the uncertainty of the parameter , and is the partial derivative of X concerning x1.
The uncertainty of measurement for total power input is given in Equation (6). Equation (7) was used to calculate the uncertainty for the maximum output electricity. The uncertainty value for input power was 1.4%, while it was 1.1% for maximum power. The uncertainty for electrical efficiency is 2.5% when the Holman equation is applied to energy Equations (1) through (3) and measurement parameter and device errors are considered. These values are suitable for solar energy applications.
4. Physical Model
Figure 3 provides a thorough description of the RO system under investigation that was used in this study. The system is made up of 48 seawater membrane elements of SW30HRLE-400, DuPont WaterSolutions, Jubail, Saudi Arabia. Six membranes are installed in each of the eight pressure vessels. These are integrated seawater RO membranes with extraordinary water quality. They offer an industry-leading 99.65% salt rejection rate and 20% more flow than membranes made using traditional methods. Additionally, (SW30HRLE-400, DuPont WaterSolutions, Jubail, Saudi Arabia) membranes provide strong rejection while requiring little energy, resulting in lower overall costs for seawater systems that operate with constant-salinity saltwater. Table 2 is a list of the precise measurements and specifications of (SW30HRLE-400, DuPont WaterSolutions, Jubail, Saudi Arabia) membranes. The RO system feed water salinity is 20,000 ppm, and the studied temperatures of feed water are 20, 22, 24, 26, 28, 30, 32, 34, 36, 38, and 40 degrees Celsius.

Figure 3.
RO unit flow diagram.

Table 2.
SW30HRLE-400 membrane specifications.
5. RO Desalination Plant
The well’s depth is 210 m. the salinity is 20,000 ppm. The temperature is 22 °C. It uses UPVC pipes to move the water. The diameter of the pipes is 110 mm, which is nearly 4 in. The water pressure in the pipes is 10 bar. The volume flow rate of the fluid is between 1.5 and 3 m3/s. Two types of filters are used: a multimedia filter and a cartage filter. The multimedia filter is used to separate sand from water. Its diameter is 2.8 m. The flow rate through it is 90 m3/h. It can remove impurities up to 50 microns. The other filter is a cartage filter, which is a cotton filter with a diameter of 8 inches and a flow rate of 90 m3/h. It can remove impurities as small as 5 microns. The plant contains three types of pumps: well pumps, feed pumps, and high-pressure pumps. All pumps are made of stainless steel 316. The flow rate and pressure of the well pump are 50 m3/h and 14 bar, respectively. The feed pumps are used to fill 20-ton tanks as they have a flow rate of 90 m3/h and a pressure of 5 bar. The pressure pump has a head of 50 bars and works with a flow rate of 100 m3/h to feed eight vessels, each of which feeds six membranes. Each membrane works with 8 to 12 m3 of water. After the desalination process, the distilled water uses an 8 bar 64 m3/h pump to fill a lake. Several valves are utilized to control the system. Film etic sea water made of polymer is the membrane type in the plant. It can work between 15 and 35 °C. The freshwater is transported to a 20,000 m3 lake, which needs around 30 days to fill completely. Solar cells are the source of energy. The number of solar panels is 552 panels, each producing 540 W. All panels are mono-crystalline type. The dimensions of the panel are 2274 × 1134 × 35 mm3. The working temperature is 45 ± 2 °C. The maximum system voltage is 1000/1500 VDC. Panels are installed on aluminum chassis with an angle of 26°. The cost of the plant is around USD 215,000. Figure 4 shows the main components of the RO desalination plant.
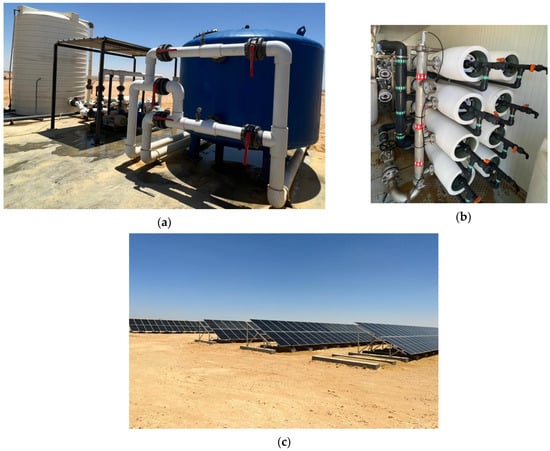
Figure 4.
Main components of RO desalination plant: (a) tanks and pumps, (b) membranes, and (c) solar cells.
6. Validation of Software
By comparing the projected findings with the existing data in the literature for the same system geometry, boundary conditions, and material parameters, preliminary tests were carried out to validate the LG Chem program (Q+ projection software v2.4). Before continuing, such comparisons thoroughly assess the dependability and accuracy of the used software. As demonstrated in Figure 5, the results of the LG Chem program (Q+ projection software v2.4) verification were compared with the comparable results of [25], as shown in Figure 5. They used the LG software (South Korean company LG Water Solutions, a division of LG Chem, Seoul, Republic of Korea) and the modeling tool MATLAB R2018b to investigate the performance of an RO train with a 10,000 m3/d capacity made up of 120 pressure vessels and 7 membrane elements per pressure vessel. Figure 5 illustrates a good agreement between the presented predicted data and those numerically given in [25].
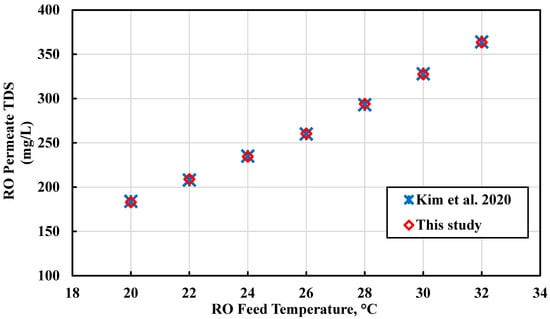
Figure 5.
Validation results between this study and Kim et al. [25].
7. Results
In this part, the outcome results are shown. Solar conditions are found during the daytime. The electrical power and electrical efficiencies for both cooled and uncooled cells are illustrated. The cells’ surface temperatures are measured to study the effect of cooling. The simulated reverse-osmosis system results are given for different inlet water temperatures.
7.1. Solar Radiation
The main source of energy used in this study is solar energy. Hence, readings for solar radiation were performed from 10 a.m. to 4 p.m. (16:00), and readings were taken every 30 min. The measurements are made using a digital solar power meter. Figure 6 shows the solar radiation values during the day. Solar radiation was recorded in May 2023. The tested system is located in Cairo, Egypt, where the latitude and longitude are 30.0444° N and 31.2357° E, respectively. Solar radiation started at 404 W/m2. The solar radiation increased gradually to reach the maximum value of 795 W/m2 at 13:00. Then, the solar radiation reduced gradually to 536 W/m2.
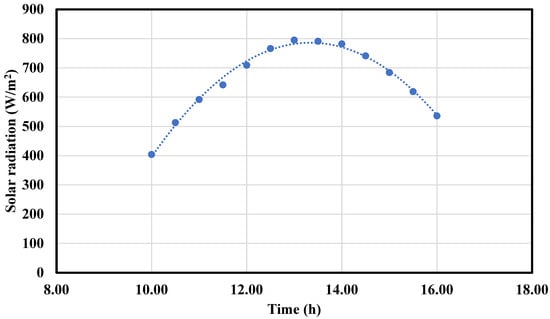
Figure 6.
Solar radiation throughout the day.
7.2. Electrical Power Output
The main aim of using solar cells is to generate electricity. The electrical power is calculated based on Equation (2). In Equation (2), output voltage and output current are the basis for calculating power. The output voltage and output current are measured using a digital multimeter. There was a variable-load resistor circuit used to obtain different values of power. The maximum power was expressed in this study. Electrical power for both cases of cooled and uncooled solar cells is shown in Figure 7. Electrical power is given throughout the day every 30 min for uncooled solar cells; the electrical power increased from 3.14 W at 10:00 a.m. to 4.82 W at 1:00 p.m. However, the power decreased after that to 2.91 W at 4:00 p.m. The cooled cell produces 4.76 W of electrical power at 10:00 a.m. The maximum electrical power gain was 6.75 W at 1:00 p.m. That value declined to 4.38 W at 4:00 p.m.
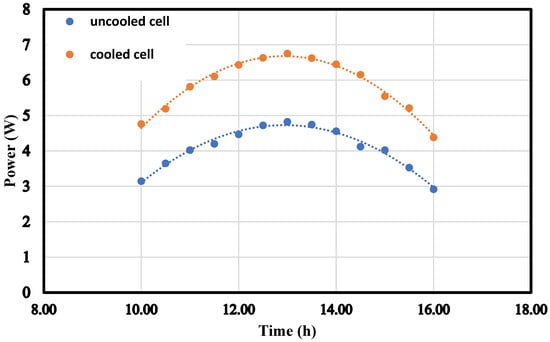
Figure 7.
Electrical power output for cooled and uncooled solar cells throughout the day.
It was found that the solar cell’s electrical power was lowest at 10:00 a.m. due to the low solar radiation at that time. As solar radiation increases, electrical energy production rises, reaching its maximum at 1:00 p.m. when radiation is at its highest. Then, the power generated dropped as the solar radiation fell. On the other hand, cooled cells generate more electricity compared to uncooled cells. Whenever a comparison is made between cooled and uncooled cells, the cooled cell has higher energy production. That is because the cooled cell relates to a water box where low water temperature is found. That water is used to cool down the cell. Hence, with lower temperatures, cells produce more electrical power.
7.3. Electrical Efficiency
Electrical efficiency is the ratio of the electrical power generated by the solar cells to the available solar energy incident on the cells. The incident energy on a solar cell is the multiplication of solar radiation that comes from the sun at a certain time perpendicular to the wet area of the cell. The two cells used in this study have the same wet area of 0.2 × 0.3 m2. The electrical power input from sun radiation is given by Equation (1), while the electrical efficiency of solar PV cells is given by Equation (3). The electrical efficiencies of the solar PV cells for both cooled and uncooled solar cells throughout the day are shown in Figure 8. The efficiency of the uncooled cell is 12.97% at 10:00 am. The efficiency decreased gradually during the day to 9.07% at 4:00 p.m. For the cooled solar cell, the maximum efficiency is 19.46%, while the minimum efficiency is 13.26% at 4:00 p.m.
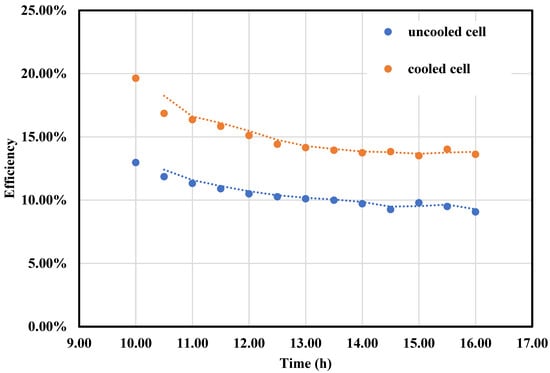
Figure 8.
Electrical efficiencies of solar PV cells for cooled and uncooled solar cells throughout the day.
For all studied cases, it was found that the maximum electrical efficiency was at the beginning of taking the measurements. Then, the efficiency slightly decreased as the time moved. The lowest values were reached at the end of the measured day. These trends can be explained by the fact that in the morning, solar radiation is low, and the cell temperature is still cool, so the electrical power generation is relatively sufficient to produce the highest efficiency. At 1:00 p.m., the available solar radiation increased rapidly while electrical power generation did not increase at the same rate; thus, the electrical efficiency decreased. From 1:00 p.m. to 4:00 p.m., solar radiation declined, but the cell temperature increased, which reduced the electrical energy generated and, consequently, the electrical efficiency continuously decreased.
Also, it was clear that the electrical efficiency of a cooled cell is always more than the electrical efficiency of an uncooled cell. This is because the electrical power generated for the cooled cell is higher than the power produced in the case of an uncooled cell. The increase in efficiency due to cooling is calculated based on Equation (4). The comparison between the cooled and uncooled solar cells’ efficiencies is given in Table 3. The cooled cell has a higher efficiency than the uncooled cell. The increase in efficiency is between 37.9% and 51.4%.

Table 3.
Efficiency of cooled solar cells compared to uncooled solar cells.
7.4. Cell Surface Temperature
Cell surface temperature has a remarkable effect on the performance of solar PV cells. As the cell temperature increases, the electrical energy produced decreases. Solar cell temperatures for cooled and uncooled cells throughout the day are shown in Figure 9. Table 4 shows the ratio of decreasing solar cell surface temperature for cooled and uncooled solar cells. The results showed that the temperature of the uncooled cells started at 35.8 at 10:00 a.m. As the solar radiation and ambient temperature increase from 10:00 a.m. to 1:30 p.m., the cell surface temperature rises. After 1:30 p.m., the solar radiation and ambient temperature go down, so the cell surface temperature drops. The cooled solar cell surface temperature is always less than the uncooled cell temperature as the water duct absorbs heat from the cell surface. The designed duct helps to reduce the cell temperature with a ratio of not less than 2.16%. The maximum decrease in cell surface temperature reached 9.44%.
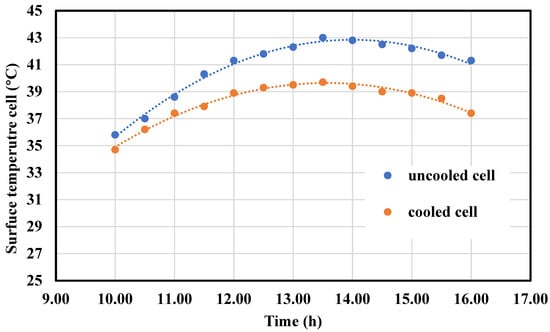
Figure 9.
Solar cell temperature of solar PV cells for cooled and uncooled solar cells throughout the day.

Table 4.
Decrease in surface temperature of cooled solar cells compared to uncooled solar cells.
7.5. Reverse-Osmosis Simulation Results
After cooling the solar PV cell, the hot water is fed to the reverse-osmosis system. The simulation study was performed to determine the effect of different feed temperatures on the performance and productivity of the system. Figure 10 shows the relation between feed pressure and feed temperature. It was found that the feed pressure was 47.3 bar at 20 °C. The pressure dropped with the increase in temperature, reaching 36.5 bar at 40 °C. Hence, the increase in feed water temperature tends to decrease the feed water pressure to the membrane system of reverse osmosis. Permeate TDS refers to total dissolved solids, which include ions and B(OH)3, but does not include NH3 and CO2. The relation between TDS and feed water temperature is shown in Figure 11. It was found that the TDS concentration increased with the increase in feed water temperature. At 20 °C, the TDS was around 40 ppm, and that value increased to 128.5 ppm at 40 °C. It was noted that a 64.8% increase in TDS was found when the water feed temperature increased from 20 °C to 40 °C. The specific electrical energy consumption to produce 1 m3 of distilled water is a very important parameter that must be calculated to differ between different methods of distilled water. The specific electrical energy drawn against different feed water temperatures is expressed in Figure 12. At 20 °C, the specific energy consumed was 3.55 kWh to generate 1 m3 of freshwater. That value decreased to 2.74 kWh with the increase in feed water temperature to 40 °C. The specific energy consumption decreased by 29.5% when the feed water temperature increased from 20 to 40 °C. It was concluded that with the increase in feed water temperature, the feed water pressure and specific energy consumption decrease while the TDS increases. Hence, the reverse-osmosis system needs hotter water to enhance its performance.
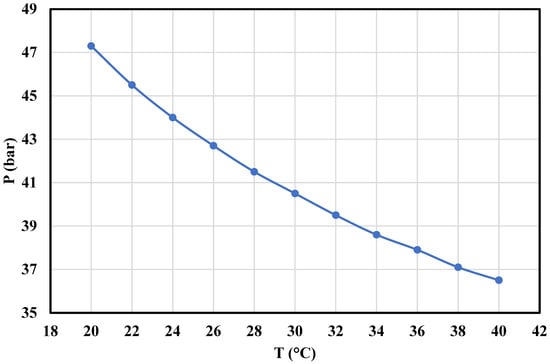
Figure 10.
Feed pressure versus feed temperature for simulated reverse-osmosis system.
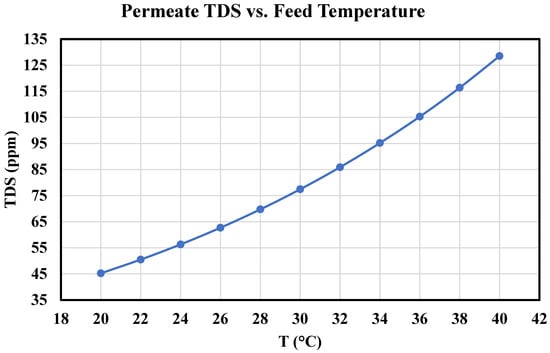
Figure 11.
TDS versus feed temperature for simulated reverse-osmosis system.
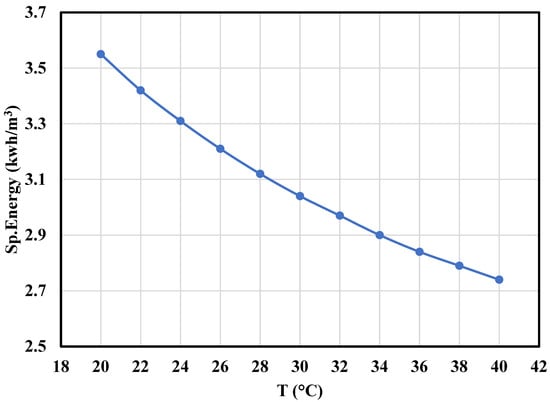
Figure 12.
Specific energy versus feed temperature for simulated reverse-osmosis system.
8. Application of Results to Desalination Plant
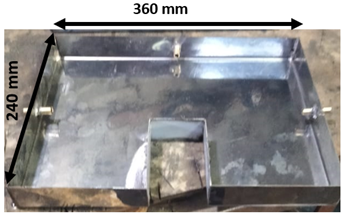
In this part, it is necessary to apply the results for the tested small-scale system shown in Figure 1 for the whole destination station shown in Figure 4. In the small-scale system, the cooling duct dimension is 240 × 360 × 35 mm. It is filled with 2.5 L of water. During the operating time, which is around 8.3 h, it was refilled five times to reach a water temperature of 37 . Hence, the daily water heated by the solar cells is 12.5 L/day. Based on this, each 1 m2 of solar cell can heat around 143 L of water per day. Table 5 shows the main data given from the tested small-scale system.

Table 5.
The main data given from the tested small-scale system.
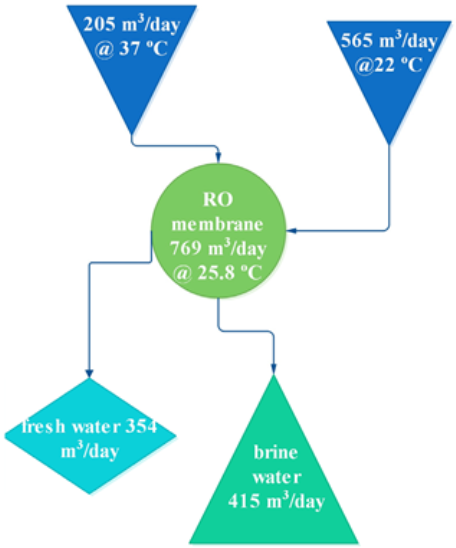
The RO desalination plant contains 522 solar panels, each with dimensions of 2274 × 1134 mm2. Hence, the total area of solar panels is 1423 m2. The daily total heated water to 37 is 205.7 m3. If the plant’s brine pump flow rate is 50 m3/h, then for 8.3 h of working time per day, the plant generates 415 m3/day of brine water. The average freshwater produced per day is 354 m3/day. Hence, the total inlet water for the membrane is 769 m3/day. If 205.7 m3 of heated water at 37 is mixed with 565 m3 of well water at 22 , the result is 769 m3 of water at 25.8 . Table 6 shows the main calculation for the RO desalination plant.

Table 6.
The main calculation for the RO desalination plant.
If the RO membrane temperature is increased from 22 to 25.8 , the values of feed pressure, TDS, and specific energy change. The new values can be found in Figure 10, Figure 11 and Figure 12, which show a comparison between the results for feed pressure, TDS, and specific energy at feed temperatures ranging from 22 to 25.8 . Based on the results, a reduction in feed pressure of 6% can be achieved when the feed temperature increases from 22 to 25.8 . The TDS increased from 50.51 to 62.71 ppm, which corresponds to a rise of 23.6% if the feed temperature increased from 22 to 25.8 . The specific energy consumption was reduced from 3.42 kWh/m3 at 22 to 3.31 kWh/m3 at 25.8 , representing a reduction in consumed energy by 3.2%. The reduction in power consumption reduces the cost of freshwater production.
9. Compression
Making comparisons with previous work ensures progress throughout this study. As efficiency increase is the main goal of researchers, the comparison is held about the efficiency growth. Figure 13 shows the efficiency increase in different research papers with several techniques. What matters in this comparison is that the chosen literature [5,26,27,28] focuses on a comparable idea in which traditional photovoltaic systems are used, and water serves as the cooling fluid. The average increase in efficiency in this study reached 44%, compared to 20.8% reported by Talebnejad et al. [5], 32.5% by Hadiapour et al. [26], 30% by Piotrowski et al. [27], and 24% by Zanlorenzi et al. [28]. Based on that, the presented method is a good and efficient cooling method. The increase in efficiency means that more electrical power is produced, which reduces the cost of power for operation. Figure 14 shows a comparison between this study, Shafaghat et al. [2], and Armendáriz-Ontiveros et al. [3] from the point of the reduction in specific energy consumption in the RO system. It shows that this study helps to reduce the energy consumption in the RO system by 3.2%, which is the same result for Shafaghat et al. [2], while Armendáriz-Ontiveros et al. [3] reduced it by only 2.5%. This indicates that this work has significant potential, as it reduces the energy consumed in the RO system.
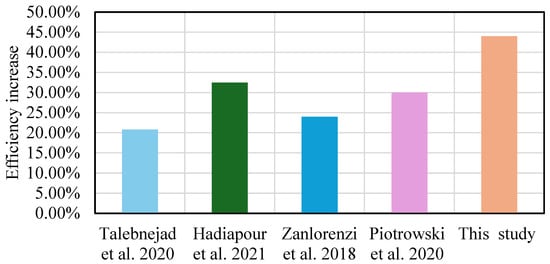
Figure 13.
Efficiency increased as a comparison with previous studies [5,26,27,28].
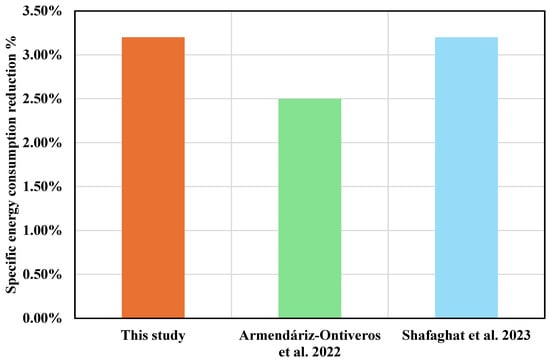
Figure 14.
Specific energy consumption reduction as a comparison with previous studies [2,3].
10. Conclusions
This paper focuses on studying the effect of cooling a solar PV cell with water to increase its electrical power generation. Two identical cells were tested as one was cooled, and the other one was uncooled. The performance of the cells was examined in Cairo city weather conditions. The generated electrical power of the cells was compared. The efficiencies of the cooled and uncooled cells were calculated. The cell surface temperature during the tested day was expressed. After that, a simulation study was performed using the WAVE program to determine the effect of different feed temperatures on the performance and productivity of the system.
Detailed results were obtained. Based on this study, the following conclusions were obtained:
- The electrical power generated from the cooled cell reached 6.75 W.
- The electrical efficiency of the cell could be enhanced to 51.4% if it was cooled with water.
- The maximum decrease in cell surface temperature was 9.44%.
- The increase in feed water temperature led to a decrease in the feed water pressure.
- TDS increased with the rise in feed water temperature.
- The specific energy consumed to produce 1 m3 of freshwater was decreased to 2.74 kWh with the increase in feed water temperature to 40 °C.
- A 3.2% reduction in consumed energy in the RO destination plant was achieved with the cooled system.
- The TDS increased from 50.51 to 62.71 ppm when the feed temperature was increased from 22 °C to 25.8 °C in the RO destination plant.
- A 6% reduction in feed pressure in the RO destination plant was achieved when the feed temperature was increased from 22 to 25.8 °C.
- In a real case study of a desalination plant, the energy consumed was reduced by 3.2%.
Author Contributions
Conceptualization, M.A.S.; Methodology, H.A.R. and M.A.S.; Validation, B.A.A. and M.A.S.; Formal analysis, H.A.R., M.F. and M.A.S.; Investigation, R.S.A., H.A.R. and M.A.S.; Resources, R.S.A. and M.F.; Data curation, B.A.A. and H.A.R.; Writing – original draft, M.A.S.; Writing – review & editing, R.S.A., B.A.A., H.A.R. and M.F.; Visualization, H.A.R. and M.A.S.; Supervision, B.A.A.; Funding acquisition, R.S.A. and M.F. All authors have read and agreed to the published version of the manuscript.
Funding
This research received no external funding.
Data Availability Statement
The original contributions presented in the study are included in the article, further inquiries can be directed to the corresponding author.
Conflicts of Interest
The authors declare no conflict of interest.
Nomenclature
| A | Cell area (m2) |
| D | Depth (mm) |
| Normal solar radiation (W/m2) | |
| Imp | Maximum-power current (Amper) |
| Isc | Short-circuit current (Amper) |
| Output current (Amper) | |
| L | Length (mm) |
| Pmax | Peak power (W) |
| Power input (W) | |
| Vmp | Maximum-power voltage (volt) |
| Voc | Open-circuit voltage (volt) |
| Output voltage (volt) | |
| W | Width (mm) |
| Greek symbols | |
| Electrical efficiency of cell | |
| Abbreviation | |
| RO | Reverse osmosis |
| PV | Photovoltaic |
| MFS | Membrane fouling simulator |
| PPM | Part per million |
| WAVE | Water application value engine |
References
- Nikiel, C.A.; Eltahir, E.A.B. Past and future trends of Egypt’s water consumption and its sources. Nat. Commun. 2021, 12, 4508. [Google Scholar] [CrossRef] [PubMed]
- Shafaghat, A.H.; Eslami, M.; Baneshi, M. Techno-enviro-economic study of a reverse osmosis desalination system equipped with photovoltaic-thermal collectors. Appl. Therm. Eng. 2023, 218, 119289. [Google Scholar] [CrossRef]
- Armendáriz-Ontiveros, M.M.; Dévora-Isiordia, G.E.; Rodríguez-López, J.; Sánchez-Duarte, R.G.; Álvarez-Sánchez, J.; Villegas-Peralta, Y.; Martínez-Macias, M.d.R. Effect of Temperature on Energy Consumption and Polarization in Reverse Osmosis Desalination Using a Spray-Cooled Photovoltaic System. Energies 2022, 15, 7787. [Google Scholar] [CrossRef]
- Cervantes-Rendón, E.; Ibarra-Bahena, J.; Cervera-Gómez, L.E.; Romero, R.J.; Cerezo, J.; Rodríguez-Martínez, A.; Dehesa-Carrasco, U. Rural Application of a Low-Pressure Reverse Osmosis Desalination System Powered by Solar–Photovoltaic Energy for Mexican Arid Zones. Sustainability 2022, 14, 10958. [Google Scholar] [CrossRef]
- Talebnejad, R.; Kamfiroozi, S.; Ebadi, H.; Vahabi, S.H.; Sepaskhah, A.R.; Ghobadian, B.; Savoldi, L. A new cooling method for photovoltaic panels using brine from reverse osmosis units to increase efficiency and improve productivity. Energy Convers. Manag. 2022, 251, 115031. [Google Scholar] [CrossRef]
- Kensara, M.; Dayem, A.M.A.; Nasr, A. Reverse osmosis desalination plant driven by solar photovoltaic system-case study. Int. J. Heat Technol. 2021, 39, 1153–1163. [Google Scholar] [CrossRef]
- Monjezi, A.A.; Chen, Y.; Vepa, R.; Kashyout, A.E.-H.B.; Hassan, G.; Fath, H.E.-B.; Kassem, A.E.-W.; Shaheed, M.H. Development of an off-grid solar energy powered reverse osmosis desalination system for continuous production of freshwater with integrated photovoltaic thermal (PVT) cooling. Desalination 2020, 495, 114679. [Google Scholar] [CrossRef]
- Jbari, Y.; Abderafi, S. Parametric study to enhance performance of wastewater treatment process, by reverse osmosis-photovoltaic system. Appl. Water Sci. 2020, 10, 217. [Google Scholar] [CrossRef]
- Kelley, L.C.; Dubowsky, S. Thermal control to maximize photovoltaic powered reverse osmosis desalination systems productivity. Desalination 2013, 314, 10–19. [Google Scholar] [CrossRef]
- Vyas, H.; Suthar, K.; Chauhan, M.; Jani, R.; Bapat, P.; Patel, P.; Markam, B.; Maiti, S. Modus operandi for maximizing energy efficiency and increasing permeate flux of community scale solar powered reverse osmosis systems. Energy Convers. Manag. 2015, 103, 94–103. [Google Scholar] [CrossRef]
- Ntavou, E.; Kosmadakis, G.; Manolakos, D.; Papadakis, G.; Papantonis, D. Experimental evaluation of a multi-skid reverse osmosis unit operating at fluctuating power input. Desalination 2016, 398, 77–86. [Google Scholar] [CrossRef]
- Freire-Gormaly, M.; Bilton, A.M. Design of photovoltaic powered reverse osmosis desalination systems considering membrane fouling caused by intermittent operation. Renew. Energy 2019, 135, 108–121. [Google Scholar] [CrossRef]
- Alghoul, M.A.; Poovanaesvaran, P.; Mohammed, M.H.; Fadhil, A.M.; Muftah, A.F.; Alkilani, M.M.; Sopian, K. Design and experimental performance of brackish water reverse osmosis desalination unit powered by 2 kW photovoltaic system. Renew. Energy 2016, 93, 101–114. [Google Scholar] [CrossRef]
- Raval, H.D.; Maiti, S. Ultra-low energy reverse osmosis with thermal energy recovery from photovoltaic panel cooling and TFC RO membrane modification. Desalin. Water Treat. 2016, 57, 4303–4312. [Google Scholar] [CrossRef]
- Shigidi, I.; Anqi, A.E.; Elkhaleefa, A.; Mohamed, A.; Ali, I.H.; Brima, E.I. Temperature Impact on Reverse Osmosis Permeate Flux in the Remediation of Hexavalent Chromium. Water 2022, 14, 44. [Google Scholar] [CrossRef]
- Altmann, T.; Buijs, P.J.; Farinha, A.S.F.; Borges, V.R.P.; Farhat, N.M.; Vrouwenvelder, J.S.; Das, R. Seawater Reverse Osmosis Performance Decline Caused by Short-Term Elevated Feed Water Temperature. Membranes 2022, 12, 792. [Google Scholar] [CrossRef]
- Shaaban, S.; Yahya, H. Detailed analysis of reverse osmosis systems in hot climate conditions. Desalination 2017, 423, 41–51. [Google Scholar] [CrossRef]
- Hawari, A.H.; Kamal, N.; Altaee, A. Combined influence of temperature and flow rate of feeds on the performance of forward osmosis. Desalination 2016, 398, 98–105. [Google Scholar] [CrossRef]
- Farhat, N.M.; Vrouwenvelder, J.S.; Van Loosdrecht, M.C.M.; Bucs, S.S.; Staal, M. Effect of water temperature on biofouling development in reverse osmosis membrane systems. Water Res. 2016, 103, 149–159. [Google Scholar] [CrossRef]
- Kotb, H.; Amer, E.H.; Ibrahim, K.A. Effect of operating conditions on salt concentration at the wall of RO membrane. Desalination 2015, 357, 246–258. [Google Scholar] [CrossRef]
- Jawor, A.; Hoek, E.M.V. Effects of feed water temperature on inorganic fouling of brackish water RO membranes. Desalination 2009, 235, 44–57. [Google Scholar] [CrossRef]
- Mostafa, M.; Moawed, M.; Refaey, H.A.; Salem, M.R. Performance evaluation of a Sea water reverse osmosis system at different operating scenarios. Eng. Res. J. Fac. Eng. 2021, 49, 67–79. [Google Scholar] [CrossRef]
- Hamada, A.; Emam, M.; Refaey, H.A.; Moawed, M.; Abdelrahman, M.A. Investigating the performance of a water-based PVT system using encapsulated PCM balls: An experimental study. Energy 2023, 284, 128574. [Google Scholar] [CrossRef]
- N.W.S. “Cob” and “conners”. Notes Queries 1853, s1-VIII, 43. [Google Scholar] [CrossRef]
- Kim, J.; Park, K.; Hong, S. Application of two-stage reverse osmosis system for desalination of high-salinity and high-temperature seawater with improved stability and performance. Desalination 2020, 492, 114645. [Google Scholar] [CrossRef]
- Hadipour, A.; Rajabi Zargarabadi, M.; Rashidi, S. An efficient pulsed-spray water cooling system for photovoltaic panels: Experimental study and cost analysis. Renew. Energy 2021, 164, 867–875. [Google Scholar] [CrossRef]
- Piotrowski, L.J.; Simões, M.G.; Farret, F.A. Feasibility of water-cooled photovoltaic panels under the efficiency and durability aspects. Sol. Energy 2020, 207, 103–109. [Google Scholar] [CrossRef]
- Zanlorenzi, G.; Szejka, A.L.; Canciglieri, O. Hybrid photovoltaic module for efficiency improvement through an automatic water cooling system: A prototype case study. J. Clean. Prod. 2018, 196, 535–546. [Google Scholar] [CrossRef]
Disclaimer/Publisher’s Note: The statements, opinions and data contained in all publications are solely those of the individual author(s) and contributor(s) and not of MDPI and/or the editor(s). MDPI and/or the editor(s) disclaim responsibility for any injury to people or property resulting from any ideas, methods, instructions or products referred to in the content. |
© 2024 by the authors. Licensee MDPI, Basel, Switzerland. This article is an open access article distributed under the terms and conditions of the Creative Commons Attribution (CC BY) license (https://creativecommons.org/licenses/by/4.0/).
