Abstract
Renewable energy communities foster the users’ engagement in the energy transition, paving the way to the integration of distributed renewable energy sources. So far, the scientific literature has focused on residential users in energy communities, thus overlooking the opportunities for industrial and commercial members. This paper seeks to bridge this gap by extending the analysis to the role of non-residential users. The proposed methodology develops an effective clustering approach targeted to actual non-residential consumption profiles. It is based on the k-means algorithm and statistical characterization based on relevant probability density function curves. The employed clusterization procedure allows for effectively reducing a sample of 49 real industrial load profiles up to 11 typical consumption curves, whilst capturing all the relevant characteristics of the initial population. Furthermore, a peer-to-peer sharing strategy is developed accounting for distributed and shared storage. Three scenarios are considered to validate the model with different shares of non-residential users, and the results are then evaluated by means of shared energy, self-consumption, and self-sufficiency indices. Moreover, the results show that the integration of a large non-residential prosumer in a REC may increase the self-sufficiency of residential members by 8.2%, self-consumption by 4.4%, and the overall shared energy by 37.3%. Therefore, the residential community consistently benefits from the presence of non-residential users, with larger users inducing more pronounced effects.
1. Introduction
One of the objectives of the European Green Deal [1] is to make Europe the first carbon-neutral continent by 2050. In this context, renewable energy communities (RECs) are expected to play a pivotal role towards the achievement of such an objective. In fact, RECs may leverage the implementation of sustainable and citizen-driven energy programs that increase energy efficiency and foster the integration of renewable energy sources (RESs) [2].
Besides the abovementioned environmental benefits [3], RECs are expected to provide social benefits by enabling energy poverty reduction [4] and fostering stakeholders’ engagement [5], as well as economic benefits by means of a reduction in the energy bills of its members and new financial resources for further initiatives [6]. Overall, different features may categorize RECs, e.g., types of members and the sector they belong to. Considering the first feature, it is possible to identify the “consumers”, which are REC members who are passively consuming energy, “producers”, who are producing the electricity through their own renewable generation, or “prosumers”, which are REC members who can absorb energy while also actively producing electricity from RESs to meet both their own and the other REC members’ needs. It is worth highlighting the central role in the scientific literature played by members belonging to the residential sector [7,8,9,10,11,12,13,14,15,16,17], among which only a few studies also acknowledge commercial [14] and industrial [14,17,18] sectors or public buildings [8,14,15,17]. Studies directly focusing on non-residential users are limited to [18,19], although these do not tackle the integration of such users in RECs.
Nonetheless, industrial and commercial users may take the lead in the spread of these types of configurations, leveraging their remarkable prospect of capital investment. By increasing the RESs’ installed capacity, these members may be willing to share their energy production with the rest of the members of the REC. For this reason, one of the key purposes of this study is to investigate the roles and benefits of including non-residential users within a residential-based REC.
Furthermore, a key ingredient in the assessment of RECs’ operation and economics is the determination of the load profiles of the members. Although these profiles for residential users may exhibit, overall, similar features, non-residential profiles are widely more heterogeneous. In some cases, the load profile of REC members is directly measured or comes from measurement datasets [9,10,11,12,18,19]. In some other cases, the consumption profile is built through the use of load profile generator tools, as in [7,8,13,16]. Alternatively, a mixed approach might be adopted by using both real measurements or load profile generator tools, as in [14,15,17]. In this study, the consumption profiles of the various types of consumers (residential, industrial, and public buildings) are based on actual real measurements accessible in previous studies or other repositories and clustered to obtain typical consumption profiles for different types of non-residential users.
In addition, the operation of the REC largely depends on the methodology employed to assess and exploit the energy sharing within the REC. Two main alternatives have been reported in the literature: peer-to-grid (P2G) [7,8,13,16,19] and peer-to-peer (P2P) [7,8,9,10,11,12,13,14,15,16,17,18,19]. Both techniques aim to maximize self-consumption, i.e., the amount of energy that is produced and directly consumed by the users; however, two different perspectives are employed. The P2G approach first optimizes individual user self-sufficiency, i.e., the amount of the user’s load that is supplied by its own production, opening it up to the share of any excess energy that cannot be stored, for example, in the Battery Energy Storage System (BESS). On the other hand, the P2P approach optimizes the community’s self-sufficiency while limiting energy exchanges with the external electric network.
Nowadays, the P2G approach, which may implement de facto decentralized control, is the most common setup, as it does not require a specific monitoring and communication infrastructure. In the case of a photovoltaic (PV) system coupled to a BESS, the local PV generation and load consumption profiles are first compared at each timestep to determine whether the battery should be charged in the event of overproduction or discharged in the event of underproduction.
The P2P refers instead to centralized control, which requires a communication infrastructure and an aggregator capable of monitoring and managing intra-community energy fluxes based on PV production, load, and the State of Charge (SoC) of the BESS. The fundamental rules guiding the consumption and production of electricity by each component are the same as in the previous case. The main difference is that, in this case, the PV production and load at each timestep are aggregated to compute the difference between production and consumption with respect to the entire REC.
Furthermore, it is possible to adopt two different perspectives when developing the REC flow control logics: the REC-oriented or the user-oriented approach. The first, which is commonly used in the literature, as in [8,9,11,12,13,15,16,17], is based on the balancing of the energy flows concerning the whole REC. In contrast, the second studies the energy inflows and outflows of individual users and community components. The control logics developed in this work are based on this latter technique, as in other studies [7,10,14,19], to contribute to the knowledge on this subject. The user-oriented technique enables independent analysis of all potential energy flows among the REC users, providing insights into benefit distributions based on the various financing schemes and/or incentives that are currently in place worldwide. However, this type of economic and business model analysis falls outside of the scope of this research.
Moreover, the PV and BESS installed capacity are optimized separately or determined based on specific assumptions [7,8,9,10,11,12,13,14,18]. The available literature proposes only a few cases in which their capacities are co-optimized [15]. Hence, this study optimizes the installed capacities of PV and BESS jointly to achieve a specified self-sufficiency target. An economic constraint on the PV and BESS investments, as well as a threshold in the PV/BESS capacities ratio, are applied to evaluate which is the most cost-effective option between investing in additional PV power capacity and further BESS energy capacity, given the same self-sufficiency target.
For the sake of improved clarity, Table 1 outlines the literature employed as a reference, highlighting all of the features discussed thus far. In light of the abovementioned discussion, it is worth highlighting the contributions of the proposed work:

Table 1.
Summary of the referenced literature, highlighting the main aspects considered for this analysis.
- -
- The development of a novel clustering methodology based on the k-means algorithm and statistical characterization depending on relevant probability density function curves. The methodology is applied to real consumption data of non-residential loads, notably industrial buildings, offices, and libraries. Differently from previous cases in the literature based on residential consumptions (fairly similar to each other), the approach developed in this work contributes to accurately capturing the fundamental characteristics of industrial loads, which are typically variegated.
- -
- Following a user-oriented perspective, the proposed work contributes to the existing literature by implementing a novel P2P control mechanism enabling the sharing of potential PV energy surplus and distributed BESS energy content among the members of the REC, allowing them to effectively make use of the flexibility of the BESS in order to meet the REC consumption needs.
- -
- Differently from other works in the specific context of RECs, the methodology is newly applied to the realistic and comprehensive case of communities characterized by mixed residential and non-residential users.
The results of this work may serve as a basis for quantifying the benefits of uniform or mixed types of RECs (i.e., depending on the types of members) and inform relevant stakeholders, including regulatory authorities and technical entities (e.g., distribution system operator) regarding the potential value of such diversity to accelerate the actual deployment of RECs.
2. Methodology
The main steps of the proposed methodology are summarized in Figure 1.
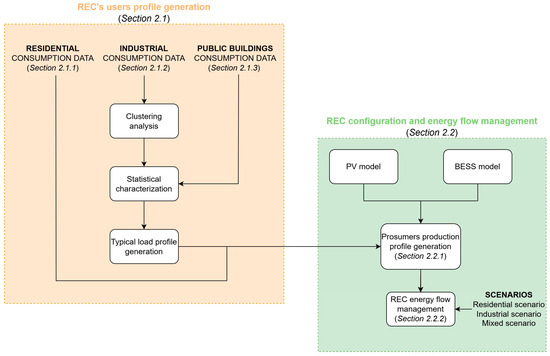
Figure 1.
Overview of the methodology proposed in this study.
In the first part of the methodology, the consumption profiles of the REC’s users are computed, as explained in Section 2.1. The consumption profiles of REC users are built using actual measurement data and by developing a clustering algorithm in MATLAB to extract their normal annual load profile, namely for industrial users and public buildings, whilst residential consumption profiles are derived from other studies. Their consumption profiles are evaluated using different data processing stages according to the data source, with only the electrical demand for lighting and domestic appliances considered, while the electricity consumption of heating and cooling systems is excluded.
In the second part of the methodology, the production profile of prosumers as well as the P2P control logic are developed with a Python code, as shown in Section 2.2. A user-oriented perspective is used to manage all of the energy fluxes among the REC’s components.
Three different scenarios are considered in the analysis. A residential scenario with only residential users represents the baseline for comparing REC performance in the presence of non-residential users. The industrial scenario introduces an industrial prosumer into the reference residential-based REC. In the mixed scenario, one of the residential consumers is replaced by the public building as a consumer to simulate an REC configuration in an urban area.
The scenario comparison is based on three main Key Performance Indicators (KPIs). Self-sufficiency represents the amount of user load that is supplied by its own and the other REC members’ production, including the amount of energy coming from the distributed BESS. Self-consumption represents the energy that is produced and directly consumed by the users. The energy shared takes into account the amount of energy exported to the other REC members by the prosumers.
2.1. REC’s User Profile Generation
2.1.1. Residential Users’ Consumption Profiles
The residential consumption profiles are taken from the study reported in [17], which is based on real measurements. These are gathered with a smart metering monitoring campaign for Italian households; further relevant details are provided in [20]. The consumption profiles, which cover a whole year with an hourly timestep, are then randomly selected to serve as the study’s reference for residential REC users.
2.1.2. Industrial Users’ Consumption Profiles
The industrial load profiles are obtained using a database of actual measurements of 49 small- and medium-sized enterprises located in Germany [21]. The load curves represent the power consumption with a time resolution of 15 min for a whole year.
Initially, the industries were separated into two major classes: Class A, which implemented a five-day weekly shift, and Class B, which required a full-week shift (i.e., including Saturdays and Sundays). The clustering process was then performed independently for each class using the k-means clustering algorithm, also known as Lloyd’s algorithm [22], implemented in the MATLAB environment [23]. The algorithm considers six statistical indexes: the mean, standard deviation, skewness, median, and 10th and 90th percentiles. To improve the accuracy of the results, four values were computed for each of these indexes; each of these values refers to a different season of the year.
To identify the appropriate number of clusters, the simple but effective elbow method was employed [24], which involves charting the expected variance as a function of the number of clusters. The percent of expected variance, calculated for each k-th cluster, is calculated as in (1).
In addition, VarDiffk is evaluated in (2), and it represents the difference between the sum of WCSSk (the Within-Clusters Sums of Squares) of each cluster, determined through (3).
where M is the number of industries included in the cluster k, m is the industry taken as the reference, and d is Euclidean squared distance calculated as (4).
where x is the coordinates of the data point, c is the coordinates of the centroid, and N is the number of indexes that characterize the data point.
Once the number of clusters is determined, it is used as input for the final k-means analysis to assign a group to each industry to enable the smallest sum of the distances between the data points and the cluster centroid.
A Principal Component Analysis (PCA) was then employed to verify the findings and graphically show the results, as described in [25]. The analysis was carried out using the specific MATLAB function that takes as an input the clustering results datasheet and repeats the procedure for both Classes A and B.
A statistical characterization was adopted to re-create a typical cluster profile, starting from the definition of a set of probability density function (PDF) curves (normal, log-normal, and Weibull) and yielding the characteristic parameters: the mean and standard deviation for normal and log-normal PDFs, shape and scale parameters for the Weibull PDFs, and the location parameter c for the log-normal and the Weibull PDF. Overall, a curve was fitted for each time slot (24 h slots per four seasons), resulting in 96 curves per cluster.
The typical consumption profile was eventually carried out through an algorithm, which verifies the time of the day and season considered and finds the appropriate PDF data in the input. As a result, at each hour, it assigns a randomly selected power value obtained from the corresponding probability distribution curve. For Class A, it must also be determined if the day is a working or weekend one. For working days, the procedure is the same, with the power value extracted from the distribution. On the other hand, given the practically flat load profile on weekends, a mean daily weekend load profile was calculated for each season and cluster.
2.1.3. Public Building Consumption Profiles
This study considers two separate public buildings: an office and a library. The consumption data of the library are real measurements from the library of the University of Trento (Italy) [17], whereas the office input data are taken from an open database [26].
In both cases, the measurements are divided into electricity consumption for lighting and other electrical devices and electricity consumption for heating, cooling, and ventilation, which has been neglected, as mentioned before.
The library’s measurements are available for an entire year with a timestep of 15 min, but the office’s consumption data cover a six-month period with a time resolution of 10 s. The office is based on a single structure with six offices, a common room with printers, and a kitchen with a fridge, water heater, microwave, and coffee machine.
A similar statistical approach for the industrial users’ consumption profiles was utilized to recreate the consumption profile of the public buildings. After data processing to transform real data into hourly time resolution for a whole year, the PDFs were reviewed for all the time slots of the working days, and a mean power value was calculated for each hour of the weekend days to obtain the mean daily profile.
2.2. REC Configuration and Energy Flow Management
2.2.1. Prosumer Production Profile Generation
The PV and BESS systems were sized together in an iterative process for which the algorithm was developed in Python (version 3.10.9) with the goal of meeting a specific self-sufficiency requirement for the single user and creating the prosumer’s production profile by imposing two different constraints.
An economic constraint on PV and BESS capacity expansion at each iteration was imposed to identify the most cost-effective option between increasing the PV and BESS capacity to achieve the desired self-sufficiency value. To make this decision, the algorithm takes a step-by-step approach that starts with increasing one of the two parameters by a predetermined increment (ΔPV–ΔBESS). The process is then repeated, raising the other parameter by the calculated increment (ΔPV–ΔBESS) while maintaining the other at its previous iteration’s value. Once both trials have been completed, the parameter with the greatest advantage in terms of self-sufficiency is increased.
A PV/BESS capacity ratio constraint based on the literature and current commercial practices [27,28] was also applied to avoid oversizing the BESS with respect to the PV system. This ratio requires that the BESS capacity does not exceed double the PV capacity, i.e., for a PV installed capacity of 3 kW, the BESS capacity cannot exceed 6 kWh.
The PV production was estimated using the PV Lib Toolbox [29]. This tool provides a set of functions and classes for simulating the performance of PV systems, based on several inputs, e.g., the geographical coordinates (latitude, longitude, and time zone), the installation surface properties (orientation and tilt angle), the commercially available inverters and PV modules, and the minimum required nominal peak power. The main outputs are the Alternate Current (AC) annual production profile, the final PV nominal peak power, the number of strings per inverter, and the number of PV modules per string.
Additionally, the meteorological data from the reference location are required to produce the AC generation profile, which were obtained via PVGIS [30]. It gives the Typical Meteorological Year (TMY) based on real-time observations with one-hour time resolution collected between 2005 and 2020, including the dry bulb air temperature, the global horizontal irradiance, the direct beam normal irradiance, the diffuse horizontal irradiance, the wind speed, and the surface air pressure.
As a further step, the Sandia PV Array Performance Model (SAPM, https://www.osti.gov/servlets/purl/919131/ (accessed on 22 January 2024)) [31] was used to evaluate the Direct Current (DC) PV production, and the optimal PV system configuration was finally determined by calculating the minimum number of modules that meet both the peak power requirement and the physical constraints associated with the maximum voltage and acceptable power of the selected inverter. A single-array arrangement was considered, which implies that each PV system has a single inverter and all of the strings have the same number of modules and mounting characteristics (slope, azimuth angle, etc.).
2.2.2. Energy Flow Management
The control algorithms employed in this study were developed in Python (version 3.10.9) based on the P2P logic established in [8,13] and expanded to be able to track each REC member’s inflows and outflows. By doing so, all of the KPIs used to monitor the REC performance refer to a single user. The main goal is to minimize the energy exchanges with the grid, not just through the energy exchange from the PV production surplus but also by allowing the energy sharing from the BESS energy content across all of the users.
With this approach, the BESS can be used not only by its owner to meet its own demand but also by the other prosumers and consumers to satisfy their own needs. In particular, the implemented control logic prioritizes for prosumers the use of their self-generated energy to meet their own load. If there is an energy surplus, it is used to charge their own BESS before being exported to other users (for direct consumption or for charging their BESS) and then to the grid. In contrast, when there is an energy deficit, the user absorbs the energy stored in its BESS before going to other users or the grid to satisfy its remaining load.
Figure 2 depicts the energy exchanges between the various REC components from the perspective of the single user, according to the implemented control logics. The community C represents n REC’s users, which might be prosumers or consumers.
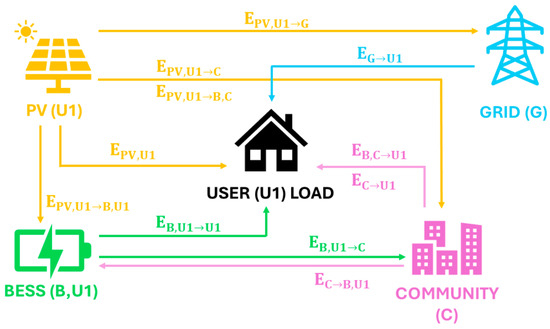
Figure 2.
Energy fluxes controllable with the implemented control logic.
Three main KPIs are used for the scenario comparison: the self-sufficiency (SS), the self-consumption (SC), and the shared energy (SE).
The SS represents the amount of the user’s load that is supplied by its own and the other REC members’ production, which is calculated with (5).
where is the PV production that is self-consumed by the user n; is the amount of energy taken from the BESS of user n to satisfy its own demand; is the amount of energy that the user n is taking from the community surplus; is the amount of energy that the user n is taking from the community’s BESS; is the total load of user n; and T is the total number of time steps.
Similarly, the SC measures the amount of energy that is produced and directly consumed by the users, which is calculated using (6).
where is the total PV production of user n.
The SE by the prosumers is calculated through (7), considering the amount of energy exported to the other REC members.
where represents the PV overproduction of user n that is shared and directly self-consumed by the other community’s users; represents the PV overproduction of user n, which is stored in the BESS of other community members; and is the amount of energy taken from the user n BESS to satisfy the other REC members’ demand.
3. Results
This section discusses the main findings of the study, addressing the mean load profiles generated for the various users and determining the REC performances measured in terms of the chosen KPIs.
This study considers three different scenarios, for which the features are illustrated in Figure 3. These scenarios are designed to better understand the REC’s performance and the benefits of the sharing mechanisms, especially from a technical perspective, focusing on three selected KPIs: self-sufficiency, self-consumption, and shared energy.

Figure 3.
REC composition in the three different scenarios: residential (on the left), industrial (at the center), and mixed (on the right).
A reference scenario (residential) is used to establish the baseline for comparing REC performance in the presence of non-residential users. In particular, the residential REC is made by five prosumers and five consumers. The prosumers are equipped with a PV plant together with BESS that are sized to achieve 60% as the SS index. According to the analysis presented in [16], residential prosumers and consumers are equally spread in the REC because this ratio was shown to be the most cost-effective solution from the REC perspective.
In the second scenario (industrial), an industrial prosumer is introduced into the reference REC configuration, with a typical load profile selected from the preliminary clustering process, to evaluate the potential impact of including a non-residential user in a residential REC.
The final scenario (mixed) is designed to replicate an REC configuration in an urban area composed of various load profiles. In this scenario, the REC is created in the same manner as the previous case, but one of the residential consumers is replaced by the office’s public building as a consumer.
It is assumed that those RECs are located in Trento, a small city in a mountainous region of northern Italy, which is characterized by a heating-dominated climate with 2567 Heating Degree Days (HDDs). As a result, the relevant weather data required to estimate the prosumers’ PV production are extracted from the PVGIS [30].
The PV modules’ tilt and azimuth angles are set equal to 39° and 180° (perfectly south-oriented), respectively. PVGIS recommends the tilt angle as the optimum option for maximizing PV production at a specific location. The key features of PV modules, which are assumed to be the same for all prosumers, are based on the Silevo Triex U300 Black model available in the Sandia Module database [31].
Different inverter models are considered dependent on the PV plant size in order to comply with the inverter’s physical constraints. The models used in this study are taken from the Clean Energy Council Inverter database [32].
The BESS used as a reference is based on the Li-ion technology, for which the technical specifications are taken from commercially available batteries [33,34,35,36]. The SoC ranges between 20% and 95%, with a charging and discharging efficiency of 90% and 95%, respectively.
The economic assumptions used to size the PV and BESS systems were derived from the National Survey Report of PV Power Applications in Italy [37] and the U.S. Solar Photovoltaic System and Energy Storage Cost Benchmarks [38], respectively. The PV investment cost is EUR 1800/kWp and the expected lifetime is 30 years, whereas the BESS investment cost is around EUR 950/kWp and the expected lifetime is assumed to be equal to 15 years.
All of the simulations were executed using an Asus Vivobook laptop equipped with the Intel(R) Core(TM) i7-8565U CPU @ 1.80 GHz 1.99 GHz and 16.0 GB RAM. The computational time for one complete simulation is approximately 30 min and refers to all of the steps illustrated in Figure 1. The set of actions performed within this time starts with the user load profile generation, and then it proceeds with the PV and BESS sizing up to the estimation of all of the energy fluxes among the REC’s components.
3.1. REC’s User Profile Generation
3.1.1. Industrial Users’ Consumption Profiles
The clustering process of the industrial real consumption profiles results in 11 clusters, which are listed in Table 2 as the cluster subdivisions and the number of industries involved in each cluster.

Table 2.
Clustering results: identification of cluster reference (second row) and number of industries assigned to each cluster (third row). The total number of industries is 49, which all belong to the same initial population.
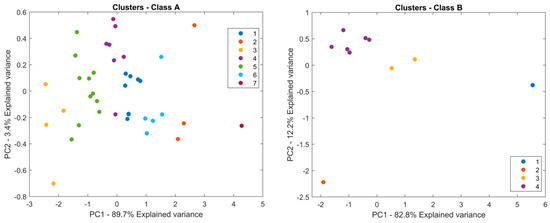
Figure 4.
PCA results for both Classes A (on the left) and B (on the right). Each industry is represented by a dot, whereas the color refers to a specific cluster.
The left-hand side of Figure 4 depicts the industries’ distribution (39 points) for Class A using the coordinate system determined through the PCA method. The first principal components represent 89.7% of the explained percentage of variance on the X-axis, whereas the second principal components are equal to 3.4% on the Y-axis. Each point represents an industry, and each color identifies a specific cluster. The graph clearly illustrates that industries within the same cluster are very close, and the groups are split mostly along the X-axis, as in a banded division. This is demonstrated by the first principal component’s higher weight in terms of explained percentage of variance in comparison to the second, which makes differences along the X-axis more substantial.
Results of Class B clustering after the PCA analysis are shown on the right side of Figure 4. Here, the subdivision of the 10 industrial users in the four clusters is even clearer. Differently from the previous case, the explained percentage of variance for Class B, corresponding to the second principal component, has a higher weight, and consequently differences are also more visible along the Y-axis.
In Figure 5, the mean daily load profile of each cluster is presented along with the average load profile.
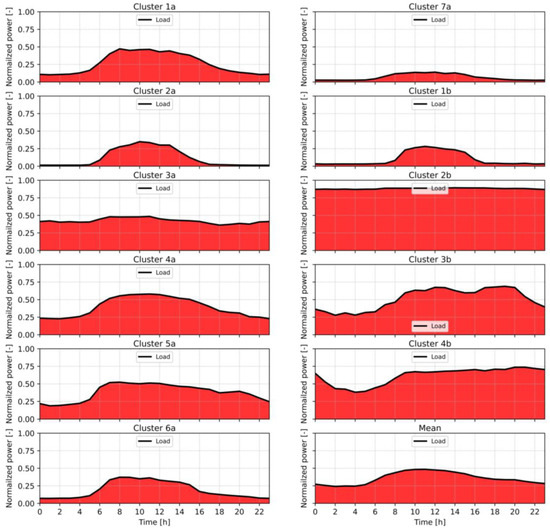
Figure 5.
Example of normalized mean daily load profiles of industries in each cluster (from 1a to 7a and from 1b to 4b) and their normalized average.
Clusters 6A, 2A, 1B, 7A, and 1A had the highest consumption during working hours (between 6 a.m. and 4 p.m.), with a considerable decline for the rest of the day. Profile 7A also consumes much less on average than the other clusters. The average profiles of clusters 3A and 2B follow an almost steady trajectory throughout the day, with 2B having much higher average consumption than the others. Clusters 4A and 5A have a very high average consumption throughout the day and only a tiny variation between working (from 6 a.m. to 8 p.m.) and off-hours. Similarly, clusters 3B and 4B have very high and generally continuous consumption throughout the day, with a steep decline between midnight and 9 a.m., reaching the lowest value at 4 a.m.
3.1.2. Public Building Consumption Profiles
Figure 6 shows the mean daily consumption profiles of the two public buildings used as reference for this analysis: the library on the left and the offices on the right.
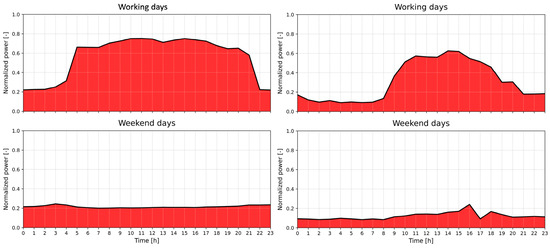
Figure 6.
Normalized mean daily load profile of the public buildings (library on the left and offices on the right) for both the working (upper part) and weekend days (lower part).
The library has the highest average consumption between 5 a.m. and 9 p.m. as well as a significant base load. On the other hand, the offices have a higher consumption between 9 a.m. and 6 p.m. and consume less power during non-working hours in comparison to peak hours.
3.2. REC Scenarios’ Analysis
3.2.1. Full Residential REC Scenario
The REC is composed of five residential prosumers and five residential consumers in this scenario, which have an annual consumption from 5815.7 kWh to 9238.4 kWh. The PV capacity varies from 4.8 kWp to 6 kWp, which results in an annual PV production between 6764.7 kWh and 8462.2 kWh. The BESS capacity varies from 4.5 kWh to 6.6 kWh, and it complies with the PV–BESS ratio imposed during the sizing process. In Table 3, the results of the KPIs are reported for each REC member.

Table 3.
Self-sufficiency (SS), self-consumption (SC), and shared energy (SE) of the five prosumers considered in the residential scenario.
Prosumers’ final self-sufficiency ranges from 48.1% to 55.5%, which is lower than the target used during the PV and BESS design phase. This drop can be linked to the varying battery usage and the energy sharing amongst users. Moreover, prosumers can self-consume from 44.9% to 56.6% of their own renewable production, and, after storing it in their BESS, share between 2297.1 kWh and 3438.9 kWh of their energy surplus per year.
Figure 7 depicts the percentage-based distribution of the PV production for each prosumer, highlighting where the production by their respective PV plant is directed.
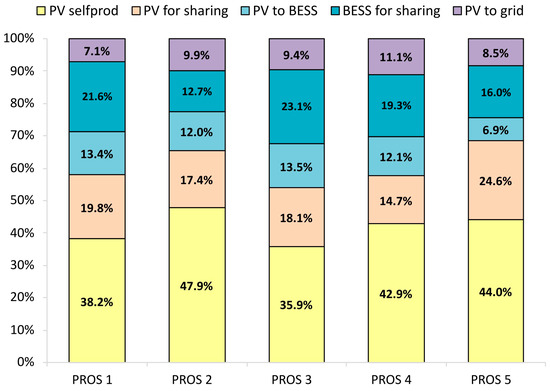
Figure 7.
Distribution of the PV production of each residential prosumer considered in the residential scenario [%]. The total PV production is divided into the amount that is self-produced (PV selfprod), directly shared (PV for sharing), used to charge the BESS (PV to BESS), shared through the BESS (BESS for sharing), and exchanged to the grid (PV to grid).
On average, the prosumers’ self-production is around 41.8%, and 30.5% of the PV production is used to charge the BESS. The PV overproduction that is available for energy sharing is around 37.5% of the total production, with 18.9% directly consumed by the other REC’s members and 18.5% taken from the user BESS. The remaining 9.2% of PV production goes to the grid.
From the prosumer’s perspective, the quantity of PV production that is directly self-consumed by the user is around 42.5% on average; however, the amount of energy absorbed from the BESS to satisfy the demand is approximately 7.8%. The load covered by the other REC members’ contributions is negligible for prosumers, who continue to rely on the external grid for about half of their consumption requirements. Instead, the consumers’ load coverage is around 39.8%, considering both the amount of the prosumers’ PV production directly consumed and the energy taken from the prosumers’ BESS.
3.2.2. Scenario with One Industrial Prosumer
In this scenario, an industrial prosumer is added to the reference REC, taking into account the typical consumption profile of an industry from the 5A cluster, with a total annual consumption of 83.5 MWh. The PV and BESS installed capacities are 56.7 kWp and 84.3 kWh, respectively, and the total annual PV production is around 78.8 MWh.
Compared to the previous scenario, all three KPIs improve. Residential prosumers’ self-sufficiency increases by about 8.2% and ranges from 55.8% to 63.7%. Similarly, prosumers increase their self-consumption by 4.4%, ranging from 49.9% to 60.2%. The industrial self-sufficiency and self-consumption rates are 52.6% and 55.7%, respectively. The overall shared energy is increasing from 13,951.7 kWh to 22,269.7 kWh thanks to the presence of the big industrial prosumer, which covers 42.2% of the overall shared energy. However, the amount of shared energy from the residential prosumers decreases from 13,951.7 kWh to 12,866.5 kWh.
Figure 8 displays how the PV production of each prosumer is allocated within the REC configuration, including the industrial prosumer.
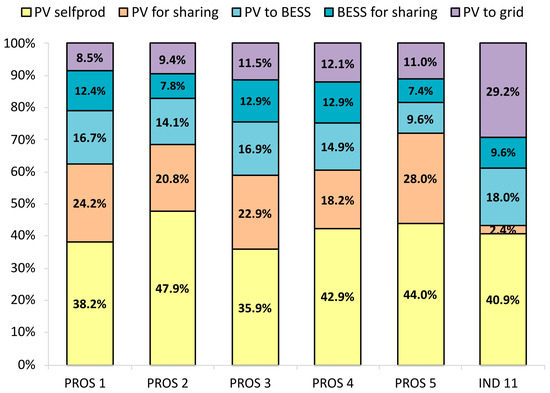
Figure 8.
Distribution of the PV production of each of the 5 residential prosumers and the industrial prosumer (rightmost bar) considered in the industrial scenario [%]. The total PV production is divided into the amount that is self-produced (PV selfprod), directly shared (PV for sharing), used to charge the BESS (PV to BESS), shared through the BESS (BESS for sharing), and exchanged to the grid (PV to grid).
When compared to Figure 7, the self-production remains constant for each prosumer because it is governed by the matching of production and consumption characteristics. However, the amount of energy stored in the residential user’s BESS decreases marginally by 3% to 7%, remaining between 17% and 29.8%. The amount of PV overproduction shared by the residential prosumers, both directly and through the BESS, decreases by roughly 1.5–5%, while the PV overproduction sent to the grid increases by about 1.3%. The industrial prosumer self-production rate is 40.9%, while the PV overproduction used to charge the BESS is 27.6% and shared around 12% (2.4% directly shared and 9.6% through the BESS). The remaining 29.2% is exchanged with the grid.
From a load coverage standpoint, the presence of the industrial user enables the sharing of additional energy with consumers, who can now cover more than half of their demand, up from 50.6% to 59.5%. Furthermore, each residential prosumer improves both the amount of load covered by its own BESS system and the energy shared with the other REC members by around 4% and 3.5%, respectively. The grid contribution to load coverage decreases by approximately 8% for the residential prosumers and by 6% to 14% for the residential consumers. The industrial prosumer meets its demand by 38.6% through PV self-consumption and 14% with its own BESS. The remaining 46.6% is covered by the external grid, as the quantity of energy shared by the other REC members is small.
3.2.3. Scenario with a Public Building as a Consumer
The results of this scenario are provided by substituting one of the residential consumers with the offices, which have a total annual consumption of 56.3 MWh.
In comparison to the previous scenario, the residential prosumers’ self-sufficiency drops by about 6.4%, slightly above the level in the residential scenario, while the industrial prosumer self-sufficiency falls by 7.2%, from 53.4% to 46.2%. Similarly, the residential and industrial prosumers’ self-consumption is declining by approximately 5% and 7.6%, respectively. However, the overall energy shared is almost double with respect to the industrial scenario, reaching a value of 40,946.1 kWh.
Figure 9 shows the PV production distribution for each prosumer, which are the same as in the prior case.
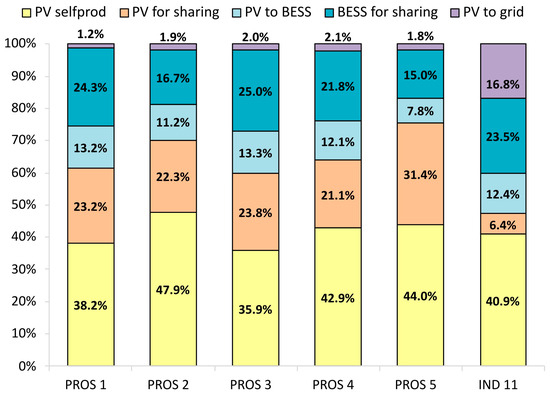
Figure 9.
Distribution of the PV production of each of the 5 residential prosumers and the industrial prosumer (rightmost bar) considered in the mixed scenario [%]. The total PV production is divided into the amount that is self-produced (PV selfprod), directly shared (PV for sharing), used to charge the BESS (PV to BESS), shared through the BESS (BESS for sharing), and exchanged to the grid (PV to grid).
As in the previous scenarios, each prosumer’s self-production remains constant, while the PV production used to charge their own BESS increases by around 7.2%, ranging from 22.8% to 38.3%. The shared PV overproduction, both directly and through the BESS, is rising with respect to the industrial scenario, reaching on average 11.4% for the residential prosumers and 18% for the industrial prosumer. In particular, the energy sharing through the BESS is nearly double that of the industrial scenario. The PV overproduction sent to the grid decreases to less than 2% for the residential prosumers. Even while the residual overproduction that is sent to the grid has been significantly reduced for the residential prosumers, it still stands at approximately 16.8% for the industrial prosumer.
In terms of load coverage, the presence of a large consumer brings KPIs back to levels comparable with the residential scenario. Indeed, whereas offices can cover 47.6% of their demand with the energy shared by the prosumers, residential prosumers cover less demand with an average energy sharing value of 42.4%, which is slightly higher than the average value in the residential scenario. Furthermore, each prosumer reduces the load covered by its own BESS system and the energy shared with the other REC members by approximately 5.2% and 1.6%, respectively. The grid’s contribution to the load rises by around 6.7% for prosumers.
4. Discussion and Conclusions
This work assesses the role and benefits of non-residential users (industrial and public buildings) joining an REC configuration. The proposed methodology employs an effective clustering approach based on the k-means algorithm and statistical characterization to create typical load profiles from real consumption data. To track all energy flows among community members, a P2P sharing mechanism is used, with a user-oriented perspective. The capacities of PV and BESS are designed to reach a specified level of self-sufficiency, applying an economic constraint to the PV and BESS investment. Three scenarios are considered to validate the model; each of them investigates a different composition of the REC members.
Taking the perspective of residential prosumers, the results stemming from the residential scenario show that the energy sharing is an outgoing energy flux from which consumers gain the most. Indeed, energy sharing provides low load coverage for prosumers, with the external grid accounting more than half of their consumption. The negligible energy sharing across prosumers may be justified by the control logic’s priority criteria, which prioritize users with larger energy deficits at each time step; in this case, these are the consumers.
When a large industrial prosumer is added to the configuration, as in the industrial scenario, the residential prosumer’s PV surplus transmitted to the grid increases due to the priority rules, which give preference in the sharing process to the prosumer with the highest level of PV surplus. However, the larger the amount of energy that can be shared, the greater the load that the residential prosumers can cover through energy sharing with the other prosumers. From the consumer’s perspective, the presence of a large industrial prosumer allows them to meet more than half of their demand with the locally produced renewable energy.
When the REC configuration includes a large commercial consumer, as in the mixed scenario, the overall energy shared increases significantly, and the BESS is better exploited for this purpose. The residential prosumers minimize their PV surplus delivered to the grid, while the industrial prosumers’ overproduction supplied to the grid remains above 15%. In terms of the ability to meet demand with local renewable energy production, the presence of a large consumer puts the REC’s residential users in a situation similar to a fully residential REC, as in the residential scenario, as the majority of the energy shared is absorbed by the large consumer, according to the priority rules set in the control logics.
Overall, the results demonstrate that a heterogenous REC is preferable for better leveraging energy sharing, and a distributed BESS made available to all REC members would play an important role in maximizing the benefits.
Indeed, future development of this study could be more focused on the economic perspective, examining the implications of non-residential users on benefit distribution. This simulation tool operates from the perspective of each individual user rather than the entire REC, allowing for more detailed research into business models that can be utilized to distribute benefits across REC members.
Author Contributions
Methodology, L.L, G.B., A.P. and V.T.; software, L.L.; validation, E.V., L.L., G.B., A.P. and V.T.; formal analysis, L.L., G.B., A.P. and V.T.; investigation, E.V. and L.L.; data curation, E.V., L.L. and G.B.; writing—original draft preparation, E.V. and L.L.; writing—review and editing, E.V., G.B., A.P. and V.T.; visualization, E.V. and L.L.; supervision, G.B., A.P. and V.T. All authors have read and agreed to the published version of the manuscript.
Funding
This research received no external funding.
Data Availability Statement
Dataset available upon request from the authors.
Conflicts of Interest
The authors declare no conflicts of interest.
References
- European Commission European Green Deal 2019. Available online: https://commission.europa.eu/strategy-and-policy/priorities-2019-2024/european-green-deal_en (accessed on 22 January 2024).
- European Commission Energy Communities Citizen-Driven Energy Actions That Contribute to the Clean Energy Transition, Advancing Energy Efficiency within Local Communities 2022. Available online: https://energy.ec.europa.eu/topics/markets-and-consumers/energy-communities_en (accessed on 22 January 2024).
- Fleischhacker, A.; Lettner, G.; Schwabeneder, D.; Auer, H. Portfolio Optimization of Energy Communities to Meet Reductions in Costs and Emissions. Energy 2019, 173, 1092–1105. [Google Scholar] [CrossRef]
- European Commission—Joint Research Centre. Energy Communities and Energy Poverty: The Role of Energy Communities in Alleviating Energy Poverty; Publications Office: Luxembourg, 2023. [Google Scholar]
- Soeiro, S.; Ferreira Dias, M. Community Renewable Energy: Benefits and Drivers. Energy Rep. 2020, 6, 134–140. [Google Scholar] [CrossRef]
- MASE Ministry Decreto CER. Available online: https://www.mase.gov.it/sites/default/files/Decreto%20CER.pdf (accessed on 8 May 2024).
- Long, C.; Wu, J.; Zhou, Y.; Jenkins, N. Peer-to-Peer Energy Sharing through a Two-Stage Aggregated Battery Control in a Community Microgrid. Appl. Energy 2018, 226, 261–276. [Google Scholar] [CrossRef]
- Secchi, M.; Barchi, G. Peer-to-Peer Electricity Sharing: Maximising PV Self-Consumption through BESS Control Strategies. In Proceedings of the 2019 IEEE International Conference on Environment and Electrical Engineering and 2019 IEEE Industrial and Commercial Power Systems Europe (EEEIC/I&CPS Europe), Genova, Italy, 11–14 June 2019; pp. 1–6. [Google Scholar]
- Aranzabal, I.; Gomez-Cornejo, J.; López, I.; Zubiria, A.; Mazón, J.; Feijoo-Arostegui, A.; Gaztañaga, H. Optimal Management of an Energy Community with PV and Battery-Energy-Storage Systems. Energies 2023, 16, 789. [Google Scholar] [CrossRef]
- Wang, J.; Zhang, J.; Li, L.; Lin, Y. Peer-to-Peer Energy Trading for Residential Prosumers With Photovoltaic and Battery Storage Systems. IEEE Syst. J. 2023, 17, 154–163. [Google Scholar] [CrossRef]
- Malik, S.; Duffy, M.; Thakur, S.; Hayes, B.; Breslin, J. A Priority-Based Approach for Peer-to-Peer Energy Trading Using Cooperative Game Theory in Local Energy Community. Int. J. Electr. Power Energy Syst. 2022, 137, 107865. [Google Scholar] [CrossRef]
- Talluri, G.; Lozito, G.M.; Grasso, F.; Iturrino Garcia, C.; Luchetta, A. Optimal Battery Energy Storage System Scheduling within Renewable Energy Communities. Energies 2021, 14, 8480. [Google Scholar] [CrossRef]
- Secchi, M.; Barchi, G.; Macii, D.; Moser, D.; Petri, D. Multi-Objective Battery Sizing Optimisation for Renewable Energy Communities with Distribution-Level Constraints: A Prosumer-Driven Perspective. Appl. Energy 2021, 297, 117171. [Google Scholar] [CrossRef]
- Belmar, F.; Baptista, P.; Neves, D. Modelling Renewable Energy Communities: Assessing the Impact of Different Configurations, Technologies and Types of Participants. Energy Sustain. Soc. 2023, 13, 18. [Google Scholar] [CrossRef]
- Cielo, A.; Margiaria, P.; Lazzeroni, P.; Mariuzzo, I.; Repetto, M. Renewable Energy Communities Business Models under the 2020 Italian Regulation. J. Clean. Prod. 2021, 316, 128217. [Google Scholar] [CrossRef]
- Barchi, G.; Pierro, M.; Secchi, M.; Moser, D. Residential Renewable Energy Community: A Techno-Economic Analysis of the Italian Approach. In Proceedings of the 2023 IEEE International Conference on Environment and Electrical Engineering and 2023 IEEE Industrial and Commercial Power Systems Europe (EEEIC/I&CPS Europe), Madrid, Spain, 6–9 June 2023; pp. 1–6. [Google Scholar]
- Povolato, M.; Prada, A.; Verones, S.; Debiasi, S.; Baggio, P. The Impact of Energy Community Composition on Its Technical and Economic Performance. Energies 2023, 16, 5247. [Google Scholar] [CrossRef]
- Sæther, G.; Crespo Del Granado, P.; Zaferanlouei, S. Peer-to-Peer Electricity Trading in an Industrial Site: Value of Buildings Flexibility on Peak Load Reduction. Energy Build. 2021, 236, 110737. [Google Scholar] [CrossRef]
- Rodrigues, D.L.; Ye, X.; Xia, X.; Zhu, B. Battery Energy Storage Sizing Optimisation for Different Ownership Structures in a Peer-to-Peer Energy Sharing Community. Appl. Energy 2020, 262, 114498. [Google Scholar] [CrossRef]
- Besagni, G.; Premoli Vilà, L.; Borgarello, M. Italian Household Load Profiles: A Monitoring Campaign. Buildings 2020, 10, 217. [Google Scholar] [CrossRef]
- Braeuer, F. Load Profile Data of 50 Industrial Plants in Germany for One Year 2020. Available online: https://zenodo.org/record/3899018 (accessed on 22 January 2024).
- Lloyd, S. Least Squares Quantization in PCM. IEEE Trans. Inf. Theory 1982, 28, 129–137. [Google Scholar] [CrossRef]
- The MathWorks Inc. MATLAB; The MathWorks Inc.: Natick, MA, USA, 1994. [Google Scholar]
- Kuraria, A.; Jharbade, N.; Soni, M. Centroid Selection Process Using WCSS and Elbow Method for K-Mean Clustering Algorithm in Data Mining. Int. J. Sci. Res. Sci. Eng. Technol. 2018, 11, 190–195. [Google Scholar] [CrossRef]
- Jolliffe, I.T.; Cadima, J. Principal component analysis: A review and recent developments. Phil. Trans. R. Soc. A 2016, 374, 20150202. [Google Scholar] [CrossRef] [PubMed]
- Open Data Sets—IEEE PES Intelligent Systems Subcommittee. Available online: https://site.ieee.org/pes-iss/data-sets/ (accessed on 17 May 2024).
- Prodotti e Servizi Innovativi per la Casa e la Mobilità|Enel X Store Italy. Available online: https://www.enelxstore.com/it/it (accessed on 22 January 2024).
- Installazione & Impianti Fotovoltaici per La Casa|Alperia. Available online: https://www.alperia.eu/it/casa/fotovoltaico (accessed on 22 January 2024).
- Holmgren, W.F.; Hansen, C.W.; Mikofski, M.A. Pvlib Python: A Python Package for Modeling Solar Energy Systems. J. Open Source Softw. 2018, 3, 884. [Google Scholar] [CrossRef]
- Huld, T.; Müller, R.; Gambardella, A. A New Solar Radiation Database for Estimating PV Performance in Europe and Africa. Sol. Energy 2012, 86, 1803–1815. [Google Scholar] [CrossRef]
- Kratochvil, J.; Boyson, W.; King, D. Photovoltaic Array Performance Model; SAND2004–3535, 919131; Sandia National Laboratories: Albuquerque, NM, USA, 2004. [Google Scholar]
- Clean Energy Council Inverters. Available online: https://www.cleanenergycouncil.org.au/industry/products/inverters (accessed on 17 May 2024).
- GoodWe GoodWe: Innovatore di Energia Intelligente. Available online: https://emea.goodwe.com/lynx-home-u-series-low-voltage-lithium-battery (accessed on 17 May 2024).
- Huawei Homepage—FusionSolar Global. Available online: https://solar.huawei.com/download?p=%2F-%2Fmedia%2FSolar%2Fattachment%2Fpdf%2Feu%2Fdatasheet%2FLUNA2000-5_10_15-S0.pdf (accessed on 17 May 2024).
- LG Product Info|LG Home Battery. Available online: https://www.lgessbattery.com (accessed on 17 May 2024).
- VP Solar Pylontech US3000—Lithium Technology—Low Voltage. VP Solar 2023. Available online: https://www.vpsolar.com/en/product/pylontech-us3000-lithium-technology-low-voltage/ (accessed on 17 May 2024).
- Tilli, F.; Maugeri, G.; Roca, F.; Scipioni, A.; Surace, V.; Pellini, A. National Survey Report of PV Power Applications in Italy 2021; IEA PVPS Task 1; IEA: Paris, France, 2021. [Google Scholar]
- Vignesh, R.; Feldman, D.; Desai, J.; Margolis, R. U.S. Solar Photovoltaic System and Energy Storage Cost Benchmarks: Q1 2021; National Renewable Energy Laboratory NREL: Golden, CO, USA, 2001. [Google Scholar]
Disclaimer/Publisher’s Note: The statements, opinions and data contained in all publications are solely those of the individual author(s) and contributor(s) and not of MDPI and/or the editor(s). MDPI and/or the editor(s) disclaim responsibility for any injury to people or property resulting from any ideas, methods, instructions or products referred to in the content. |
© 2024 by the authors. Licensee MDPI, Basel, Switzerland. This article is an open access article distributed under the terms and conditions of the Creative Commons Attribution (CC BY) license (https://creativecommons.org/licenses/by/4.0/).