Article

Photovoltaics Energy Potential in the Largest Greek Cities: Atmospheric and Urban Fabric Effects, Climatic Trends Influences and Socio-Economic Benefits

by
Stavros Vigkos
and
Panagiotis G. Kosmopoulos
*
Institute for Environmental Research and Sustainable Development, National Observatory of Athens (IERSD/NOA), 15236 Athens, Greece
*
Author to whom correspondence should be addressed.
Energies 2024, 17(15), 3821; https://doi.org/10.3390/en17153821
Submission received: 28 May 2024 / Revised: 27 July 2024 / Accepted: 30 July 2024 / Published: 2 August 2024
(This article belongs to the Section B: Energy and Environment)

Abstract

:
This comprehensive study explores the influence of aerosols and clouds on solar radiation in the urban environments of nine of Greece’s largest cities over the decade from 2014 to 2023. Utilizing a combination of Earth Observation data, radiative transfer models, and geographic information systems, the research undertook digital surface modeling and photovoltaic simulations. The study meticulously calculated the optimal rooftop areas for photovoltaic installation in these cities, contributing significantly to their energy adequacy and achieving a balance between daily electricity production and demand. Moreover, the research provides an in-depth analysis of energy and economic losses, while also highlighting the environmental benefits. These include a reduction in pollutant emissions and a decrease in the carbon footprint, aligning with the global shift towards local energy security and the transformation of urban areas into green, smart cities. The innovative methodology of this study, which leverages open access data, sets a strong foundation for future research in this field. It opens up possibilities for similar studies and has the potential to contribute to the creation of an updated, comprehensive solar potential map for continental Greece. This could be instrumental in climate change mitigation and adaptation strategies, thereby promoting sustainable urban development and environmental preservation.

1. Introduction

With the world’s energy needs growing and sustainable solutions becoming more and more critical, this study seeks to add to the continuing conversation in the field of energy research. Because energy problems are complex, our research takes a broad approach by incorporating a variety of methods and viewpoints. Our goal is not only to contribute to the body of current knowledge but also to encourage further research and creativity in the quest for sustainability and energy adequacy, efficiency, and sufficiency. We think that our research will be helpful in navigating the complexity of the energy environment and may also have implications for policy, technology, and strategic planning in the energy industry.
Remote sensing, a process that gathers information about objects or phenomena without direct contact, is a versatile tool used across various fields, including geophysics, geography, land surveying, and virtually all Earth science disciplines. This technique can be broadly classified into two categories: passive sensing and active sensing. Passive sensors primarily detect radiation emitted or reflected by an object or its surroundings, with reflected sunlight being the most common source of radiation these sensors detect. This brings us to the concept of solar radiation, also known as the solar resource or simply sunshine. It refers to the broad spectrum of electromagnetic radiation released by the Sun. This solar radiation can be harnessed and converted into useful forms of energy, such as heat and electricity, using various devices. The power per unit area received from the Sun in the form of electromagnetic radiation within the wavelength range of the measuring instrument is defined as solar irradiance. Solar energy, the radiant light and heat from the Sun, can be harvested using a range of methods. These include solar power for electricity generation, solar thermal energy for heating, and solar architecture. As a significant source of renewable energy, the methods of harnessing solar energy are generally classified as passive or active solar, depending on how they capture, distribute, and convert solar energy into power [1,2].
Solar radiation measurements are crucial in assessing the potential of solar energy resources. Remote sensing techniques play a pivotal role in determining the geographical distribution of solar radiation and forecasting solar irradiance. This solar irradiance is employed to calibrate visible band sensors onboard satellite remote sensing systems. According to certain climatological studies, even modest fluctuations in solar irradiance, caused by solar activity over days or decades, can influence Earth’s temperature. Remote sensing data also aids in the planning and management of solar energy output. Such planning facilitates the transition to green energy, the integration of solar energy into the power grid, and the development of regulations and markets for solar energy. Remote sensing can assist in pinpointing optimal locations for infrastructure, such as hydroelectric, solar, and wind power plants. Machine learning enables the identification of solar panels worldwide. It has been used to compile an inventory of global solar panel installations, revealing a significantly higher number than previously reported. These findings will bolster efforts to achieve global solar energy goals [3].
The European Union (EU) has been at the forefront of the green transition and is making considerable progress towards achieving a sustainable future. As part of the EU Mission, 100 towns have been chosen to be carbon neutral and smart by 2030. These cities are at the forefront of novel techniques to rapidly reduce emissions, and NetZeroCities is assisting them in their transformational efforts. To assist this cause, the European Commission created the European Green Deal, which aims to make Europe carbon neutral by 2050. The goal is not just to reduce greenhouse gas emissions, but to create a new growth strategy that is sustainable and inclusive. This requires a multifaceted approach that includes lowering greenhouse gas emissions, supporting green technologies, developing sustainable industries and transportation, and decreasing pollution. The Commission also aids EU Member States in developing and implementing reforms to promote the green transition. PowerEU is executing the REPowerEU Plan as a reaction to the global energy market disruption created by Russia’s invasion of Ukraine. This strategy seeks to preserve energy, generate sustainable energy, and diversify energy sources. As a consequence, the EU has decreased its reliance on Russian fossil fuels, conserved about 20% of its energy consumption, and more than quadrupled its renewable energy deployment. They provide regulatory guidance, financial support, and technical assistance to member states, helping them implement their energy transition strategies. These efforts are not just about energy transition; they are about building a sustainable future where economic growth goes hand in hand with environmental protection [4,5,6].
The need for a green transition is clear, given that we are now overconsuming both fossil and renewable natural resources. This overconsumption exacerbates the climate and ecological catastrophe, needing a complete shift in our resource utilization. Mitigation and adaptation are complimentary techniques for coping with climate change. Mitigation entails lowering greenhouse gas emissions to prevent global warming, whereas adaptation entails preparing for the current and future consequences of climate change. These initiatives by the EU and other organizations are part of a worldwide effort to combat climate change and transition to a more sustainable future [7,8].
The escalating impacts of climate change have underscored the urgency of transitioning to renewable energy sources. As global temperatures increase and catastrophic weather events become progressively more frequent, the demand for sustainable energy solutions has never been more apparent. Among these, solar photovoltaic (PV) systems have emerged as a promising solution. Harnessing the power of the sun, these systems offer a clean, renewable source of energy that can help mitigate the effects of climate change. Particularly in urban environments, rooftop solar PV systems present a unique opportunity. Urban areas, typically with high energy consumption and dense building structures, are ideal for the integration of solar PV. These systems can be installed on rooftops, transforming underutilized spaces into renewable energy sources. This not only contributes to the energy mix but also enhances the sustainability of urban environments.
Greece encounters a high amount of sun insolation, making it an excellent site for solar energy production. Solar radiation maps can be used to study the solar potential of Greece, from Athens to Rhodes. These maps show real-time and predicted irradiance and PV power data using three-dimensional modeling. The overall energy potential for each ground station in Greece is between 1.5 and 1.9 MWh/m2 [9,10]. Greece also added 1.36 Gigawatts of new solar capacity in 2022, three times as much as it did in 2021. Solar energy accounted for 12.6% of total electricity generation in Greece in 2022. The ratio of renewables in the country’s electrical mix increased by more than 15 percentage points, reaching more than 50 percent in 2023. From 2018 to 2022, solar capacity in Greece increased from 2.6 to 5.3 GW [11,12].
The National Energy and Climate Plan (NECP) forecasts that solar PV capacity would increase from 4.8 GW in 2022 to 14.1 GW in 2030 and 34.5 GW in 2050. Greece has the second highest theoretical photovoltaic penetration, indicating the country’s potential for solar energy generation. The country deployed an additional 1.4 GW of capacity and is one of only nine countries with solar penetration rates of more than 10% [13]. Moreover, Greece has established a EUR 200 million household solar-plus-battery subsidy program. This program enables Greek homeowners and farms to apply for public post COVID-19 pandemic recovery money to help with the purchase and installation of small PV panels and energy storage systems. Households are allowed to install up to 10.8 kW of PV capacity and 10.8 kWh of battery storage. The program also includes summer houses, although, applicants can only claim money for one residential installation [14].
To summarize, Greece has a significant potential for solar energy generation due to its advantageous geographic position and strong government backing. The government is making tremendous progress in expanding its solar capacity and encouraging the usage of renewable energy sources.
Nevertheless, the route to this green transformation is filled with obstacles. It necessitates not just technological advancements, but also regulatory reforms, financial investments, and widespread acceptance. Furthermore, it needs a paradigm shift in how we generate and use energy. Overcoming these difficulties will need collaborative efforts from all stakeholders, including governments, corporations, and individuals. The purpose of this research, complying with Q2, Q4, Q5, and O13 JEL Codes, is to investigate the potential of rooftop solar PV systems in Greek urban contexts, taking into account the EU’s climate neutrality goal and the many initiatives launched by the European Commission and PowerEU. It will look at the opportunities and difficulties of this transformation, as well as potential ways for overcoming them, and provide policy and practice suggestions.
The following sections deal, respectively, with the material and methods used, the corresponding results obtained, the extensive discussion on them, the most important conclusions that can be drawn, a brief appendix (Appendix A) to compare and confirm the findings of the present study with previous research, and finally the necessary bibliography and references.
The presence of aerosols and clouds significantly influences solar radiation in urban environments, affecting the optimal rooftop areas for photovoltaic installation, and thereby impacting energy adequacy, economic losses, and environmental benefits in Greece’s largest cities. Therefore, let us first start by delving a little into the methodology behind quantifying the relationship between aerosols, clouds, and solar radiation, and their subsequent effects on photovoltaic potential and urban energy sustainability.

2. Materials and Methods

2.1. Data Sources

For the purposes of this study, Earth Observation data sources and technologies were employed to estimate the climatological levels of solar energy potential as well as the effect of atmospheric conditions. In this context, we utilized the Copernicus Atmosphere Monitoring Service (CAMS) [15] and the total Aerosol Optical Depth (AOD) at 550 nm to investigate the influence of aerosols on solar energy generation. To provide consistent data correction, we combined aerosol modeling with MODIS satellite AOD data assimilation [16,17]. Cloud optical characteristics were obtained using EUMETSAT’s Satellite Application Facility for Nowcasting (SAFNWC) and very short-range forecasting [18]. In addition, NASA’s Giovanni Area-Averaged of Combined Dark Target and Deep Blue AOD at 0.55 micron for land and ocean (monthly) [19] datasets that provide information regarding air quality and pollution levels, aerosol impacts on climate, weather, and human health and validation and improvement of satellite retrievals were also incorporated.
Moreover, urban fabric density data, more specifically land cover and land use data, alongside height information in the spatial resolution of 10 m for core urban areas, from the Copernicus Urban Atlas (CUA) [20] were also used and maps of the cities downloaded from OpenStreetMap [21] that we processed appropriately with the QGIS [22] system to estimate the building footprints of all nine cities of interest.

2.2. Solar Energy Simulation

To assess the power production from solar arrays, the amount of sunlight that hits the PV panels must be estimated. PV takes advantage of irradiance known as global horizontal irradiation (GHI). Lower GHI values suggest a greater likelihood of clouds, increased air pollution, or simply lower solar elevation levels. The simulations of climatological solar radiation were performed using the SODAPRO service [23,24]. The Photovoltaic Geographic Information System (PVGIS) [25] was also used to collect data on solar radiation and PV system energy generation, as well as to carry out reliable numerical computations. Furthermore, it is critical to understand the entire amount of losses incurred by systems in real-world solar applications. Thus, we employed reliable licensed systems in protocols from all over the world based on the International Energy Agency (IEA). In the beginning, several major magnitudes must be indicated while calculating aerosol quantification. Aerosols, in particular, may block sunlight by scattering and absorption, and the Aerosol Optical Depth (AOD) is a dimensionless measure of direct solar irradiation attenuation caused by particulate matter at ground level. The CAMS daily predictions include total AOD as well as specific values for sea salt, desert dust, organic matter, black carbon, and sulphate aerosols. A score of 0.01 corresponds to an exceedingly clean environment, whereas 0.4 corresponds to a highly foggy state [26,27].
In accordance with the data and methodologies mentioned above, the effect of aerosols on solar energy was measured in terms of the Aerosol Modification Factor (AMF), which can be determined as follows:
AMF = GHI0/GHI00
where GHI0 indicates clear sky radiation and GHI00 denotes clean (aerosol-free) and clear (cloud-free) sky radiation.
In addition, the cloud’s optical thickness (COT) is a dimensionless metric of irradiation attenuation produced by the cloud’s optical properties and microphysics. Clouds scatter and reflect the largest portion of visible light instead of absorbing it. The Cloud Modification Factor (CMF) is computed using the approach below to assess the effect of clouds on solar energy:
CMF = GHI/GHI0
where GHI denotes radiation under all sky conditions and GHI0 represents radiation under clear sky conditions. The measurable quantities AMF and CMF can take any value within the interval from 0 to 1, with 1 representing clear sky GHI0 (meaning no cloud impact) and all lower values showing GHI with cloud effect. A GHI00 rating of 1 indicates an altogether clean and clear sky. This method assesses the individual effects on solar energy owing to aerosols and to clouds separately.

2.3. Shadowing in Urban Environments

The shadow modification factor, commonly known as the shading factor, measures the amount of possible shade on a solar panel. It displays the proportion of the PV field that is shaded in relation to the total sensitive area for a particular sun orientation. The shading factor can take values ranging from 0 to 1: 0 indicates that there is no shade and the solar panel is totally exposed to sunlight. A score of 1 indicates that the solar panel is entirely shaded, which means it is completely in the shadow and does not receive direct sunlight [28,29].
Shadow casting in complicated city layouts, such as Athens, Greece, is a dynamic process involving a variety of components. Building and tree shadows may greatly reduce pedestrian radiation burden, hence enhancing thermal comfort, particularly in densely populated areas. However, this may reduce ventilation. Trees of various species and morphological features have varying sun attenuation capability, and hence thermal comfort control potential. As a result, understanding tree planting and shadow casting holistically and contextually can aid in the construction of climate-proof communities. Shadow casting is also important in decreasing the urban heat island effect, which is especially important in places like Athens with warm weather. Shadow casting is also crucial in urban design for lighting. The Orbit Urban Office Campus in Athens, for example, employs a mix of warm and cold white light to highlight the environment and the building’s unique design. The gentle shadows generated by the façade plants on each level give a subtle element to the overall design. The presence of shade trees with varied leaf area densities (LAD) can have a considerable influence on the microclimate and thermal feeling in an urban open space [30,31].
There are various obstacles to accurately predicting shadows in complicated city layouts. Shadow analysis is a spatiotemporal, computationally intensive task. Urban shadows are caused by the complicated spatial interplay of many elements in the built environment, such as topography, buildings, other constructed infrastructure, and vegetation. A thorough shadow analysis must be computed for every single day and across the daily exposure cycle over the course of the year. Most urban shadow analysis methods have so far avoided large processing costs by portraying urban complexity primarily through simple geometric models. The simplification process eliminates details, reducing the amount of realism in the end output. They are only able to handle 2.5D data, a simplified depiction of the complicated urban environment. As a result, these approaches fail to account for complex vertical structures, and DSM/DEM resolution and accuracy have a substantial influence on accuracy and performance [32,33]. Shadow matching has demonstrated its ability to offer precise placement in crowded metropolitan environments. The problem today is to make it sufficiently dependable and efficient for use in professional and consumer applications. Shadow matching must be compatible with a variety of contexts. Variations in building heights, roadway widths, vegetation, and other elements that might affect shadow patterns are all considered. These difficulties underscore the importance of advanced computational tools and high-resolution data for effectively predicting shadows in complicated urban landscapes [34].
The analysis of building heights in cities is closely related to shadow casting. The height of a building can significantly influence the length and direction of the shadows it casts. This is particularly important in urban environments, where shadows can affect various factors, such as pedestrian comfort, energy use in buildings, and the urban heat island effect. Shadows are utilized to derive the height of the building from high-resolution satellite images with metadata [35]. The suggested method is divided into two steps: (1) rooftop and shadow extraction and (2) height estimate. Manual/automatic methods are used to extract the rooftop and shadow region, using examples and rule-based approaches. After feature extraction, the next step is to estimate the building’s height using the Ratio Method and the sun-satellite geometry relationship. Furthermore, the building shadow is identified and defined by studying its properties in remote sensing pictures. Various shadow-based building height estimate models have been built in various settings. A shadow regularization extraction approach is suggested that successfully addresses the problem of mutual adhesion shadows in densely populated locations [36]. Therefore, the analysis of building heights is crucial for accurate shadow prediction, which in turn is essential for urban planning, building design, and environmental studies [37,38,39]. Figure 1 and Figure 2 below basically graphically condense the entire research.

3. Results

3.1. Urban Fabric Density

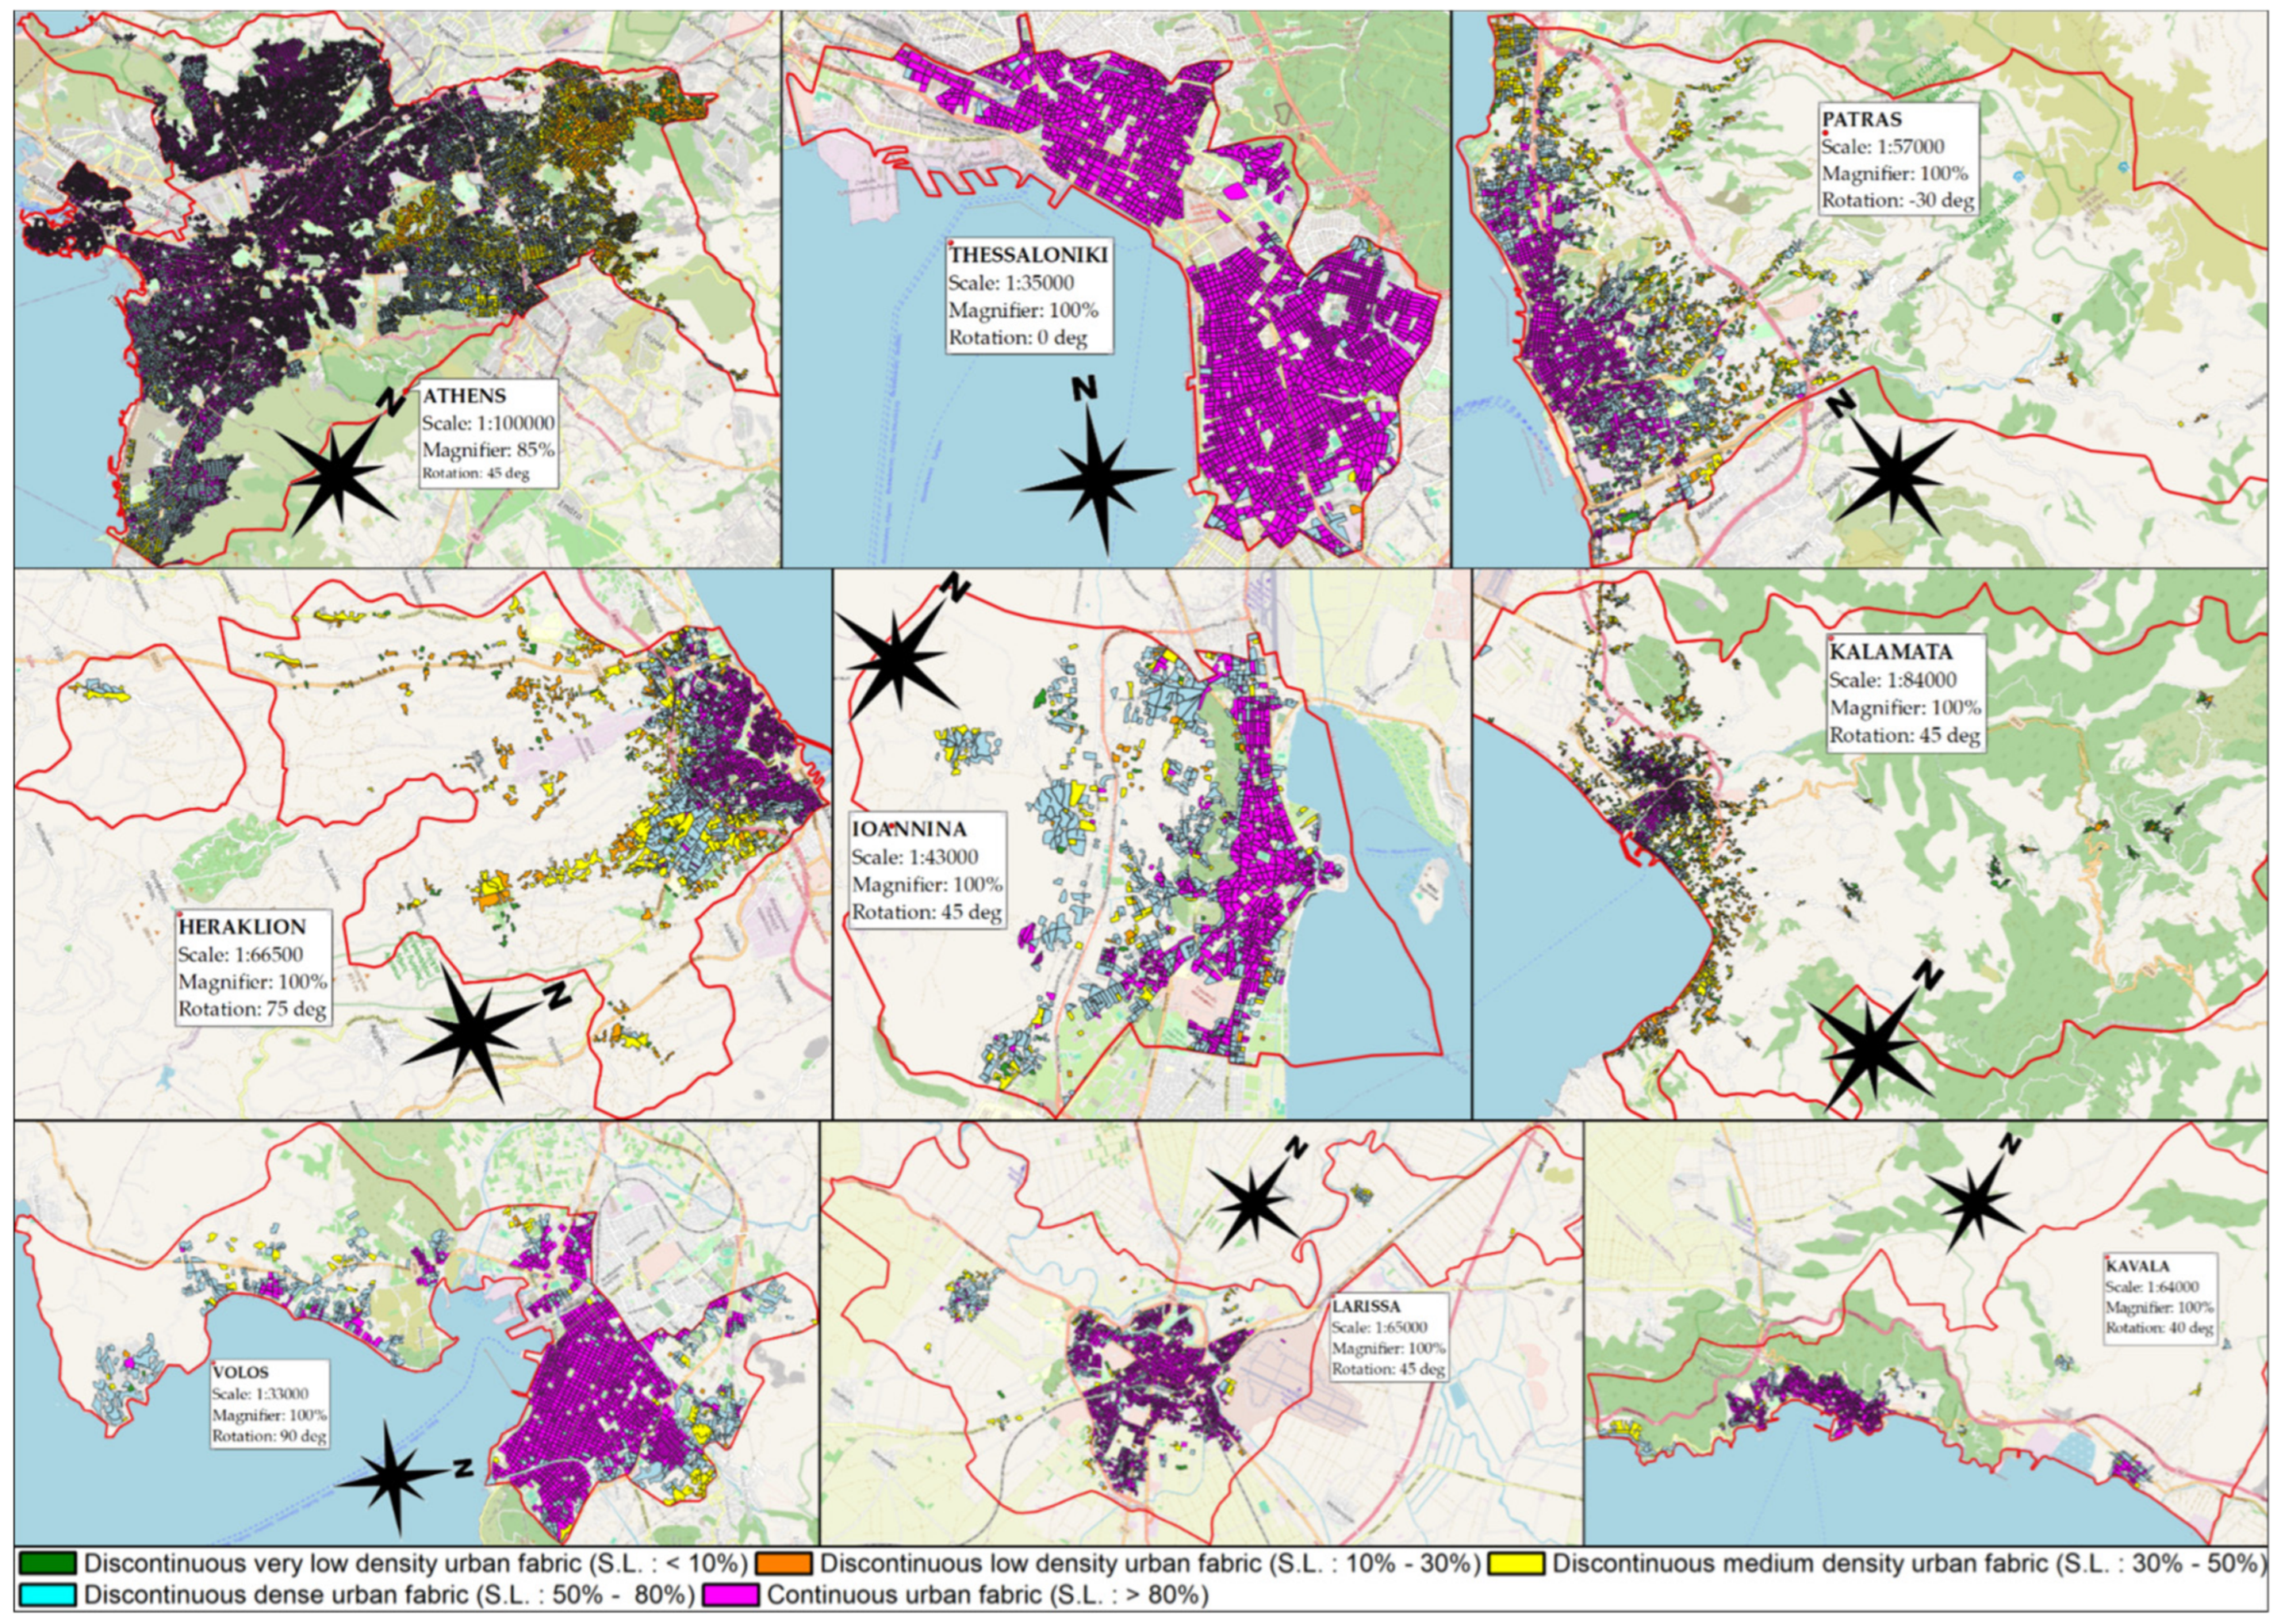
Figure 3 shows a summary panel of the nine city maps in QGIS, where the distribution of the five main urban fabric density classes of interest is represented (Continuous Urban Fabric (S.L. > 80%)—magenta, Discontinuous Dense Urban Fabric (S.L.: 50–80%)—light blue, Discontinuous Medium Density Urban Fabric (S.L.: 30–50%)—yellow, Discontinuous Low Density Urban Fabric (S.L.: 10–30%)—orange, Discontinuous Very Low Density Urban Fabric (S.L. < 10%)—green) within the urban core (red border) of each city. Also noted for completeness are the minor adjustments made to each map in terms of North marking, scale, zoom, and angle of rotation of each map to maximize the best possible display of all maps at once. It is easily observed that in all cities there is a variety in the distribution of classes, sometimes lower and sometimes higher. Athens shows the greatest diversity in terms of the distribution and number of classes (expected after all due to its large area and the total population it hosts [40]), while Larissa and Kavala are characterized by limited representation of the multitude of different class features. A big exception is Thessaloniki, which in its urban core is clearly dominated by the Continuous Urban Fabric (S.L. > 80%) class.
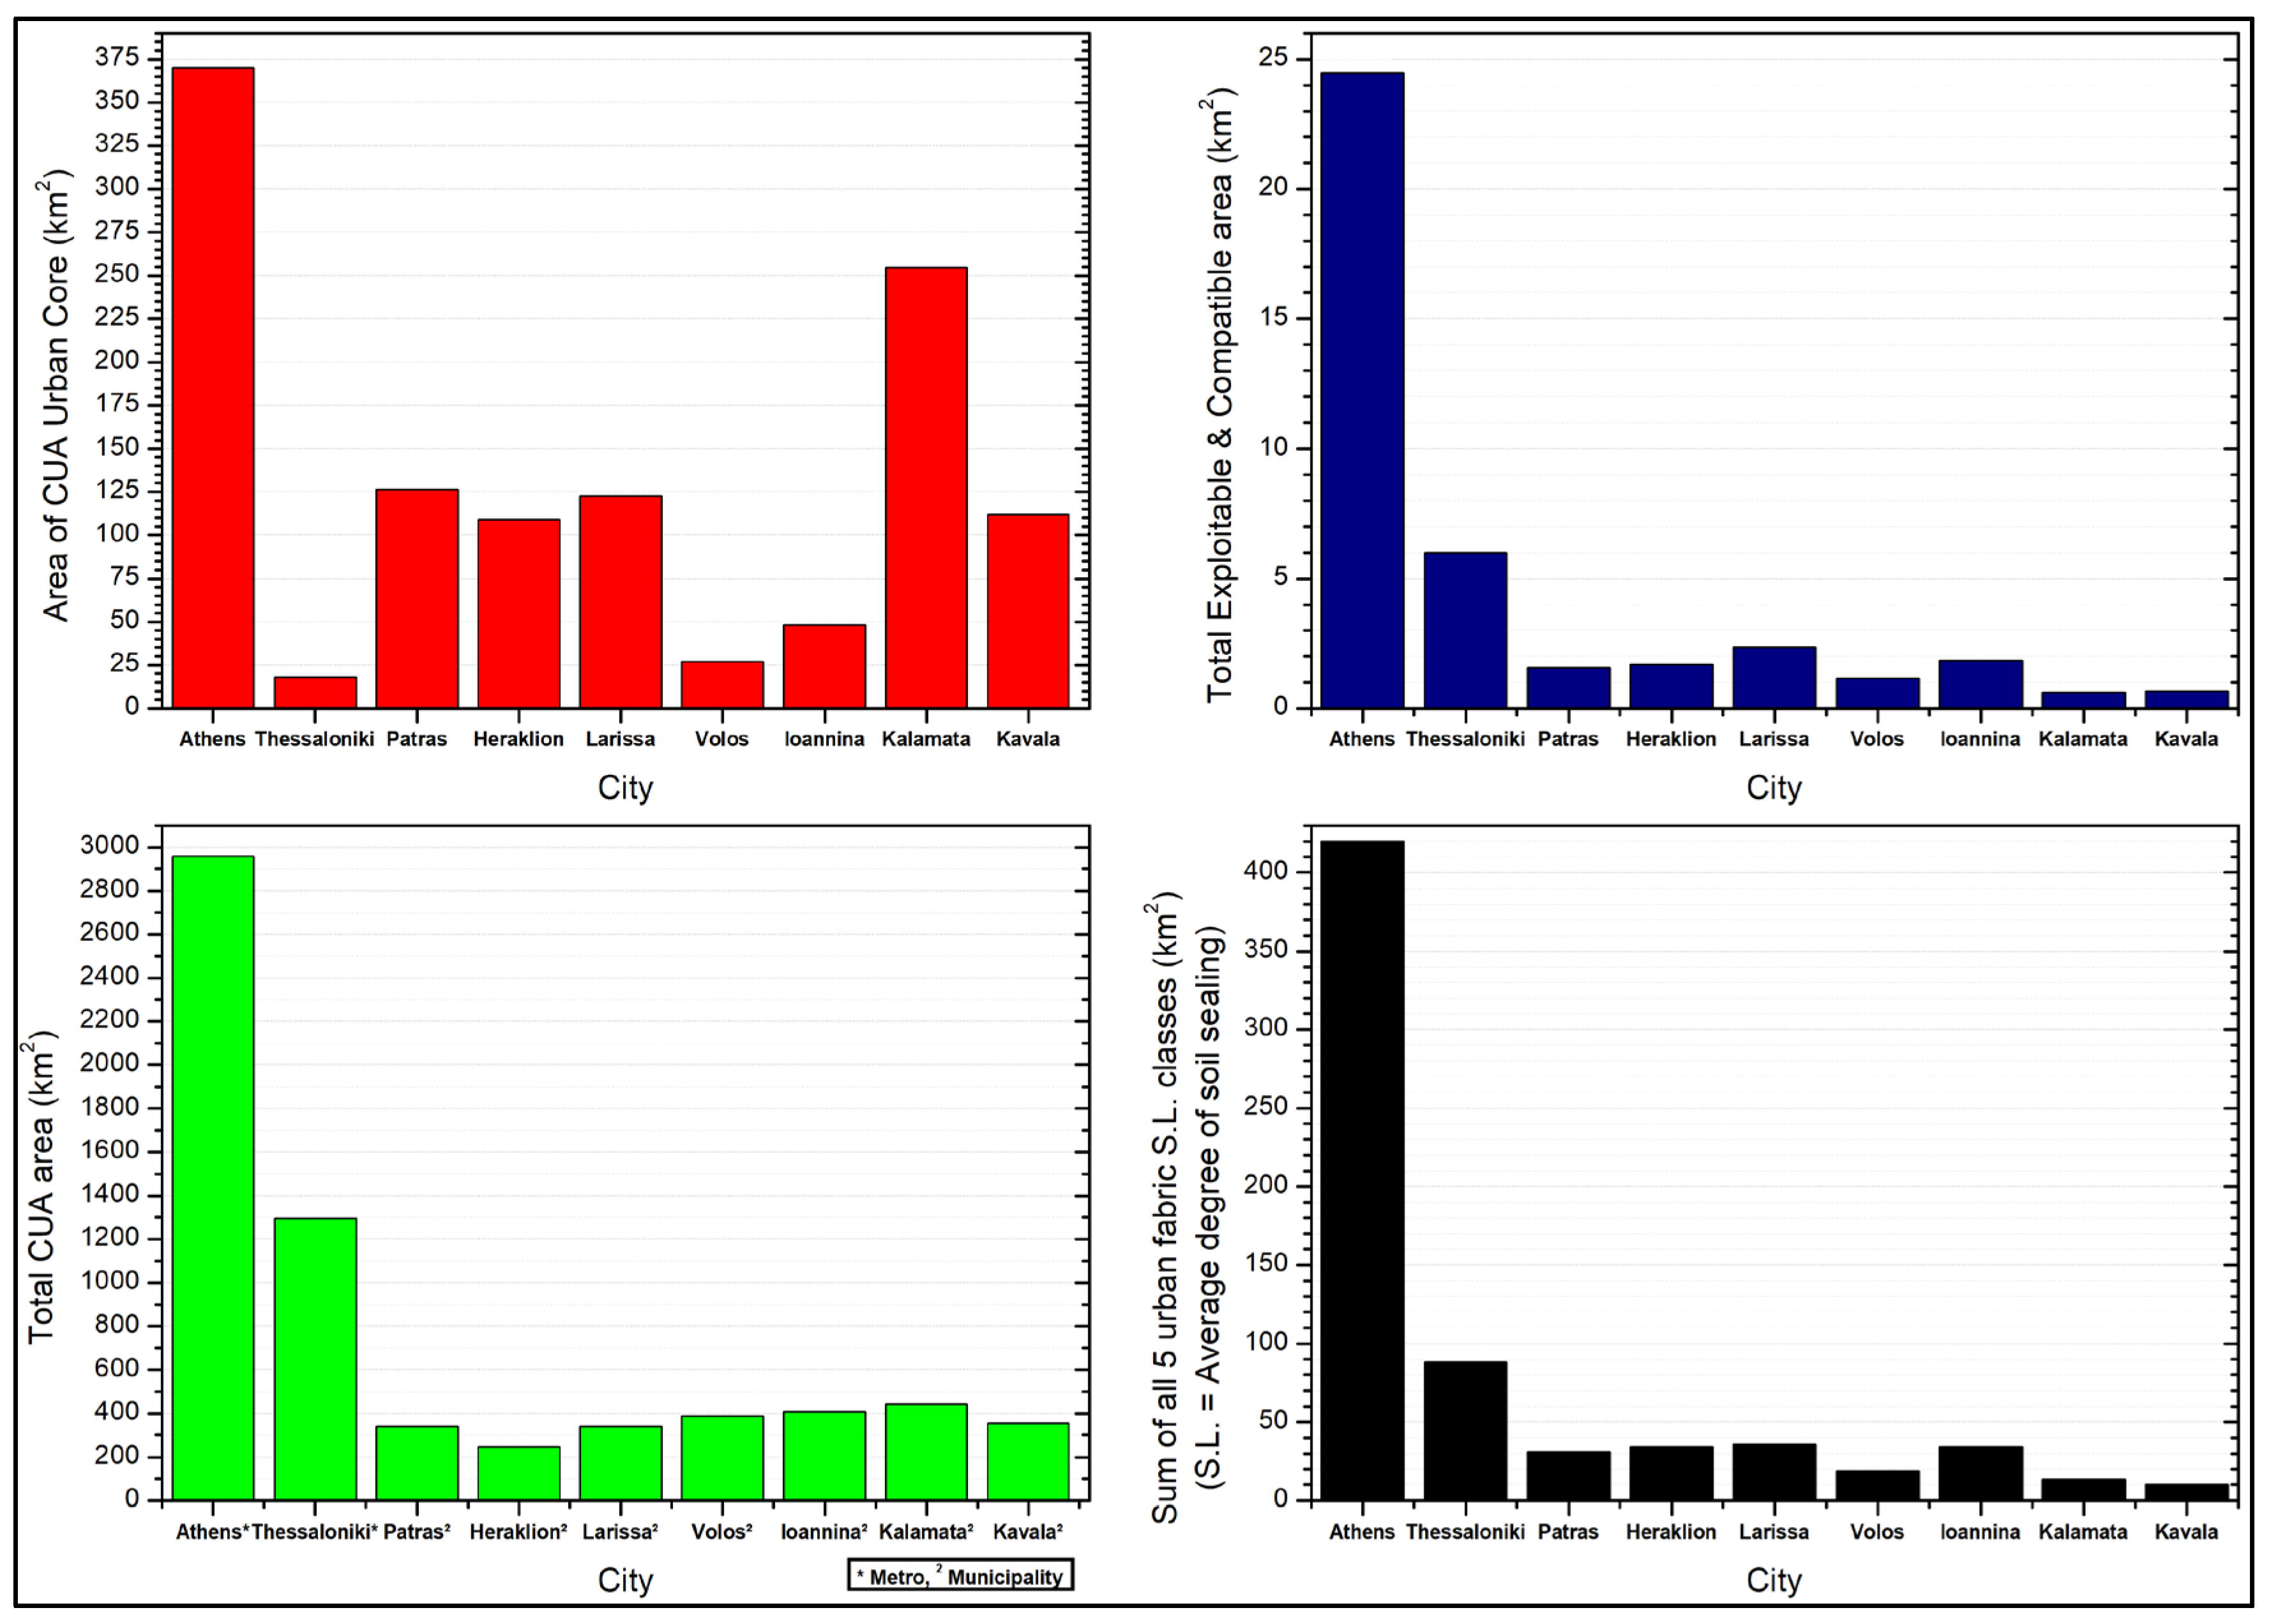
Then, Figure 4 follows immediately, where four column graphs are presented in aggregate and which represent for each city the total area of the entire city from the CUA map (green), the corresponding area of the urban core (red), the cumulative total area of the five classes (black), and the final total exploitable and compatible area corresponding to the rooftops of the city buildings where photovoltaic solar panels can be installed (navy). The latter can be derived by multiplying the total area of each of the five different classes by two individual factors and obviously adding them at the end. The first coefficient is a building density factor, which essentially reflects the percentage of the building footprint contained within a class and can be relatively easily calculated by dividing the OpenStreetMap building footprint contained within each of the five classes by that class at a time. The second coefficient is related to rooftop PV coverage and is the final product of three other sub-factors: building density, PV compatibility, and PV exploitability [20]. It should be clarified that for the total area of each city, the value directly calculated from the attribute table in QGIS is not represented, as in some cities there was a gross overestimation. Therefore, in cities where there is very good agreement between CUA and internet sources, the ratio of CUA area to actual area was calculated instead, and then the areas of the remaining cities where there was a large overestimation were multiplied by this ratio. In the end, the resulting values are very realistic.
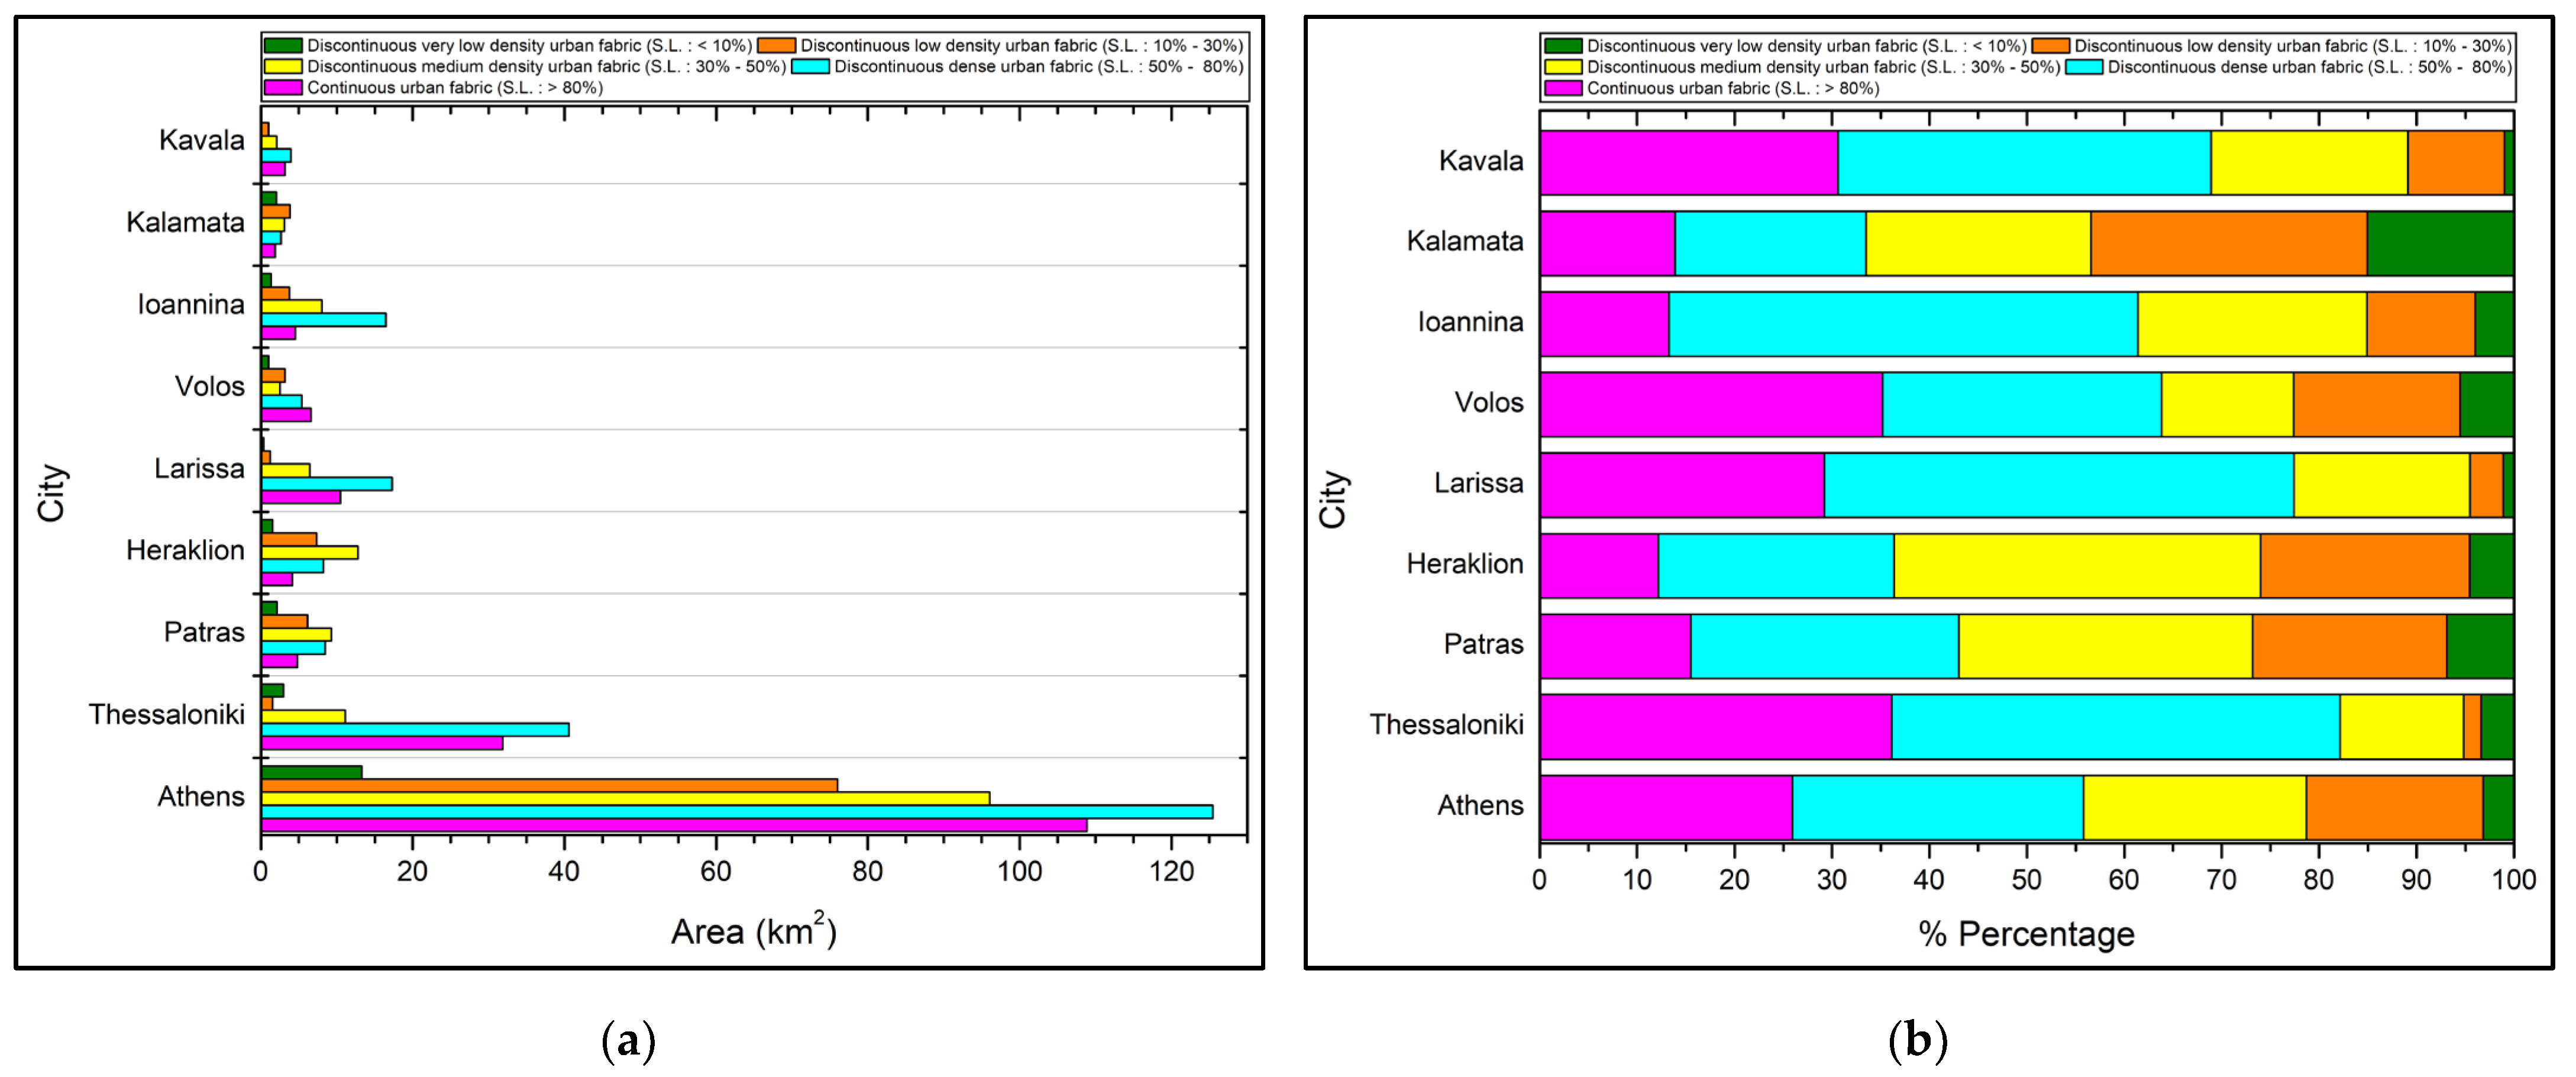
Next, in Figure 5, the quantitative graphical visualization of the data that can be interpreted from Figure 3 with the maps of the nine cities is depicted. Figure 5a presents the areas of the individual classes for each city, while Figure 5b represents the percentage out of 100 occupied by each class to the total area of all five classes together in each city. Both figures together confirm the visual variety of classes in the majority of cities, the predominance of Continuous Urban Fabric (S.L. > 80%) and Discontinuous Dense Urban Fabric (S.L.: 50–80%) in Thessaloniki, and the very little to marginally zero representation of Discontinuous Very Low Density Urban Fabric (S.L. < 10%) in Larissa and Kavala. Directly below Figure 5 is Table 1 which presents all the results of processing the urban fabric density data of each city.

3.2. Aerosol and Cloud Effect on Solar Radiation

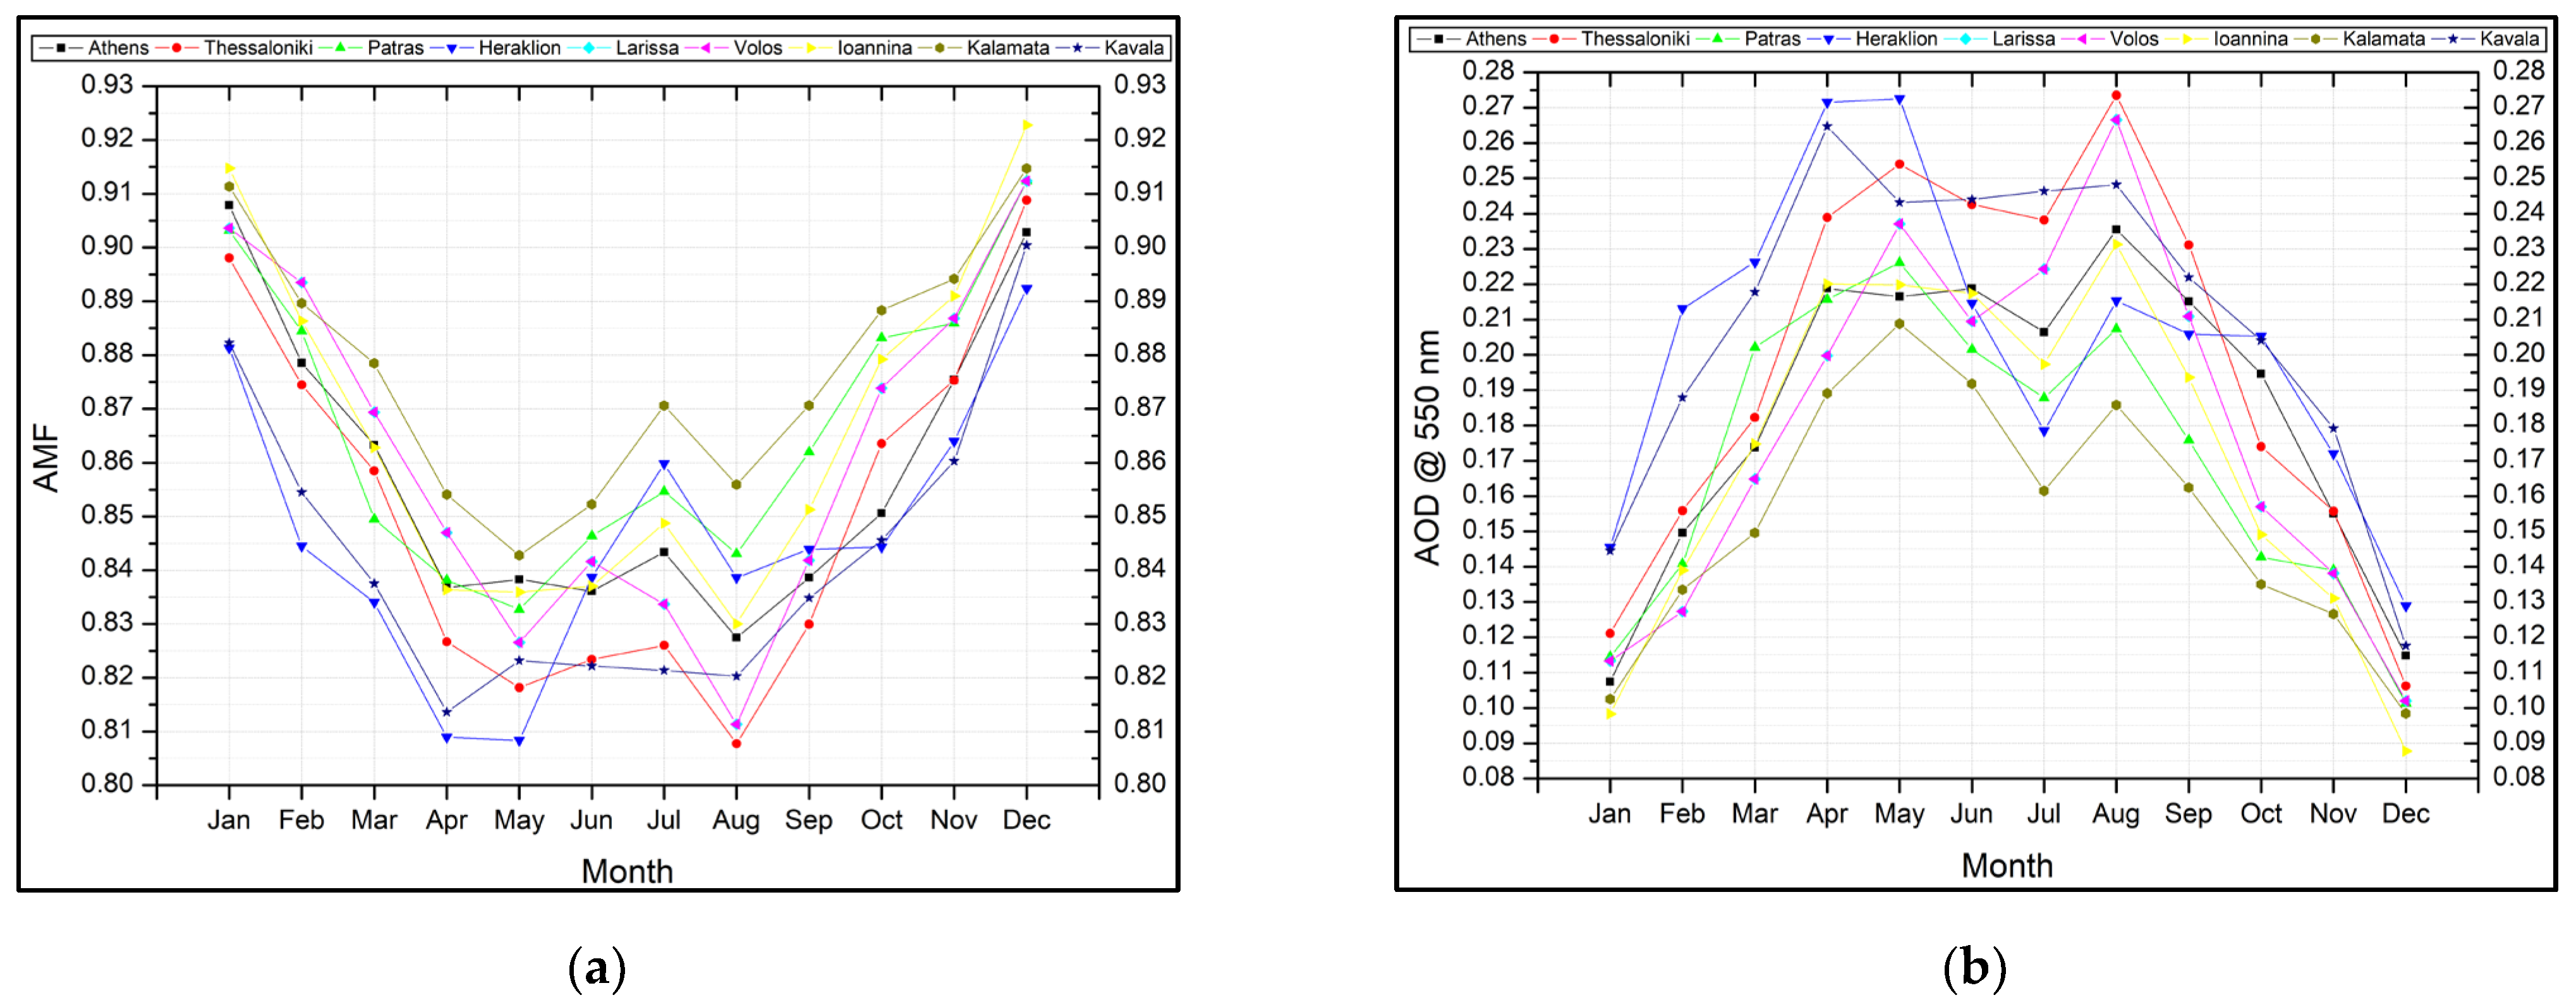
In Figure 6, the monthly changes of AMF and AOD @550 nm are juxtaposed. On the one hand, Figure 6a shows the decrease in AMF values for all Greek cities during spring and summer, which is consistent with the usual meteorological and climatic conditions in this period [41,42], such as the observed increased pollen levels and dust transported from North Africa and the Sahara, particles of marine origin that especially due to strong summer winds (etesians—“meltemia”) can be transported and affect the quality and composition of the air in coastal cities such as Volos, or even particles of burnt biomass from wildfires which, unfortunately, are anything but a rare phenomenon nowadays on the Greek mainland especially and the annual Greek summer reality in general. For instance, the fact that the bottom curve corresponds to Heraklion can be easily justified since the city is located on the island of Crete and by extension at the closest distance from North Africa and therefore the most directly affected area by the Saharan dust. On the other hand, Figure 6b horizontally mirrors the data from its adjacent figure and apparently confirms the higher concentration of aerosols during the spring and summer months and is in complete agreement with the recent existing literature [43,44,45,46,47,48].
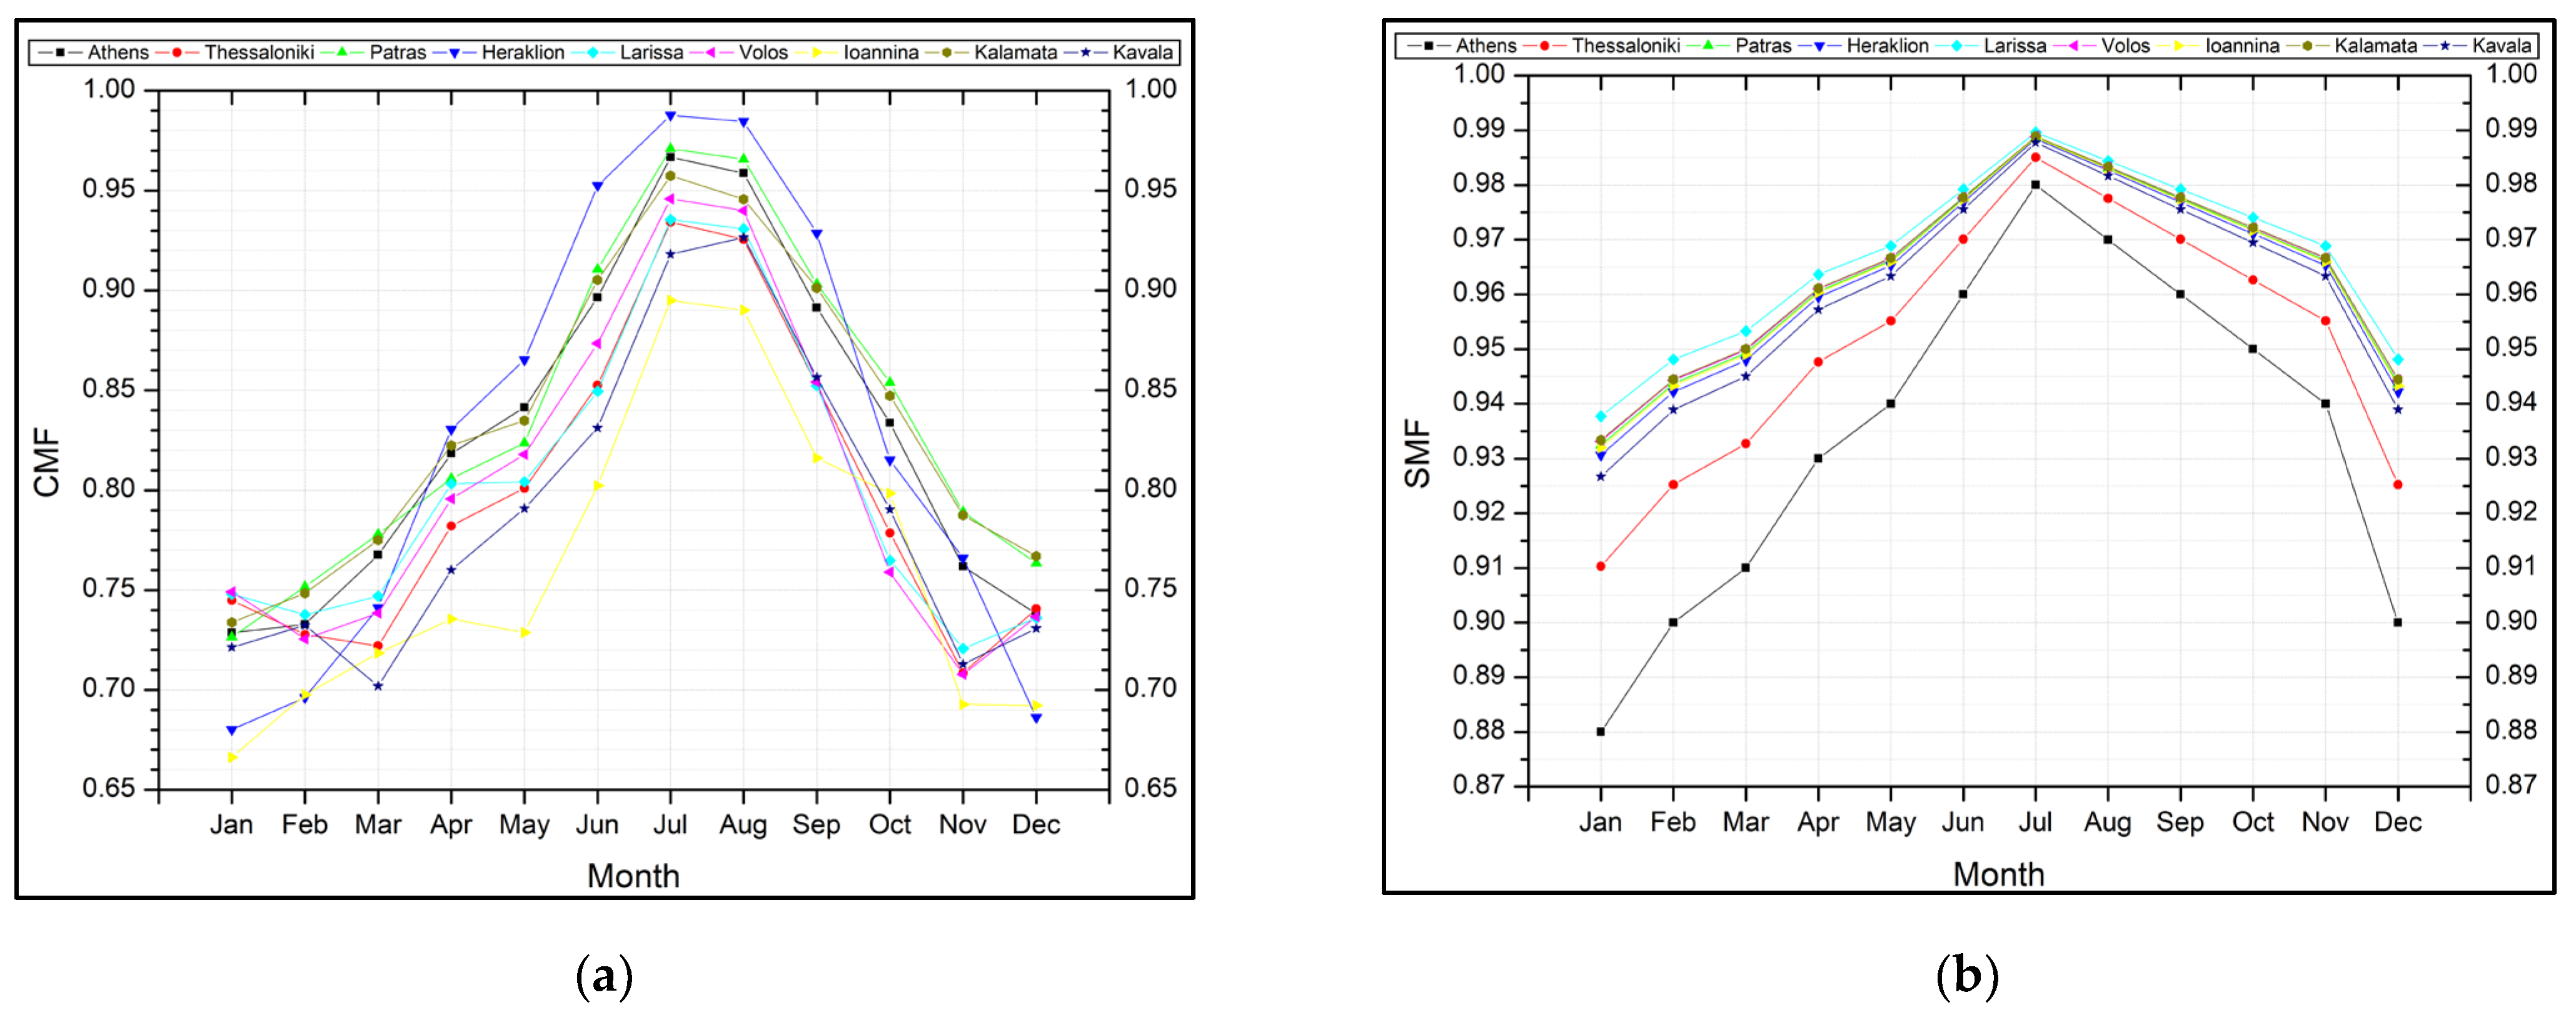
Next follows Figure 7, which deals with the variations of cloudiness as well as shading in the nine cities over the course of the year. Figure 7a shows the monthly change of the CMF, while Figure 7b shows the monthly change of the Shadow Modification Factor (SMF). Several components can contribute to overall sun shadowing. There are environmental obstacles, such as trees, surrounding buildings, and other physical structures that can cast shadows on solar panels. Self-shading happens when panels are arranged in parallel rows. The panels in the front row may cast shadows on the panels in the rear row. Furthermore, the horizon shadowing is induced by the topography around the installation location. In addition, the collection of dirt and dust on the surface of the solar panels can produce shade, but bird droppings that cover sections of the solar panels, leaves falling from trees, snow accumulation, and even lichen development on the solar panels can all cause further shading.
In this particular study, the emphasis was focused on the first aforementioned categories, mostly trees, surrounding buildings and other physical structures. As shown in Table 2, regarding the average heights of the five classes above 3 m, as well as all five classes in total for each city, it is reasonable to expect the SMF values in Athens to fluctuate at the lowest level, given that Athens has the highest average height.
In Figure 8, the monthly variations of CMF, AMF, and SMF are simultaneously plotted. It is observed that the latter two have a similar range of values, while the former has at least twice as much.
The figure above represents the annual variation of the three key factors: the Shadow Modification Factor (SMF), Cloud Modification Factor (CMF), and Aerosol Modification Factor (AMF). These factors play a significant role in understanding the impact of different environmental elements on solar radiation. The Shadow Modification Factor (SMF) shows a higher impact in winter due to lower solar elevation levels. The values range from 0.924 in January to a peak of 0.987 in July, before decreasing again towards the end of the year. This pattern reflects the sun’s lower position in the sky during winter months, resulting in longer shadows and thus a higher SMF. The Cloud Modification Factor (CMF) indicates the impact of cloud cover on solar radiation. The values show a higher impact in winter, spring, and autumn, with a minimum of 0.722 in January and a maximum of 0.946 in July. This suggests that cloud cover is less in the summer months, allowing for more direct sunlight and thus a lower CMF. Lastly, the Aerosol Modification Factor (AMF) represents the impact of aerosols, such as dust and pollen, on solar radiation. The values indicate a higher aerosol impact during spring and summer, ranging from 0.877 in February to a peak of 0.909 in December. This could be attributed to increased levels of dust and pollen in the air during these seasons. In summary, these factors provide valuable insights into the seasonal variations in solar radiation and the influence of shadows, clouds, and aerosols. Understanding these patterns can help in optimizing the use of solar energy and in climate modeling.
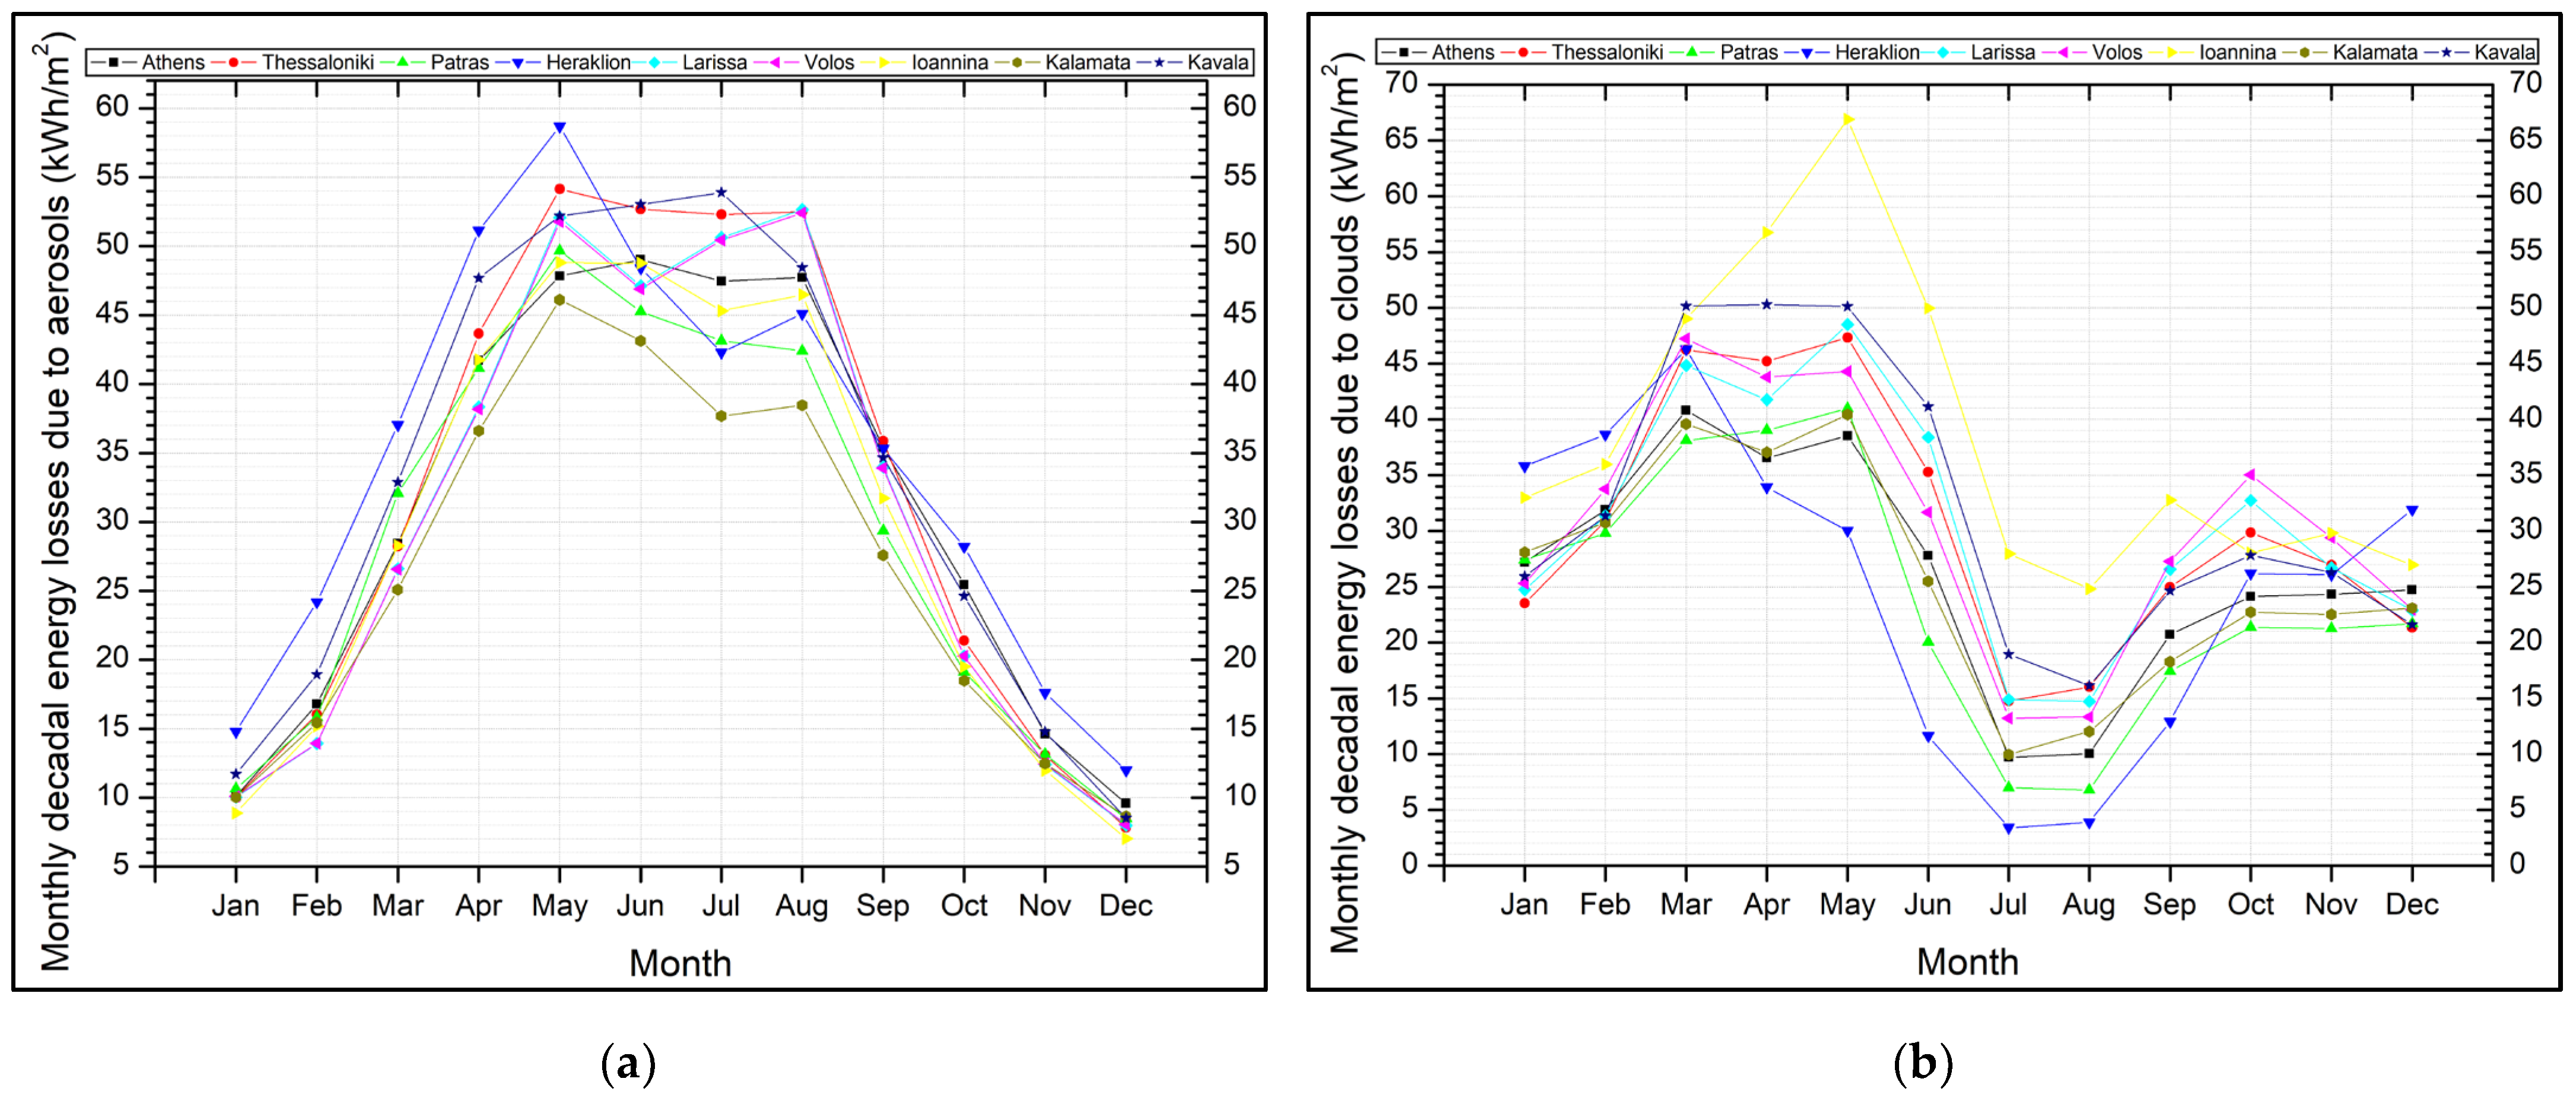
Furthermore, we can calculate the energy losses in kWh/m2 due to the presence of clouds by calculating the difference GHI0–GHI; correspondingly, by calculating the difference GHI00–GHI0, we can capture the energy losses due to aerosols. Thus, Figure 9 presents the monthly sums of energy lost due to attenuation of solar radiation due to aerosols (Figure 9a) and clouds (Figure 9b), respectively, for the decade 2014–2023. From the observed data, we can conclude, regarding the levels of aerosols, that of the nine cities in total, the greatest energy losses take place in Heraklion, while the least are observed for the city of Kavala. At the same time, in terms of energy losses due to the presence of clouds, the highest are observed in Ioannina and the lowest in Heraklion, with the rest of the cities ranging in between. Following the patterns of AMF and CMF reported above, especially from the end of spring until mid-autumn, we observe low to very low values, which means less radiative impact and therefore lower levels of cloud cover.
More generally, as Table 3 testifies, supplementing Figure 9 and summarizing specific and very important and interesting statistics, during the decade under study, both the CMF and the AMF for all Greek cities tend to increase, events which indicate a decrease in cloud cover and air pollution, respectively. For Athens, more specifically, it is observed that the range of variation of the average ten-year monthly energy losses due to the presence of suspended particles during the years 2014–2023 is smaller than the corresponding one for the years 2010–2019 [49], which, given the overlap of the time intervals, means that the air quality has improved even more significantly, since, by extension, the levels of PM2.5 particles tend to decrease over the years. However, unfortunately the data can also be interpreted from a second, more difficult point of view. This is due to the fact that, to put it simply, the disruption of seasonal phenomena becomes indirect but readily discernible, such as moderate rainfall for an extended period of time being replaced by severe weather phenomena of extremely brief duration, as well as a growing assortment of prolonged less humid and, as a result, scorching summers—both of which are distinctive, hallmark features of climate change [50].
The fact that over the decade the loss rates are negative indicates that losses tend to decrease, so there is more and more energy available to be exploited and harnessed by solar panels. Therefore, European measures and policies on air pollutants and climate change accelerated by human activity have led to reduced levels of atmospheric aerosols and cloudiness and, by extension, to ever lower solar radiation effects and greater PV production. However, under no circumstances should this be a cause for complacency, and we ought not to ignore the damaging effects of climate change by “sweeping it under the carpet”. Instead, it should be one of our most important pillars and guidelines, especially in meeting our energy needs, with the goal being mitigation and coping with it.
In addition, based on the data used, it appears that the highest annual average value of energy losses due to clouds amounts to 45.60 kWh/m2 and corresponds, without any surprise, to the city of Ioannina for the year 2014, while the lowest amounts to 19.37 kWh/m2 in Patras in the year 2022. Correspondingly, the highest annual average value of energy losses due to aerosols amounts to 37.98 kWh/m2, and also, unsurprisingly, corresponds to the city of Heraklion for the year 2018, while the lowest is 24.86 kWh/m2 in Kalamata in the year 2017. We observe, therefore, that although the minimum energy loss due to aerosols is relatively greater than the minimum energy loss due to clouds, the type of losses of the latter is twice that of the former.

4. Discussion

4.1. Interpretation of the Urban Dense Fabric Data through QGIS

In terms of population and size, Athens is Greece’s largest city. It encompasses a large region of territory and includes both urban and suburban zones. The second-largest city, Thessaloniki, has a lesser land area than Athens but is nonetheless considerable. Patras, in the Peloponnese region, has a modest land area. On the Greek island of Crete, the city of Heraklion is relatively modest. Larissa, in central Greece, has a moderate urban footprint. Volos, a seaside city, has a large urban area. Ioannina, which is surrounded by mountains, has a small urban design. Kalamata, which is noted for its shoreline, has a modest urban area. Kavala, located on the seaside, has a medium-sized metropolitan area.
In terms of urban density, Athens has a combination of dense urban fabric, ancient districts, and green areas. The urban fabric of Thessaloniki consists of a dynamic city center, residential suburbs, and commercial districts. Patras’ urban fabric is diversified, including industrial zones, residential districts, and cultural sites. The fabric of Heraklion incorporates historic buildings, new developments, and tourist-related districts. Larissa’s urban fabric combines traditional and modern aspects. Volos’ urban fabric is shaped by its marine heritage and industrial industry. The fabric of Ioannina comprises ancient landmarks, lakefront promenades, and educational institutions. Coastal promenades, olive trees, and residential enclaves make up the fabric of Kalamata. Kavala’s urban fabric is a blend of ancient town beauty, port infrastructure, and residential neighborhoods.
Finally, the shadow modification factor is determined by a variety of parameters such as building height, direction, and topography. Taller structures in heavily inhabited regions tend to throw longer shadows. As a result, cities with high-rise structures, like Athens and Thessaloniki, may have significant shadow effects. Because of their proximity to the sea, coastal communities such as Kalamata and Volos may see unusual shadow patterns.
These cities also use a variety of approaches to sustainability and resilience in their urban development, with each adapting to its own environment and difficulties. During the financial crisis, the Rockefeller Foundation launched the 100 Resilient Cities network, in which Athens actively participates. The city promotes green infrastructure because it recognizes the economic value of green places. The city center is being revitalized as part of a major redevelopment initiative. However, the addition of private parties to decision-making processes has prompted questions about spatial fairness. Thessaloniki, which is also a member of the 100 Resilient Cities network, is looking for help with urban resilience implementation. Local governments want to receive money and exchange information with other communities dealing with similar shocks. Patras considers its complex urban fabric, including industrial zones and cultural sites, while planning for resilience. The “City Plan” has a major impact on Patras’ initiatives. Heraklion, which is situated in a unique island backdrop, strikes a balance between historic architectural heritage, new projects, and touristic districts. Its resilience measures are specifically tailored. Larissa’s urban fabric combines old and contemporary aspects perfectly. The “City Plan” actively aids Larissa’s resilience initiatives. Volos, which has a marine history and industrial sectors, incorporates Urban Atlas data into resilience planning. Ioannina, noted for its lakeside attractiveness and ancient attractions, takes into account natural settings as well as educational institutions when discussing resilience. Kalamata, with its coastal identity, considers the seaside, olive trees, and residential neighborhoods. Using data from the Urban Atlas, landscape metrics estimate building density. Kavala, with its ancient town beauty and functional port facilities, also adds to the overall Urban Atlas collection [51,52,53,54,55].

4.2. Climate, Sunlight, Aerosols, and Cloudiness Levels

Per the Köppen classification, Athens possesses a Mediterranean climate (Csa), characterized by pleasant, clement winters and warm, dry summers. The city is bathed in sunlight all year round. The aerosol composition in Athens’ atmosphere can fluctuate due to factors such as urban pollution, industrial emissions, and natural phenomena. Typically, Athen’s sky is clear with occasional thin clouds. Thessaloniki, another splendid Greek city, also has a Mediterranean climate (Csb). Its summers are hot and dry, while winters are colder and wetter. Thessaloniki is abundant in sunshine, especially during the summer. The city’s aerosols may comprise urban pollution, dust, and sea salt particles, leading to varied cloud cover throughout the year. Similarly, Patras has a Mediterranean climate (Csa) with mild winters and warm summers. The city is rich in sunlight, particularly during the summer. Aerosols in Patras’ air could originate from industrial activities, transportation, or natural sources, resulting in diverse cloud cover. Heraklion, located in Crete, also has a Mediterranean climate (Csa). The city experiences hot, dry summers and pleasant winters. Heraklion is sunny, especially in the summer. Its air may contain aerosols such as dust, sea salt, and local pollutants. The city generally has a clear sky with a few thin clouds. Larissa, with its Mediterranean (Csa) climate, enjoys warm summers and pleasant winters. The city is sunny throughout the year, and its air may contain particles from both urban and natural sources. Larissa experiences varying degrees of cloud cover. In Volos, the predominant Mediterranean climate (Csa) results in warm, dry summers and pleasant winters. The city is sunny, especially during the summer. Its air may contain a mix of industrial pollutants and natural particles, leading to varied cloudiness levels. Ioannina, with its Mediterranean (Csa) climate, experiences hot, dry summers and cool winters. The city is sunny, particularly during the summer. Its air may contain aerosols from local sources and natural dust, resulting in different levels of cloud coverage. Kalamata’s climate is also Mediterranean (Csa), with hot, dry summers and pleasant winters. The city is sunny, particularly during the summer season. Its air may contain aerosols such as dust, sea salt, and local pollutants. Generally, Kalamata has a clear sky with occasional thin clouds. Lastly, Kavala, with its Mediterranean (Csa) climate, experiences warm, dry summers and pleasant winters. The city is sunny year-round, and its air may contain aerosols from both urban and natural sources. The levels of cloudiness in Kavala vary [41,42,56].
Most aerosol loading characteristics, including those in Europe, have demonstrated negative trends over the previous two decades, indicating a reduction in aerosol levels. Some research, specifically in relation to Athens, Greece, offer additional in-depth information. A study entitled “A Decade of Aerosol Optical Properties Measurements over Athens, Greece” [57] used long-term ground-based observations of aerosol optical properties in Athens from 2008 to 2018. Aerosol loads were observed to be greater throughout the spring and summer months. During the study period, the AOD at 440 nm decreased by 1.1% per year and the SSA decreased by 0.4% per year. Another study, “Optical Properties of Near-Surface Urban Aerosols and their Chemical Tracing in a Mediterranean City (Athens)” [58], examined one-year observations (October 2016–September 2017) of aerosol optical characteristics in the Athens urban environment. The study discovered unusually high scattering and absorption coefficients in Athens during the winter nighttime, showing that household heating and wood burning have a substantial influence on aerosol qualities in winter. These studies reveal that, while there are seasonal changes and effects such as residential heating, the overall trend in Athens, like in much of Europe, has been a decline in aerosol levels over the last decade.
According to an historical examination of cloudiness measurements made at the National Observatory of Athens dating back to the late nineteenth century, statistically significant positive trends in cloud cover were discovered throughout the research period, with the most evident being in spring and summer. Significant variations in the prevalent frequency of specific cloud forms over the last 60 years have also been observed. In recent decades, there has been a significant increase in the incidence of low and high clouds, while the occurrence of medium clouds has decreased [59]. The latest statistics on cloudiness patterns in Greece and Europe show the following: a climate change assessment specifically advises Greece to expect greater heat waves, weaker breezes, and less total precipitation. This shows that cloud cover may decrease owing to decreased precipitation. In addition, Greece saw record rainfall and flash floods in September 2023. This suggests that extreme weather events, which may be related to increasing cloudiness, are taking place [60]. The European State of the Climate 2021 report says that Europe experienced reduced cloud cover but similar sunlight duration conditions than the average for the 1991–2020 reference period. The most significant anomalies were a negative sunlight duration and positive cloud cover anomaly across much of the western Mediterranean, as well as a positive sunshine duration and negative cloud cover anomaly over Eastern Europe (Austria, Slovakia, Hungary) and Norway [61]. A study of satellite measurements of seasonality and long-term trends in cirrus cloud characteristics over Europe discovered that there has been a general trend of decreased cloud cover over Europe over the previous four decades [62].
All the above confirms that the findings of our present study are in line with the same direction and in agreement with the most recent literature. Both aerosol and cloud levels show decreasing trends, which obviously implies better air quality with ever lower concentrations of suspended particles and air pollutants, but at the same time, less and less cloud cover is observed [63,64,65].
The potential of solar PV is immense. Blessed with abundant sunlight, Greece is ideally positioned to harness solar energy. Over the last decade, the ever-decreasing effects of aerosols and clouds on solar radiation have effectively translated into an even greater surplus of solar energy that Greek cities can exploit daily to meet their energy needs and have an even greener energy balance. More specifically, the greatest effects on solar radiation, and by extension the greatest energy losses due to clouds, are observed in the city of Ioannina in north-western Greece, while the greatest effects on solar radiation and by extension the greatest energy losses due to aerosols are observed in the city of Heraklion on the island of Crete in southern Greece. These two cities are the two outermost and opposite cases of maxima and minima in both categories, respectively. The remaining seven cities fluctuate at levels in between.
Consequently, there can be no doubt that the integration of photovoltaic systems on roofs in Greek urban environments can play an important role in the country’s energy transition. In addition, it can contribute to the transformation of Greek cities into sustainable ecosystems, strengthening their resilience to climate change.

4.3. Energy Planning Scheme

To investigate an idealized yet realistic approach, a detailed analytical and methodical attempt was made to explore energy adequacy for every Greek city involved in this study. This extensive work can also contribute to the formation of an updated and comprehensive overall solar resource and potential map for continental Greece, highlighting the latest levels and trends regarding both Global Horizontal Irradiation and photovoltaic power potential.
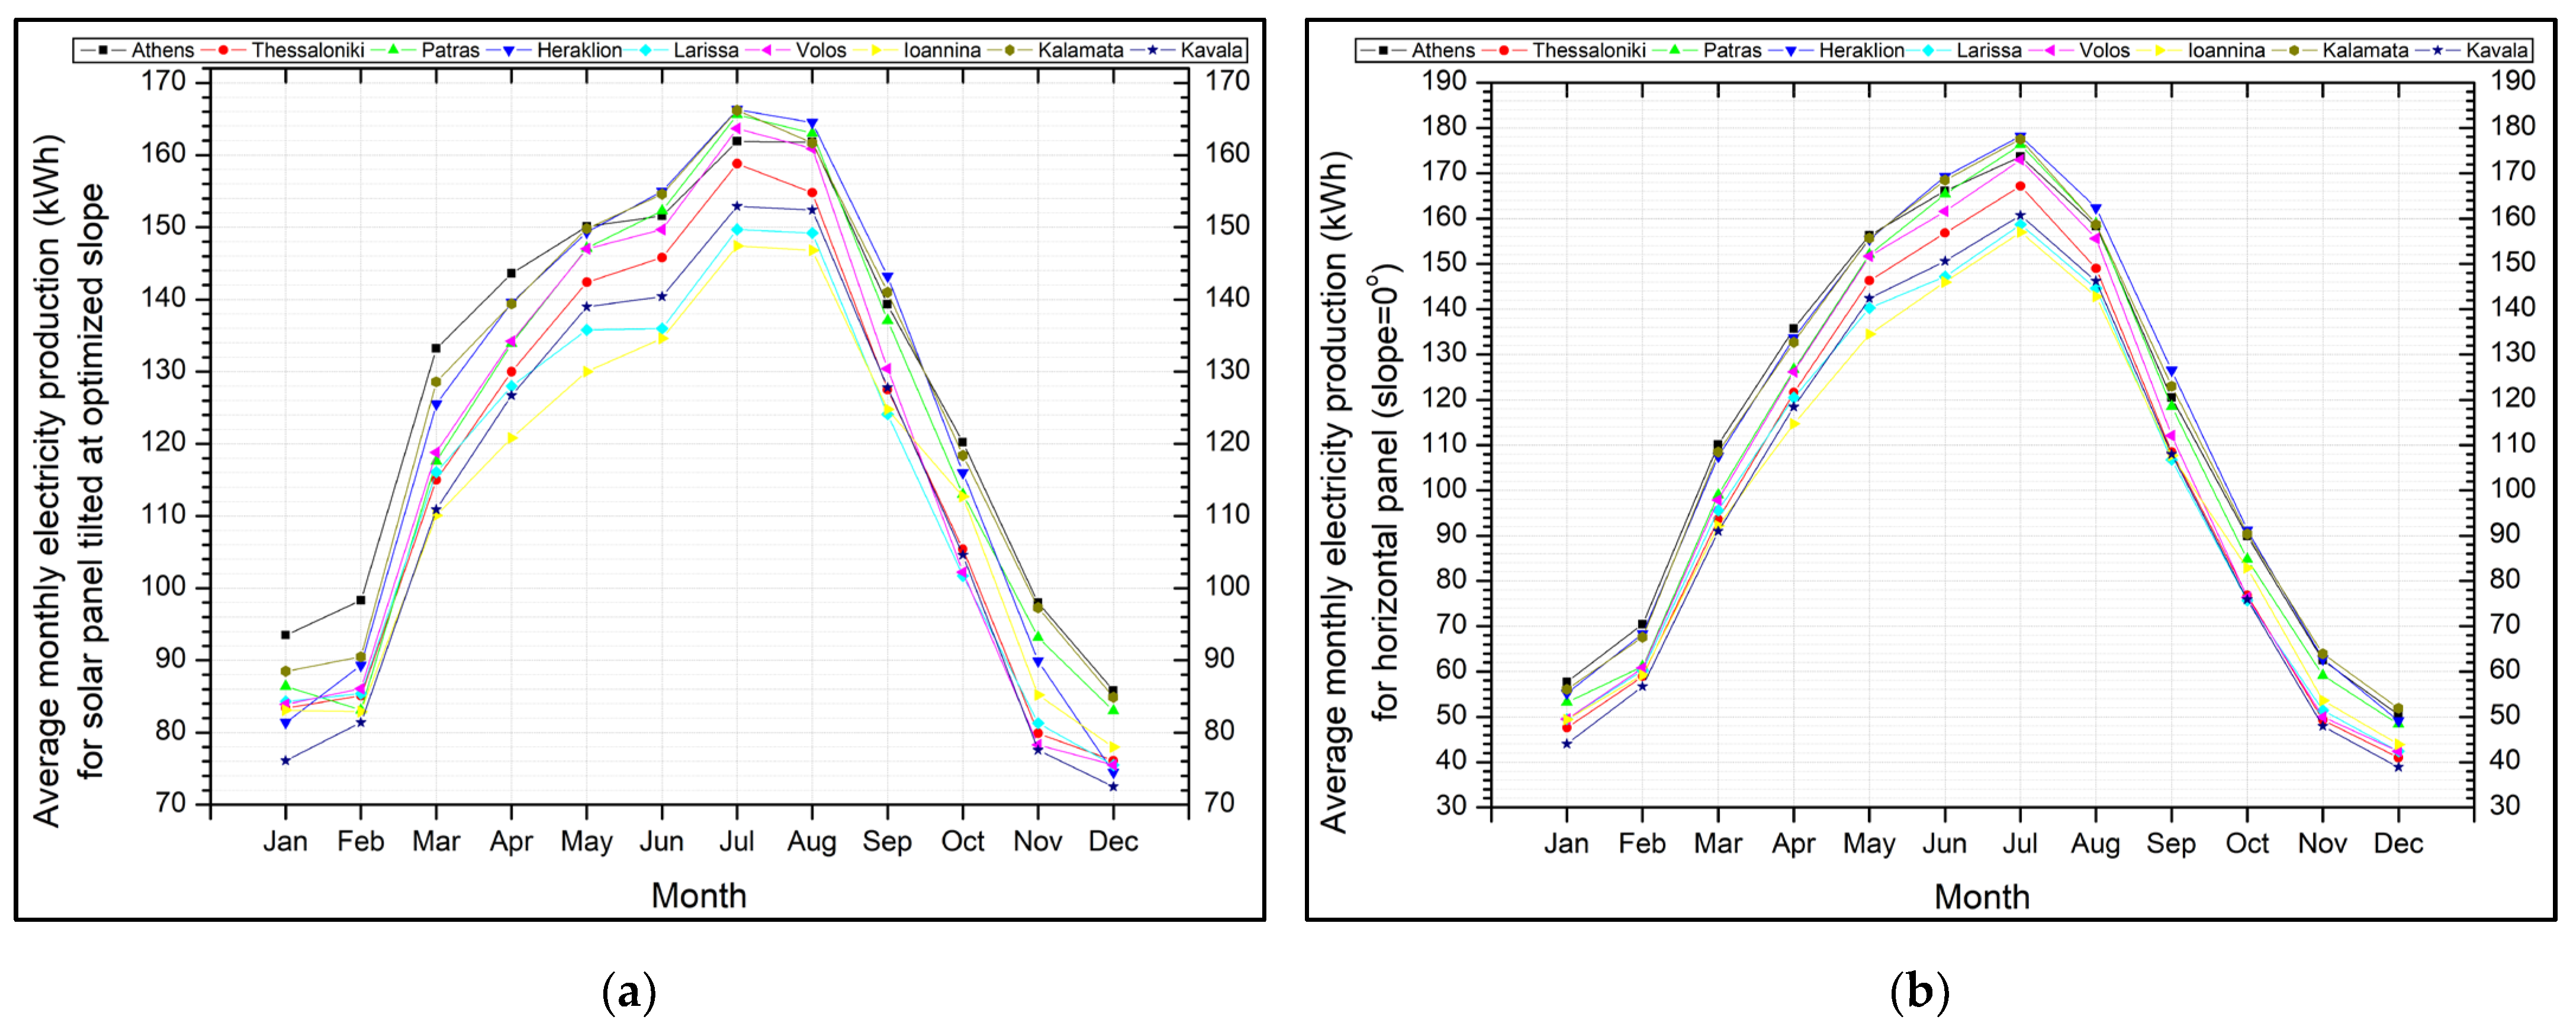
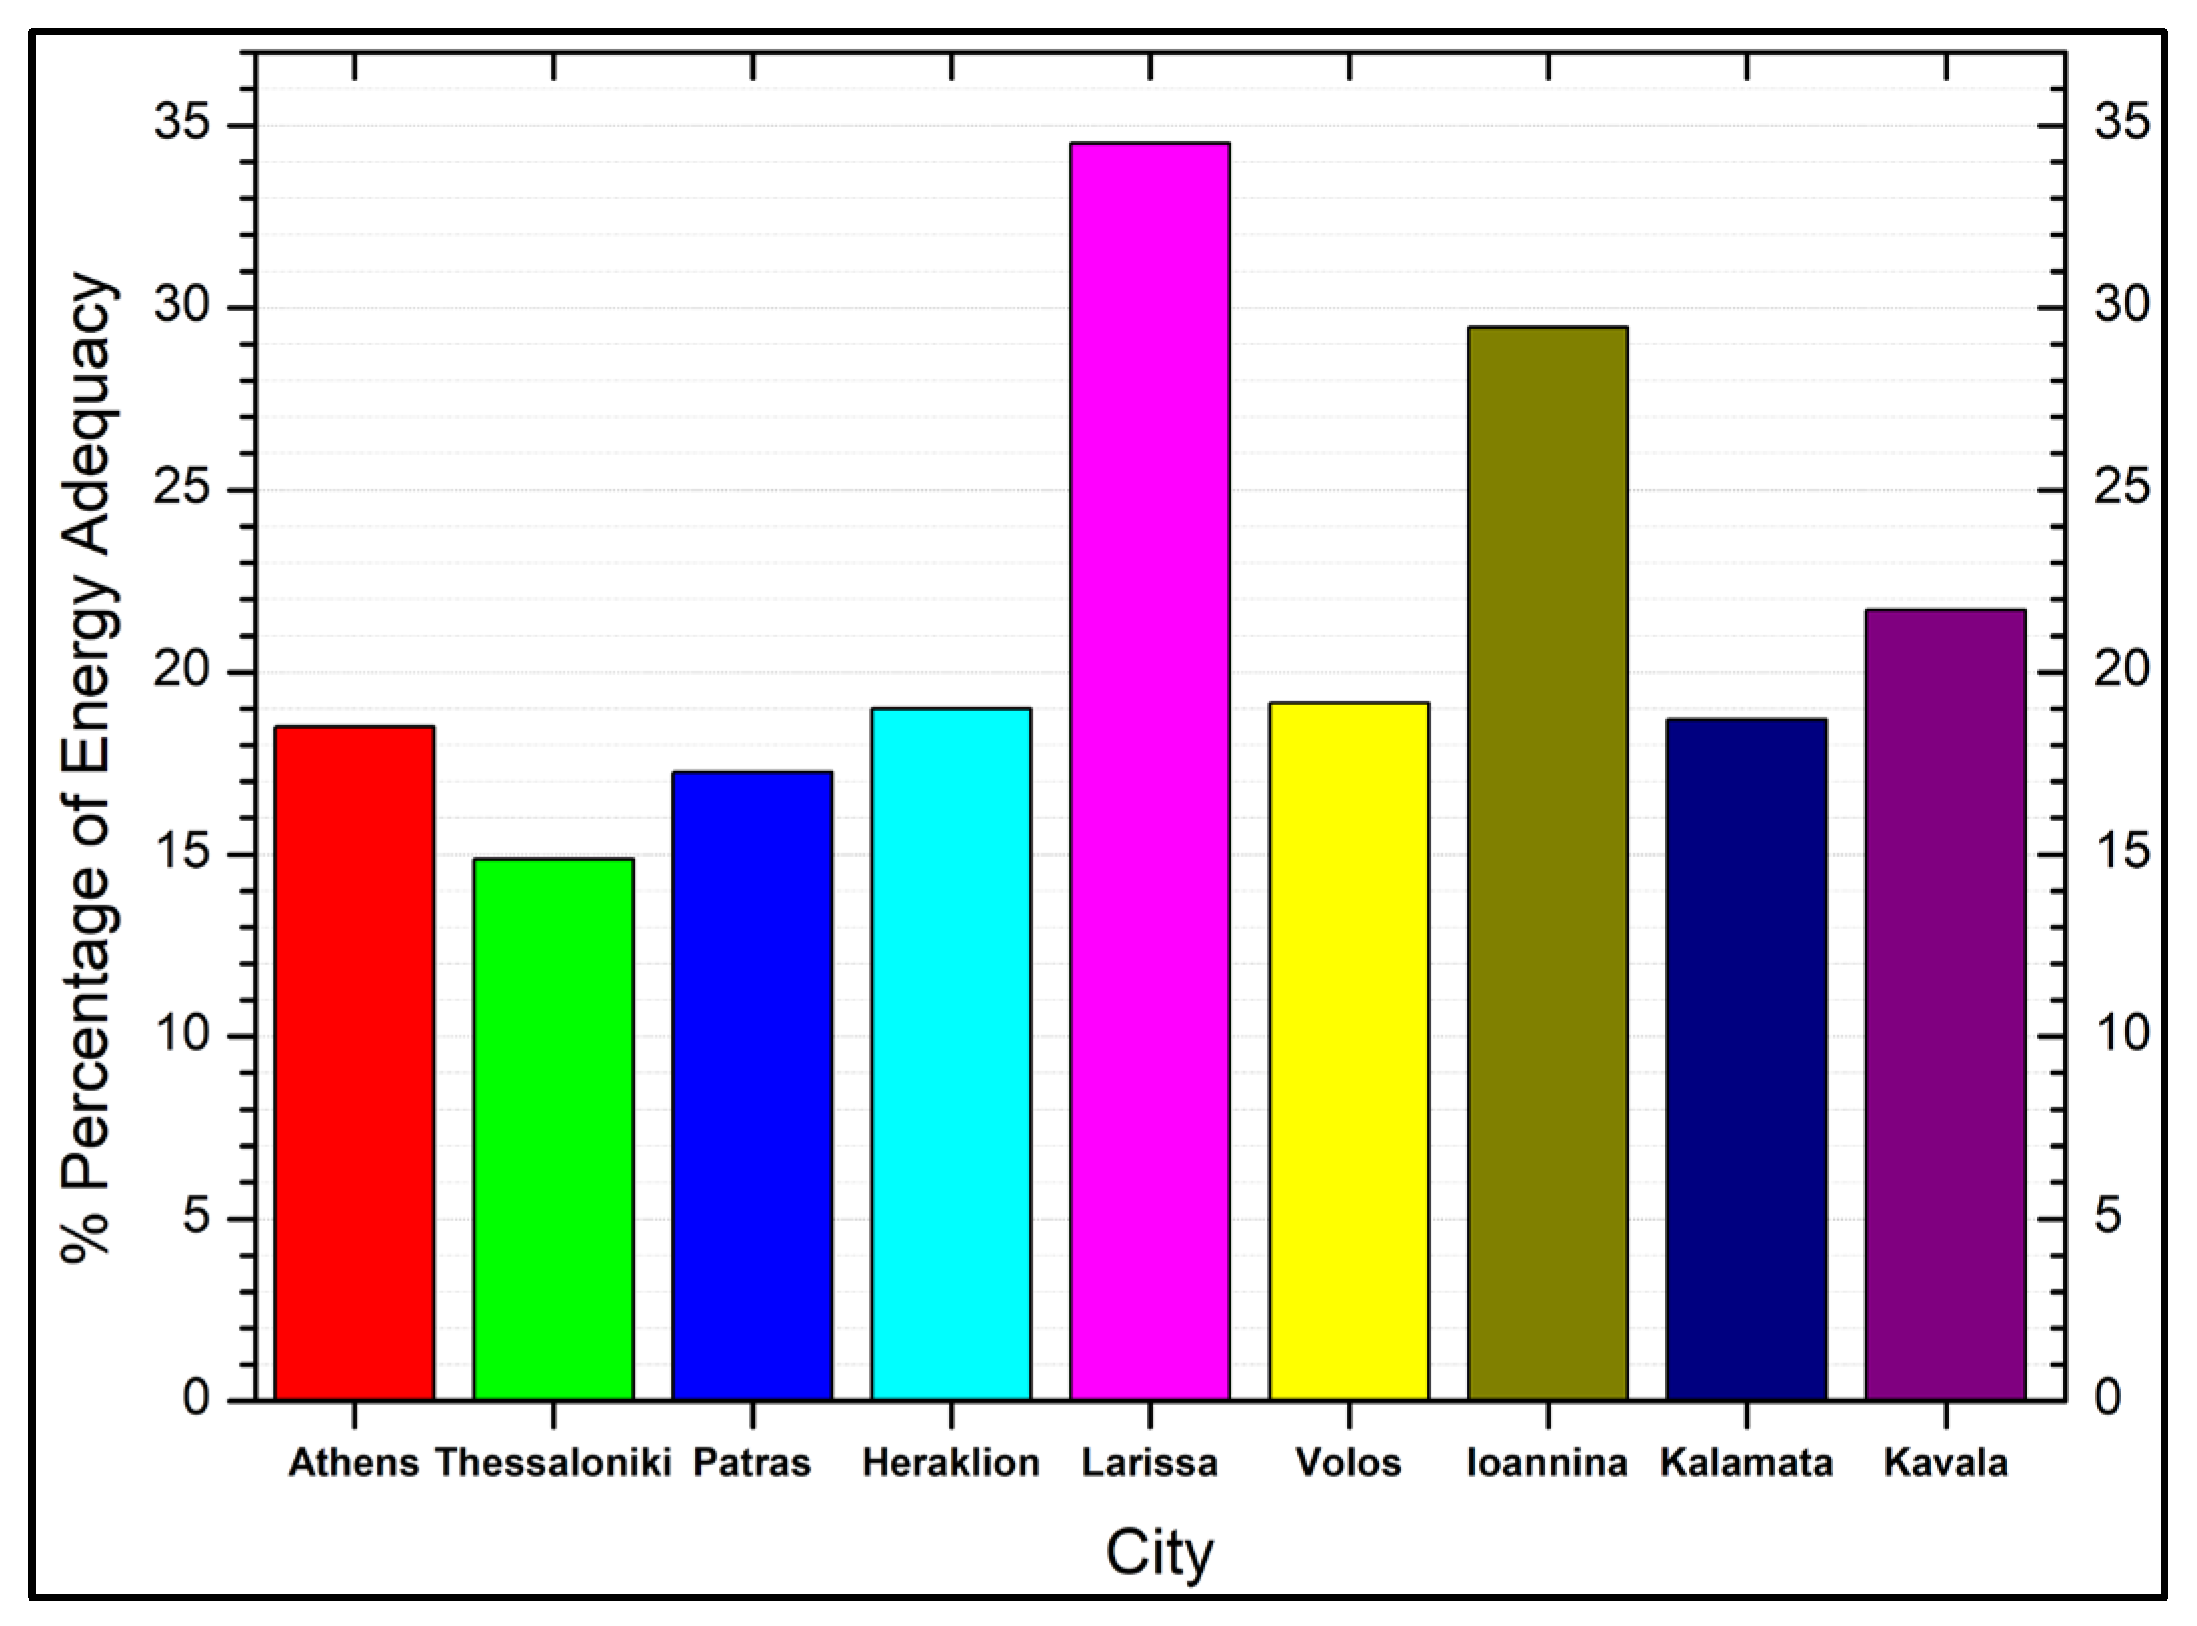
Our ideal energy planning scenario concerns the theoretical maximum possible exploitation of the buildings’ rooftops for PV installation. For this purpose, first, as already mentioned in Section 3.1, the total area of the five different classes of urban fabric density of each city was extracted through the QGIS application from the corresponding CUA maps. Subsequently, each class was multiplied by two ratios different and distinct from each other and for each class; one related to the representation of the buildings of each city contained in each different kind of class, and one related to the density of buildings and the exploitability and compatibility of PVs. Therefore, the final sums of each city’s classes multiplied by the respective coefficients gave us the final maximum possible exploitable and compatible building roof area of all cities, and thus the maximum possible area of solar panels that can be integrated for energy production. Then, under the assumption that an area of 20,500 m2 is analogous to 1 MWp approximately [66], the ultimate PV generation of electricity was calculated through the conversion of each city’s PV capacity (GWp) into energy (GWh), relying on the appropriate yearly cumulative PVGIS 1 kWp energy output for a slope equivalent to the optimized latitude for the most effective energy production. Figure 10a presents the monthly energy output from a fixed-angle PV system, using the PVGIS online tool that was set to the default performance settings of grid-connected PV systems (Solar radiation database = PVGIS-SARAH 2, PV technology = Crystalline silicon, Installed peak PV power [kWp] = 1, System loss [%] = 14, Fixed mounting options/Mounting position = Roof added/Building integrated and Azimuth [°] = 0), as well as the slope set equal in automatically selected as optimal degrees according to each city’s latitude coordinate. In contrast, Figure 10b shows the simulation results for a panel with the only difference being that it is mounted on the ceiling horizontally with zero slope and the other settings are kept the same. In addition, after contacting and submitting the necessary relevant request to the Strategic Governance and Data Sector of the Business Analytics and Data Directorate of HEDNO S.A. (Hellenic Electricity Distribution Network Operator S.A., Athens, Greece), we also gained access to the monthly energy consumption data for the year 2023 for all the cities under study. It is clarified that these data initially concerned the metropolitan areas of the cities of Athens and Thessaloniki and the municipalities of the other cities, but the first two had to be filtered based on the representative, sufficient, corresponding coverage of the five basic classes of urban density fabric and cross-checked with available energy data. Therefore, in the end, for Athens and Thessaloniki, the energy consumption data concerning the areas located in the urban core of the two largest cities of Greece were essentially considered (Central, Northern, Southern, Western Sector, and Piraeus for Athens and Ampelokipon-Menemeni, Thermaikos, Thermi, Thessaloniki, Kalamaria, Kordelio—Evosmou, Neapolis—Sykeon, Pavlou Mela, Pylaia-Hortiatis, and Oreokastro on the with regard to Thessaloniki). Table 4 brings together the main key points of this study’s energy planning scenario and Figure 11 highlights the energy adequacy rates that the cities can benefit from annually based on the entire energy planning program described just above.
It is observed that for horizontal panels, the maxima in all cities appear at slightly higher values and that the range of values is noticeably larger. However, it is readily apparent that in the winter months, the production drops by about 30 kWh for a horizontal panel relative to one tilted at the optimum angle. More generally, it is concluded that each city benefits from 14.34 kWh more per panel per month when they are placed at the optimal tilt and the total annual production is, on average, 1.25 times greater than that obtained for horizontal panels, or, in other words, 25% more productive.
It is observed that Athens, Heraklion, Volos, and Kalamata, in terms of energy efficiency rates, range at 18–19%, Patras and Thessaloniki fall a little lower, at 15–17%, Kavala rises to 22%, and finally Ioannina and Larissa stand out and jump to about 29% and 35%, respectively.
In essence, it can be easily understood that seven of the nine cities, if they adopt an energy planning scenario based on or at least partially similar and compliant with the guidelines proposed by this work, can cover a little less than a fifth of their daily energy needs from photovoltaics on the roofs of their buildings. Larissa and Ioannina seem to be close to covering a third of their daily energy requirements from a corresponding energy planning scheme.
Considering that this paper focuses on the study of nine of the largest cities in Greece, those with the highest apparent energy demands and consumption, we can come to the following reasonable conclusion. By extrapolating all the above results, it is a strong indicator that, in general, mainland Greece, under the specific conditions and circumstances, could roughly cover about one fifth of its daily energy needs from photovoltaics. Without the need to find vast areas of land for solar farms, without all the associated problems and difficulties that would entail, the integration of PV panels into building rooftops in urban environments is an important, beneficial achievement.

4.4. Financial Analysis

The financial analysis was carried out by modeling PV installed on the roof or incorporated within the building. The most prevalent PV materials were used to estimate solar PV energy production, with the remaining efficiency of 80% being converted to PV output energy based on nominal power and electricity converter technology, as well as AC/DC efficiency. Our hypothetical scenario and nominal power levels incorporate PV solutions by calculating real power performance in MW rather than peak power in MWp, which relies on optimal conditions. Regarding the Greek reality around RES that is valid up to the given moment, for photovoltaics up to 500 kW, which “locked” a reference price with completion or declaration of readiness within 2023, they will be compensated with EUR 63 per Megawatt hour. Also, for photovoltaic energy communities (power up to 1 Megawatt) until the end of 2023, it was decided that the fee will be EUR 65 per Megawatt hour. These reference prices for photovoltaics will be valid until 31 August 2024. After that, EUR 65.74/MWh will drop to EUR 63/MWh. Accordingly, the reference price for Energy Communities will drop from EUR 68.87/MWh to EUR 65/MWh (extension of one more year) [67]. It might also use the “Feed in Tariff (FiT) or Feed in Premium (FiP) (in the event of a grid interconnection) parameter” in a subsequent financial analysis and accurately forecast the upkeep costs associated with cleaning solar panels, for instance, following dust deposition [68,69,70].
PV energy output was translated into yearly financial profits and losses using the formulae described in [71,72]:
Earnings (EUR) = Generated Energy (GE in MWh) × Electricity Cost (EUR/MWh)
The monetary losses (ML) are defined as follows:
ML = (GEmax − GEactual) × (Electricity Cost)
The ML is the financial loss in euros (EUR), and the GEmax is the maximum energy generated in MWh under the assumption of no aerosols and a cloudless sky. This indicates that the AOD and COT will be zero, but the GEactual is the actual energy output under all sky circumstances, i.e., the AOD and COT are factored into the computations.
Therefore, we can divide the produced energy that the PVGIS tool gives us by the total product of the annual monthly ten-year averages of the SMF, AMF and CMF coefficients for each city and in this way estimate the ideal energy that would be produced by the whole of the photovoltaic “fleets”, “unobstructed”, that is, without any influence and attenuation from shadows, aerosols and cloudiness. Then, by multiplying this exact energy obtained under completely ideal conditions by each factor separately, we can estimate the amount of losses in Megawatts due to shadows, aerosols, and clouds, respectively for each city. Finally, we can also translate these losses into money, multiplying them by the FiT EUR 63/MWh. Table 5 below summarizes all of this.
We observe, therefore, that the losses due to shadowing in Athens amount to approximately EUR 11 million, in Thessaloniki approximately EUR 2 million, while in the other cities they range from EUR 0.15 to 0.5 million. The losses due to aerosols and clouds have similar value ranges, with those due to clouds slightly (up to significantly for Thessaloniki and Ioannina) higher, for Athens ranging in the order of EUR 25–30 million, in Thessaloniki EUR 6–8 million, and in the other cities from EUR 0.5 to about 3 million.
Finally, we can derive a rough estimate of the annual potential profit that each city can benefit from if we subtract from the total final real energy output translated into money (earnings) the total sum of the individual losses. This resulting economic quantity can, in turn, be translated into amounts of money saved or actual revenue through the injection of possible excess generated energy in the grid. In such a scenario, therefore, under the specific conditions, prerequisites and assumptions, Athens could reap a profit to the order of EUR 50 million annually, Thessaloniki approximately five times smaller, somewhere around EUR 10 million, and the rest of the cities from EUR 1 up to approximately 4.5 million.
It goes without saying, however, that turning a profit overnight is not the goal. The payback period of a photovoltaic (PV) installation, also known as the breakeven point, is the amount of time it takes to recuperate the cost of installing the solar system. In general, this duration might vary based on numerous aspects such as the number of solar panels installed, the system’s payment mechanism, the location, and so on. However, these estimates might vary greatly based on local factors like power pricing and solar incentives. Saving money begins after the payback phase, when the initial investment has finally been repaid.
On the one hand, installing photovoltaic (PV) panels on as many city roofs as is feasible can have a big influence. Building-scale renewable energy is the most effective measure that cities can take to decarbonize their energy sector, especially given the constantly declining prices of renewable energy technology. This is not only a low-cost solution to cut greenhouse gas emissions and improve air quality, but it may also help municipalities save money on electricity. Municipal solar projects are also crucial for growing local markets and building capacity, creating high-quality jobs, and educating locals about the benefits and functionality of solar PVs. On the other hand, their deployment on rooftops has the potential to have both beneficial and negative effects on building heating and cooling energy consumption, as well as on the surrounding metropolitan environment. The negative repercussions can be increased if PV is installed on top of an otherwise highly reflecting (“white”) roof.
To summarize, the payback period for a large-scale photovoltaic (PV) installation project, such as covering as many rooftops as is feasible in a city, can vary substantially depending on several variables. These include the cost of the PV systems, the quantity of sunshine received by the city, the local power rate, and any applicable incentives or subsidies. The payback phase occurs when the accumulated savings and income match the initial investment. After this, the project would begin to generate a profit. However, this is an oversimplified perspective. In actuality, there are several more aspects to consider, including maintenance expenses, PV system longevity, variations in power pricing, and the cost of financing. To accurately estimate the payback period for such a project, an even more detailed and extensive feasibility study and financial analysis would be required, as well as sound and careful guidance and counseling, particularly from solar energy experts and financial advisors [73,74,75].

4.5. Solar Energy and Carbon Emission Savings

Solar energy is a sustainable and clean energy source since it generates power without generating carbon dioxide or other harmful pollutants, thanks to the photovoltaic effect. However, the manufacture and disposal of solar panels requires the extraction and processing of raw materials, which can result in energy consumption and greenhouse gas emissions. Despite the initial environmental cost of manufacturing solar panels, the long-term advantages of lowering carbon emissions and delivering sustainable electricity frequently surpass the original costs. A solar panel can provide enough clean energy during its lifetime to more than compensate for the emissions created during its manufacture. As production processes become more efficient and sustainable, the environmental effect of solar panel manufacturing is predicted to decrease. Recycling and ethical end-of-life management measures can also help to lessen the total environmental effect of solar panels.
To summarize, while solar panels have an environmental impact, their total contribution to decreasing greenhouse gas emissions and combatting climate change is substantial. As a result, solar energy is an essential component of the worldwide drive to create a more sustainable and ecologically conscious future.
Clearly, every kilowatt of green energy helps to reduce the carbon footprint. A 5 kW solar plant, for example, could save around 15,000 pounds of CO2 per year. This provides an important contribution to protecting our environment from global warming and its consequences. Solar panels emit around 50 g of CO2 per kWh in their first few years of operation. For comparison, during the extraction and production of natural gas, 117 pounds of CO2 are produced per million British thermal units (MBtu). Oil (petroleum) generates 160 pounds of CO2 per MMBtu. However, after the third year of operation, most solar panels are carbon neutral. This is still around 20 times lower than the carbon output of coal-fired power facilities. While there is a carbon footprint associated with the manufacturing and shipping of materials needed in solar panel production, the life-cycle emissions of solar power are approximately 12 times lower than those of natural gas and 20 times lower than coal. Furthermore, solar energy produces no emissions during the generation process, and life-cycle studies clearly indicate that it has a smaller carbon footprint from “cradle to grave” than fossil fuels.
It is also worth noting that while renewable energy technologies rely on petrochemical materials for production, their overall environmental impact is far lower than that of fossil fuels. The carbon footprint of solar energy may be reduced further by using recycled materials in the manufacturing process and placing solar panels in areas with an abundance of sunlight. Solar energy can also contribute to reducing air pollution. Solar panels do not release any pollutants that contribute to smog or acid rain. Solar energy is a renewable resource; thus, it will never run out. As a result, it provides a long-term source of power.
Overall, solar energy is a very low-carbon energy source. The carbon emissions created during solar panel production are negligible when compared to the emissions averted by utilizing solar energy instead of fossil fuels. Solar electricity produces no pollution, greenhouse gases, or fossil fuels, although it does require some energy to generate the solar panels. Fortunately, the energy provided far outweighs the cost of production. For a rooftop solar system with a 30-year lifespan, the total emissions associated with producing 1 kWh of power amount to 41 g of CO2 equivalents, which is nearly the mass of a medium-sized chicken egg [76,77,78,79,80].
Using the Greenhouse Gas Equivalencies Calculator [81], we may translate emissions or energy statistics into understandable terms, such as yearly CO2 emissions from automobiles, houses, or power plants. The Greenhouse Gas Equivalencies calculator facilitates the conversion of emissions or energy statistics to the equivalent amount of carbon dioxide (CO2) emissions produced by the predetermined quantity. The calculator also permits the user to convert abstract metrics into tangible terms that one can easily comprehend, such as yearly emissions from automobiles, residences, or power plants. This calculator may help you, for instance, communicate your greenhouse gas reduction plan, objectives, or other actions focused on lowering greenhouse gas emissions. The Greenhouse Gas Equivalencies Calculator converts kilowatt-hour reductions into avoided units of carbon dioxide emissions using the AVoided Emissions and GeneRation Tool (AVERT) for the United States’ national weighted average CO2 marginal emission rate. The equation listed as being used to derive the final result is as follows:
1540.1 lbs CO2/MWh × 1 metric ton/2204.6 lbs × 0.001 MWh/kWh = 6.99 × 10⁻⁴ metric tons CO2/kWh
It should be noted that (a) this computation does not account for any greenhouse gases other than CO2, and (b) it incorporates line losses.
Table 6 shows how much CO2 emission can be avoided based on the total maximized energy production from rooftop solar panels in each city.
Rooftop solar photovoltaic (PV) systems in urban contexts have been identified as an important technique for lowering carbon dioxide (CO2) emissions and mitigating the effects of climate change. Solar energy is critical in assisting cities in decentralizing energy generation and, as a result, decarbonizing their energy mix. The growing affordability of solar energy gives our best chance of quickly addressing climate change [83,84].
The potential for CO2 emission reductions in the cities we studied is significant. These data provide an important contribution to the reduction of greenhouse gas emissions. It should be noted that these figures are based on the premise that all suitable and exploitable roofs would be used for solar energy generation to the fullest extent possible. Furthermore, using rooftop solar panels may offset more emissions each year than planting an acre of trees. In the United States, each acre of solar panels deployed to replace natural gas lowers 208 to 236 times more CO2 per year than an acre of forest [85].
To summarize, broad adoption of rooftop solar PV systems in urban areas, such as the aforementioned cities, might be critical to meeting global climate targets. To maximize the advantages of solar energy deployment, it is critical to examine the local context, which includes solar potential, building attributes, and policy environment.
The study’s conclusions on the best use of urban rooftops for photovoltaic (PV) systems might have important practical and regulatory ramifications. The respective competent authorities responsible for ideal urban planning might be able to improve energy adequacy, sufficiency, and security, cut down power prices, and provide more job opportunities in the renewable energy industry by selecting the appropriate roofs for PV systems. Significant reductions in greenhouse gas emissions and urban carbon footprints might be among the environmental advantages. More profitable and attractive to consumers as financial incentives such as subsidies and more enticing feed-in tariffs are among the policy ideas, as are revised construction rules, simplified zoning laws, public awareness campaigns, and training programs. Integrating PV systems with smart grid technologies and encouraging energy storage options could also further contribute to improving energy distribution and stability. Collectively, these kinds of approaches would promote sustainable urban growth, local energy security, and climate change mitigation [86,87].
It is imperative to further investigate the long-term environmental and social impacts. This study’s significant insights and the incredibly massive and useful know-how already gained will be implemented, and additional research is scheduled to be elaborated on in a following paper, incorporating quantitative metrics and predictive models, such as Integrated Assessment Models (IAMs) for projecting carbon footprint reduction, Life Cycle Assessment (LCA) tools for quantifying pollutant emissions, and epidemiological models for estimating health benefits; this will serve as a solid foundation and motivation in the field. Moreover, economic impact models could be utilized to project economic savings, while Social Impact Assessment (SIA) frameworks would evaluate community well-being. Extending this methodology to other countries or regions and integrating it with other renewable energy technologies will provide a comprehensive understanding of sustainable energy solutions. Such a holistic approach not only enhances the foresight and breadth of a study like this, but also offers valuable “food for thought” and motive and opening ground for more researchers aiming to delve deeper into the environmental and social impacts of renewable energy technologies [88,89].
In the end, the major question is: what would happen if we went all-in on rooftop solar? How much energy might be generated only from rooftops? Unfortunately, the solution is difficult to provide. Simply speculating about what we might be able to achieve with rooftop solar cannot be reduced to a single figure, even when boundaries, such as solely encompassing a specified area, are imposed [90]. There is an excessive number of factors to consider, so it is not surprising that scholars have been striving to respond to this topic for years [91]. For the time being at least, we cannot provide you with a significant back-of-the-envelope estimate of how much rooftop solar can provide on a fully realized scale. However, what we can accomplish is to break down how our approach has worked so far, as well as how other academics have approached the problem, using several potential measurements. Even the notion of “potential” has various subcategories when it comes to assessing what we might achieve with renewables. As a result, the numbers obtained vary based on the type of potential you are considering. If you envisage a hypothetical pyramid similar to that of the United States National Renewable Energy Laboratory (NREL) [92], the foundation starts with the physical restrictions of rooftop solar. How much radiation does a particular rooftop get to start with for example? All things considered, the entire sum of radiation that a surface absorbs cannot be compared to the energy that it eventually generates, and this is due to more than simply the Shockley–Queisser limit of a solar panel.
That takes us to the technical potential of solar power and what a specific system has to offer in each fixed or dynamically changing environment and how effectively it operates. According to the NREL, technical potential measures that which can be physically deployed “without regard to market, economic, or policy constraints” [93]. In simple terms, calculating the technological potential for rooftop solar does not offer the whole picture. We still have to deal with how prices, policies, regulations, and public opinion limit what it can achieve for us in actual life. To PV or not to PV, that is the question.
As a result, determining the feasibility of rooftop solar is a complex and time-consuming process, even for a single location, not to mention all the other factors that might determine whether rooftop solar is viable or not. It is more than simply the tangible force of the sun. Researchers must also consider factors such as how many rooftops in a given region are flat, how many are shaded by adjacent structures, how the panels will be arranged, at what position, direction, slope etc. they will be placed, their efficiency, how rapidly they may degrade, what temperatures they will be exposed to, and the accumulation of dust or snow.
Only when one begins to investigate how social and economic factors might aid or impede solar’s technological potential, it rapidly became evident that the most substantial struggle is not space. The strategy is misleadingly straightforward: put as many solar panels as possible onto as many rooftops as practicable. Assessing priorities and anticipating implications on a case-by-case basis is significantly more complex. However, if solar’s tremendous increase in deployment, long-term cost reduction, and general advanced technological capability have taught us anything, it is that we are not running out of alternatives. So, certainly, there is space for solar that does not necessitate the clearing of enormous areas of land. The dual use implementation appears to be the secret to success [94].

5. Conclusions

We are well-positioned to make a substantial contribution to the current conversation in the energy sector, given the knowledge and understanding gained from our study on rooftop photovoltaic (PV) installations in Greece’s urban surroundings. Our study has identified promising directions for more investigation and innovation in addition to addressing important problems and difficulties unique to Greece’s urban solar potential. The ramifications of our research go beyond the confines of academia; it provides insightful information that may influence governmental choices, direct technical developments, and mold strategic planning in Greece’s energy industry. We reiterate the necessity and significance of sustainable and effective energy solutions in light of our world’s rapid evolution as we come to an end.
The application of remote sensing data in solar energy is a growing topic that offers great potential for the future of renewable energy. This technology can aid in the planning and administration of solar energy production, enabling the transition to renewable energy, integrating solar energy into the power grid, and developing solar energy regulations and markets. Recent improvements have even enabled machine learning algorithms to detect optimal solar-panel installation sites worldwide, indicating a larger number of installations than previously documented. This information can help inform attempts to reach global solar-energy ambitions. However, downscaling synoptic or large-scale data to a smaller, more localized size is a substantial problem in this sector. In meteorology, the synoptic scale is a horizontal length scale of 1000 km or more that is characteristic with mid-latitude depressions. Mesoscale weather events are those that are tiny enough to not be seen on a weather map. Mesoscale events range in size from a few kilometers to several hundred kilometers, with regional and local impacts. The challenge is correctly converting these large-scale data to smaller sizes, a problem that has yet to be fully addressed. The European Union (EU) has made concerted efforts to increase solar energy. The EU solar energy strategy presented in the REPowerEU plan seeks to establish solar energy as a cornerstone of the EU energy system. Measures to boost solar energy include making solar panel installation on new building rooftops mandatory within a specific timeframe, streamlining permitting procedures for renewable energy projects, improving the solar sector’s skills base, and increasing the EU’s capacity to manufacture photovoltaic panels.
This comprehensive study provides a detailed analysis of the potential for solar energy production in nine major Greek cities, considering the maximum possible exploitation of building rooftops for photovoltaic (PV) installation. It reveals that both the Cloud Modification Factor (CMF) and the Aerosol Modification Factor (AMF) for all Greek cities tend to increase over the decade under study, indicating a decrease in cloud cover and air pollution, respectively. This is particularly evident in Athens, where the range of variation of the average ten-year monthly energy losses due to suspended particles during 2014–2023 is smaller than that for 2010–2019, indicating a significant improvement in air quality and a decrease in PM2.5 particle levels over the years. The study also highlights the impact of climate change, with the disruption of seasonal phenomena becoming indirect but easily apparent, such as the replacement of mild rainfall with intense weather phenomena of short duration, and the increasing number of prolonged drier and warmer summers. Despite these challenges, the negative loss rates over the decade indicate that energy losses tend to decrease, leading to more energy available for exploitation by solar panels. The research further underscores the impact of European measures and policies on air pollutants and climate change, which have led to reduced levels of atmospheric aerosols and cloudiness, resulting in lower solar radiation effects and greater PV production. However, it also emphasizes the need for continued vigilance and action to mitigate the impacts of climate change and air pollution on solar energy production. In terms of energy losses due to clouds and aerosols, the study provides specific figures for each city. For instance, the highest annual average value of energy losses due to clouds is 45.60 kWh/m2 in Ioannina in 2014, while the lowest is 19.37 kWh/m2 in Patras in 2022. Similarly, the highest annual average value of energy losses due to aerosols is 37.98 kWh/m2 in Heraklion in 2018, while the lowest is 24.86 kWh/m2 in Kalamata in 2017.
Moreover, the study presents an ideal energy planning scenario that involves the theoretical maximum possible exploitation of building rooftops for PV installation. Under this scenario, seven of the nine cities could cover a little less than a fifth of their daily energy needs from photovoltaics on the roofs of their buildings. Particularly, Larissa and Ioannina seem to be close to covering a third of their daily energy requirements from a corresponding energy planning scheme. This approach not only harnesses an abundant natural resource but also circumvents the need for expansive land areas for solar farms, thus presenting a sustainable path towards energy sufficiency. The study also presents the financial implications of these energy losses. The losses due to shadowing amount to approximately EUR 11 million in Athens, EUR 2 million in Thessaloniki, and range from EUR 0.15 to 0.5 million in the other cities. The losses due to aerosols and clouds have similar value ranges, with those due to clouds slightly to significantly higher. For Athens, these losses range in the order of EUR 25–30 million, in Thessaloniki EUR 6–8 million, and in the other cities from EUR 0.5 to about 3 million. Under the specific conditions, prerequisites, and assumptions, Athens could reap a profit to the order of EUR 50 million annually, Thessaloniki approximately five times smaller, somewhere around EUR 10 million, and the rest of the cities from EUR 1 up to approximately 4.5 million. In terms of environmental impact, the study estimates the amount of CO2 emissions that could be avoided by maximizing the use of building rooftops for PV installation. The estimated avoided amount of emitted CO2 based on the maximum possible energy production from photovoltaics would be 1,281,486 metric tons for Athens, 286,690 metric tons for Thessaloniki, 79,162 metric tons for Patras, 85,575 metric tons for Heraklion, 108,633 metric tons for Larissa, 57,207 metric tons for Volos, 85,868 metric tons for Ioannina, 31,760 metric tons for Kalamata, and 30,702 metric tons for Kavala.
These findings underscore the significant potential for solar energy production in Greek cities and highlight the importance of optimal panel orientation and placement for maximizing energy production. They also suggest that adopting such an energy planning scenario could significantly contribute to meeting the daily energy needs of these cities and reducing CO2 emissions.
Regarding the current conditions around photovoltaics in Greece, the new law 5037/2023 (Government Gazette 78/28.03.2023, vol. A), in the context of the European policy to achieve the climate and energy goals of the Union for the year 2030 and in the wider context of its substantial long-term goal of a low-carbon economy by the year 2050, has brought about some significant changes in the energy sector. The most important of them consists of the expansion of responsibilities and the renaming of the “Energy Regulatory Authority”, the forms of energy communities, and the limits placed on virtual energy netting (virtual—net metering), which will now be able to be carried out by private individuals and businesses, to the owners of electricity generation stations from Renewable Energy Sources and High-Efficiency Cogeneration of Electricity—Heat that have drawn up an operational support contract (Feed-in Premium). Furthermore, changes were made to the non-tender tariff for “small” photovoltaic and wind farms, while the framework was set for the routing and ensuring the implementation of the projects, for which there is interest in concluding a Connection Agreement with the system. The new landscape in self-consumption and the main directions of the new law are as follows: (i) it sets limits to energy compensation (net-metering) as known by Greek consumers until recently, (ii) it promotes, in return, self-production in real time with sale of excess energy (net-billing), expanding power limits and the possibility of virtual net-billing, and (iii) establishes, for the first time, joint self-consumption, facilitating the installation of photovoltaics in apartment buildings (both for domestic, as well as for commercial consumers). It is becoming clear that the legal framework for renewable energy sources and the energy sector in general is changing and evolving to harmonize with European directives and lead us to a greener future. All these reforms are oriented in the right direction, since having already experienced the energy crisis, we should act with the aim of the autonomy of our country, through renewable energy sources. In this transition, every household consumer and every business interested in participating is called upon to act within the institutional framework to secure their interests. Recently, Haris Doukas, mayor of Athens, praised the promising prospects of the Greek capital, where solar energy has an important role to play because the citizen can, by utilizing solar energy through a solar revolution, so to speak, become not only energy independent, but also financially independent. The mayor argues that, in practice, a great effort can be made to combat energy poverty and create a new life expectancy and for this reason he envisions that the municipality of Athens and its citizens should also enter the game, aiming to create energetically active citizens who are eager to make use of municipal buildings and, above all, to put photovoltaics on roofs. The first initiative will probably be the schools, with the photovoltaics covering the needs of the school and, at a later stage, any surplus energy produced will be channeled to cover the needs of the poorest households in the surrounding neighborhoods. More generally, in Greece for at least the last two years, the records set by RES in the electricity generation mix have been broken one after the other, while the benefits for consumers are reflected in wholesale market prices. For as many hours as they dominate the mix of electricity generation, the prices move to zero. Finally, more specifically in this regard, it is worth noting that on the Greek Energy Exchange, for example on 8 April 2024, in the day ahead market, the share of RES (together with hydroelectric) in the energy mix for the production of electricity quantities needed by small and large consumers reached 75%. For 6 h that day, RES became almost absolutely dominant, covering over 90% of the demand. From 10 a.m. to 4 p.m. it ranged from 90.07% to 90.91%. The prices from 11 a.m. to 3 p.m. were fixed at EUR 0.03 and 0.04 per Megawatt hour; for 4 out of the total 5 h of the aforementioned time period, the hourly price of the wholesale market was at EUR 0.04 per Megawatt hour [95,96,97,98].
The research on the impact of aerosols and clouds on photovoltaic systems in urban Greek cities is a pioneering step towards addressing the dual challenges of the energy crisis and climate change. By harnessing freely available online data to assess the solar potential of urban rooftops, this study not only contributes to the creation of an updated solar potential map for Greece, but also sets a precedent for reproducibility and repeatability in renewable energy research. As cities, which house over 55% of the world’s population and consume 78% of global energy, become the epicenters of energy demand and greenhouse gas emissions, the significance of such research is amplified. The approach offers a scalable solution that aligns with the green transition, promoting energy self-sufficiency in urban centers while mitigating climate-related risks. This innovative methodology, grounded in realism and relevance to contemporary challenges, has the potential to inspire further studies across different regions, contributing to a collective effort in combating the climate crisis through sustainable urban energy strategies [99,100,101,102].
As we complete our analysis, we are reminded of the critical role that rooftop PV installations may play in influencing the energy future of Greece’s cities. The outcomes of this study highlight the necessity of ongoing investigation, innovation, and discussion in the energy sector. While we have made tremendous progress in understanding and improving rooftop PV systems in Greek cities, the path to sustainable and efficient energy solutions is far from complete. We hope that our study will act as a catalyst for further research and inspire novel solutions to the complicated energy issues we confront. Together, we can pave the route to a more sustainable energy future for Greece’s urban surroundings.

Author Contributions

Conceptualization, P.G.K.; methodology, P.G.K.; validation, P.G.K.; formal analysis, S.V.; investigation, S.V.; resources, P.G.K. and S.V.; data curation, S.V.; writing—original draft preparation, S.V.; writing—review and editing, P.G.K. and S.V.; visualization, S.V.; supervision, P.G.K.; project administration, P.G.K.; funding acquisition, P.G.K. All authors have read and agreed to the published version of the manuscript.

Funding

This research received no external funding.

Data Availability Statement

Data can be available upon request from the corresponding author.

Acknowledgments

The authors acknowledge the projects: “Support for Enhancing the Operation of the National Network for Climate Change (CLIMPACT)”, National Development Program, General Secretariat of Research and Innovation, Greece (2023ΝA11900001—Ν. 5201588); the project ThinkingEarth, funded under Grant Agreement number 101130544 by the Horizon Europe programme topic HORIZON-EUSPA-2022-SPACE-02-55, which promotes the large-scale Copernicus data uptake with AI and HPC; the Eiffel project under Grant Agreement No. 101003518.

Conflicts of Interest

The authors declare no conflicts of interest.

Appendix A

In Figure A1 below, two maps from the internet are listed for cross-checking and confirmation of the results of our own research. Figure A1 shows the energy map of Greece using PVGIS software from the work of Georgios A. Vokas et al. (2013) [103], while in Figure A2 the map that can be freely extracted online from the official SOLARGIS [104] site is presented. Directly below the figures follows Table A1 which gathers the average value of GHI for each city for the decade 2014–2023 and the corresponding value of Yearly PV energy production from PVGIS. Figure A2 presents the Solea [105] mean monthly solar energy map of Greece based on a multiyear climatology of the Global Horizontal Irradiance, while the spatial resolution is almost 5 km. The climatological radiation data are from the EUMETSAT’s Satellite Application Facility on Climate Monitoring (CM SAF).
Figure A1. (a) Energy map of Greece using PVGIS software (kWh/kWp) [103] (b) SOLARGIS’ PV power potential solar resource map for Greece (Solar resource map ©2021 Solargis) [104].
Energies 17 03821 g0a1
Figure A2. Climatological map of the total surface solar irradiation for the period 2014–2023.
Energies 17 03821 g0a2
Table A1. Annual ten-year (2014–2023) average GHI and corresponding PVGIS values.
CityGHI (kWh/m2)PVGIS (kWh/kWp)
Athens1796.31537.3
Thessaloniki1649.51404.2
Patras1813.81475.3
Heraklion1884.91494.5
Larissa1707.01367.1
Volos1703.51430.7
Ioannina1623.81356.4
Kalamata1818.01520.9
Kavala1622.41362.3
Georgios A. Vokas et al. (2013) [103] discovered that the prefectures with the lowest photovoltaic energy potential are Chalkidiki, Pieria, Kavala, and Imathia, with energy amounts ranging from 1380 kWh/kWp to 1440 kWh/kWp based on real energy measurements from medium-scale low voltage PV parks. The islands of the Aegean Sea, Rhodes, Crete, and the majority of Peloponnesus prefectures demonstrate the largest energy potential, with energy values ranging from 1670 kWh/kWp to 1810 kWh/kWp. Furthermore, they discovered a substantial consistent difference between the predicted and real (measured) data, with the latter always being higher than the former. It is worth noting that the highest energy value simulated by PVGIS software is nearly the lowest real value according to measurements.
Nevertheless, the most important conclusion of this case and this whole comparison is that apparently a very good agreement is observed between the three different approaches, ours, Vokas et al. (2013) [103] and Solargis [104].

References

  1. What Is Remote Sensing? Available online: https://www.earthdata.nasa.gov/learn/backgrounders/remote-sensing (accessed on 7 April 2024).
  2. Solar Radiation Basics. Available online: https://www.energy.gov/eere/solar/solar-radiation-basics (accessed on 7 April 2024).
  3. Müller, R.; Pfeifroth, U. Remote sensing of solar surface radiation—A reflection of concepts, applications and input data based on experience with the effective cloud albedo. Atmos. Meas. Tech. 2022, 15, 1537–1561. [Google Scholar] [CrossRef]
  4. The 100 Climate-Neutral and Smart Cities by 2030. Available online: https://eurocities.eu/latest/the-100-climate-neutral-and-smart-cities-by-2030/ (accessed on 7 April 2024).
  5. Green Transition. Available online: https://reform-support.ec.europa.eu/what-we-do/green-transition_en (accessed on 7 April 2024).
  6. REPowerEU. Affordable, Secure and Sustainable Energy for Europe. Available online: https://commission.europa.eu/strategy-and-policy/priorities-2019-2024/european-green-deal/repowereu-affordable-secure-and-sustainable-energy-europe_en (accessed on 7 April 2024).
  7. What Is the Green Transition? Available online: https://ym.fi/en/what-is-the-green-transition (accessed on 7 April 2024).
  8. Mitigation and Adaptation. Available online: https://climate.mit.edu/explainers/mitigation-and-adaptation (accessed on 7 April 2024).
  9. Solar Irradiance Data for Greece. Available online: https://solcast.com/solar-radiation-map/greece/ (accessed on 7 April 2024).
  10. Kosmopoulos, P.G.; Kazadzis, S.; Taylor, M.; Bais, A.F.; Lagouvardos, K.; Kotroni, V.; Keramitsoglou, I.; Kiranoudis, C. Estimation of the Solar Energy Potential in Greece Using Satellite and Ground-Based Observations. In Perspectives on Atmospheric Sciences; Springer International Publishing: Cham, Germany, 2017. [Google Scholar]
  11. Greece 2023 Executive Summary. Available online: https://www.iea.org/reports/greece-2023/executive-summary (accessed on 7 April 2024).
  12. Renewable Energy in Greece—Statistics & Facts. Available online: https://www.statista.com/topics/12083/renewable-energy-in-greece/ (accessed on 7 April 2024).
  13. Greece is World’s Second in Solar Energy Production Potential. Available online: https://greekreporter.com/2023/05/27/greece-world-second-solar-energy-production/ (accessed on 7 April 2024).
  14. Greece Launches €200 Million Residential Solar-Plus-Battery Subsidy Scheme. Available online: https://www.pv-magazine.com/2023/03/29/greece-launches-e200-million-residential-solar-plus-battery-subsidy-scheme-2/ (accessed on 7 April 2024).
  15. Copernicus Atmosphere Monitoring Service (CAMS). Available online: https://atmosphere.copernicus.eu/global-forecast-plots (accessed on 15 January 2024).
  16. Eskes, H.; Huijnen, V.; Arola, A.; Benedictow, A.; Blechschmidt, A.-M.; Botek, E.; Boucher, O.; Bouarar, I.; Chabrillat, S.; Cuevas, E.; et al. Validation of reactive gases and aerosols in the MACC global analysis and forecast system. Geosci. Model Dev. 2015, 8, 3523–3543. [Google Scholar] [CrossRef]
  17. Dee, D.P.; Uppala, S. Variational bias correction of satellite radiance data in the ERA-Interim reanalysis. Q. J. R. Meteorol. Soc. 2009, 135, 1830–1841. [Google Scholar] [CrossRef]
  18. Roebeling, R.A.; Fejit, A.J.; Stamnes, P. Cloud property retrievals for climate monitoring: Implications of differences between SEVIRI on METEOSAT-8 and AVHRR on NOAA-17. J. Geophys. Res. 2006, 111, 20210. [Google Scholar] [CrossRef]
  19. Geospatial Interactive Online Visualization ANd aNalysis Infrastructure. Available online: https://giovanni.gsfc.nasa.gov/giovanni/ (accessed on 12 February 2024).
  20. Kosmopoulos, P.; Dhake, H.; Kartoudi, D.; Tsavalos, A.; Koutsantoni, P.; Katranitsas, A.; Lavdakis, N.; Mengou, E.; Kashyap, Y. Ray-Tracing modeling for urban photovoltaic energy planning and management. Appl. Energy 2024, 369, 123516. [Google Scholar] [CrossRef]
  21. OpenStreetMap (OSM). Free, Open Geographic Database. Available online: https://www.openstreetmap.org/ (accessed on 10 January 2024).
  22. Quantum Geographic Information System (QGIS). Available online: https://qgis.org/en/site/ (accessed on 9 January 2024).
  23. CAMS Radiation Service—SoDa. Available online: https://www.soda-pro.com/web-services/radiation/cams-radiation-service (accessed on 15 January 2024).
  24. CAMS-AOD—SoDa. Available online: https://www.soda-pro.com/web-services/atmosphere/cams-aod (accessed on 15 January 2024).
  25. Photovoltaic Geographical Information System. Available online: https://re.jrc.ec.europa.eu/pvg_tools/en/ (accessed on 13 February 2024).
  26. Global Solar Atlas. Available online: https://globalsolaratlas.info/map (accessed on 15 January 2024).
  27. Global Monitoring Laboratory—Earth System Laboratory. Available online: https://gml.noaa.gov/ (accessed on 15 January 2024).
  28. Silva, M.; Roberts, J.J.; Prado, P.O. Calculation of the Shading Factors for Solar Modules with MATLAB. Energies 2021, 14, 4713. [Google Scholar] [CrossRef]
  29. Shading Losses in PV Systems, and Techniques to Mitigate them. Available online: https://aurorasolar.com/blog/shading-losses-in-pv-systems-and-techniques-to-mitigate-them/ (accessed on 1 April 2024).
  30. Morakinyo, T.; Kong, L.; Lau, K.; YUAN, C.; Ng, E. A study on the impact of shadow-cast and tree species on in-canyon and neighborhood′s thermal comfort. Build. Environ. 2017, 115, 1–17. [Google Scholar] [CrossRef]
  31. Orbit Urban Office Campus, Greece. Available online: https://darcawards.com/portfolio/orbit-urban-office-campus-greece/ (accessed on 22 May 2024).
  32. Vo, A.; Laefer, D. A Big Data Approach for Comprehensive Urban Shadow Analysis from Airborne Laser Scanning Point Clouds. ISPRS Ann. Photogramm. Remote Sens. Spat. Inf. Sci. 2019, IV-4/W8, 131–137. [Google Scholar] [CrossRef]
  33. Xu, L.; León-Sánchez, C.; Agugiaro, G.; Stoter, J. Shadowing Calculation on Urban Areas from Semantic 3D City Models. In International 3D GeoInfo Conference; Springer Nature: Cham, Germany, 2024. [Google Scholar] [CrossRef]
  34. Groves, P.; Wang, L.; Adjrad, M.; Ellul, C. GNSS Shadow Matching: The Challenges Ahead. In Proceedings of the 28th International Technical Meeting of The Satellite Division of the Institute of Navigation (ION GNSS+ 2015), Tampa, FL, USA, 14–18 September 2015. [Google Scholar]
  35. Raju, P.; Chaudhary, H.; Jha, A. Shadow Analysis Technique for Extraction of Building Height using High Resolution Satellite Single Image and Accuracy Assessment. ISPRS—Int. Arch. Photogramm. Remote Sens. Spat. Inf. Sci. 2014, XL-8, 1185–1192. [Google Scholar] [CrossRef]
  36. Xie, Y.; Feng, D.; Xiong, S.; Zhu, J.; Liu, Y. Multi-Scene Building Height Estimation Method Based on Shadow in High Resolution Imagery. Remote Sens. 2021, 13, 2862. [Google Scholar] [CrossRef]
  37. 7 Ways Shadow Studies Can Impact Building Design. Available online: https://cove.tools/blog/7-ways-shadow-studies-impact-building-design (accessed on 22 May 2024).
  38. Shadows and Angles: Measuring Object Heights from Satellite Imagery. Available online: https://www.geographyrealm.com/shadows-angles-measuring-object-heights-satellite-imagery/ (accessed on 22 May 2024).
  39. Hao, H.; Baireddy, S.; Bartusiak, E.; Gupta, M.; LaTourette, K.; Konz, L.; Chan, M.; Comer, M.; Delp, E. Building height estimation via satellite metadata and shadow instance detection. In Automatic Target Recognition XXXI; SPIE: Bellingham, WA, USA, 2021. [Google Scholar] [CrossRef]
  40. Wikipedia. The Free Encyclopedia. Athens. Available online: https://en.wikipedia.org/wiki/Athens (accessed on 16 April 2024).
  41. Climate Data for Cities Worldwide. Available online: https://en.climate-data.org/ (accessed on 16 April 2024).
  42. Weather Atlas. Available online: https://www.weather-atlas.com/ (accessed on 16 April 2024).
  43. Papadogiannaki, S.; Kontos, S.; Parliari, D.; Melas, D. Machine Learning Regression to Predict Pollen Concentrations of Oleaceae and Quercus Taxa in Thessaloniki, Greece. Environ. Sci. Proc. 2023, 26, 2. [Google Scholar] [CrossRef]
  44. Vasilatou, V.; Manousakas, M.; Gkini, M.; Diapouli, E.; Scoullos, M.; Eleftheriadis, K. Long Term Flux of Saharan Dust to the Aegean Sea around the Attica Region, Greece. Front. Mar. Sci. 2017, 4, 42. [Google Scholar] [CrossRef]
  45. Logothetis, I.; Tourpali, K.; Misios, S. The Evolution of Etesians: Trends in 20th Century and Future Projections. In Perspectives on Atmospheric Sciences; Karacostas, T., Bais, A., Nastos, P., Eds.; Springer Atmospheric Sciences: Cham, Switzerland, 2017. [Google Scholar] [CrossRef]
  46. Aktypis, A.; Kaltsonoudis, C.; Patoulias, D.; Kalkavouras, P.; Matrali, A.; Vasilakopoulou, C.N.; Kostenidou, E.; Florou, K.; Kalivitis, N.; Bougiatioti, A.; et al. Significant spatial gradients in new particle formation frequency in Greece during summer. Atmos. Chem. Phys. 2024, 24, 65–84. [Google Scholar] [CrossRef]
  47. Politikos, D.V.; Ioakeimidis, C.; Papatheodorou, G.; Tsiaras, K. Modeling the Fate and Distribution of Floating Litter Particles in the Aegean Sea (E. Mediterranean). Front. Mar. Sci. 2017, 4, 191. [Google Scholar] [CrossRef]
  48. Masoom, A.; Fountoulakis, I.; Kazadzis, S.; Raptis, I.-P.; Kampouri, A.; Psiloglou, B.E.; Kouklaki, D.; Papachristopoulou, K.; Marinou, E.; Solomos, S.; et al. Investigation of the effects of the Greek extreme wildfires of August 2021 on air quality and spectral solar irradiance. Atmos. Chem. Phys. 2023, 23, 8487–8514. [Google Scholar] [CrossRef]
  49. Vigkos, S.; Kosmopoulos, P.G.; Papayannis, A. Solar Photovoltaic Energy Production Conditions in the Urban Environment of Athens, Cairo, Granada and Vienna. Environ. Sci. Proc. 2023, 26, 24. [Google Scholar] [CrossRef]
  50. Climate Change Report Warns of More Heatwaves, Sea Level Rise in Greece. Available online: https://greekreporter.com/2021/08/17/climate-change-report-warns-greece-heatwaves-sea-level-rise/ (accessed on 6 April 2024).
  51. Kourtinos, C.; Pappas, V. Greek Cities and Formal Planning. In The Geography of Greece; World Regional Geography Book Series; Darques, R., Sidiropoulos, G., Kalabokidis, K., Eds.; Springer: Cham, Switzerland, 2024. [Google Scholar] [CrossRef]
  52. Karagianni, M. Making Thessaloniki Resilient? The Enclosing Process of the Urban Green Commons. Urban Plan. 2023, 8, 346–360. [Google Scholar] [CrossRef]
  53. Athens Bets on Green Infrastructure and Biodiversity. Available online: https://www.eib.org/en/stories/athens-climate-adaptation (accessed on 5 April 2024).
  54. Pitidis, V.; Tapete, D.; Coaffee, J.; Kapetas, L.; Porto de Albuquerque, J. Understanding the Implementation Challenges of Urban Resilience Policies: Investigating the Influence of Urban Geological Risk in Thessaloniki, Greece. Sustainability 2018, 10, 3573. [Google Scholar] [CrossRef]
  55. Poulicos, P.; Apostolos, L.; Nektarios, C. Using the Urban Atlas Dataset for Estimating Spatial Metrics. Methodology and application in urban areas of Greece. 2017. Available online: http://journals.openedition.org/cybergeo/28051 (accessed on 16 April 2024).
  56. Climate and Average Weather Year Round in Greece. Available online: https://weatherspark.com/countries/GR (accessed on 5 April 2024).
  57. Raptis, I.-P.; Kazadzis, S.; Amiridis, V.; Gkikas, A.; Gerasopoulos, E.; Mihalopoulos, N. A Decade of Aerosol Optical Properties Measurements over Athens, Greece. Atmosphere 2020, 11, 154. [Google Scholar] [CrossRef]
  58. Katsanos, D.; Bougiatioti, A.; Liakakou, E.; Kaskaoutis, D.G.; Stavroulas, I.; Paraskevopoulou, D.; Lianou, M.; Psiloglou, B.E.; Gerasopoulos, E.; Pilinis, C.; et al. Optical Properties of Near-Surface Urban Aerosols and their Chemical Tracing in a Mediterranean City (Athens). Aerosol Air Qual. Res. 2019, 19, 49–70. [Google Scholar] [CrossRef]
  59. Founda, D.; Nastos, P.T.; Pierros, F.; Kalimeris, A. Historical observations of cloudiness (1882–2012) over a large urban area of the eastern Mediterranean (Athens). Theor. Appl. Climatol. 2019, 137, 283–295. [Google Scholar] [CrossRef]
  60. Greece’s Record Rainfall and Flash Floods Are Part of a Trend—Across the Mediterranean, the Weather Is Becoming more Dangerous. Available online: https://theconversation.com/greeces-record-rainfall-and-flash-floods-are-part-of-a-trend-across-the-mediterranean-the-weather-is-becoming-more-dangerous-213164 (accessed on 6 April 2024).
  61. Esotc 2021|Europe Clouds and Sunshine Duration. Available online: https://climate.copernicus.eu/esotc/2021/clouds-and-sunshine-duration (accessed on 6 April 2024).
  62. Li, Q.; Groß, S. Satellite observations of seasonality and long-term trends in cirrus cloud properties over Europe: Investigation of possible aviation impacts. Atmos. Chem. Phys. 2022, 22, 15963–15980. [Google Scholar] [CrossRef]
  63. Papachristopoulou, K.; Raptis, I.-P.; Gkikas, A.; Fountoulakis, I.; Masoom, A.; Kazadzis, S. Aerosol optical depth regime over megacities of the world. Atmos. Chem. Phys. 2022, 22, 15703–15727. [Google Scholar] [CrossRef]
  64. More Sunshine in Europe Due to Cleaner Air. Available online: https://user.eumetsat.int/resources/case-studies/more-sunshine-in-europe-due-to-cleaner-air (accessed on 6 April 2024).
  65. Mortier, A.; Gliß, J.; Schulz, M.; Aas, W.; Andrews, E.; Bian, H.; Chin, M.; Ginoux, P.; Hand, J.; Holben, B.; et al. Evaluation of climate model aerosol trends with ground-based observations over the last 2 decades—An AeroCom and CMIP6 analysis, Atmos. Chem. Phys. 2020, 20, 13355–13378. [Google Scholar] [CrossRef]
  66. Kosmopoulos, P.G.; Mechilis, M.T.; Kaoura, P. Solar Energy Production Planning in Antikythera: Adequacy Scenarios and the Effect of the Atmospheric Parameters. Energies 2022, 15, 9406. [Google Scholar] [CrossRef]
  67. Ministerial Decision YPEN/DAPEEK/53563/1556/2023—Official Gazette 3328/B/19-5-2023. Available online: https://ypen.gov.gr/wp-content/uploads/2023/05/FEK-2023-Tefxos-B-03328-downloaded-22_05_2023.pdf (accessed on 17 April 2024).
  68. Anagnostopoulos, P.; Spyridaki, N.-A.; Flamos, A. A “New-Deal” for the Development of Photovoltaic Investments in Greece? A Parametric Techno-Economic Assessment. Energies 2017, 10, 1173. [Google Scholar] [CrossRef]
  69. Fountoukis, C.; Figgis, B.; Ackermann, L. Effects of atmospheric dust deposition on solar PV energy production in a desert environment. Sol. Energy 2018, 164, 94–100. [Google Scholar] [CrossRef]
  70. Hiroyuki, K.; Bing, G. Improvement of an electrostatic cleaning system for removal of dust from solar panels. J. Electrost. 2018, 91, 28–33. [Google Scholar] [CrossRef]
  71. Kosmopoulos, P.G.; Kazadzis, S.; El-Askary, H.; Taylor, M.; Gkikas, A.; Proestakis, E.; Kontoes, C.; El-Khayat, M.M. Earth-Observation-Based Estimation and Forecasting of Particulate Matter Impact on Solar Energy in Egypt. Remote Sens. 2018, 10, 1870. [Google Scholar] [CrossRef]
  72. Masoom, A.; Kosmopoulos, P.; Kashyap, Y.; Kumar, S.; Bansal, A. Rooftop Photovoltaic Energy Production Management in India Using Earth-Observation Data and Modeling Techniques. Remote Sens. 2020, 12, 1921. [Google Scholar] [CrossRef]
  73. Kurdi, Y.; Asadi, S. The Impact of Large Deployment of Distributed Solar Photovoltaic at the Urban Scale on the Building Performance and the Correlation Between Energy Supply and Demand Over the Grid. In Renewable Energy for Buildings. Green Energy and Technology; Sadat-Mohammadi, M., Nazari-Heris, M., Asadi, S., Mohammadi-Ivatloo, B., Jebelli, H., Eds.; Springer: Cham, Germany, 2022. [Google Scholar] [CrossRef]
  74. Brown, K.; Baniassadi, A.; Pham, J.; Sailor, D.; Phelan, P. Effects of Rooftop Photovoltaics on Building Cooling Demand and Sensible Heat Flux Into the Environment for an Installation on a White Roof. ASME J. Eng. Sustain. Build. Cities 2020, 1, 1–2. [Google Scholar] [CrossRef]
  75. Solar PV on Municipal Buildings: A Guide to Feasibility and Financial Analysis. Available online: https://www.c40knowledgehub.org/s/article/Solar-PV-on-municipal-buildings-a-guide-to-feasibility-and-financial-analysis?language=en_US (accessed on 17 April 2024).
  76. Solar Explained. Solar Energy and the Environment. Available online: https://www.eia.gov/energyexplained/solar/solar-energy-and-the-environment.php (accessed on 5 April 2024).
  77. Carbon Dioxide Emissions Coefficients. Available online: https://www.eia.gov/environment/emissions/co2_vol_mass.php (accessed on 5 April 2024).
  78. A Reality Check about Solar Panel Waste and the Effects on Human Health. Available online: https://insideclimatenews.org/news/12102023/inside-clean-energy-reality-check-solar-panel-waste/ (accessed on 5 April 2024).
  79. What Is the Carbon Footprint of Solar Panels? Available online: https://www.solar.com/learn/what-is-the-carbon-footprint-of-solar-panels/ (accessed on 5 April 2024).
  80. Yes, Solar Panels Produce Pollution, Here’s How? Available online: https://www.riddlelife.com/yes-solar-panels-produce-pollution-heres-how/ (accessed on 5 April 2024).
  81. Greenhouse Gas Equivalencies Calculator|US EPA. Available online: https://www.epa.gov/energy/greenhouse-gas-equivalencies-calculator (accessed on 28 March 2024).
  82. Greece Population 2024 (Live) World Population Review. Available online: https://worldpopulationreview.com/countries/greece-population (accessed on 23 May 2024).
  83. Rooftop Photovoltaics Paired with Energy Efficiency: The Key for Sustainable Cities around the World. Available online: https://joint-research-centre.ec.europa.eu/jrc-news-and-updates/rooftop-photovoltaics-paired-energy-efficiency-key-sustainable-cities-around-world-2024-01-18_en (accessed on 28 March 2024).
  84. Tapia, M.; Ramos, L.; Heinemann, D.; Zondervan, E. Power to the city: Assessing the rooftop solar photovoltaic potential in multiple cities of Ecuador. Phys. Sci. Rev. 2023, 8, 2285–2319. [Google Scholar] [CrossRef]
  85. Emissions More Per Acre Than Trees—And Much More Than Corn Ethanol. Available online: https://news.climate.columbia.edu/2022/10/26/solar-panels-reduce-co2-emissions-more-per-acre-than-trees-and-much-more-than-corn-ethanol/ (accessed on 5 April 2024).
  86. Fakhraian, E.; Alier, M.; Valls Dalmau, F.; Nameni, A.; Casañ Guerrero, M.J. The Urban Rooftop Photovoltaic Potential Determination. Sustainability 2021, 13, 7447. [Google Scholar] [CrossRef]
  87. Kozlovas, P.; Gudzius, S.; Ciurlionis, J.; Jonaitis, A.; Konstantinaviciute, I.; Bobinaite, V. Assessment of Technical and Economic Potential of Urban Rooftop Solar Photovoltaic Systems in Lithuania. Energies 2023, 16, 5410. [Google Scholar] [CrossRef]
  88. Alomoto, W.; Niñerola, A.; Pié, L. Social Impact Assessment: A Systematic Review of Literature. Soc. Indic. Res. 2022, 161, 225–250. [Google Scholar] [CrossRef]
  89. Evelyn, E.G.; David, M.B.; Max, C.N.C.; Daniel, L.C.; Peter, M.G.; Jackson, C.R.; John, S.K.; Debra, P.C.P.; Steward, T.A.P.; Julie, R.; et al. Long-Term Ecological Research and Evolving Frameworks of Disturbance Ecology. BioScience 2020, 70, 141–156. [Google Scholar] [CrossRef]
  90. Hong, T.; Lee, M.; Koo, C.; Jeong, K.; Kim, J. Development of a method for estimating the rooftop solar photovoltaic (PV) potential by analyzing the available rooftop area using Hillshade analysis. Appl. Energy 2017, 194, 320–332. [Google Scholar] [CrossRef]
  91. Angliviel de La Beaumelle, N.; Blok, K.; de Chalendar, J.; Clarke, L.; Hahmann, A.; Huster, J.; Nemet, G.; Suri, D.; Wild, T.; Azevedo, I. The Global Technical, Economic, and Feasible Potential of Renewable Electricity. Annu. Rev. Environ. Resour. 2023, 48, 419–449. [Google Scholar] [CrossRef]
  92. Renewable Energy Technical Potential. Available online: https://www.nrel.gov/gis/re-potential.html (accessed on 24 July 2024).
  93. Technical Potential and Meaningful Benefits of Community Solar in the United States. Available online: https://www.nrel.gov/docs/fy24osti/87524.pdf (accessed on 24 July 2024).
  94. Can Solar Rooftops Power the World? Available online: https://undecidedmf.com/can-solar-rooftops-power-the-world/ (accessed on 24 July 2024).
  95. The New Law 5037/2023 and the Changes It Brought about in the Energy Sector. Available online: https://yiannatsis.gr/o-neos-nomos-5037-2023-kai-oi-allages-poy-epefere-ston-tomea-tis-energeias/ (accessed on 15 April 2024).
  96. The New Regulations of Law 5037/2023 for Photovoltaics, Self-Consumption and Energy Communities. Available online: https://texnimon.gr/oi-nees-rythmiseis-tou-n-5037-2023-gia-fotovoltaika-aftokatanalosi-kai-energeiakes-koinotites/ (accessed on 15 April 2024).
  97. How APE almost Zeroed Electricity Prices for 5 Hours. Available online: https://www.in.gr/2024/04/08/in-science/perivallon-b-science/pos-oi-ape-sxedon-midenisan-tis-times-tou-reymatos-gia-5-ores/ (accessed on 10 April 2024).
  98. Solar Saves. Available online: https://www.solarpowereurope.org/advocacy/solar-saves (accessed on 10 April 2024).
  99. Urban Energy. Available online: https://unhabitat.org/topic/urban-energy (accessed on 11 April 2024).
  100. Hannah Ritchie, Pablo Rosado and Max Roser (2020)—“Energy Production and Consumption” Published online at OurWorldInData.org. Available online: https://ourworldindata.org/energy-production-consumption (accessed on 11 April 2024).
  101. IEA. Key World Energy Statistics 2021; IEA: Paris, France, 2021; Available online: https://www.iea.org/reports/key-world-energy-statistics-2021 (accessed on 11 April 2024).
  102. Energy 101—Cities & Rising Energy Consumption. Available online: https://studentenergy.org/energy-101-cities-rising-energy-consumption/ (accessed on 11 April 2024).
  103. Vokas, G.; Lagogiannis, K.V. PV Energy Production Over Greece: Comparison of Predicted and Measured Data of Medium-Scale Photovoltaic Parks. Int. J. Eng. Res. Technol. 2013, 2, 3005–3011. [Google Scholar]
  104. Solargis: Solar Irradiance Data. Available online: https://solargis.com/ (accessed on 30 March 2024).
  105. Solea|Solar Energy Applications. Available online: https://solea.gr/ (accessed on 15 February 2024).
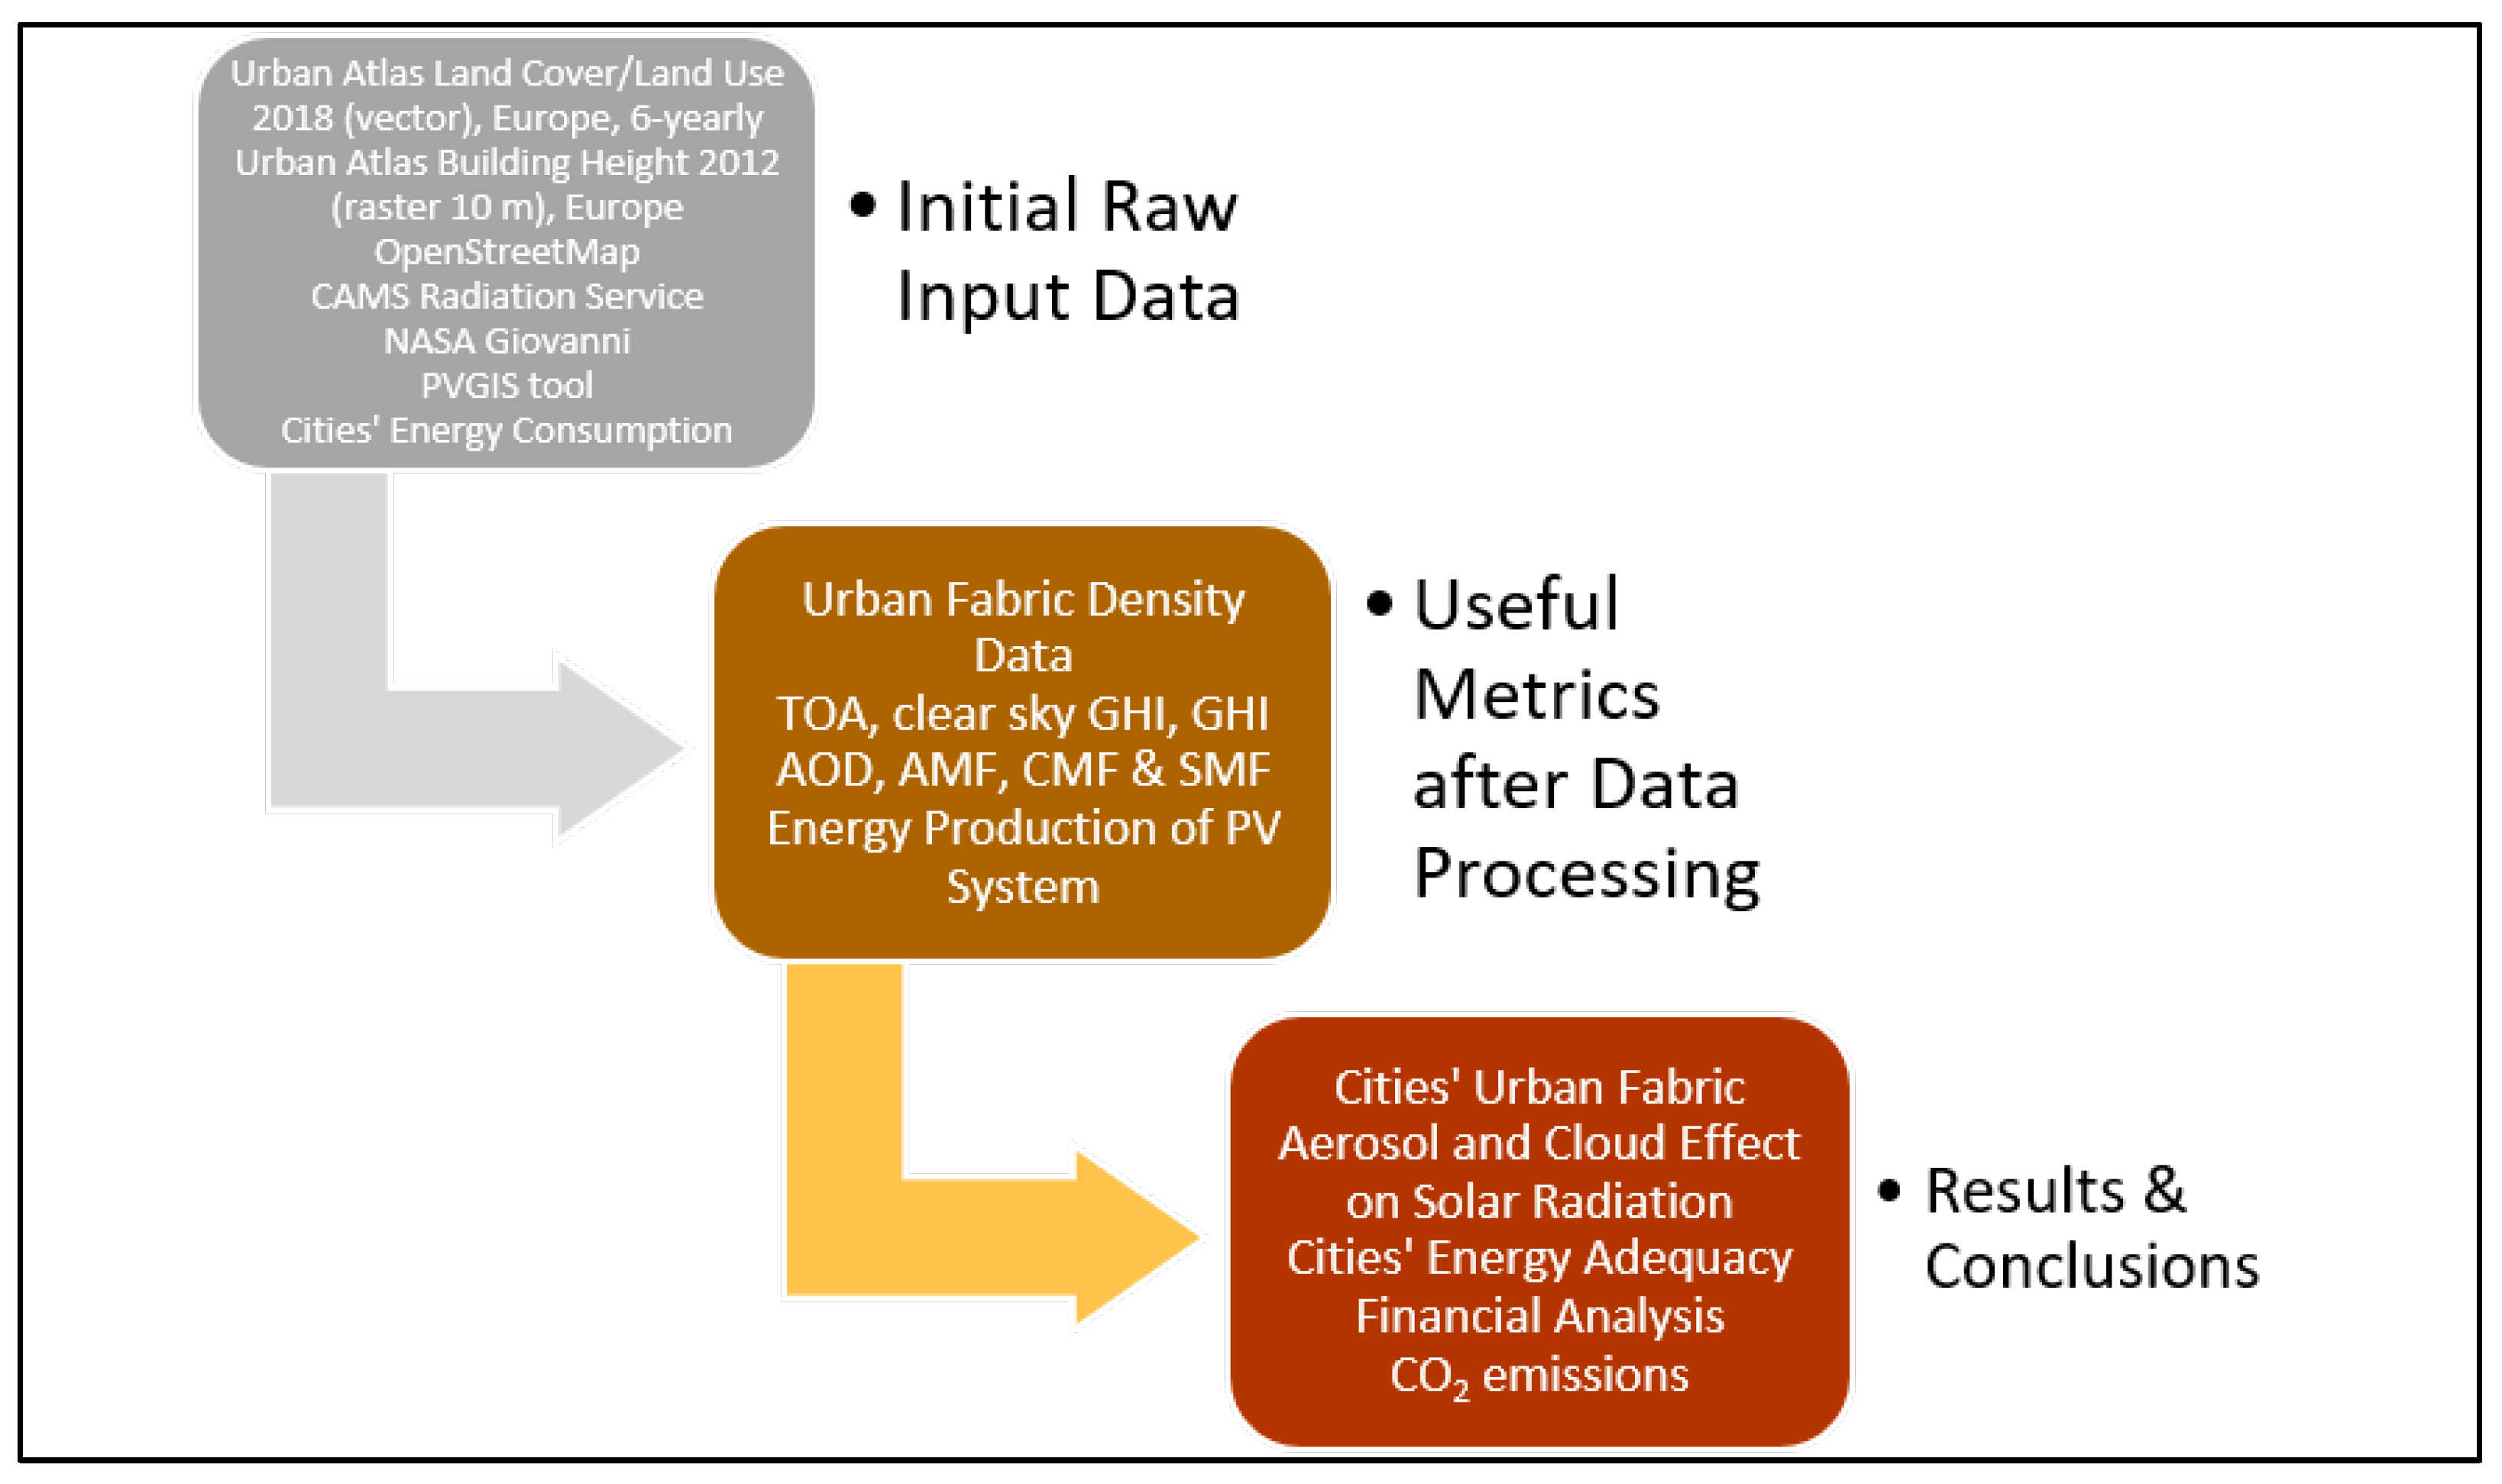
Figure 1. Step-down process SmartArt graphic summarizing the entire structure, methodology and main findings of the study.
Energies 17 03821 g001
Figure 2. Basic turning process SmartArt showing the sequential steps in the process of extracting the total compatible and exploitable area of each city for the installation of PV on the roofs of buildings.
Energies 17 03821 g002
Figure 3. Nine panel graph of the city maps in QGIS showing the distribution of the five different classes.
Energies 17 03821 g003
Figure 4. Summary figure of the four column charts of the different kinds of cumulative areas of interest for each of the nine cities.
Energies 17 03821 g004
Figure 5. Graphical quantitative visualization of Figure 3’s data: (a) Clustered bar graph of the area of each class and total area of the five density urban fabrics for each city; (b) 100% cumulative bar graph of the area of each class and total area of five density urban fabrics for each city.
Energies 17 03821 g005
Figure 6. (a) Monthly decadal average AMF in the nine cities of interest during the decade 2014–2023; (b) Monthly decadal average AOD @550 nm in the nine cities of interest during the decade 2014–2023.
Energies 17 03821 g006
Figure 7. (a) Monthly decadal average CMF in the nine cities of interest during the decade 2014–2023; (b) Monthly decadal average SMF in the nine cities of interest during the decade 2014–2023.
Energies 17 03821 g007
Figure 8. Monthly variations of CMF, AMF and SMF.
Energies 17 03821 g008
Figure 9. Monthly panel graphs for (a) average sums of energy losses owing to aerosols and (b) average sums of energy losses due to clouds in the nine cities of interest from 2014 to 2023.
Energies 17 03821 g009
Figure 10. Average monthly electricity production from the defined system (kWh) using the PVGIS online tool (a) for the optimized slope and (b) slope equal to zero (horizontal).
Energies 17 03821 g010
Figure 11. Annual % percentage of energy adequacy that each city can benefit from to meet its daily energy demands, if the scenario of installing PV on all exploitable and compatible rooftops of their buildings was adopted.
Energies 17 03821 g011
Table 1. Detailed mapping in the form of a table of the areas of the five different classes for each city, the factors of building density and PV exploitability and compatibility and by extension the final total exploitable and compatible area of each city for the installation and utilization of solar panels on the roofs of the buildings. Total Exploit. and Comp. Areas result from the sum of the individual S.L. Areas multiplied each by the corresponding Building Density Factors and PV Exploit. and Comp. Factors, as indicated by the numbers in parentheses.
CityS.L. > 80%
Area
(km2) (1)
S.L.: 50–80%
Area
(km2) (2)
S.L.: 30–50%
Area
(km2) (3)
S.L.: 10–30%
Area
(km2) (4)
S.L. < 10%
Area
(km2) (5)
Building
Density
Factors
PV Exploit. and Compat. FactorsTotal Exploit. and Compat. Area (km2)
Athens108.9125.596.176.013.30.585 (1)0.168 (1)24.5
Thessaloniki31.940.611.21.63.00.365 (2)0.154 (2)6.0
Patras4.88.59.36.22.10.302 (3)0.147 (3)1.6
Heraklion4.28.312.87.31.50.271 (4)0.112 (4)1.7
Larissa10.517.36.51.20.40.171 (5)0.063 (5)2.3
Volos6.65.42.53.21.0 1.2
Ioannina4.516.58.03.81.4 1.9
Kalamata1.92.73.13.92.0 0.6
Kavala3.24.02.11.00.1 0.7
Table 2. Average height for each class separately over 3 m and for all classes in total.
CityAverage
S.L. > 80%
Height
(m)
Average
S.L.: 50–80%
Height
(m)
Average
S.L.: 30–50%
Height
(m)
Average
S.L.: 10–30%
Height
(m)
Average
S.L. < 10%
Height
(m)
Average All S.L.s Height
(m)
Athens12.599.868.236.966.4011.33
Thessaloniki8.645.706.395.865.078.47
Patras7.855.714.644.544.336.38
Heraklion6.696.516.246.005.816.55
Larissa6.155.134.193.433.615.88
Volos6.794.523.923.424.526.31
Ioannina7.145.715.055.385.296.42
Kalamata7.476.425.094.363.896.29
Kavala7.245.454.253.677.506.92
Table 3. Annual percentage change in AMF, CMF, GHI, and energy losses due to clouds and aerosols for the decade 2014–2023.
Annual % Percentage Change during the Decade 2014–2023
CityCMFAMFGHI (kWh/m2)Losses Due to Clouds (kWh/m2)Losses Due to Aerosols (kWh/m2)
Athens0.250.1335.31−25.82−26.13
Thessaloniki0.590.2192.31−74.91−36.89
Patras0.450.0472.31−63.22−10.38
Heraklion0.340.1457.07−38.64−29.25
Larissa0.470.0273.33−57.54−0.08
Volos0.440.0266.43−54.60−0.63
Ioannina0.470.0780.10−56.33−14.04
Kalamata0.370.0571.59−55.61−2.37
Kavala0.360.1955.95−39.18−36.10
Table 4. A condensed representation of the essential components of each city’s energy planning scenario.
CityTotal Exploitable and Compatible Area (km2)Consumption (GWh)Production (GWh)% Percentage of
Energy Adequacy
Athens24.469920.931834.3918
Thessaloniki5.992759.83410.3815
Patras1.57656.72113.3217
Heraklion1.68645.12122.5019
Larissa2.33450.45155.5035
Volos1.17427.5981.8919
Ioannina1.86417.26122.9229
Kalamata0.61243.0445.4619
Kavala0.66202.4443.9522
Table 5. Summary table of the key elements of the financial analysis corresponding to the energy planning scenario for each city. Net Profit is equal to Earnings minus Monetary Losses.
CityML Due to
Shadows (MEUR)
ML Due to
Aerosols (MEUR)
ML Due to Clouds (MEUR)Total ML (MEUR)Earnings (MEUR)Profit (MEUR)
Athens11.3124.6529.9265.88115.5749.69
Thessaloniki1.955.978.1116.0325.859.82
Patras0.371.371.673.417.143.73
Heraklion0.431.761.974.167.723.56
Larissa0.492.032.905.429.804.38
Volos0.281.071.522.875.162.29
Ioannina0.451.632.914.997.742.75
Kalamata0.150.500.671.322.861.54
Kavala0.170.680.911.762.771.01
Table 6. Estimated avoided amount of emitted CO2 based on the maximum possible energy production from photovoltaics on the final exploitable and compatible set of building roofs of each city.
CityProduction (GWh)CO2 Equivalent (Metric Tons)Population [82]Per Capita CO2 Emissions Avoided (Mt)
Athens1834.391,281,4863,154,5910.406
Thessaloniki410.38286,690814,9800.352
Patras113.3279,162215,9220.367
Heraklion122.5085,575154,5990.554
Larissa155.50108,633175,9950.617
Volos81.8957,20790,9720.628
Ioannina122.9285,86885,8031.001
Kalamata45.4631,76054,0270.588
Kavala43.9530,70260,0000.512
Disclaimer/Publisher’s Note: The statements, opinions and data contained in all publications are solely those of the individual author(s) and contributor(s) and not of MDPI and/or the editor(s). MDPI and/or the editor(s) disclaim responsibility for any injury to people or property resulting from any ideas, methods, instructions or products referred to in the content.