1. Introduction
Energy poverty (EP) presents a situation in which households do not have sufficient access to modern energy services or cannot afford to heat their homes and provide other basic energy needs such as lighting, cooking, or water heating. This situation can be caused by various factors such as low incomes, high-energy prices, and inefficient or outdated energy equipment and buildings.
Energy poverty can seriously affect the quality of life, including negative health effects, increased healthcare costs, and social isolation. Addressing energy poverty involves improving the energy efficiency of buildings, promoting access to available energy resources, and providing financial assistance to low-income households. One of the solutions is also the use of renewables. The use of renewable energy sources can significantly contribute to solving the problem of energy poverty in several ways, for example, by reducing energy costs, energy independence, improving energy efficiency, supporting sustainable development, and through government support.
As mentioned, when there is a lack of studies on energy poverty in post-communist countries, the paper aims to evaluate energy poverty from the view of heating and cooling days and the percentage of the population that cannot maintain adequate heat at home. Slovakia was chosen to represent post-communist countries that can be compared with other EU countries.
The article begins by establishing the present state of problem-solving through a literature review. Subsequently, information on the proposed methodology is included, together with materials and contributions to the academic field. Next, the article provides the results of the analysis, supported by the discussion of the obtained results, compared with similar research by different authors. Finally, the article concludes with the main use of the results, limitations of the research, and the future orientation of the research.
2. Literature Review
In the early 1990s, energy poverty was broadly defined as households that had a 10% rate of bills for energy on net income. Mold and Baker used this definition to assess the situation in Scotland [
1]. According to the indicator of high-energy costs and low-income, Belaid found that 12% of households in France were in energy poverty [
2]. The context of energy poverty was once limited to the United Kingdom, where it struggled for years to gain political recognition but slowly began to enter the EU agenda [
3]. Anderson et al. investigated how low-income households in Great Britain cope with limited financial resources during winter months [
4]. Specifically, it was found that 63% of low-income households reduced their energy use in the winter, and 47% experienced colder homes. Improving the thermal performance of homes has reduced, but not eliminated, the risk of a cold, as heating costs could burden the lowest-income households. Bouzarovski et al. evaluated the relationship between fuel poverty and energy vulnerability for ethnic minorities in the UK [
5]. Their research shows that Black African communities, in particular, are more vulnerable. Therefore, there is a need to consider differentiated, cross-sectoral, and combined energy vulnerability among ethnic minorities in the UK. Baker et al. show similar results [
6]. Consequently, Bouzarovski et al. compared policies for decreasing energy poverty in former post-communist countries outside the EU, while their research found that the majority of the states in the analyzed region did not make enough solutions for solving basic problems, which connects with the improvement of living quality, energy efficiency, and gender inequality [
7]. However, energy poverty is present in the politics of all countries.
A study by Acheampong et al. showed that there is a lack of research on the influence of access to energy on human development. This situation exists mostly in energetically poor countries [
8]. Access to energy presents a key factor for societal development; however, it does not bring the same benefit to every element of human development, while human development generally improves energy poverty as a whole [
9]. Rodriguez-Alvarez et al. created a model for the analysis of energy poverty. The model contains the estimated minimal level of energy poverty in the country, regarding income level, energy prices, energy demand, and other specific characteristics [
10]. The research shows that financial help, oriented to poor groups of inhabitants, must decrease energy consumption and improve energy efficiency. Only then will the fight against energy poverty be successful. The mentioned factors explain why, during the negative influence of the crisis, there has been a partially stable and general decrease in energy poverty in the countries. Li et al. pointed to the smooth growth of inhabitants’ incomes, which, on the other hand, has a considerable influence on the decrease in energy poverty [
11]. The increased wealth of the inhabitants is, therefore, another important factor necessary to study in decreasing energy poverty and improving energy efficiency.
From the mentioned studies, it is clear that it is necessary to evaluate energy poverty in individual regions. Regional perspective is studied by Pan and Dong, illustrating that regions are vulnerable in the area of energy [
12]. This contribution provides a reference not only for China but also for other countries to address energy poverty. Energy poverty in China has been studied by many researchers, for example, Xia et al. in rural areas. This study investigated the interaction of energy poverty and economic indicators, finding a fluctuating trend in energy poverty [
13]. In the long term, residents’ income had the greatest impact on energy poverty in rural areas. As for the regional comparison, Wu et al. found that energy consumption in China is half of the US rate. The situation was compared in terms of household consumption [
14]. Several studies have been conducted on the conditions of energy use services regarding payment terms, especially in developed countries [
15]. High-energy prices, low household incomes, inefficient buildings and appliances, and specific household needs influence this situation. These factors are important mainly in Eastern, Central, and Southern Europe [
16].
Energy poverty is a problem that affects all EU member states but at different levels [
17]. The authors evaluated the situation in Poland and found a 9% rate of inhabitants living in energy poverty. Moreover, they evaluated government measures to reduce energy poverty through renewable use, pointing out that investment in RES could bring a visible decrease in energy poverty. Han et al. examined the relationship between energy poverty and economic growth in selected Eastern European countries. This study emphasizes the importance of evaluating energy poverty to promote economic growth and improve access to clean energy. This can increase economic growth and improve inhabitants’ well-being [
18]. Therefore, reducing energy poverty should be a priority in improving economic development and living quality. Sokolowski et al. created a multidimensional index for evaluating energy poverty, combining low-income and high costs, insufficient warm homes, housing defects, and problems with paying energy bills [
19]. This study found that in Poland in 2017, 10% of households lived in energy poverty, mainly inhabitants living in buildings built before 1946, households living in the countryside, and households dependent on pensions.
Energy poverty in Australia is associated with difficulties in maintaining adequate heat during winter and ensuring sufficient cooling during summer, which is associated with health problems [
20]. From this study, it is obvious that it is necessary to monitor energy poverty due to the population’s health [
21]. The situation in BRICS countries was studied by Doganalp et al., who examined the relationship between growth, energy consumption, employment, education, and inflation [
22]. The results show that there is no energy poverty problem in BRICS countries. Nevertheless, it is important to follow up on the level of energy poverty in BRICS countries due to the air pollution caused by the consumption of fossil fuels. The positive situation in BRICS can be maintained by renewables use. Alem and Demeke contributed to the evaluation of energy poverty in developing countries. They found that increases in energy prices cause households to live in energy poverty. Households in developing countries respond to increasing energy prices by consuming more coal, causing serious environmental, climate, and health consequences [
23].
Lack of political and institutional recognition can be one of the reasons for the increase in energy poverty. Simcock et al. found that most marginalized people suffer from energy poverty [
24]. There is a need to develop a progressive country policy to solve energy inequalities and poverty. Such solving must be performed at the level of the EU and its member states. EU must support regulatory measures in the form of a Clean Energy Package and the establishment of an energy poverty monitoring center in the EU [
25]. However, such political efforts were influenced by the COVID-19 pandemic, causing negative effects on increased energy poverty due to the health problems of citizens [
26]. There is assumed to be a decrease in energy poverty in the post-COVID situation at the earliest 2024. However, the improvement in the situation will vary in individual countries. The gap between countries with low- and high-energy poverty is expected to widen further. Studying energy poverty has received increasing attention after the pandemic since a considerable part of the population had to live and work from home, causing increased demand for energy costs and influencing the health and security of inhabitants [
27].
One option for solving energy poverty is increasing the use of renewables. McGee and Greiner examined how national income inequality affects how renewable energy sources are used, finding that renewables displace more fossil sources when there is an increase in income inequality and vice versa [
28]. It is therefore necessary for states to make policies ensuring efficient fossil fuels removal and reduction of income inequality. Energy poverty also influences donations for renewables use [
29].
EP emerged in the policy agenda sporadically at first and more frequently during the past decade. In summary, EP has been approached indirectly at the EU level, incorporating various provisions within directives dealing with alternative matters (e.g., energy efficiency in buildings and market regulation for gas and electricity). While synergies between policies are beneficial and encouraged, an authoritative body within the EU is needed to focus exclusively on EP. The first step was taken with the establishment of EPOV, a shared EU space that can provide the visibility and debate needed to encourage new policy frameworks. This development, along with the expressed interest of a range of countries, suggests that a shift has begun toward forming policies across European MSs to add EP to the policy agenda [
30].
When focusing on Slovakia, a draft definition of energy poverty was presented in September 2023. The proposal was submitted to the government for negotiation by the Office for the Regulation of Network Industries. Until now, the proposal has been awaiting approval from the government. According to the proposal that the government receives from the Regulatory Office for Network Industries (URSO), a household will be considered at risk of energy poverty in cases where at least one of the following three criteria apply (we present the original wording from the URSO proposal):
risk of energy poverty threatens a household if, after paying the costs for the basic level of energy and water consumption, which ensures a decent standard for the life and health of household members, it has less than 1.5 times the subsistence minimum and at the same time its total net annual equivalent disposable income for the previous year, calculated per number of household members, is less than the national median.
risk of energy poverty threatens a household if its annual energy costs for the previous calendar year are below half of the national median and, at the same time, its total net annual equivalent disposable income for the previous calendar year is below 60% of the national median.
A household without physical access to the supply of electricity for reasons that are exhaustively determined (
www.urso.gov.sk).
3. Materials and Methods
The goal of this paper is to analyze the energy sector in EU countries based on publicly available data, focusing on energy requirements and the population’s standard of living. During the research, we obtained freely available data published annually within the Eurostat portal. The indicators were analyzed in the following structure:
Heating degree days index (HDD) (1979–2022) [
31]
Cooling degree days index (CDD) (1979–2022) [
31]
Energy poverty (2003–2021) [
32]
Renewable energy source (RES) rate on gross total energy consumption (2004–2021) [
33]
Daily degree, Daily degree (D°) is a unit that expresses the intensity of the need for heat for heating depending on the climatic conditions (changes in the outside temperature) (norm STN 73 0540-4).
The dataset was obtained from a portal published by the Joint Research Centre’s AGRI4CAST and Eurostat. The data were collected for 1979–2022 within the EU countries. In total, 140,015 data points were collected. As part of the analysis, the development trend of each indicator was assessed, and a comparison of countries within the EU was carried out using variability analysis, distribution analysis, cartographers, and dot charts.
As part of the contribution, we analyzed the population’s energy demands through indicators defining the need for heat and cold in buildings (HDD, CDD).
The Heating Degree Index (HDD) describes the energy requirements of buildings for heating based on the cold intensity at a specific time, considering the outside temperature and the average room temperature. The HDD index is calculated according to base temperature. The base temperature presents the lowest daily average air temperature, not leading to interior heating. The base temperature depends on the factors of the building and the surrounding environment. According to the general climatological approach, the base temperature has a constant value of 15 °C. This value was considered in the HDD calculation.
In case the average daily air temperature is 12 °C, the HDD index is 6 (18–12 °C). If the average daily air temperature is 16 °C, the HDD index is 0.
The cooling degree days (CDD) index is a weather-based technical index designed to describe buildings’ need for cooling (air conditioning) requirements. The index is based on the heat intensity at a specific time, considering the outside temperature and the average temperature in the room. The CDD calculation is based on the base temperature (the highest daily average air temperature that does not lead to interior cooling). The base temperature basically depends on the factors of the building and the surrounding environment. According to a general climatological approach, the base temperature in the CDD calculation is set to a constant value of 24 °C.
In case the average daily air temperature is 26 °C, the CDD index is 5 (26–21 °C). If the average daily air temperature is 22 °C, the CDD index is 0.
HDD and CDD are derived from the meteorological measurements of the air temperature, interpolated to the regular 25 km grids for Europe. Such calculated HDD and CDD grids are aggregated and consequently presented at the level NUTS-2 for 2017 and 2018, as well as at the level NUTS-3. The calculations are made daily and summarized in the calendar months and, consequently, summarized in the calendar years.
A trend of indicator development can influence the climax and weather in a given region. The mathematical expression is as follows:
where (
x)—number of years
(f(x))—number of cooling days.
This methodology for creating indicators is uniform for all EU countries, which ensures the comparability of the results of individual states within Europe. The methodology itself, as well as the knowledge resulting from it, are valuable sources of information in the academic field.
4. Results
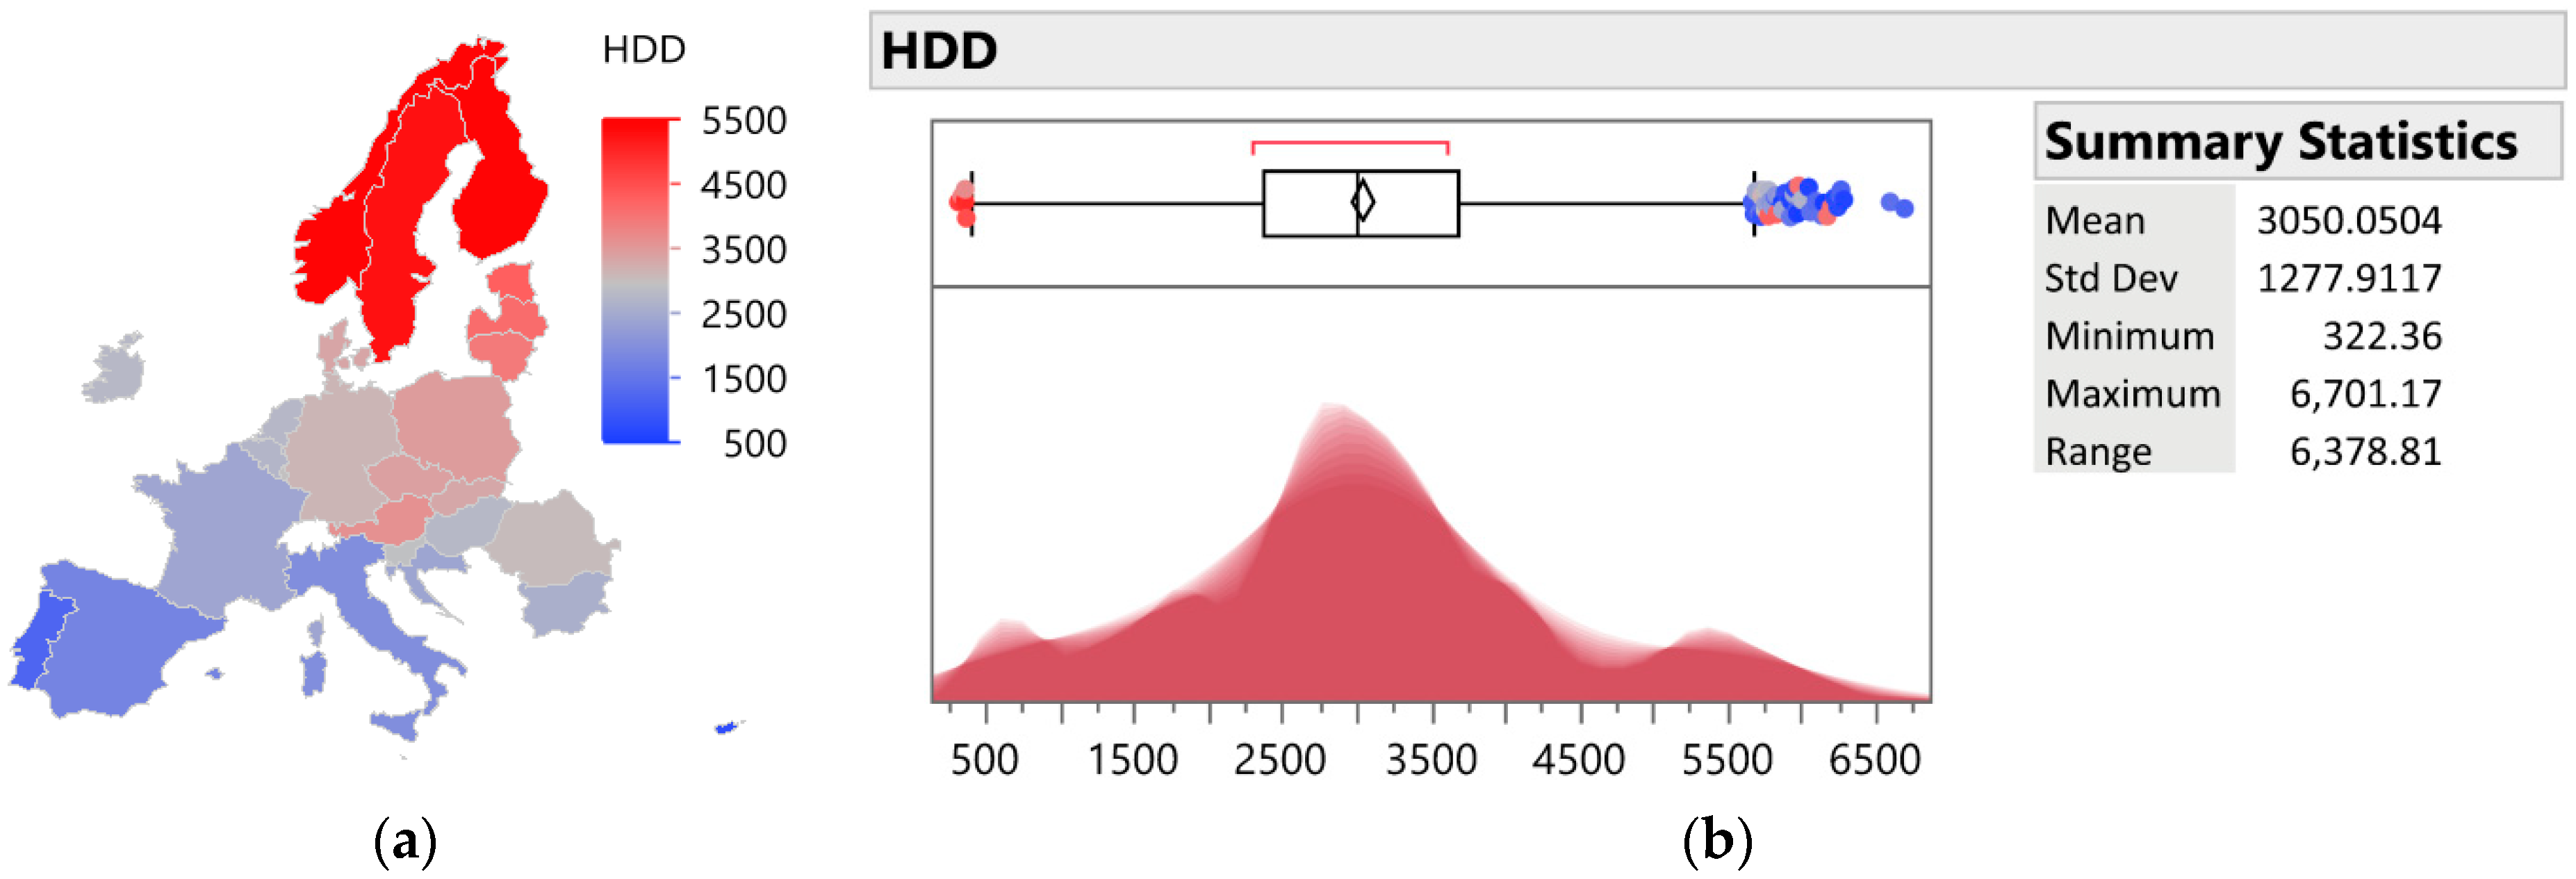
The analysis showed that the number of daily heating degrees in the EU is, on average, 3050.05, with a range of 6378.81 degrees (
Figure 1, right). There is a significant difference between the countries, which significantly affects the style of life in the given countries. The highest values are shown by the northern countries of the European Union, such as Norway, Sweden, Estonia, Lithuania, and Latvia, with values higher than 5000 degree days, and the lowest values are achieved by Cyprus, Malta, and Portugal, with values up to 1000 degree days (
Figure 1, left).
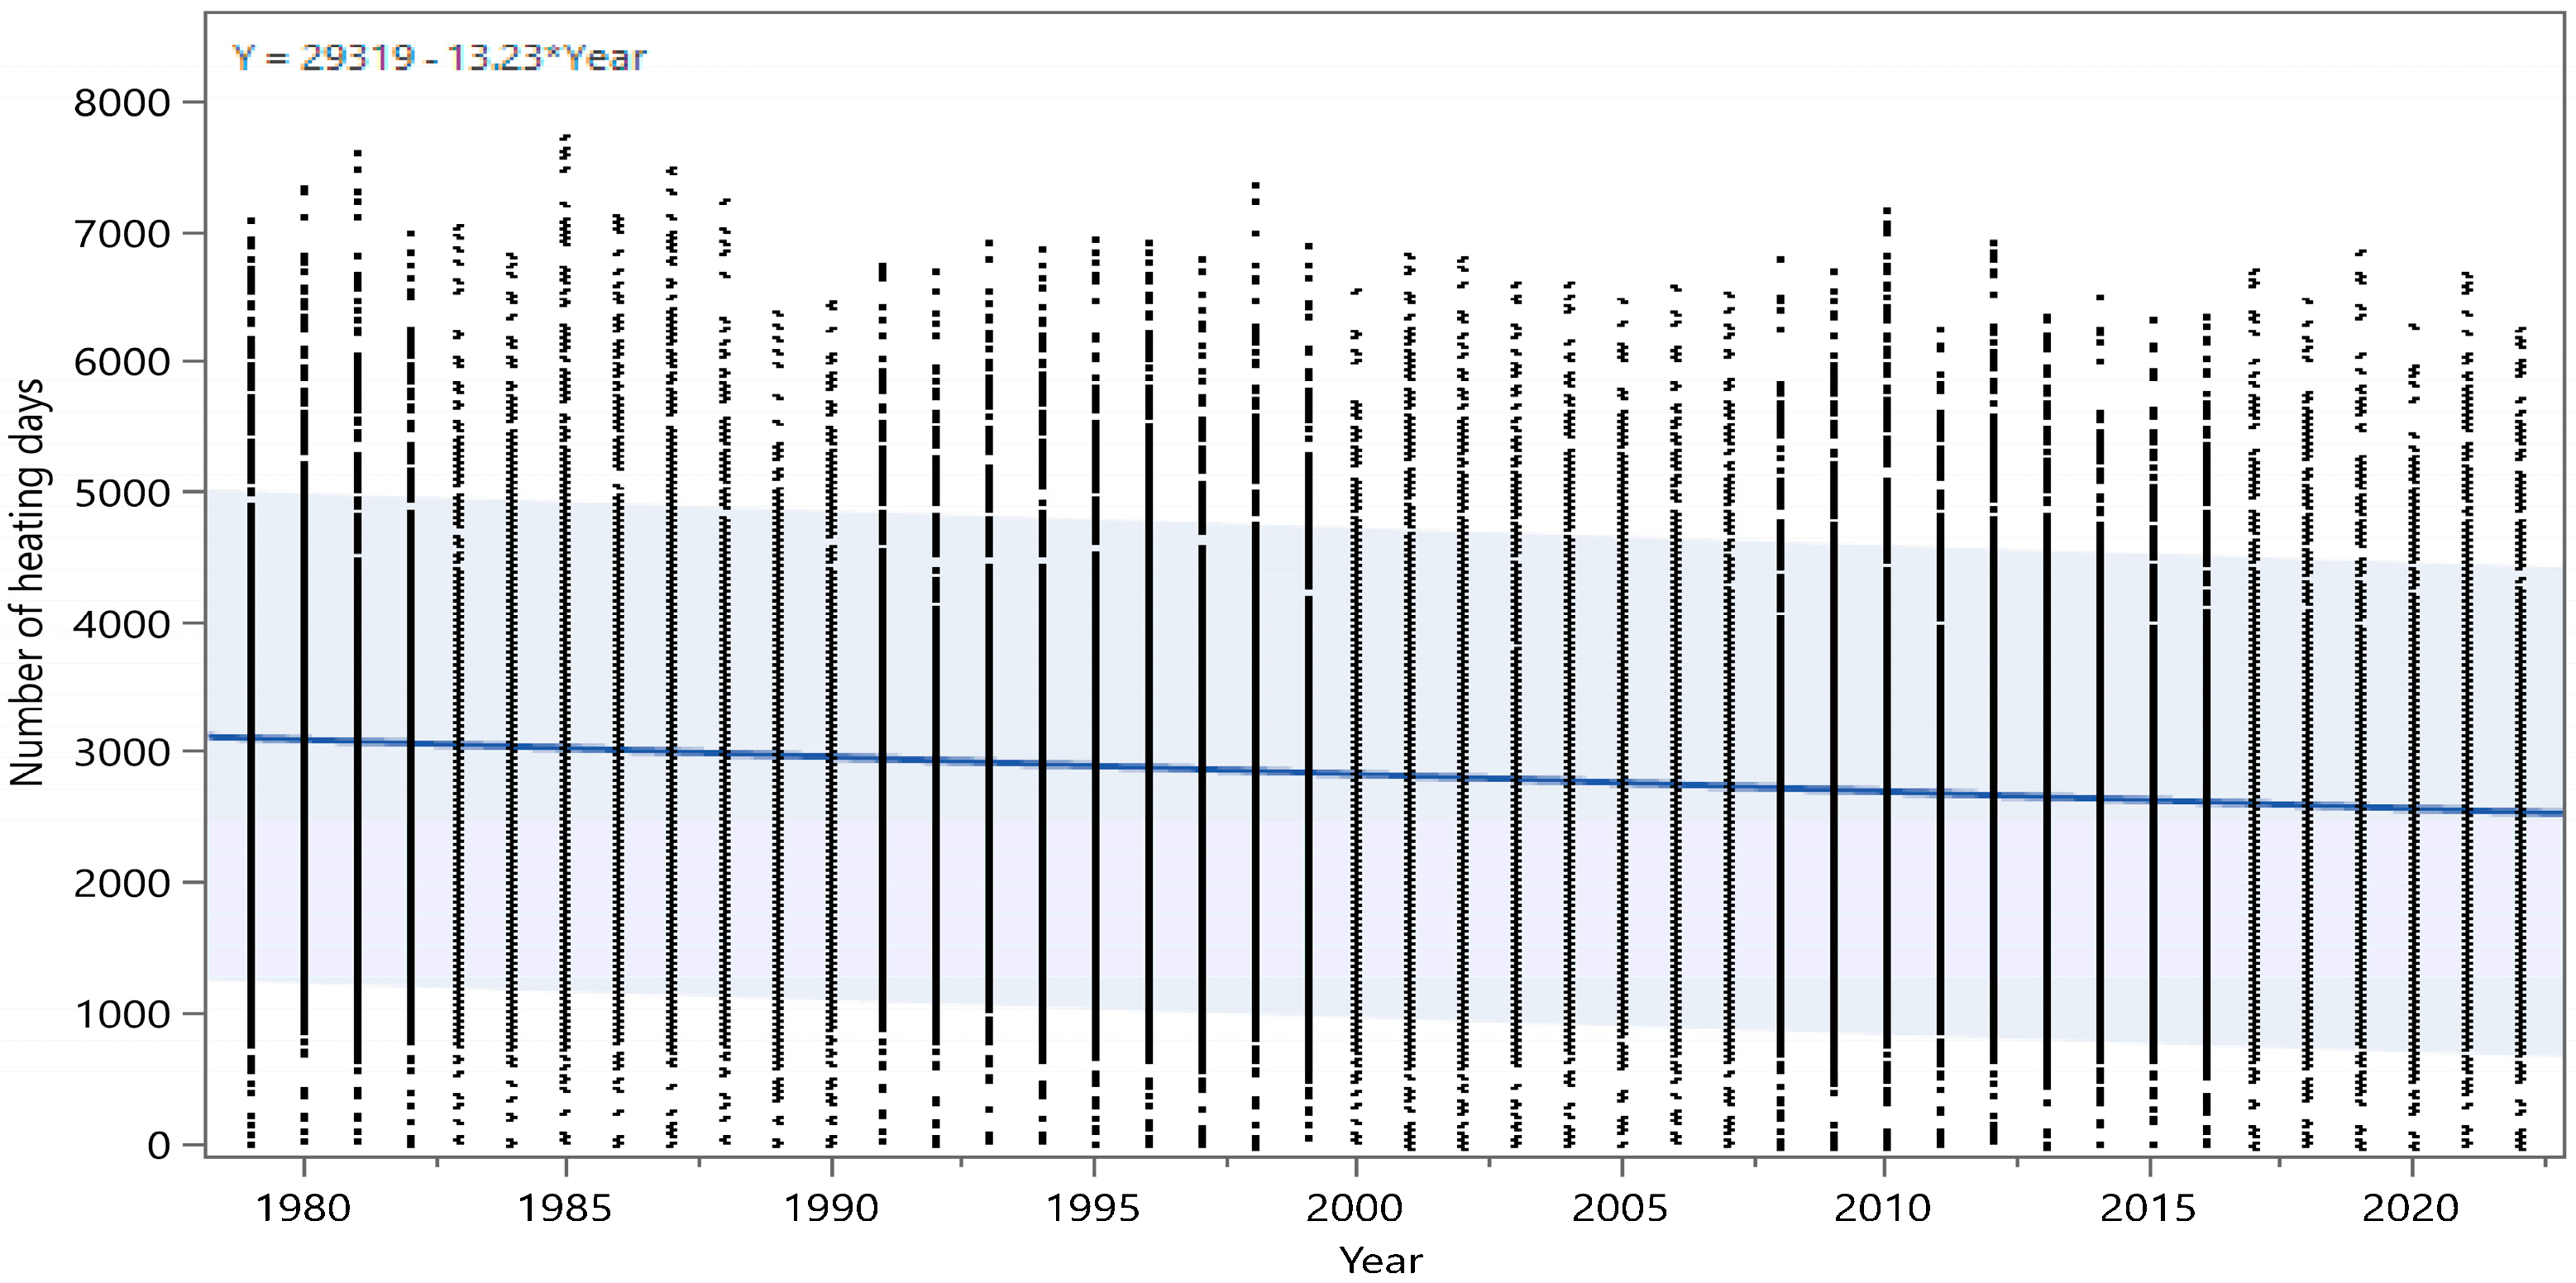
The development of the indicator over time showed a decrease in the number of daily heating degrees per year by 13 units (
Figure 2). This is indirect evidence of climate warming, as the number of days when it is necessary to heat is decreasing.
If the number of heating days decreases over time, this has several consequences, such as the regulation of heating by a law that determines what the usual heating period is in a given country. For example, in Slovakia, the usual heating period is from 1 September to 31 May. This means that heating companies cannot arbitrarily start and charge for heating before 1 September or after 31 May of the following year. The average outside temperature can also be a key factor. If the temperature drops below a given number of degrees for two days in a row (for example, below 13 °C in Slovakia) without a forecast of significant warming, heating is initiated. This can be interrupted after a while in the case of warming. The development of the indicator can also be affected by individual differences because there can be great variability at the beginning of the heating season in individual regions of the country.
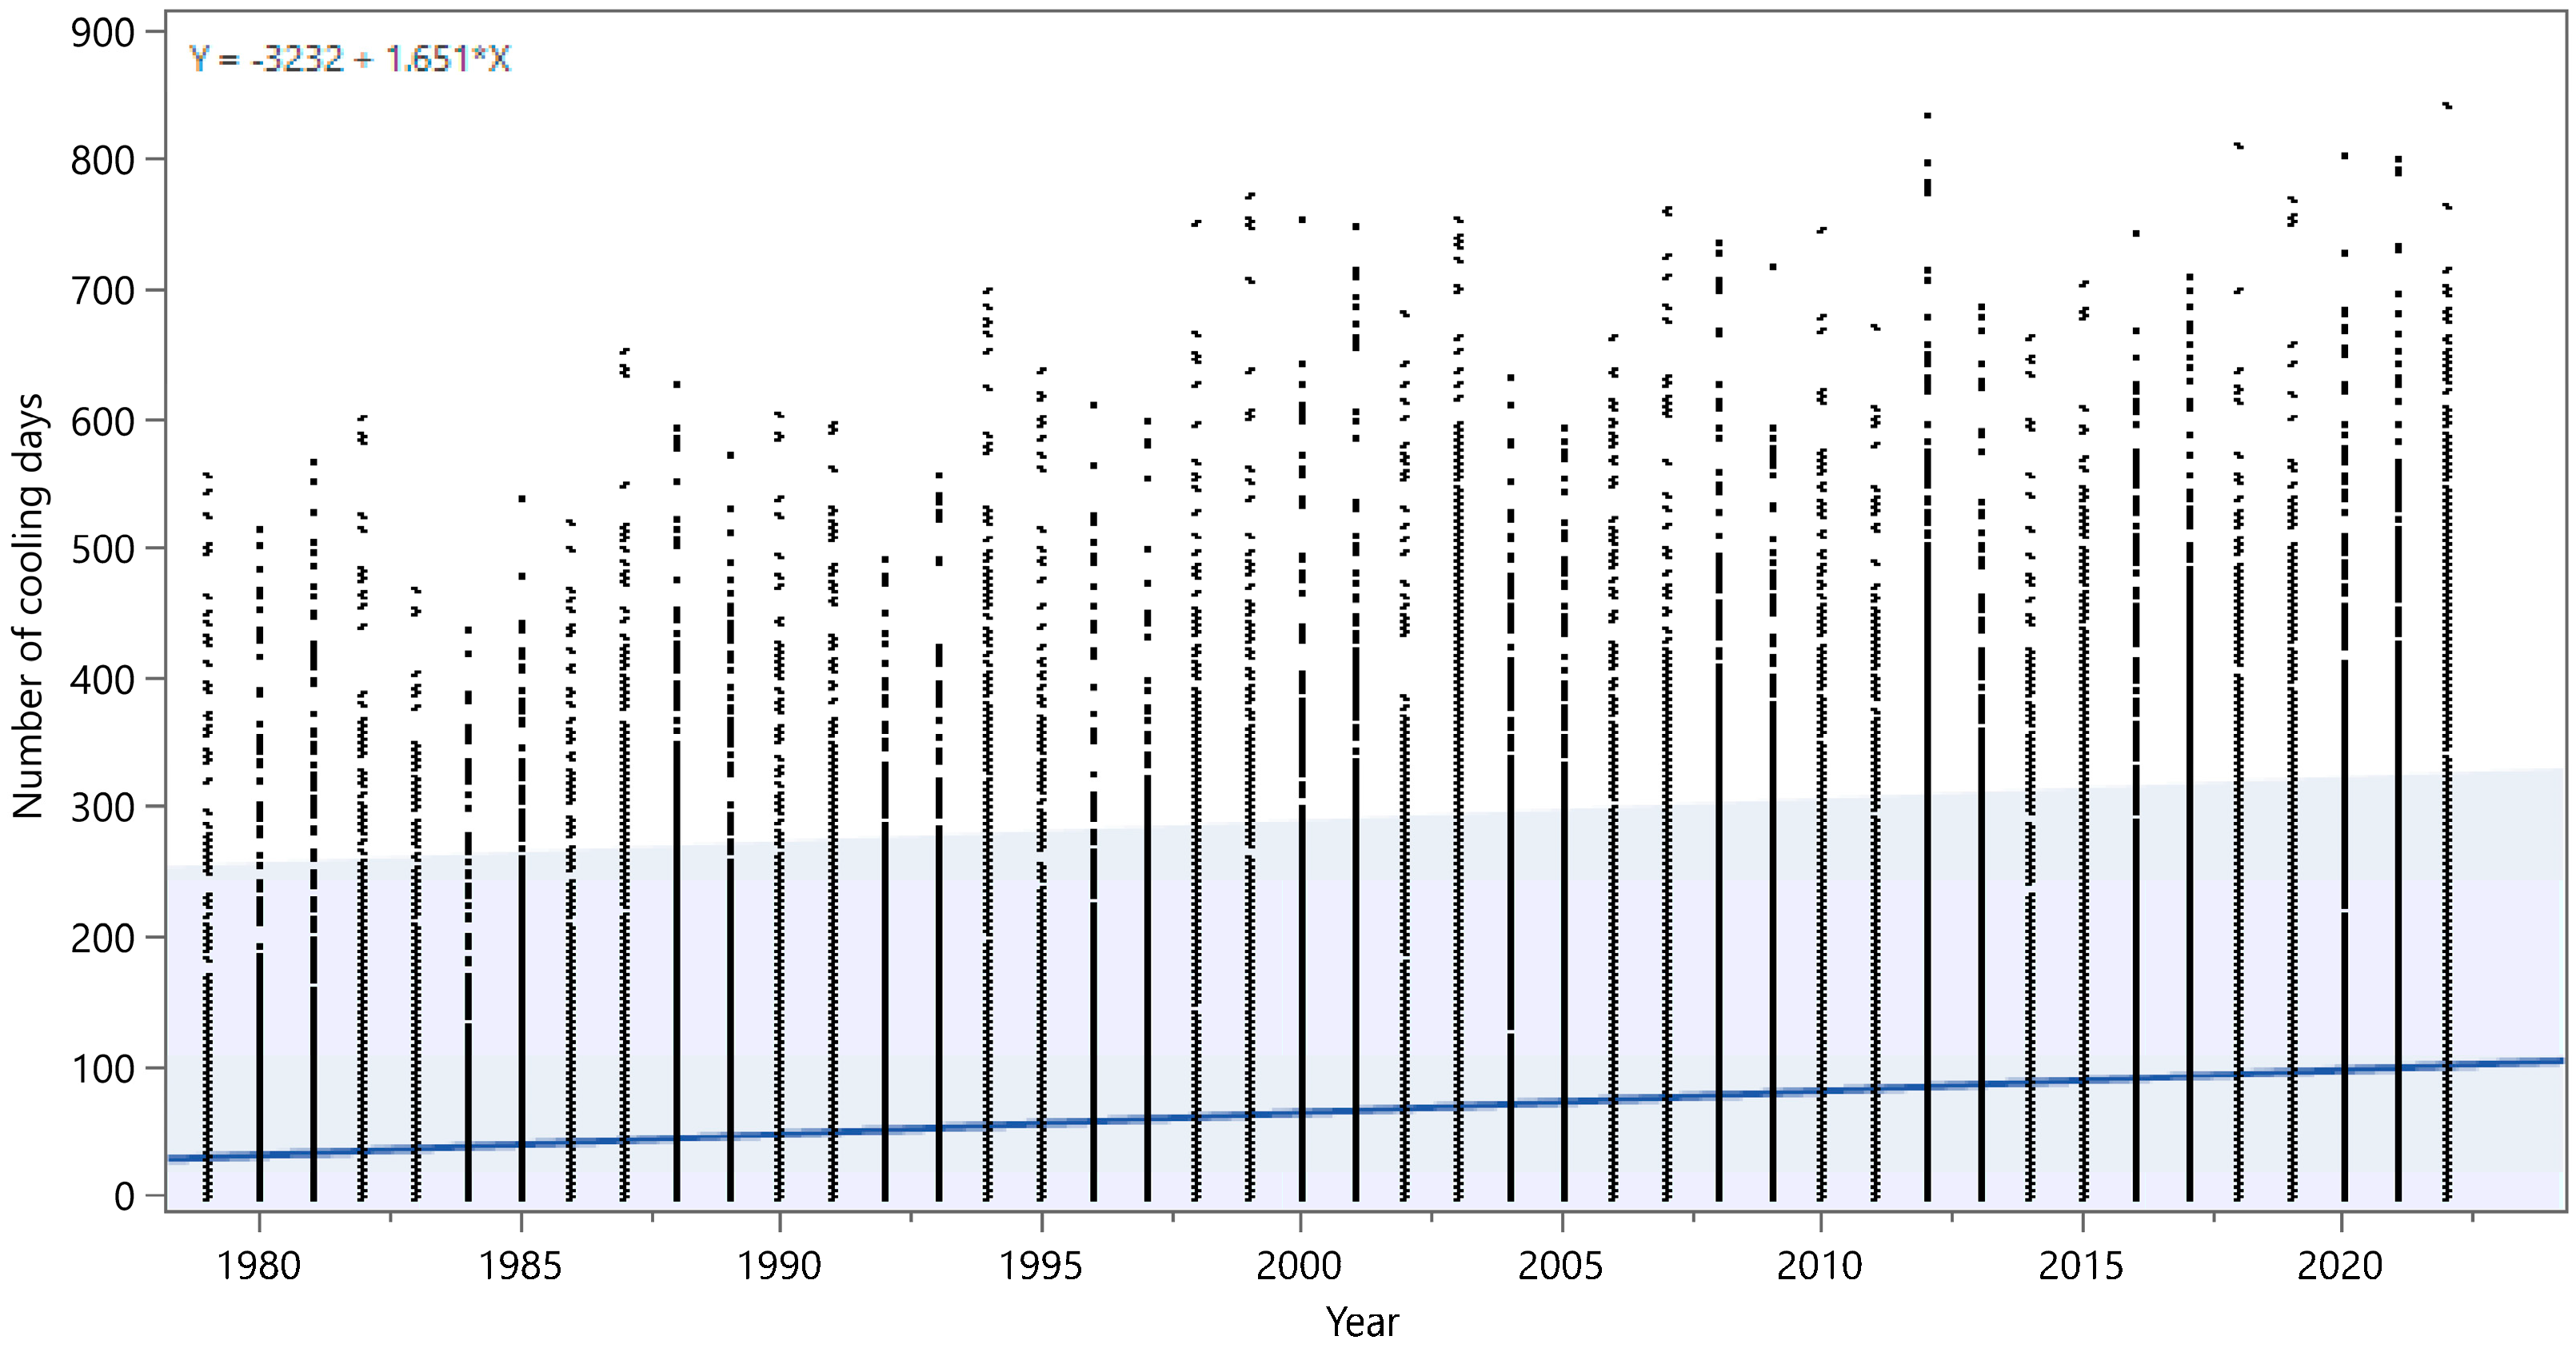
The development of the indicator number of cooling days over time points to an increase in cooling days by 1.65 days per year (see
Figure 3). The linear increase can have various consequences, such as changes in crop production, energy needs, or the environment. It is important to monitor such trends and take measures to adapt to a changing climate. If the number of cooling days increases, it may be related to meteorological phenomena. For example, radiative cooling occurs at night, when the air temperature at lower altitudes drops significantly. Advection cooling is caused by the flow of cold air into the middle layers of the troposphere. These phenomena can affect the weather and temperature in a given region.
Based on these facts, we analyzed energy poverty, which is mainly linked to the indicator of heated days. Energy poverty was assessed through the percentage of the population that could not maintain adequate heat at home.
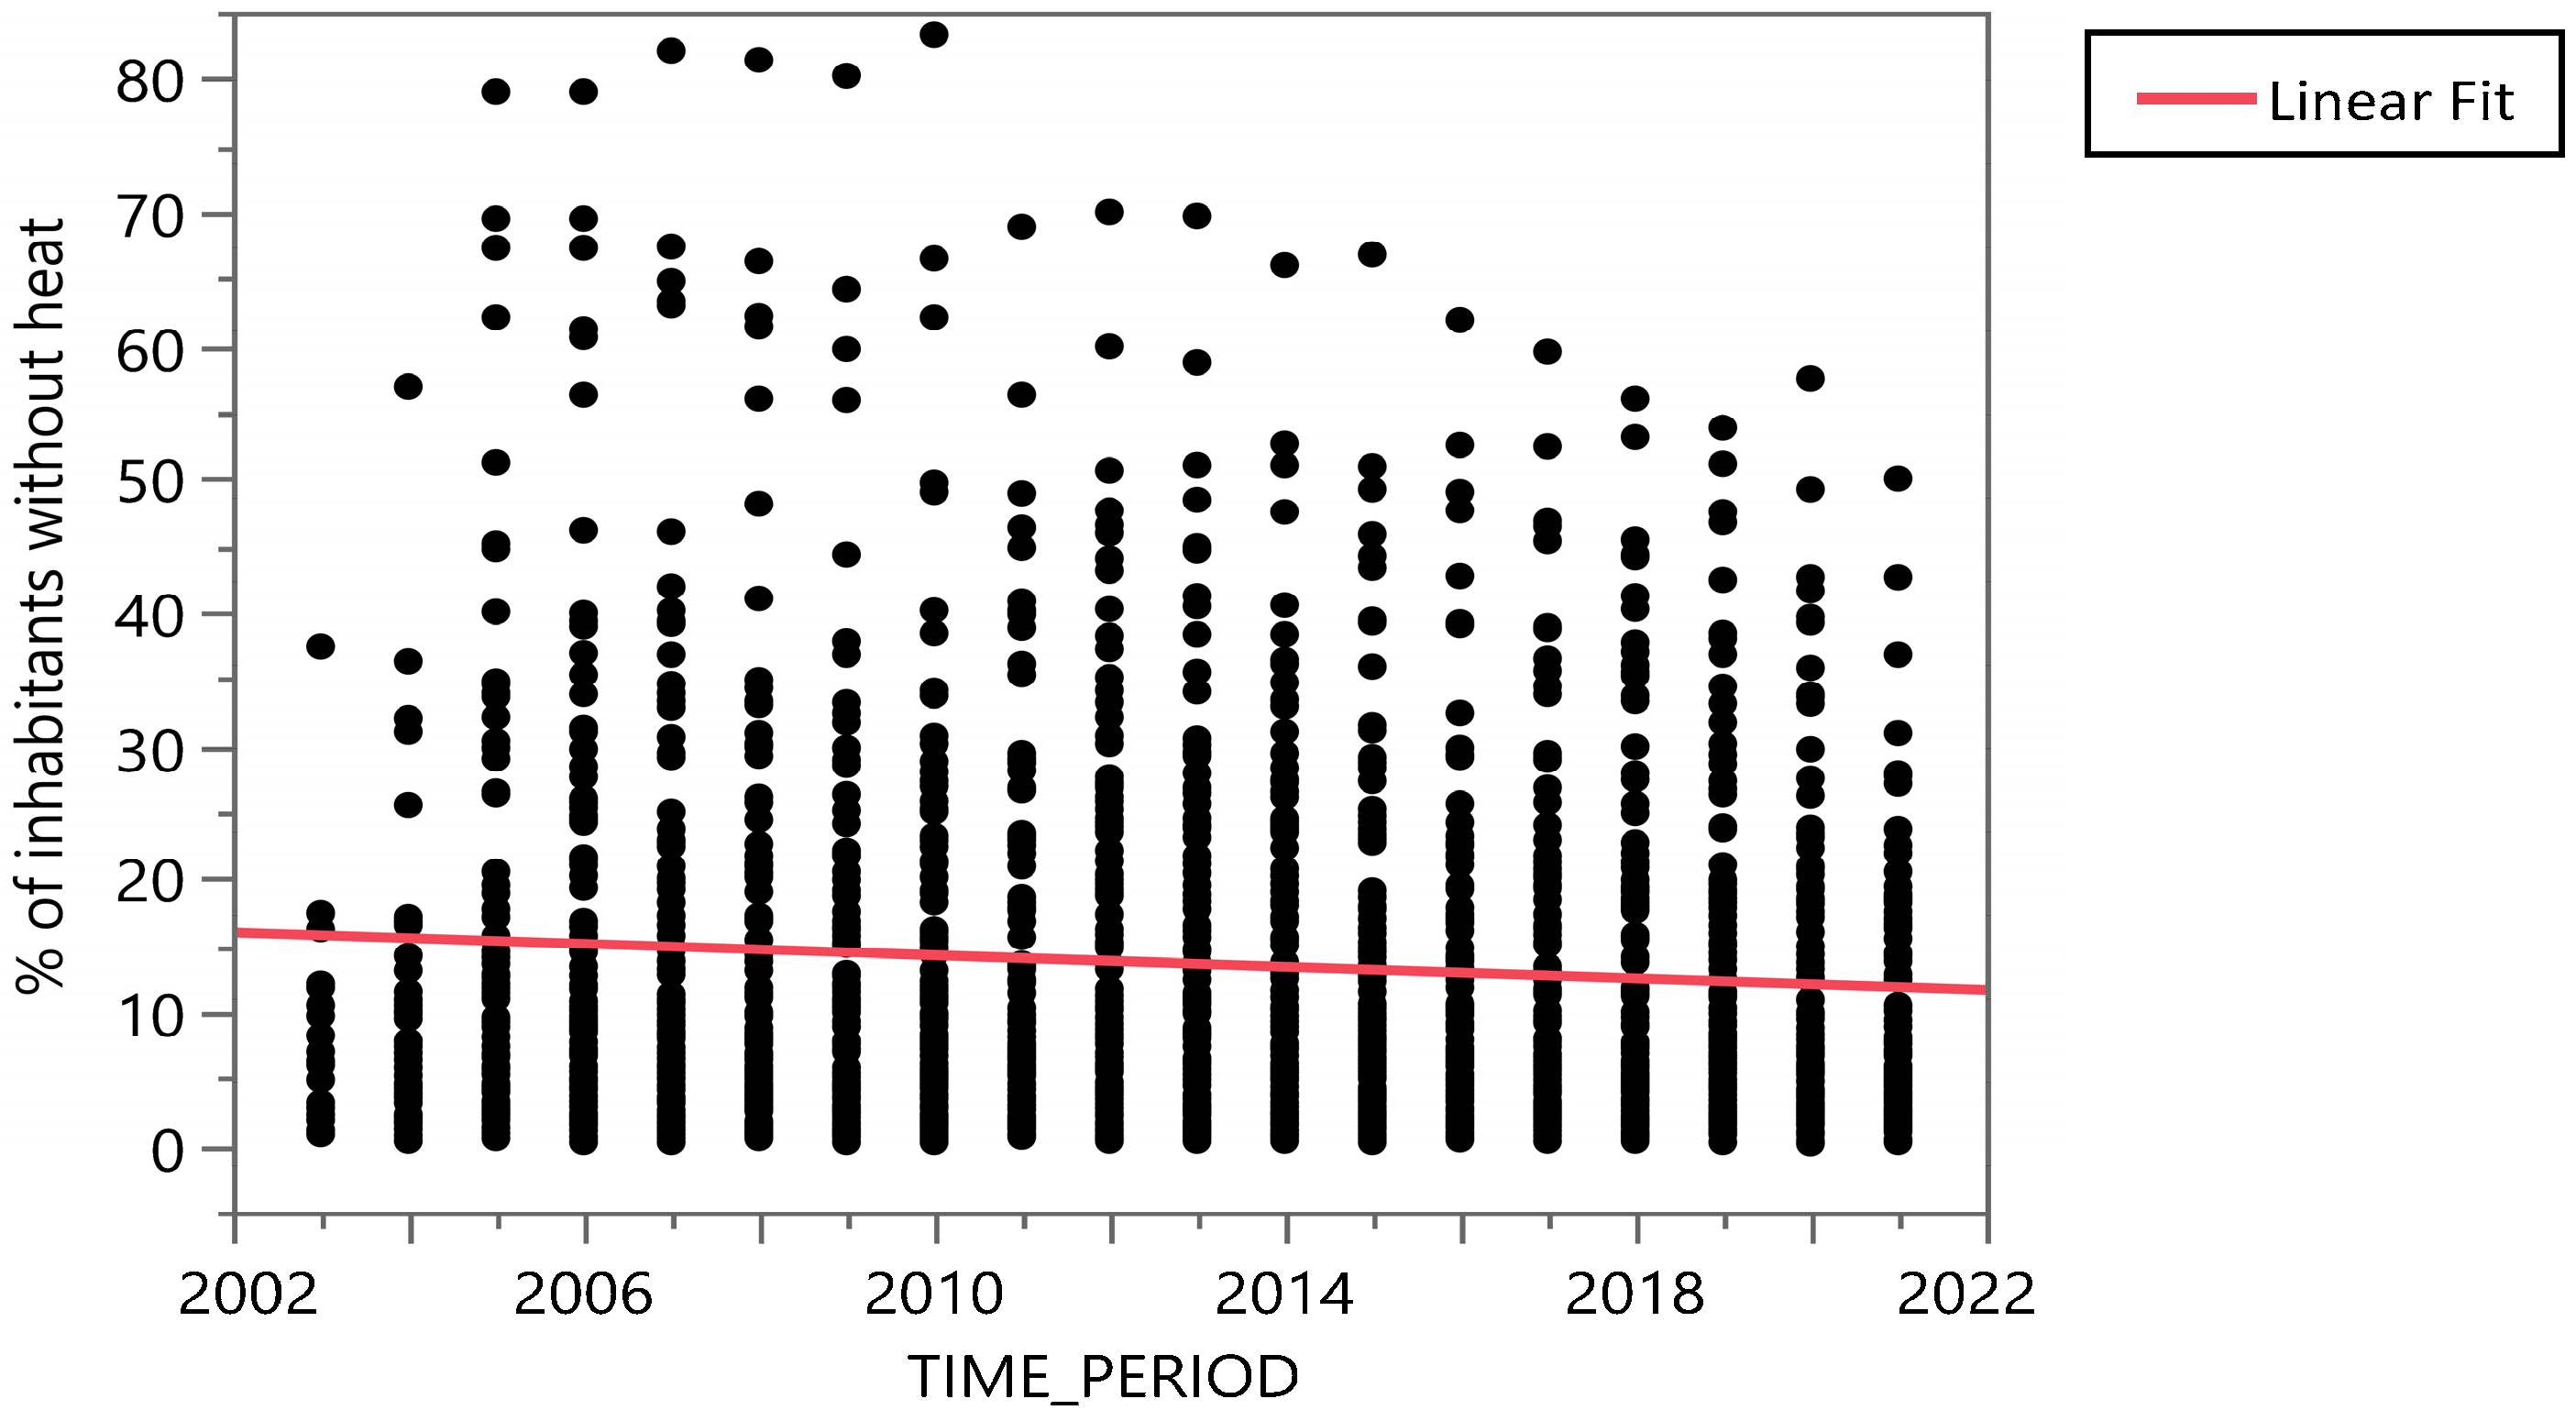
Figure 4 illustrates the development of the indicator in time when Linear Fit presents the percentage of inhabitants without heat = 451.31242 − 0.2174527 × TIME_PERIOD.
From
Figure 4, there is an obvious slight decrease in the percentage of residents lacking heat, confirming the improvement in the situation. This situation may have several reasons in the context of inhabitants without heat, such as government initiatives, energy efficiency improvement, community support, RES use, education, and awareness. Each situation may vary depending on local policies, resources, and community support systems.
If the percentage of residents with a lack of heat decreases slightly, this can be a positive sign. This implies that fewer people suffer from a lack of heat in their homes. A lack of heat can seriously affect people’s health and well-being, especially in cold regions. The decrease in energy demand can be related to better insulation of buildings, modern heating systems, or other measures to improve energy performance. This may mean that people have better conditions for keeping warm in their homes. In some cases, the decrease in energy demand can be related to social programs that help people with a lack of heat. These programs may include financial support for heating costs or other measures to improve living conditions. Overall, a slight decrease in energy consumption is a positive development that can have beneficial consequences for residents.
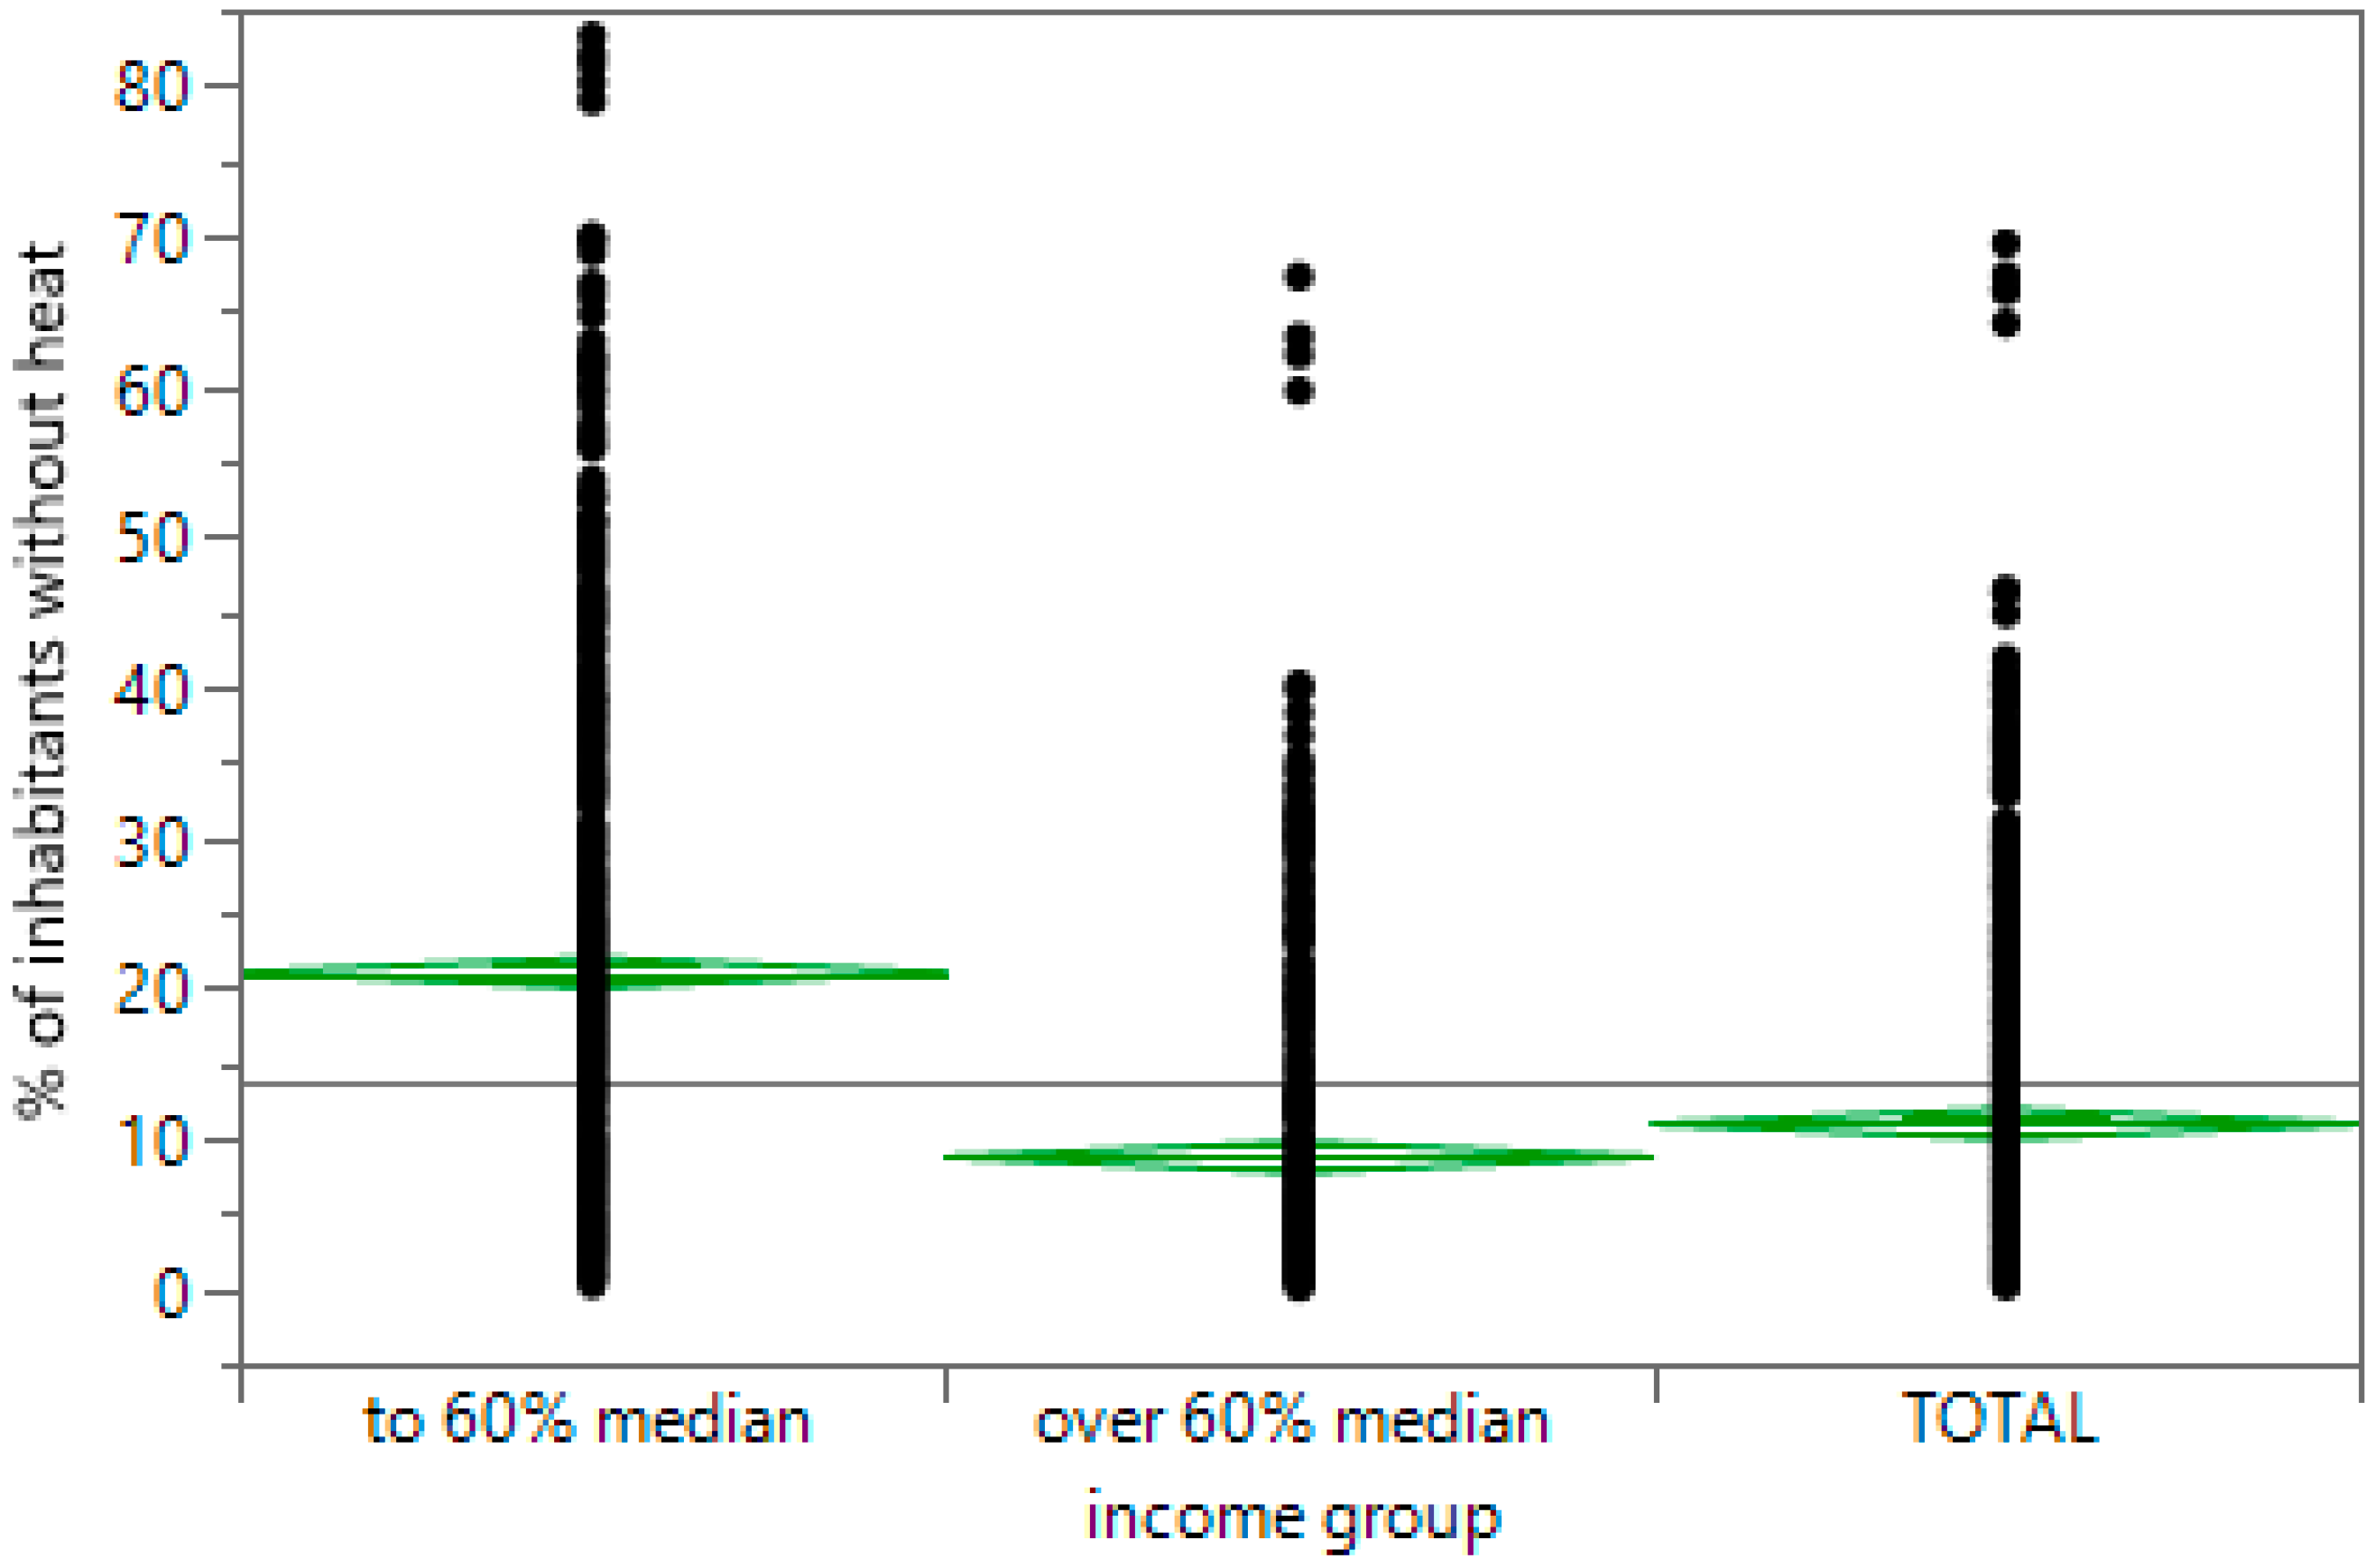
Energy poverty is also evaluated according to the inhabitants group (see
Figure 5), following the percentage rate of inhabitants with heat shortage from the category of low-income inhabitants and the percentage rate of inhabitants with heat shortage from the category of high-income inhabitants.
There is a difference between residents with income up to 60% and those above 60% of the median income, which is equivalent to the percentage of residents lacking heat (
Table 1). An average of 21% of the population lacks heat (low-income category). An average of 8.7% of the population lacks heat (higher-income category) (
Table 2).
The following factors could cause such development, such as the measure of poverty risk. The indicator measures the proportion of people with equivalent disposable income under 60% of the national equivalent income. Equivalent income takes into account the size and composition of the household. Residents with lower incomes have a higher risk of poverty, which may be related to the lack of heat in their homes. The second factor is the cost of housing. Residents with lower incomes may find it more difficult to cover their housing costs. For example, in the case of rental apartments, the maximum rent can be set based on the ratio of housing expenses to household income. If this ratio is high, this may mean that residents with a lower-income have a harder time covering housing costs, including heating. Lower-income residents may be more dependent on social programs and support. If these programs do not provide sufficient heating assistance, this may lead to a lack of heat for this group of residents. Overall, it is important to analyze the specific factors and policies that affect the differences between residents with different incomes and living conditions, including heating.
A comparison of the geopolitical situation of the inhabitants without heat–the total percentage rate of inhabitants with a shortage of heat average from 2005 to 2021 is given in
Figure 6.
By comparing the geopolitical situation of the countries by a cartographer, it can be concluded that the highest values of energy poverty in low-income categories of the population are in Portugal, Turkey, Latvia, Albania, Macedonia, and Bulgaria. Paradoxically, the coldest countries (Nordic countries) are the best. Even in the case of high-income groups, energy poverty is most pronounced in Albania and Bulgaria; in the other mentioned countries, there is a certain mitigation.
Presently, energy poverty must be evaluated according to the rate of renewables use in gross total energy consumption. It must be evaluated from several points of view, such as reduction of energy costs, social measures, and inclusive policy. Renewable energy offers cleaner alternatives to fossil fuels. Renewables use contributes to environmental protection. For lower-income people, energy poverty can be a serious problem. Therefore, renewable resources are important for this group to help reduce heating and electricity costs. An increased rate of renewable energy sources can be part of an inclusive policy that considers the needs of all citizens. Social programs and support can help lower-income people gain access to renewable energy.
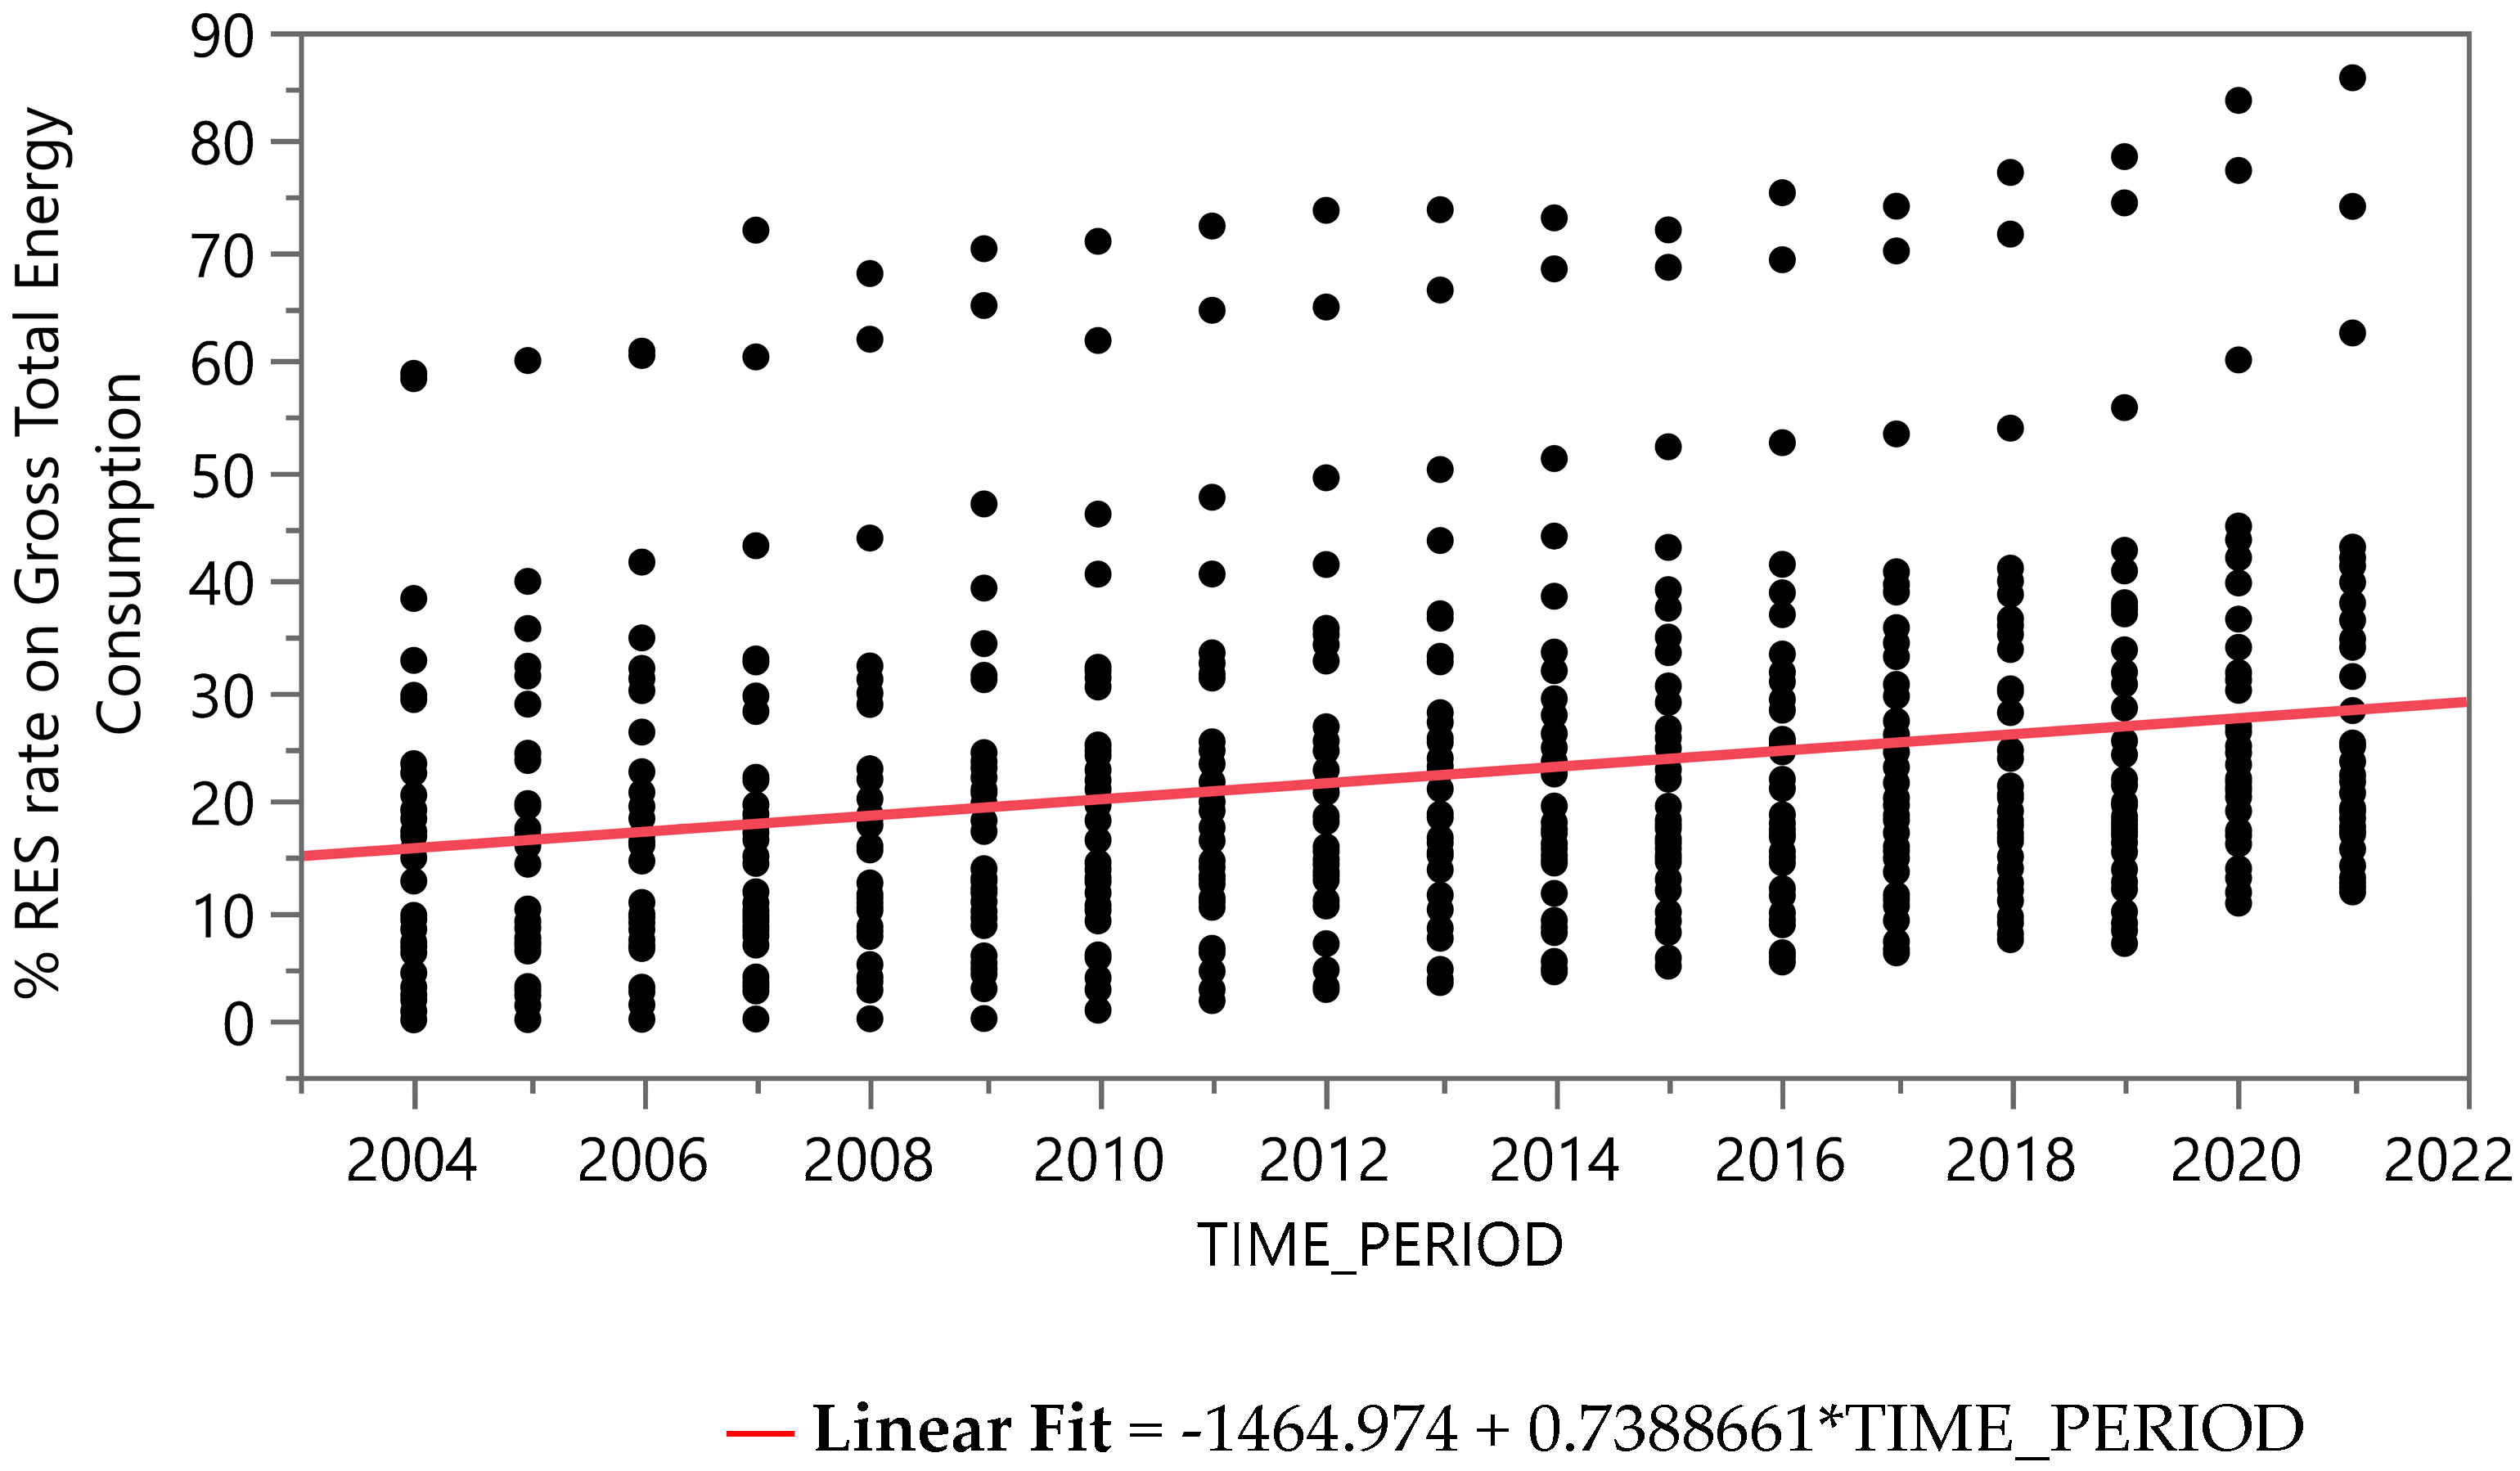
The development of the share of RES in gross total energy consumption is shown in
Figure 7, which shows the trend over 18 years, with an annual increase of 0.74%.
In the European Union, the goal of sharing renewable energy sources in the gross total energy consumption is gradually increasing. In 2022, this share was 23%, and lawmakers in 2023 increased the Union’s target to 42.5% by 2030, with an ultimate goal of reaching 45%. In Slovakia, the share of renewable energy sources has also been monitored, reaching 17.35% in 2020. These steps lead to a more sustainable energy system and improved security for all residents.
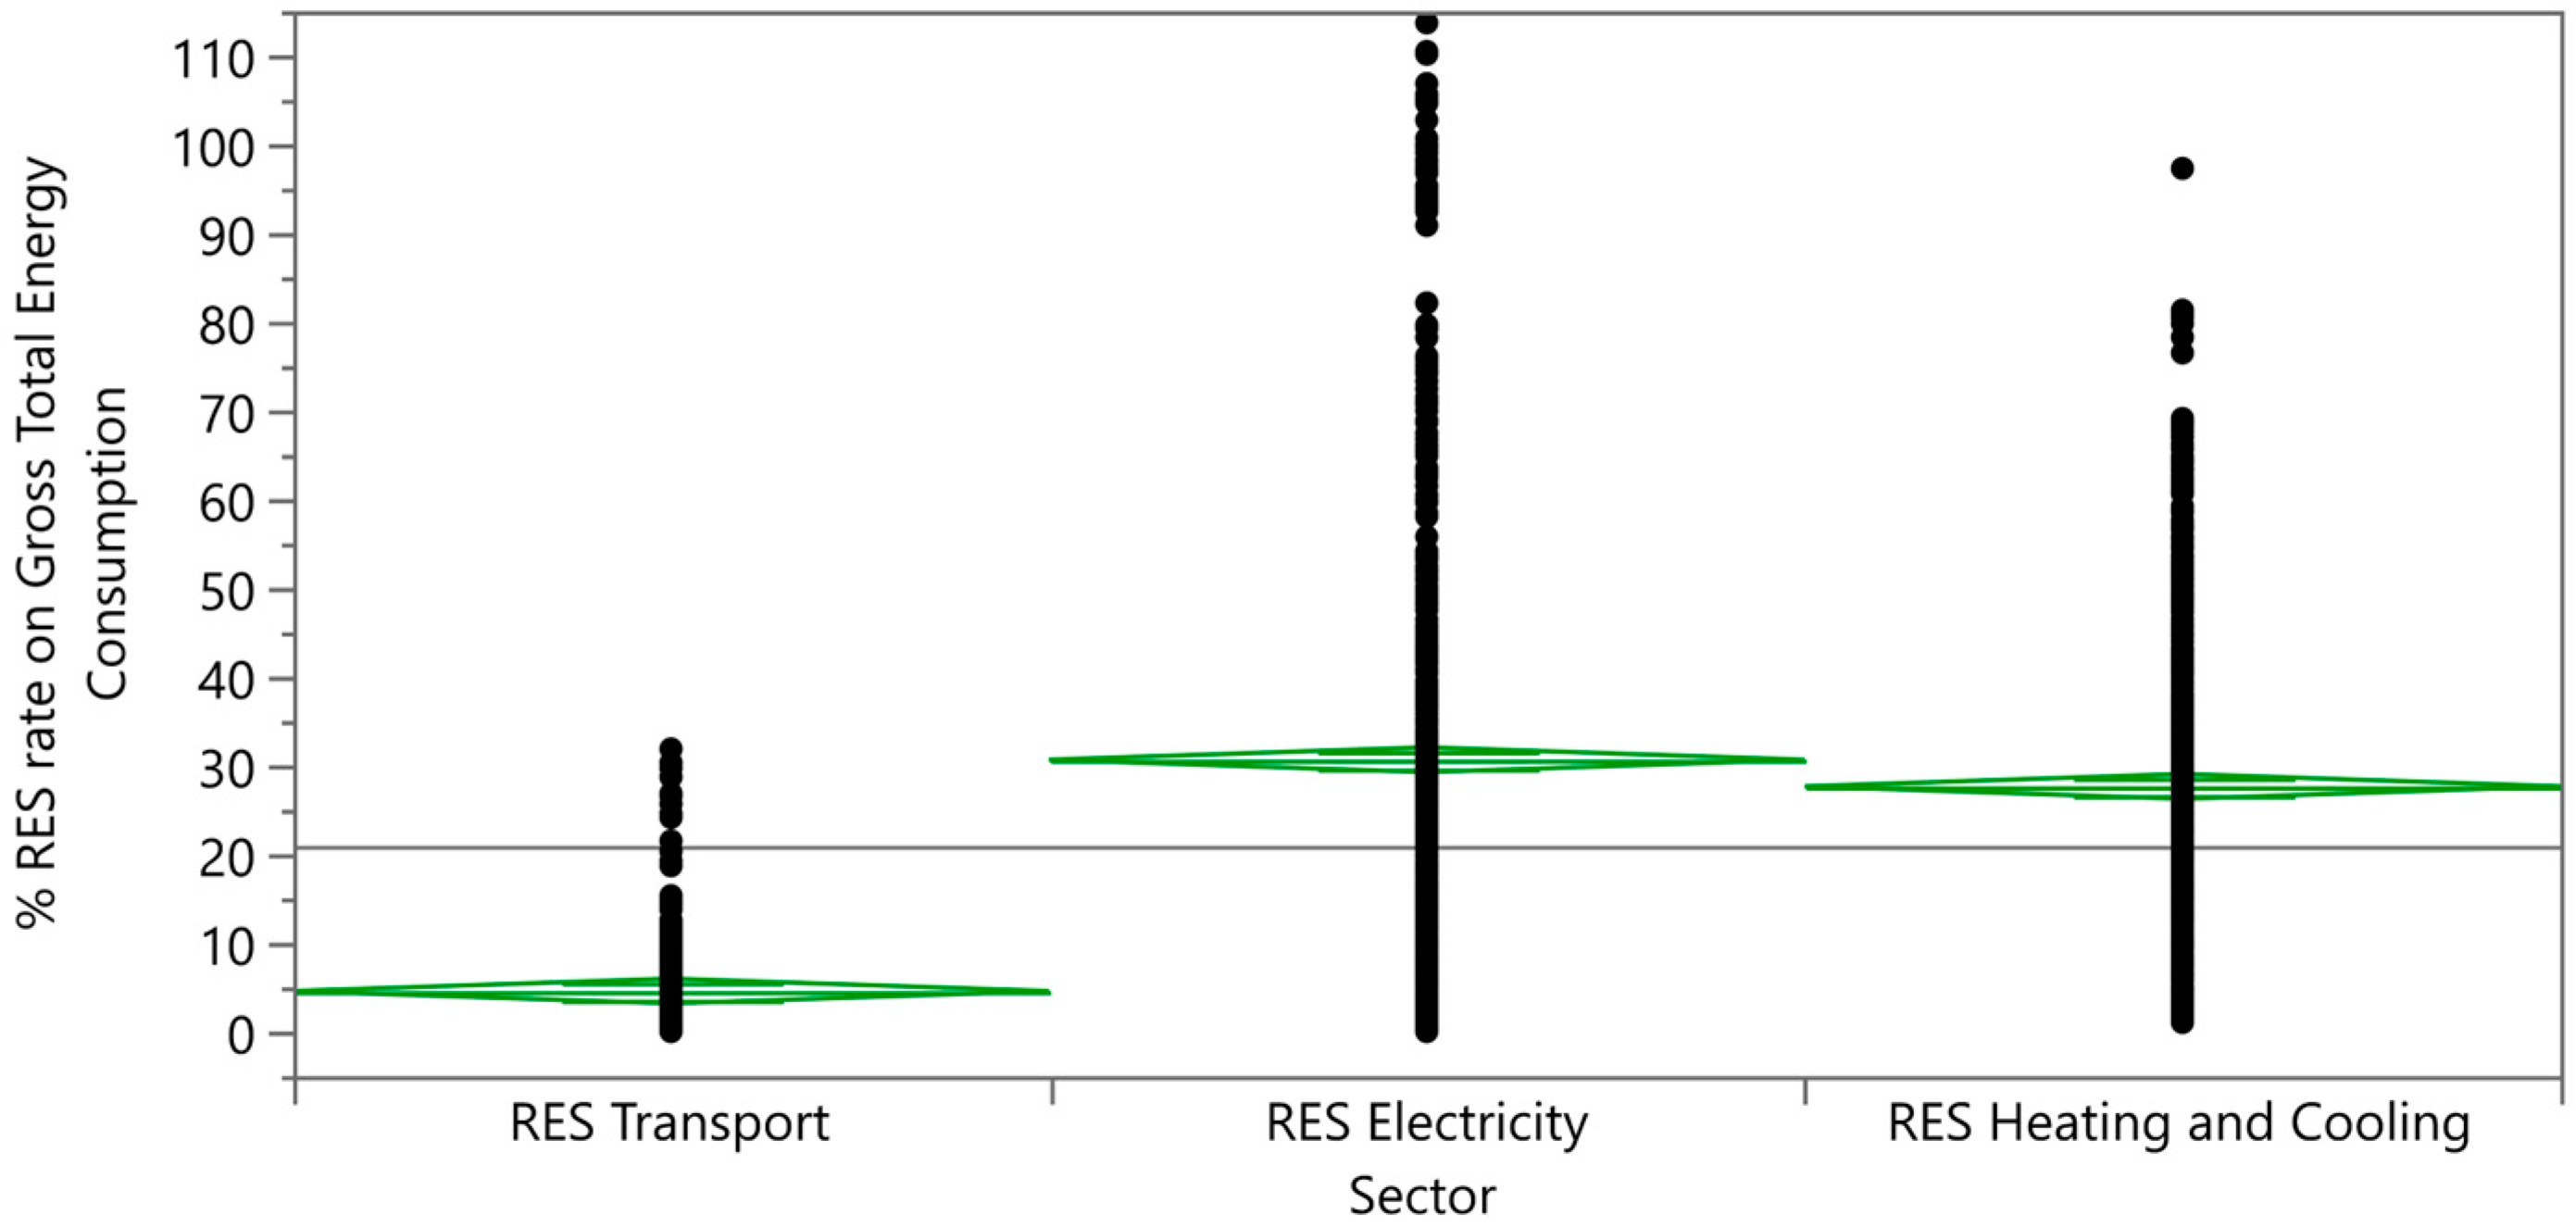
Subsequently, we examined the use of RES by category, mostly for electricity generation and heating and cooling. The results are illustrated in
Figure 8.
From the one-way analysis of % RES use on gross total energy consumption in
Figure 8, we see that the highest mean value is recorded for RES use in electricity at 30.6%, with slightly lower use in cooling and heating at the level of 27.63%. However, the RES use in transport is much lower–only 4.5%. Here is the space for a significant improvement (
Table 3).
5. Discussion
In the frame of the research, we recorded the following main results:
5.1. HDD Index Recorded Decrease, CDD Index Recorded Increase
The decrease in HDD and CDD is supported by the results of Andrade et al. [
34]. According to Kyongmi et al., the evaluation of HDD and CDD demands not only annual but also monthly evaluation of electric energy consumption and mean temperature since electricity demand for temperature change is affected by the size of the cities [
35]. The evaluation should be carried out on a regional level. A similar result is supported by Rosa et al., who extended the evaluation to daily data, which were individually developed in different cities [
36]. The differences in RES use and energy consumption were also shown by Kartal when several countries registered a positive effect of energy consumption and RES use on carbon emissions. In contrast, some countries registered negative effects [
37]. In some cases, it is not enough to know only the temperature but also the impact of the temperature, for example, whether there will be enough power to run cooling and heating generators [
38].
Under predicted global warming, the obtained development can persist until the end of the century. Despite persistent warming, EDD would increase over northern Europe, Baltic countries, Great Britain, Ireland, Benelux, the Alps, Spain, and Cyprus, resulting in an overall increase in EDD in Europe [
39]. Petri and Caldeira predicted different developments in individual parts of the country [
40]. Acharya and Sadath confirmed that index development differs across states and regions [
41].
5.2. Energy Poverty Is Most Obvious in a Low-Income Group of Inhabitants, Having a Shortage of Heat
Over the years, energy poverty has shown a declining trend. However, Acharya and Sadath pointed out that the trend has an exception in less developed countries and regions [
41]. In this area, education has a greater impact on reducing energy poverty than does income. The effects of energy poverty and renewable energy transition on development should be assessed both short- and long-term [
42]. Energy poverty is influenced mainly by income, education, life expectancy, and employment. Renewable use can partially compensate for the negative effects of energy poverty on various development factors.
Financial development affects energy poverty. In this area, Nguyen et al. found that financial development reduces energy poverty in low- and lower-middle-income economies. On the other hand, it has heteroscedastic effects on independent indicators in upper-middle-income economies [
43]. The influence of income is also followed by Asad et al., who examine the relationship between income and energy poverty, employment, education, inflation, and economic development [
44]. Financial development demands investment in renewables and green projects; therefore, society needs to use modern, energy-efficient, and green technologies.
5.3. RES Use Contributing to Mitigation of Energy Poverty Registered Increase
Renewable energy sources help solve energy poverty. For example, Opeyemi studied inter-fuel substitution between renewable and non-renewable energy, showing substantial possibilities [
45]. There is a long-run relationship between renewable energy consumption and economic growth, reflecting energy poverty and positively impacting economic growth around 60% [
46]. On the other hand, according to Khoshnevis and Shakouri, economic growth is favorable for renewables development [
47].
According to the WHO, pollution causes an estimated 1.3 million deaths annually in low-income countries. This is associated with biomass use in inadequate and bad cookstoves [
48]. To improve the situation it would require a vast investment to 2030 in subsidies for fossil fuels. As a renewable energy solution to the energy crisis, global solar energy has increased rapidly. Presently, this type of renewables is used worldwide for heating and cooling, especially due to the low initial cost and advantageous allowance. This makes solar heating and cooling systems economically attractive [
49]. Such economic attractiveness could improve the sustainable development of any project [
50].
6. Conclusions
The presented paper illustrates that energy poverty must be solved together with renewable energy source strategies [
51]. However, there are still many unresolved questions about the actual implementation. The limitation of the contribution is that it does not exhaustively address all aspects but rather presents a view of the development of the analyzed indicators of energy poverty with a focus on the use of renewable energy sources. Moreover, the contribution provides information for national policymakers who are sometimes unaware of initiatives related to energy poverty at the EU level [
52].
A limiting factor in the analyzes of the impact of RES on the state of energy poverty in a given country is the lack of detailed data. For a correct analysis, it would be necessary to obtain data on specific types of RES that contribute to the provision of heat. They are primarily solar collectors, heat pumps, and biomass boilers. By monitoring these parameters in relation to the support mechanisms of individual states, it would be possible to precisely define the influence of RES development in residential buildings and the state of energy poverty [
53]. According to the findings of experts in Slovakia, a more effective solution to energy poverty is to support RES installations in family and apartment buildings rather than subsidizing direct heat costs [
54,
55].
The results of this paper can be useful for developing economically efficient policies to solve energy poverty, as well as for future analysis and forecasting prognosis in the analyzed area. In this way, the results provide information for policymakers in areas of economic, social, and environmental decision-making.
A direction for future research will be the development of a complex assessment of the impacts of household vulnerability in terms of poverty and its relationship with population health, employment, and income. In connection with energy poverty development, quality of life will also be analyzed. Generalizing the results is often difficult owing to the unpredicted events in the present turbulent worldwide situation. This demands further attention and research.
