Article

A Cloud–Edge Collaborative Multi-Timescale Scheduling Strategy for Peak Regulation and Renewable Energy Integration in Distributed Multi-Energy Systems

1
Xi’an Dynamic Inspection and Testing Co., Ltd., Xi’an 710061, China
2
Power Dispatch Control Center, State Grid Shaanxi Electric Power Co., Ltd., Xi’an 710048, China
3
School of Electrical Engineering, Nantong University, Nantong 226019, China
*
Author to whom correspondence should be addressed.
Energies 2024, 17(15), 3764; https://doi.org/10.3390/en17153764
Submission received: 5 July 2024 / Revised: 27 July 2024 / Accepted: 27 July 2024 / Published: 30 July 2024
(This article belongs to the Section F3: Power Electronics)

Abstract

:
Incorporating renewable energy sources into the grid poses challenges due to their volatility and uncertainty in optimizing dispatch strategies. In response, this article proposes a cloud–edge collaborative scheduling strategy for distributed multi-energy systems, operating across various time scales. The strategy integrates day-ahead dispatch, intra-day optimization, and real-time adjustments to minimize operational costs, reduce the wastage of renewable energy, and enhance overall system reliability. Furthermore, the cloud–edge collaborative framework helps mitigate scalability challenges. Crucially, the strategy considers the multi-timescale characteristics of two types of energy storage systems (ESSs) and three types of demand response (DR), aimed at optimizing resource allocation efficiently. Comparative simulation results evaluate the strategy, providing insights into the significant impacts of different ESS and DR types on system performance. By offering a comprehensive approach, this strategy aims to address operational complexities. It aims to contribute to the seamless integration of renewable energy into distributed systems, potentially enhancing sustainability and resilience in energy management.

1. Introduction

In recent years, renewable energy sources (RESs) have emerged as a pivotal force reshaping the energy landscape, playing an increasingly vital role in reducing carbon emissions, enhancing energy security, and fostering sustainable development [1]. As per the International Energy Agency’s “Renewables 2023” report [2], the world witnessed a remarkable surge in annual renewable capacity additions, soaring close to 50% to reach nearly 510 GW in 2023, representing the most rapid growth rate observed in the last twenty years. Since RESs feature volatility and intermittency, energy storage systems (ESSs) [3,4,5] and demand response (DR) [6,7,8] are required for reliability and economy. Consequently, multi-energy complementary systems have emerged, where traditional thermal power sources, renewable wind and photovoltaic (PV) energy, ESSs, and loads, including DR mechanisms, interact synergistically. Within this framework, the ESS and DR mechanisms serve dual roles as both sources and loads [9,10]. Effectively regulating power flow within an ESS and coordinating DR actions are essential components of managing these multi-energy complementary systems.
Various scheduling strategies have been proposed in the recent literature to achieve effective power flow regulation. Wu et al. [11] introduce a demand response exchange model aimed at enhancing the integration of RESs in day-ahead schedules, validated through simulations across diverse system scales. Cui et al. [12] present a game-theoretic model to optimize electric vehicle charging schedules and frequency reserve allocation in day-ahead planning, addressing uncertainties in regulation signals and emphasizing privacy protection. Fujimoto et al. [13] propose an optimization scheme for wind farms and hydro generators, focusing on maximizing revenue in the day-ahead power market while managing uncertainties in wind farm outputs and hydro generator operational constraints. Unfortunately, these methods primarily focus on day-ahead scheduling, which inherently relies on forecast data and assumptions that may not fully anticipate complex future changes. Scheduling strategies that integrate intra-day optimization and real-time adjustments are often more suitable for effectively managing multi-energy complementary systems. Huang et al. [14] propose an approximate dynamic programming algorithm for microgrid economic dispatch under stochastic variables, using Monte Carlo sampling and piecewise linear function approximation for optimal operation under uncertainty. Li et al. [15] introduce a hybrid energy scheduling model using game theory to optimize interactions among market entities in integrated energy systems, enhanced by an adaptive multi-objective whale optimization algorithm to tackle complex optimization challenges. Sharma et al. [16] propose a multi-timescale energy management system for buildings with renewable energy integration, optimizing energy dispatch to mitigate uncertainties and reduce carbon footprint, while enhancing battery longevity.
However, the above methods primarily emphasize addressing the impact of uncertainties, with less consideration given to the response time of energy resources. Liu et al. [17] propose improved discretization criteria for modeling transient natural gas flows in integrated energy systems, demonstrating superior effectiveness through simulations compared to existing methods. Pan et al. [18] analyze interactions in district electricity and heating systems, proposing a model to optimize system security and economic efficiency based on time-scale dynamics, validated through case studies. Fang et al. [19] propose an optimization model for integrated gas and electrical power systems, focusing on bidirectional energy conversion and operational efficiency, validated through simulations to support planning and decision-making. Dou et al. [20] propose a dynamic dispatching method for integrated energy systems, optimizing energy subsystems and loads using model predictive control principles to manage dynamic network properties and uncertainties in RESs. However, these methods hinge on a centralized controller, which may become increasingly cumbersome as the system expands, potentially resulting in decreased reliability and scalability challenges. In contrast, decentralized methods like cloud–edge collaboration offer enhanced flexibility in resource management and real-time decision-making capabilities, thereby mitigating these scalability issues and improving overall system robustness. Sheng et al. [21] propose a multi-timescale scheduling method integrating generation-side and demand-side strategies to optimize distribution network operation, considering distributed energy resource integration and user satisfaction. Yang et al. [22] present a multi-timescale optimization approach for economic dispatch in micro-energy grids with renewable energy integration, focusing on mitigating prediction errors and enhancing system performance through distributed control strategies. Nevertheless, all of the above scheduling strategies focus less on the response time of different kinds of ESS and DR.
In this article, a cloud–edge collaborative multi-timescale scheduling strategy is proposed for peak regulation and renewable energy integration in distributed multi-energy systems. The key contributions of this article are listed as follows:
  • The proposed scheduling strategy integrates day-ahead dispatch, intra-day optimization, and real-time adjustments with the goal of minimizing costs, reducing the occurrence of abandoned renewable energy, and enhancing overall reliability in distributed multi-energy systems.
  • The proposed scheduling strategy considers the multi-timescale characteristics of two kinds of ESSs and three kinds of DR, enhancing the efficiency of resource allocation in scheduling.
  • An analysis is provided regarding the substantial impact of various types of ESSs and DR, based on comparative simulation results.
The rest of this article is organized as follows. Section 2 offers a detailed overview of the components of classical multi-energy systems. In Section 3, the cloud–edge collaborative multi-timescale scheduling strategy is discussed, including an examination of the cost functions, constraints, and optimization processes across the three timescales. Section 4 showcases various case studies to illustrate the practical implementation of the proposed strategy. Finally, Section 5 provides a summary of the main findings and outlines potential avenues for future research.

2. Structure of Typical Multi-Energy Systems

Typical multi-energy systems include power generation, the grid, loads, and energy storage systems (ESSs), as depicted in Figure 1. These systems also integrate edge computing for localized operations at each component and centralized cloud computing for coordinating and managing overall system functions. In the following subsections, each component will be explored in detail to illustrate their roles and interactions within these complex systems.

2.1. Power Generation

Power generation refers to the process of producing electricity from various energy sources. These sources are crucial in supplying the necessary electrical energy to meet the demands of consumers and industries worldwide.

2.1.1. Wind Power

A wind power generation system generates electricity from wind energy. It consists of blades that capture wind to rotate a generator, converting kinetic energy into electrical power. The relationship between electrical power P w and wind speed v w is
P w i = 0 , 0 v w i < v min o r v w v max P w i , r v w i v min v w i , r v min , v min v w i < v w i , r P w i , r , v w i , r v w i < v max ,
where v min and v max denote the minimum and maximum allowable wind speeds, respectively, P w i , r is the rated power output of the wind turbine, and v w i , r is the wind speed at which the turbine reaches its rated power P w i , r .

2.1.2. PV Power

A PV system converts sunlight directly into electricity using solar panels. These panels harness the photovoltaic effect to generate electrical power from sunlight, which is then converted from direct current to usable alternating current electricity via inverters. The electrical power P p v is influenced by the intensity of sunlight E and the efficiency of the solar panels η p v , which can be expressed by
P p v = η p v · P p v , r · E p v E p v , 0 1 + ϵ p v T p v T p v , 0 ,
where P p v , r is the rated power of the photovoltaic cell, E p v , 0 is the standard irradiance, ϵ p v is the temperature coefficient of the photovoltaic cell, T p v is the actual operating temperature of the photovoltaic cell, and T p v , 0 is the standard operating temperature.

2.1.3. Thermal Power

A thermal power generation system converts heat energy from combustible fuels into electricity through turbines and generators. This process involves burning fossil fuels such as coal, natural gas, or oil to produce high-temperature steam. The steam drives turbines connected to generators, where mechanical energy is transformed into electrical power. The electrical output P t h depends on the heat energy content of the fuel Q t h . The relationship can be expressed as:
P t h = η t h · Q t h ,
where η t h is the efficiency of the system.

2.2. Loads

Power load refers to the electricity consumed by users connected to the grid, varying daily and seasonally due to factors like weather and economic activity. Managing load is crucial for grid stability and reliable electricity supply.

2.2.1. Fixed Loads

Fixed loads in an electricity system refer to consumers whose electricity demand remains constant and who do not participate in grid scheduling due to their essential nature or inability to adjust consumption in response to grid operator requests. Examples include residential homes, hospitals, and certain industrial processes with continuous power needs that cannot be easily varied. These loads are crucial for everyday operations and provide a baseline of electricity consumption that grid operators must reliably supply without the ability to alter their demand based on grid conditions.

2.2.2. DR

DR can be categorized into three types based on timing and flexibility:
Type I DR involves load scheduling a day before delivery, aiding efficient planning and resource management for better reliability and economic efficiency.
Type II DR focuses on intra-day adjustments to real-time market conditions, with response times of 15 min to 2 h, optimizing flexibility and resource use throughout the day.
Type III DR requires near-instantaneous load responses to market signals, typically within 5 min, offering the highest flexibility for emergencies and grid stability.

2.3. Grid

The power grid encompasses the infrastructure used to transmit and distribute electricity from power plants to consumers. It includes transmission lines, substations, transformers, and other equipment designed to efficiently transport electricity over long distances and across different voltage levels.

2.4. ESS

The ESS enables the capture and retention of electrical energy for later use, helping to balance supply and demand on the power grid. These technologies mainly include electrochemical storage and pumped hydro storage. The ESS plays a critical role in integrating RESs and enhancing grid resilience.

2.4.1. Battery Energy Storage

Batteries are prized for their rapid response capabilities in grid management. They excel in quickly storing and discharging electricity, making them ideal for providing instantaneous adjustments to grid demand and supply. Unlike pumped hydro storage, batteries are not geographically constrained and can be deployed in various locations, close to demand centers or RESs. However, they typically offer lower storage capacity compared to pumped hydro systems and come with higher initial costs per unit of energy stored. Moreover, batteries degrade over time due to repeated charging and discharging cycles, requiring periodic replacement or maintenance to maintain optimal performance and reliability. The electrical output P b a t of the battery storage system can be calculated based on the efficiency η b a t , the capacity of the battery C b a t at two different times t and t 0 , and the state of charge S O C b a t at these times. The formula is given by:
P b a t = η b a t · C b a t ( t ) · S O C b a t ( t ) C b a t ( t 0 ) · S O C b a t ( t 0 ) t t 0 .

2.4.2. Pumped Hydro Storage

Pumped hydro storage, in contrast, is known for its large-scale energy storage capacity and cost-effectiveness. This technology operates by pumping water from a lower reservoir to an upper reservoir during periods of low demand or surplus renewable energy. When electricity demand peaks, water is released from the upper reservoir turbines to generate electricity. Pumped hydro storage systems provide a reliable and stable power supply, critical for grid stability over extended periods. However, they are geographically dependent, requiring specific terrain with suitable elevation differences and access to water resources. Despite the initial capital-intensive nature of construction, pumped hydro storage facilities offer long-term economic benefits with low operational costs. They also have a long lifespan, minimizing environmental impact compared to other energy storage solutions. The electrical output P h y of the hydroelectric system depends on the flow rate Q h y , the height of the water head H h y , and the efficiency η h y . The relationship can be expressed as:
P h y = η h y · ρ w a t e r · g · Q h y · H h y ,
where ρ w a t e r is the density of water and g is the acceleration due to gravity.

3. Cloud–Edge Collaborative Multi-Timescale Scheduling Strategy

The cloud–edge collaborative multi-timescale scheduling strategy integrates day-ahead dispatch, intra-day optimization, and real-time adjustments to enhance flexibility across planning horizons. This approach optimizes resource allocation and responsiveness, bolstered by cloud–edge collaboration, which combines robust long-term planning with real-time operational decision-making. Together, these elements ensure agile and cost-effective management of multi-energy systems, enhancing reliability and sustainability in dynamic operational environments.

3.1. Day-Ahead Dispatch

Given the inherent uncertainties in day-ahead dispatch, the multi-scenario stochastic planning approach [23] is introduced to address uncertainties in system load and RES generation by generating multiple scenarios with associated probabilities. The entities involved in day-ahead dispatch include the following:
  • Thermal power generation.
  • Pumped hydro storage charging or discharging.
  • Type I DR charging or discharging.

3.1.1. Cost Functions

The cost function of thermal power generation primarily considers both generation costs and startup/shutdown costs, which can be expressed by   
min J t h , i = t = 1 t e n d s = 1 N s p s a i P t h , i , t , s 2 + b i P t h , i , t , s + c i + β t h , i h t h , i , s .
Here, J t h , i is the cost function associated with the i-th thermal power unit. t and s are the hourly and scenario indices, respectively, with p s indicating the probability of scenario s. t e n d is 24 (24*1 h) in the day-ahead dispatch. P t h , i , t , s represents the power output of the i-th thermal unit at hour t under scenario s; a i , b i , c i are coefficients representing the quadratic cost function parameters specific to the i-th thermal unit. β t h , i is a parameter that weights the additional costs incurred during startup and shutdown activities; h i , s refers to the total number of times thermal power units start up and shut down.
The cost function of pumped hydro storage primarily considers operational and maintenance costs, which can be expressed as
min J h y , i = t = 1 t e n d s = 1 N s p s α h y , i P h y , i , t , s ,
where J h y , i is the total cost of pumped hydro storage system i, α h y , i represents the coefficient of operating and maintenance cost, and P h y , i , t , s denotes the energy produced or consumed by system i at time t in state s.
The cost function J D R , i , I represents the total cost associated with implementing Type I DR for the i-th load unit, given by
min J D R , i , I = t = 1 t e n d s = 1 N s p s α D R , i , I P D R , i , I , t , s ,
where α D R , i , I represents the coefficient associated with operational costs and economic incentives specific to the i-th load and scenario s and P D R , i , I , t , s denotes the amount of load adjusted or shifted by the i-th load’s DR at time t in scenario s.
These cost functions play a crucial role in optimizing the performance of each respective component within edge computing systems. When considering overall resource allocation in cloud computing centers, a unified objective function J day _ ahead can be formulated by aggregating the individual cost functions J t h , i , J h y , i , and J D R , i , I :
min J day _ ahead = i = 1 N t h J t h , i + i = 1 N h y J h y , i + i = 1 N l o J D R , i , I
where N t h , N h y , and N l o represent the total number of thermal power units, pumped hydro storage systems, and load units, respectively, involved in the edge computing infrastructure. This unified objective function J d a y _ a h e a d integrates the economic considerations of thermal power generation, pumped hydro storage operation, and demand response strategies across various scenarios s throughout the 24-h period t.

3.1.2. Constraints

The power balance constraint in the energy system can be expressed by
i = 1 N t h P t h , i , t , s + i = 1 N w i P w i , i , t , s p r e + i = 1 N p v P p v , i , t , s p r e = i = 1 N h y P h y , i , t , s + i = 1 N l o P D R , i , I , t , s + P f i , i , t , s p r e P loss p r e ,
where P t h , i , t , s , P w i , i , t , s p r e , and P p v , i , t , s p r e represent the power generation from thermal, wind (predicted), and photovoltaic (predicted) sources at hour t, respectively. P h y , i , t , s denotes the power generated by hydropower, while P D R , i , I , t , s and P f l , i , t , s p r e represent DR and predicted fixed load contributions, respectively. P loss p r e accounts for predicted system losses.
In the context of thermal power generation, the constraint for P t h , i , t , s involves both operational limits and ramping constraints. Specifically, P t h , i , t , s must satisfy
P t h , i min P t h , i , t , s P t h , i max ,
where P t h , i min and P t h , i max represent the minimum and maximum allowable power outputs of the i-th thermal unit at time t, respectively. Additionally, the ramping constraint ensures smooth transitions between consecutive time periods:
| P t h , i , t P t h , i , t 1 | R t h , i ,
where R t h , i denotes the ramp rate limit for the i-th thermal unit, ensuring that the change in power output between consecutive hours does not exceed R t h , i .
The power P D R , i , I , t , s of the i-th Type I DR system satisfies
| P D R , i , I , t , s | < P D R , i , I m a x .
Here, P D R , i , I m a x denotes the maximum power limit of the i-th Type I DR system.
In the context of pumped hydro storage power plants, the constraints for P h y , i , t , s encompass operational limits, ramping constraints, and energy storage limitations. Firstly, P h y , i , t , s must satisfy
P h y , i min P h y , i , t , s P h y , i max ,
where P h y , i min and P h y , i max denote the minimum and maximum allowable power outputs of the i-th pumped hydro unit at time t under scenario s, respectively.
Secondly, the ramping constraint ensures smooth transitions between consecutive time periods:
| P h y , i , t , s P h y , i , t 1 , s | R h y , i ,
where R h y , i represents the ramp rate limit for the i-th pumped hydro unit, limiting the rate of change in power output.
Thirdly, the energy storage constraint ensures the amount of energy stored in the reservoir does not exceed its capacity:
E h y , i max E h y , i , t , s E h y , i max ,
where E h y , i , t , s is the energy stored in the reservoir of the i-th pumped hydro unit at time t under scenario s. E h y , i max and E h y , i max denote the minimum and maximum energy storage capacity of the unit.
By defining cost functions and constraints in day-ahead dispatch, operational costs can be minimized while ensuring stable and efficient management of thermal power, pumped hydro storage, and Type I DR. These measures optimize resource allocation, enhance system reliability, and effectively respond to fluctuating energy demands and renewable generation uncertainties.

3.2. Intra-Day Optimization

Intra-day optimization builds on multi-scenario stochastic planning from day-ahead dispatch. It uses 3-h forecasted data and adapts to the dynamic nature of the following:
  • Power generation from distributed RESs.
  • Charging and discharging operations of battery energy storage systems.
  • Activation of Type II DR strategies.

3.2.1. Cost Functions

The cost function for photovoltaic power generation includes components for generation costs, startup/shutdown costs, and the environmental impact due to unused generated electricity, expressed as:   
min J p v , i = t = 1 t e n d s = 1 N s p s α p v , i P p v , i , t , s + β p v , i h p v , i , s + γ p v , i ( P p v , i , t , s p r e P p v , i , t , s ) ,
where J p v , i is the cost associated with the i-th photovoltaic unit. t e n d is 12 (12*15 min) in the intra-day optimization. P p v , i , t , s denotes the power output of the i-th photovoltaic unit at hour t under scenario s. α p v , i , β p v , i , and γ p v , i are coefficients representing generation, startup/shutdown, and environmental impact cost parameters, respectively. h p v , i , s represents the total number of startup/shutdown events for the i-th unit.
The cost function for wind power generation similarly incorporates various components, reflecting operational dynamics and environmental considerations:
min J w i , i = t = 1 t e n d s = 1 N s p s α w i , i P w i , i , t , s + β w i , i h w i , i , s + γ w i , i ( P w i , i , t , s p r e P w i , i , t , s ) .
In this formulation, J w i , i represents the cost associated with the i-th wind turbine. Hourly and scenario indices t and s are used, with p s denoting the probability of scenario s. P w i , i , t , s signifies the power output of the i-th wind turbine at hour t under scenario s. Coefficients α w i , i , β w i , i , and γ w i , i correspond to generation, startup/shutdown, and environmental impact cost parameters, respectively. h w i , i , s denotes the total number of startup/shutdown events for the i-th turbine.
The cost function of battery energy storage, considering operational and maintenance costs, as well as battery aging costs, can be expressed as
min J b a , i = t = 1 t e n d s = 1 N s p s ( α b a , i P b a , i , t , s + β b a , i C b a , i , t , s )
where J b a , i is the total cost of battery energy storage system i, α b a , i represents the coefficient of operating and maintenance cost, P b a , i , t , s denotes the energy produced or consumed by system i at time t in state s, β b a , i is the coefficient related to battery aging cost, and C b a , i , t , s denotes the number of cycles of system i at time t in state s.
The cost function J D R , i , I I is similar to J D R , i , I , which is given by
min J D R , i , I I = t = 1 t e n d s = 1 N s p s α D R , i , I I P D R , i , I I , t , s .
The cost function of intra-day optimization for the cloud data center is
min J intra _ day = J day _ ahead + i = 1 N p v J p v , i + i = 1 N w i J w i , i + i = 1 N b a J b a , i + i = 1 N l o J D R , i , I I ,
where N p v , N w i , and N b a represent the total number of photovoltaic arrays, wind turbines, and battery storage systems managed in the optimization, respectively.

3.2.2. Constraints

The constraints in Equations (11)–(16) are available in intra-day optimization. The powers P w i , i , t , s and P p v , i , t , s are satisfied
0 < P w i , i , t , s < P w i , i , t , s p r e
0 < P p v , i , t , s < P p v , i , t , s p r e .
The power P b a , i , t , s of the i-th battery energy storage system satisfies
| P b a , i , t , s | < P b a , i , m a x .
Here, P b a , i , m a x denotes the maximum power limit of the i-th battery system.
The power P D R , i , I I , t , s of the i-th Type II DR system satisfies
| P D R , i , I I , t , s | < P D R , i , I I m a x .
The power balance constraint in the multi-energy system turns into
i = 1 N t h P t h , i , t , s + i = 1 N w i P w i , i , t , s + i = 1 N p v P p v , i , t , s = i = 1 N h y P h y , i , t , s + i = 1 N b a P b a , i , t , s + i = 1 N l o P D R , i , I , t , s + P D R , i , I I , t , s + P f i , i , t , s p r e P loss p r e .
By continually adapting to changing conditions, intra-day optimization can enhance grid stability and maximizes the utilization of RESs.

3.3. Real-Time Adjustment

Real-time adjustment in energy systems builds upon the foundation laid by both day-ahead dispatch and intra-day scheduling, integrating a multi-scenario stochastic planning approach to effectively manage uncertainties and optimize resource utilization. The entities involved in real-time adjustment include the following:
  • Spinning reserve capacity of thermal power and pumped hydro storage power.
  • Type III DR charging or discharging.

3.3.1. Cost Functions

The cost function of spinning reserve capacity J s p can be expressed by
min J s p = t = 1 t e n d s = 1 N s p s i = 1 N t h α s p , t h , i R t h , i , t , s + i = 1 N h y α s p , h y , i R h y , i , t , s
where α s p , t h , i and α s p , h y , i are coefficients representing the cost parameters associated with thermal unit i and pumped hydro unit i, respectively, and R t h , i , t , s and R h y , i , t , s represent the spinning reserve capacity provided by thermal unit i and pumped hydro unit i in scenario s and at time t. t e n d is 12 (12*5 min) in the real-time adjustment.
The cost function J D R , i , I I I is similar to J D R , i , I and J D R , i , I I , which is given by
min J D R , i , I I I = t = 1 t e n d s = 1 N s p s α D R , i , I I I P D R , i , I I I , t , s .
The cost function of real-time adjustment for the cloud data center is
min J real _ time = J intra _ day + J s p + i = 1 N l o J D R , i , I I I ,

3.3.2. Constraints

The constraints in Equations (11)–(16) and Equations (22)–(25) are available in real-time adjustments. The power balance constraint, as compared to Equation (26), incorporates Type III DR, while maintaining consistency with other aspects, without further elaboration. The power P D R , i , I I I , t , s of the i-th Type III DR system satisfies
| P D R , i , I I I , t , s | < P D R , i , I I I m a x .
To ensure the stability and reliability of the multi-energy system, a constraint is set for the provision of spinning reserve capacity. Specifically, it is required that:   
Pr { i = 1 N t h P t h , i , t , s + i = 1 N t h R t h , i , t , s + i = 1 N w i P w i , i , t , s + i = 1 N p v P p v , i , t , s i = 1 N h y P h y , i , t , s + i = 1 N b a P b a , i , t , s P loss p r e i = 1 N l o P D R , i , I , t , s + P D R , i , I I , t , s + P D R , i , I I I , t , s + P f i , i , t , s p r e + i = 1 N h y R h y , i , t , s } 0.95
This equation specifies the probabilistic constraint ensuring that the sum of various power sources and reserves meets or exceeds the combined demand, losses, and flexibility factors, with a reliability requirement of at least 95%.

3.4. Operational Process

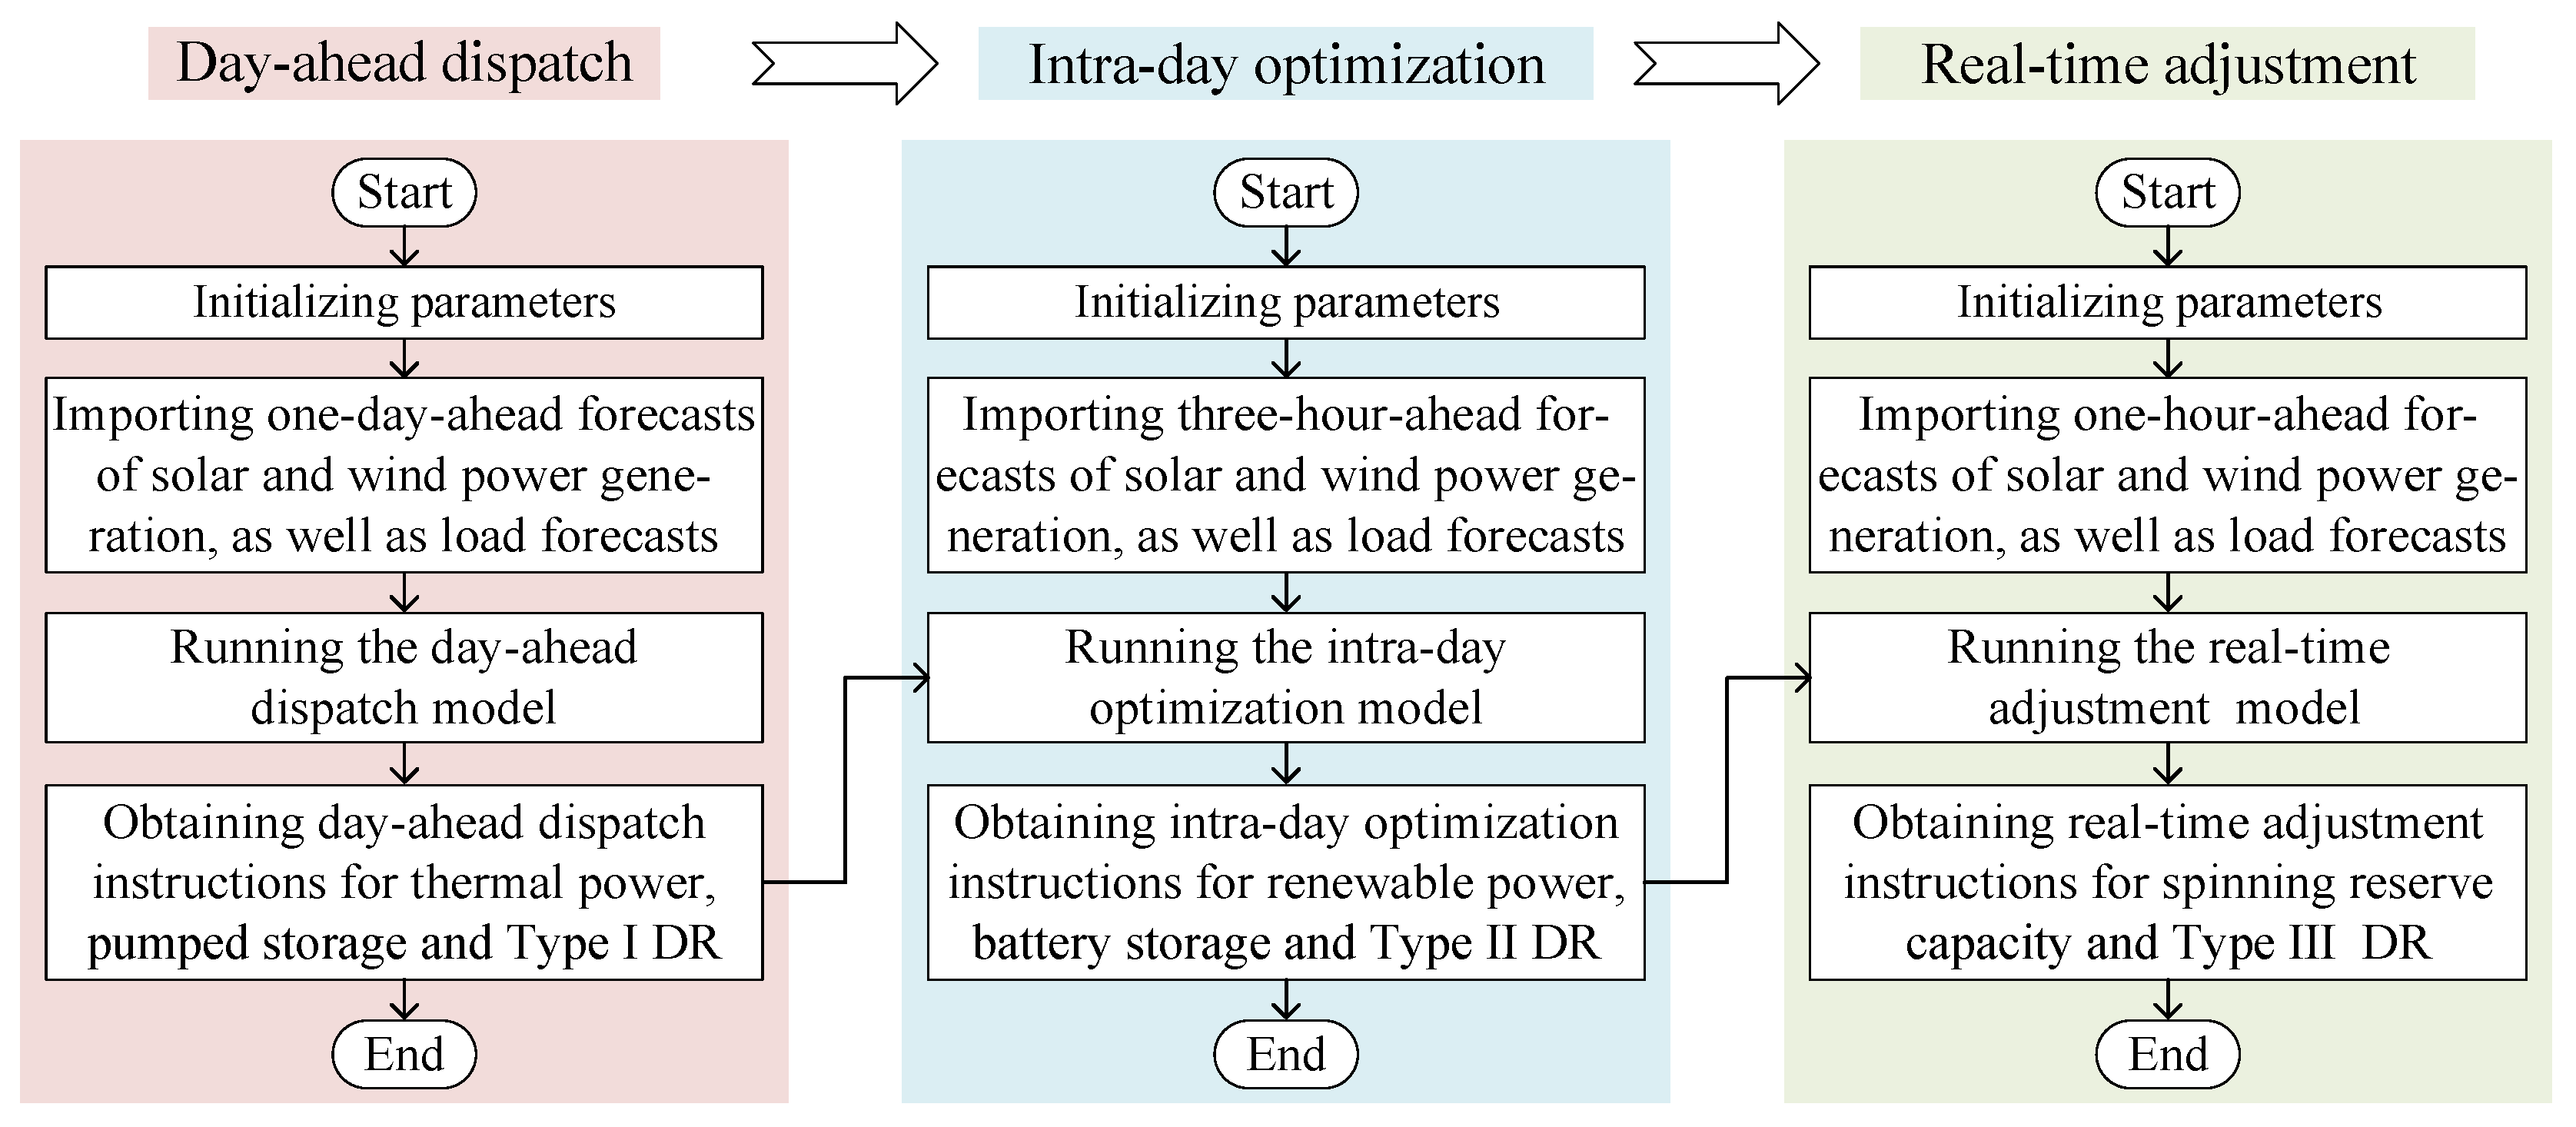
The process begins with day-ahead dispatch, utilizing forecasts for solar and wind power generation and load predictions for the following day. This phase optimizes operations to generate instructions for thermal power, pumped storage, and Type I DR, leveraging advanced planning to meet anticipated energy demands efficiently.
Following day-ahead dispatch, intra-day optimization refines strategies using forecasts for solar and wind power generation and load forecasts for the next three hours. This stage adjusts plans for renewable power, battery storage, and Type II DR, capitalizing on shorter time horizons to adapt swiftly to changing conditions.
Real-time adjustment follows, incorporating updated forecasts for solar and wind power generation and immediate load predictions. This phase calculates adjustments for spinning reserve capacity and Type III DR, ensuring responsive management of grid stability amid sudden changes in renewable generation or demand. The operational process of the proposed method is summarized in Figure 2 and visually depicted in Algorithm 1.
While this method provides a robust framework for managing energy and ensuring grid reliability under typical operational conditions, it primarily focuses on optimizing each phase independently. This approach allows for precise and effective management of resources in day-ahead, intra-day, and real-time contexts. However, the method’s specialization in phase-specific optimization may limit its flexibility in handling extreme or unforeseen scenarios. In cases of sudden, severe disruptions or rapid, unexpected changes in generation or demand, the method might not fully leverage opportunities for dynamic resource reallocation across different phases. Thus, while it excels in routine operations and offers a well-structured approach to balancing energy needs and grid stability, it may benefit from additional mechanisms to enhance adaptability during extraordinary situations.
Algorithm 1 Proposed cloud–edge collaborative multi-timescale scheduling algorithm
  1:  Initialize parameters for all components. Set time interval Δ t to 5 min.
  2:  Set cost functions and constraints in Equations (6)–(31)
  3:  for  t = 0 , 1 , 2 , , 287  do
  4:        if   t mod 288 = 0  then
  5:              Input 24-h P p v , i , t , s p r e , P w i , i , t , s p r e , and P f i , i , t , s p r e .
  6:              Solve (9) subject to the constraints (10)–(16).
  7:              Output 24-h P t h , i , t , s , P h y , i , t , s , and P D R , i , I , t , s .
  8:        end if
  9:        if   t mod 36 = 0  then
 10:              Input 3-h P p v , i , t , s p r e , P w t , i , t , s p r e , P f i , i , t , s p r e , P t h , i , t , s , P h y , i , t , s , and P D R , i , I , t , s .
 11:              Solve (21) subject to the constraints (11)–(16), and (22)–(26).
 12:              Output 3-h P p v , i , t , s , P w i , i , t , s , P b a , i , t , s , and P D R , i , I I , t , s .
 13:        end if
 14:        if   t mod 12 = 0  then
 15:              Input 1-h P p v , i , t , s p r e , P w t , i , t , s p r e , P f i , i , t , s p r e , P t h , i , t , s , P h y , i , t , s , P D R , i , I , t , s , P p v , i , t , s , P w i , i , t , s , P b a , i , t , s , and P D R , i , I I , t , s .
 16:              Solve  (29) subject to the constraints (11)–(16),  (22)–(25), and (30)–(31).
 17:              Output 1-h R t h , i , t , s , R h y , i , t , s and P D R , i , I I I , t , s .
 18:        end if
 19:  end for
 20:  Return results

4. Case Studies and Results

4.1. Setting of the Case Studies

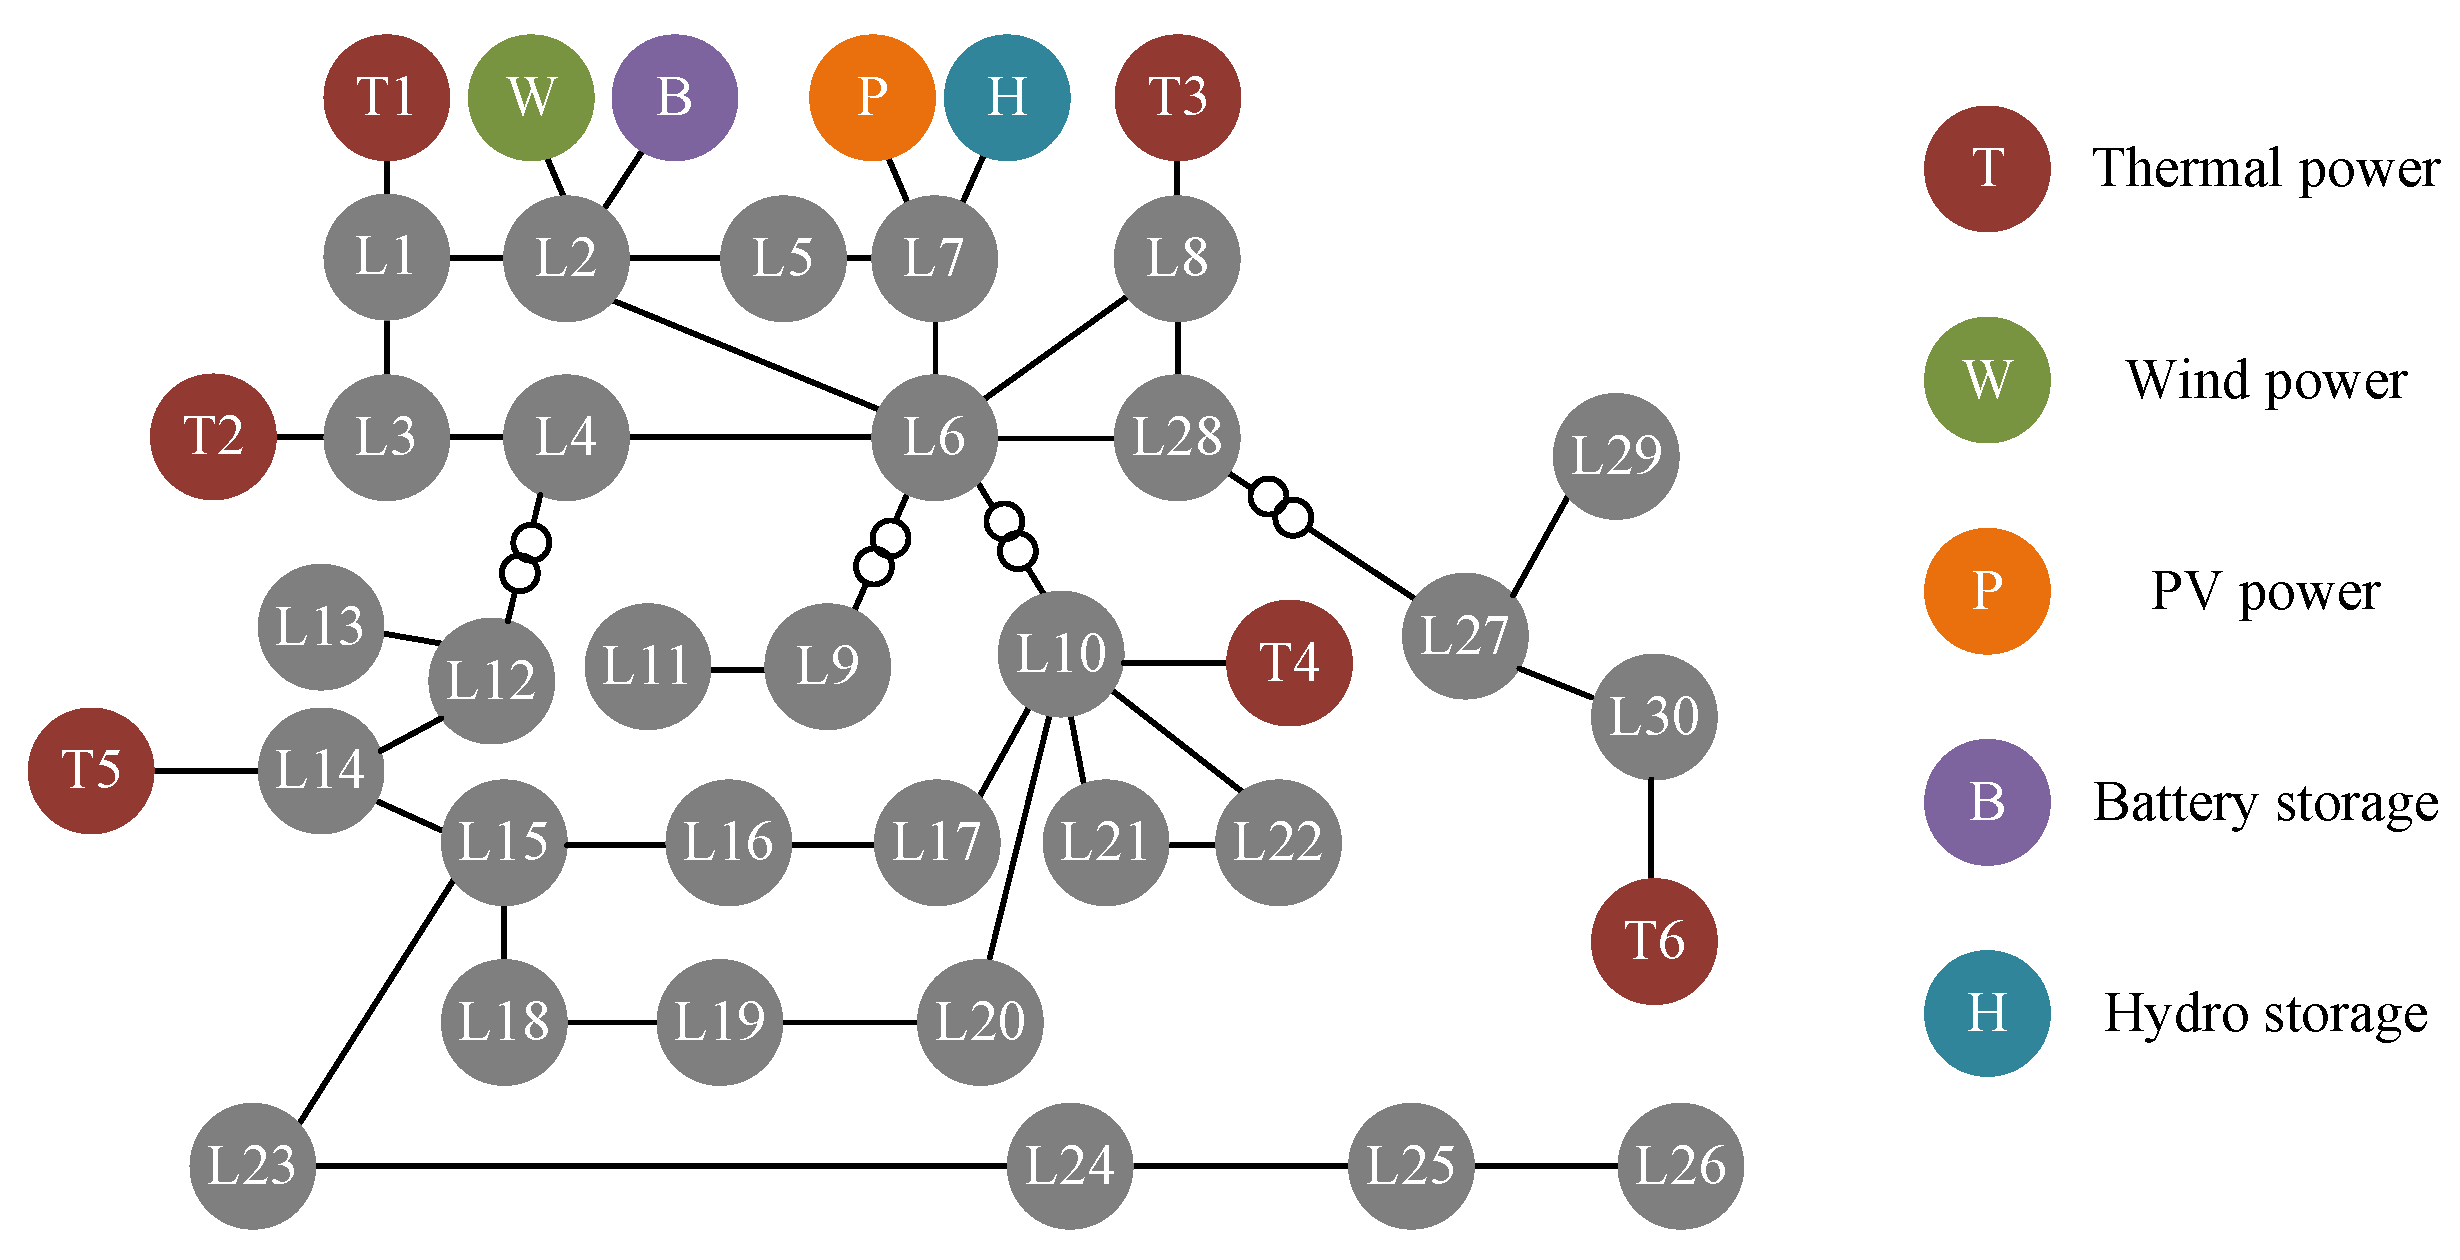
To validate the proposed method, a simulation model is constructed, depicted in Figure 3. The model illustrates an electrical power system consisting of 30 load nodes distributed across various points. The system integrates six thermal power plants, one PV plant, one wind turbine, one pumped hydro storage unit, and one battery energy storage system. Each power generation unit is strategically connected to different load nodes to simulate realistic energy distribution and consumption patterns. The optimization problem is tackled with the Gurobi solver, implemented through the MATLAB simulation platform. The model allows for comprehensive testing and validation of the proposed methodology under diverse operational scenarios, encompassing the dynamic interactions between renewable energy sources, conventional power plants, and storage systems within a complex grid infrastructure.
Table 1 outlines crucial operational parameters of the electrical power system components in the model. These include maximum and minimum power outputs for thermal power plants, PV, and wind turbines and the capacities and ramp rates of storage units such as pumped hydro and battery energy systems.
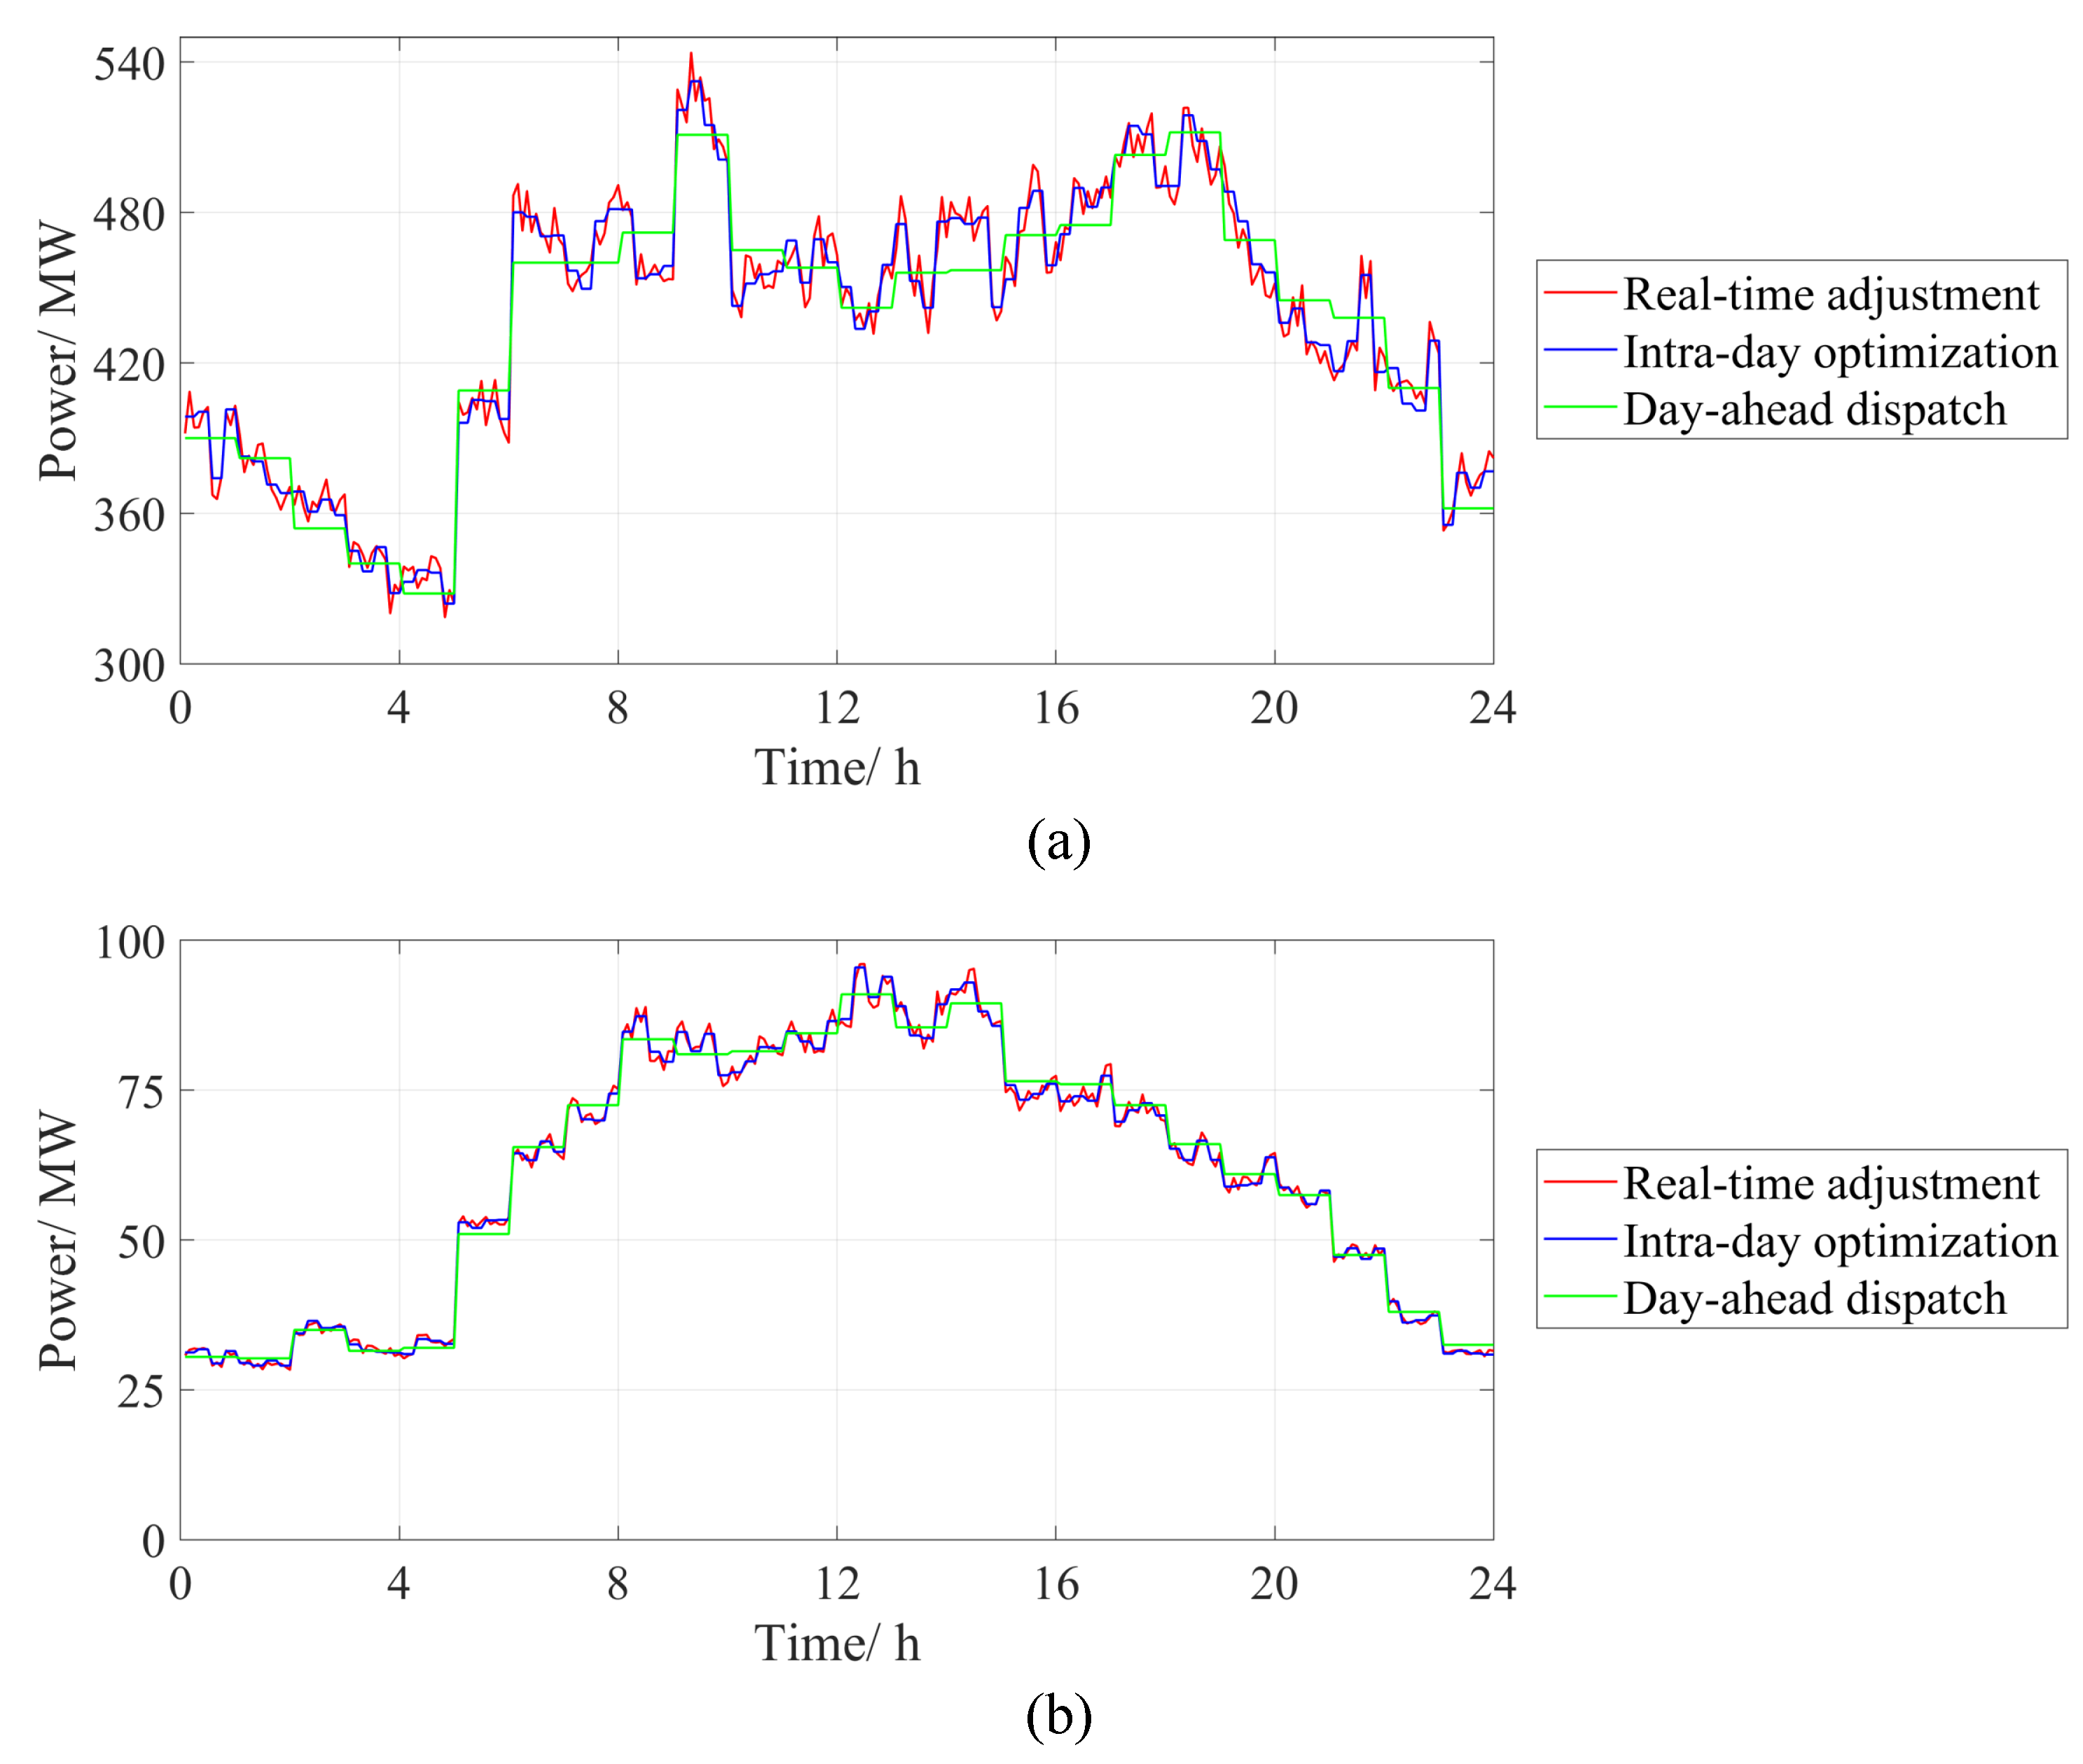
In addition, the simulation includes forecasting errors for RESs and loads across different operational stages: 10% for day-ahead dispatch, 5% for intra-day optimization, and 1% for real-time adjustment. Figure 4 illustrates the predicted power profiles of RESs and loads. The actual data used in the simulation were obtained from a region in Northwest China. The forecasted data were created by adding random errors to these real-world observations. Panel (a) shows characteristic daytime peak and nighttime trough patterns in load power. Panel (b) depicts PV power generation with higher output during the day and lower output at night. Panel (c) illustrates scenario 1’s wind power generation, highlighting higher daytime generation and reduced nighttime generation. In contrast, panel (d) displays scenario 2’s wind power, revealing a daytime dip in generation. The actual values are omitted in Figure 4 due to their similarity to real-time adjustment data.
To assess the significant roles of battery storage, pumped hydro storage, and DR in scheduling, three case studies have been designed to examine their involvement, as illustrated in Table 2. These case studies are structured to evaluate the specific contributions of battery storage, pumped hydro storage, and DR in optimizing energy management strategies within the simulated power system framework.

4.2. Results and Analysis

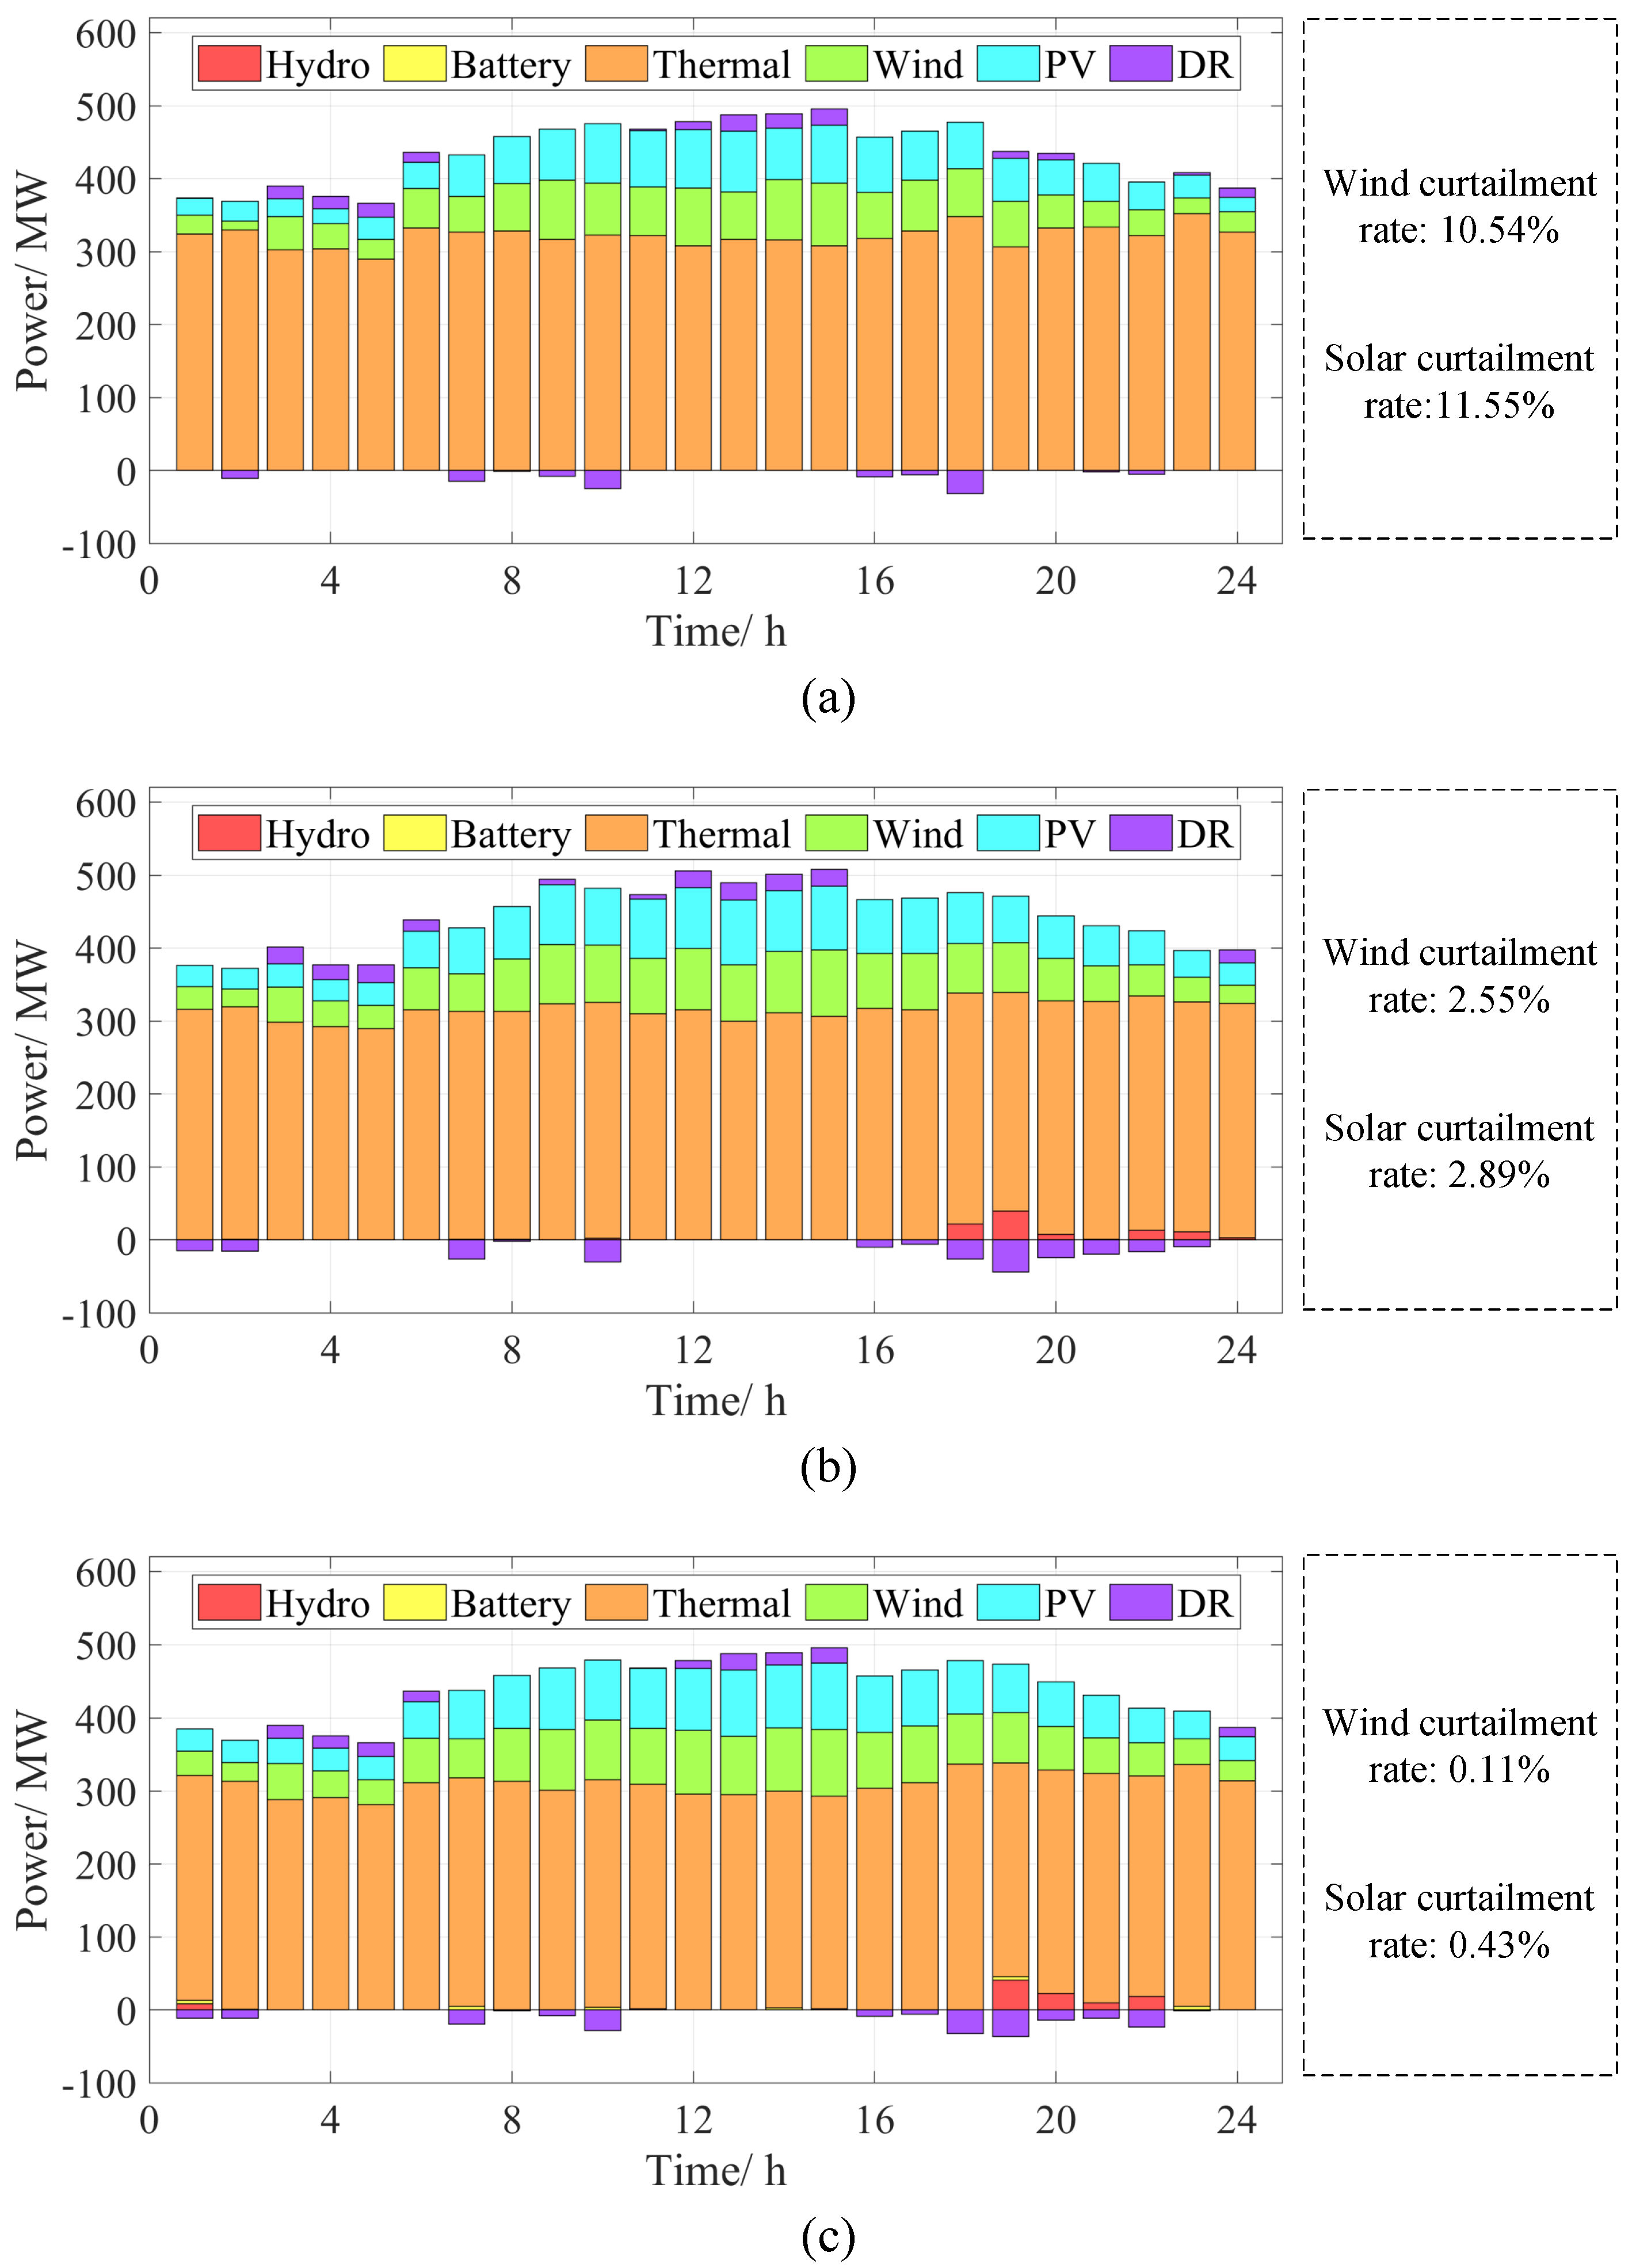
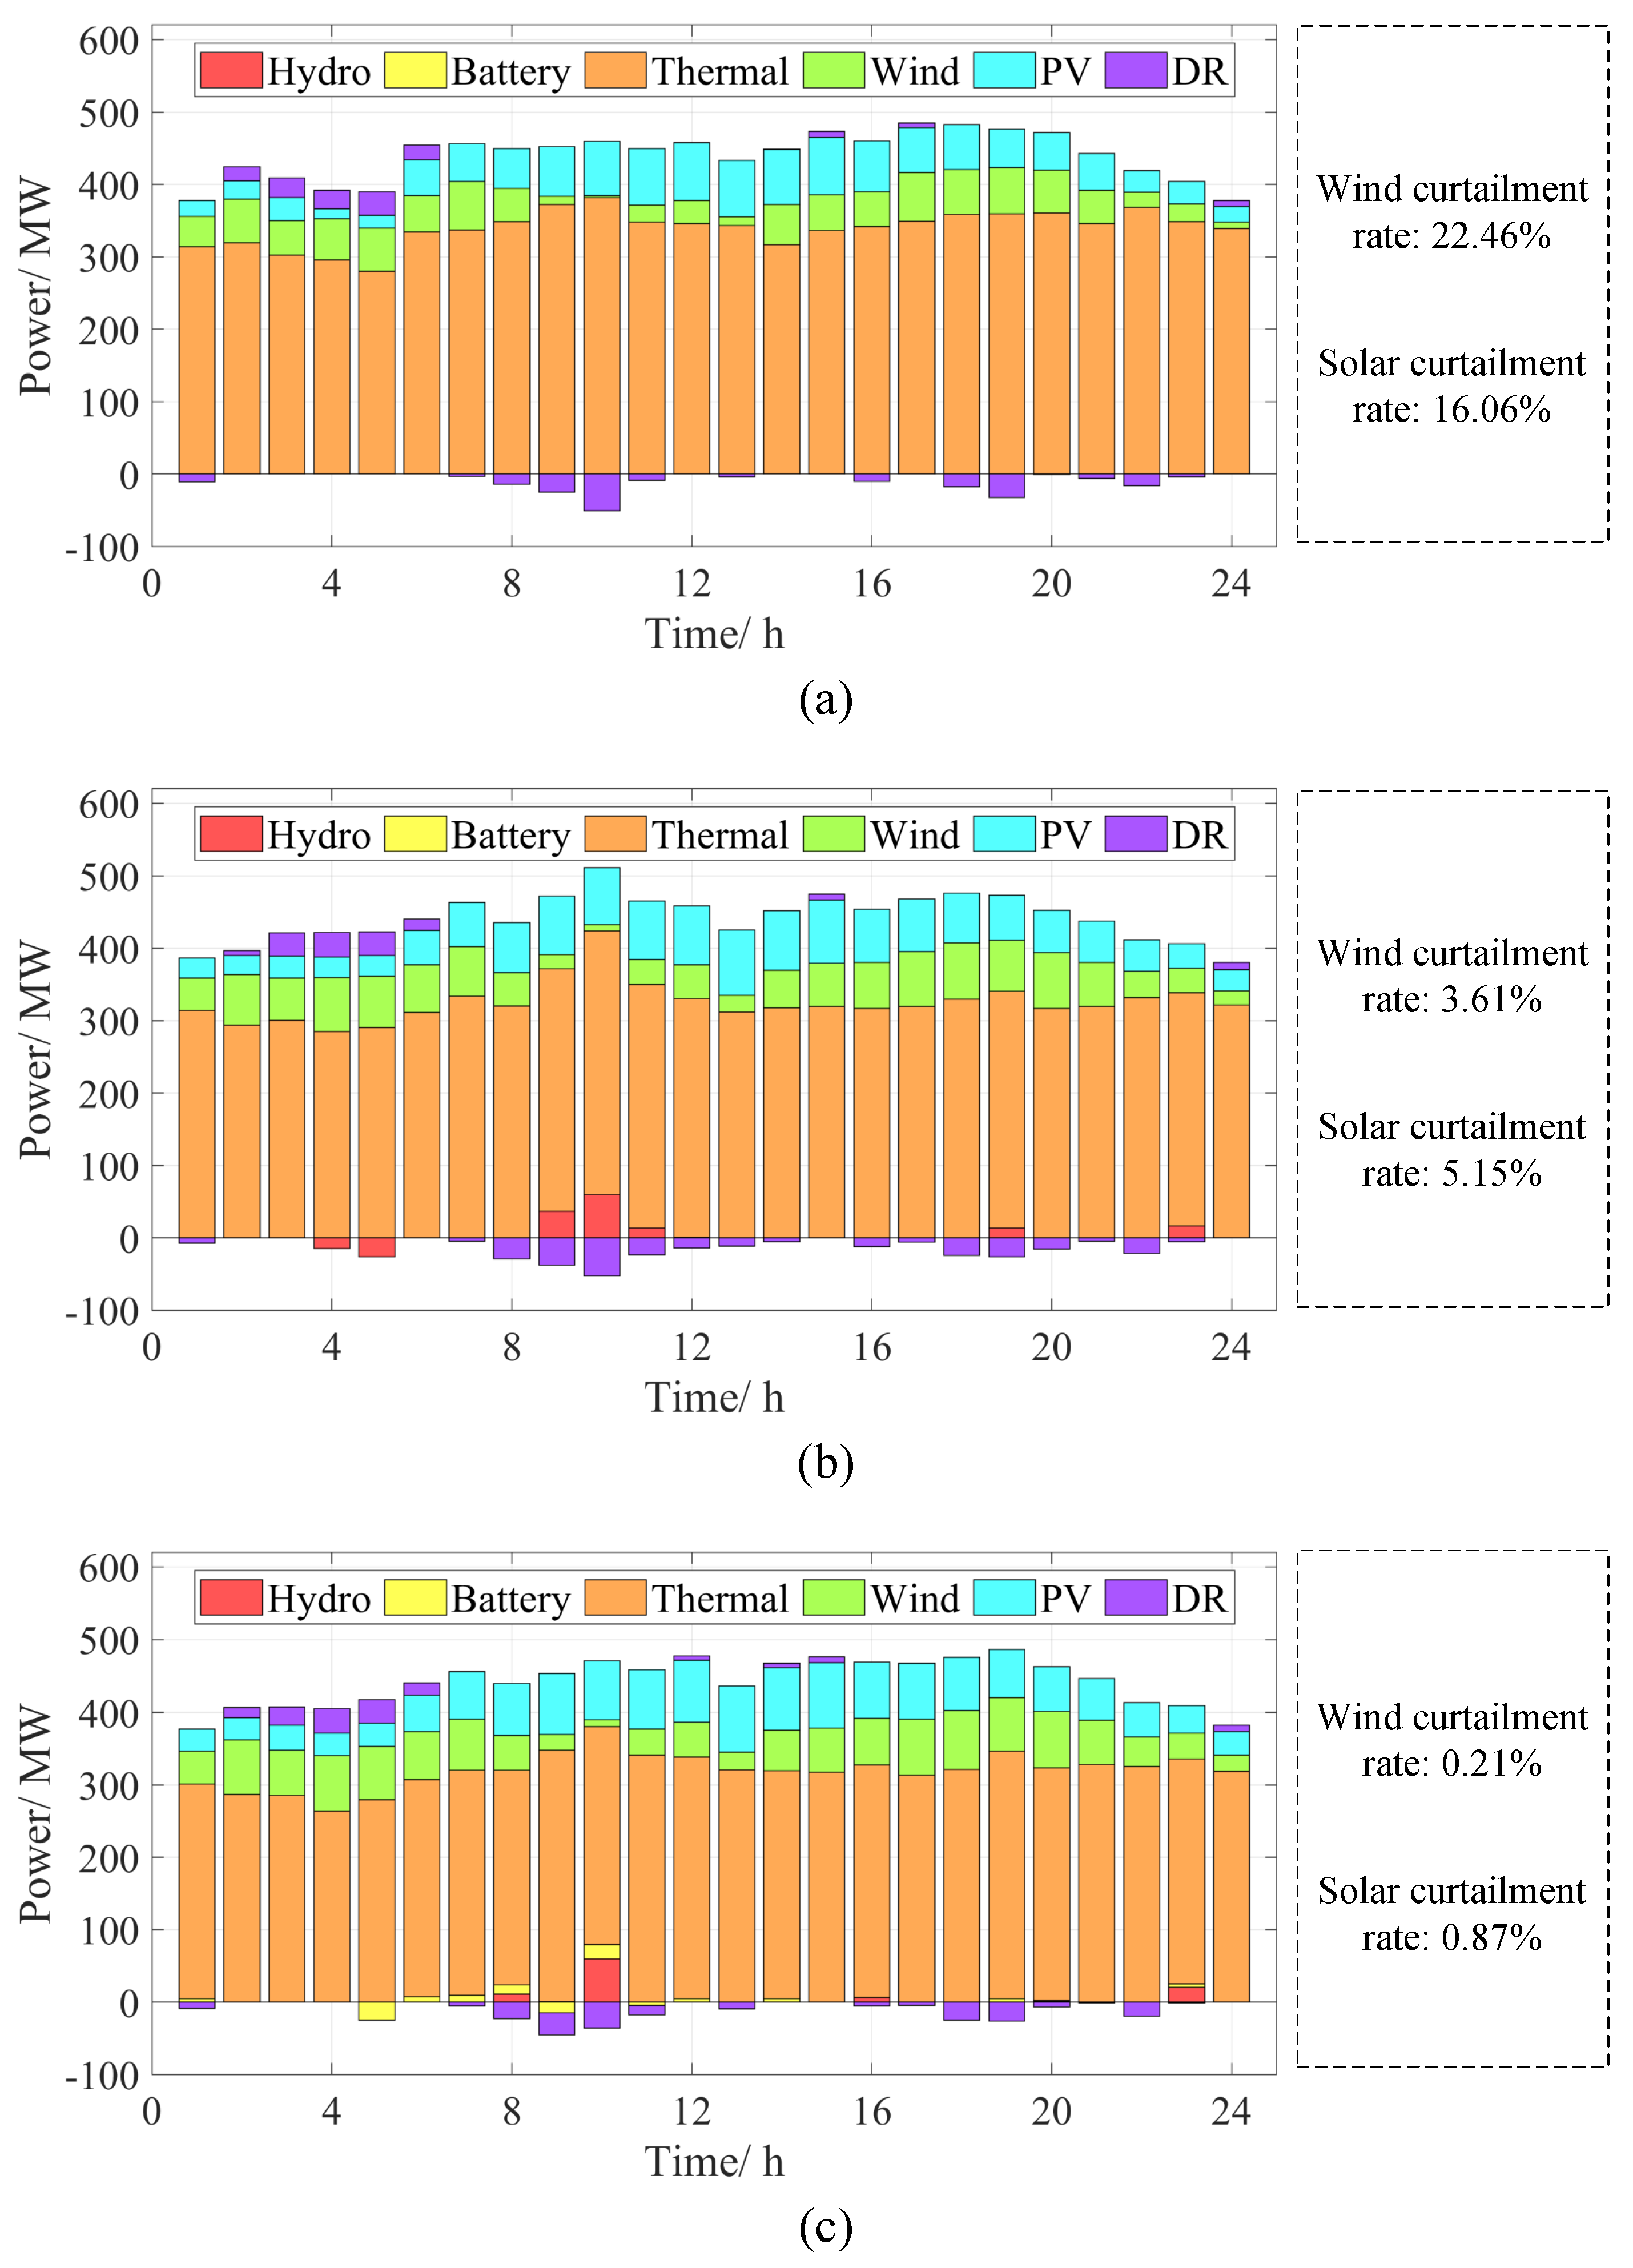
Figure 5 provides a comprehensive visualization of the outcomes resulting from the implementation of the proposed cloud–edge collaborative multi-timescale scheduling strategy under scenario 1. In panel (a), the effects of using DR alone are presented. This panel illustrates how DR initiatives modify demand patterns in response to dynamic system conditions. The initial application of DR shows its effectiveness in managing load variations by incentivizing users to shift or reduce their energy consumption. However, while DR contributes to load management, it does not fully resolve all operational challenges associated with energy supply and grid stability. Panel (b) expands on these results by showcasing the impact of integrating DR with pumped hydro storage. This combined approach leads to a significant reduction in the rates of wind and solar energy curtailment, decreasing them to below 3%. The integration of pumped hydro storage enables the system to capture and store excess renewable energy during peak generation periods. By releasing this stored energy during times of lower renewable output, pumped hydro storage smooths out fluctuations and enhances overall energy dispatch efficiency. This synergy effectively optimizes energy management over short to medium timescales, leveraging the strengths of both DR and pumped hydro storage. Additionally, the deployment of cloud computing for centralized data analysis, coupled with edge computing for localized decision-making, further refines the responsiveness and efficiency of the energy management process. Panel (c) illustrates the benefits of incorporating battery storage into the existing DR and pumped hydro storage framework. The addition of battery storage brings about a dramatic reduction in energy curtailment rates, reducing them to below 1%. Battery storage offers rapid charging and discharging capabilities, providing a high level of flexibility that complements both the DR and pumped hydro storage systems. This increased flexibility allows for finer adjustments in energy dispatch and storage, thereby significantly enhancing the overall effectiveness of the energy management strategy. The integration of battery storage alongside DR and pumped hydro storage demonstrates a holistic approach to minimizing energy curtailment and optimizing renewable energy utilization.
Figure 6 presents the results under scenario 2, which contrasts with scenario 1 depicted in Figure 5. Scenario 2 is characterized by wind power generation troughs during peak load periods, emphasizing the necessity of effective cloud–edge collaborative strategies. Panel (a) shows that using DR alone results in a wind and solar curtailment rate of approximately 20%, highlighting the challenges of balancing renewable energy supply and demand without additional storage integration. Panel (b) illustrates the integration of DR with pumped hydro storage, significantly reducing the curtailment rate to around 5% and enhancing operational flexibility over short to medium timescales. In panel (c), the addition of battery storage alongside DR and pumped hydro achieves a curtailment rate below 1%, showcasing the synergistic benefits of cloud–edge collaboration across multiple timescales. These results underscore the importance of leveraging advanced computational techniques at both centralized cloud platforms and distributed edge devices to optimize renewable energy utilization and grid stability. By harnessing the power of cloud–edge collaboration, energy systems can effectively mitigate curtailment challenges, enhance operational efficiency, and accelerate the transition towards sustainable energy futures.
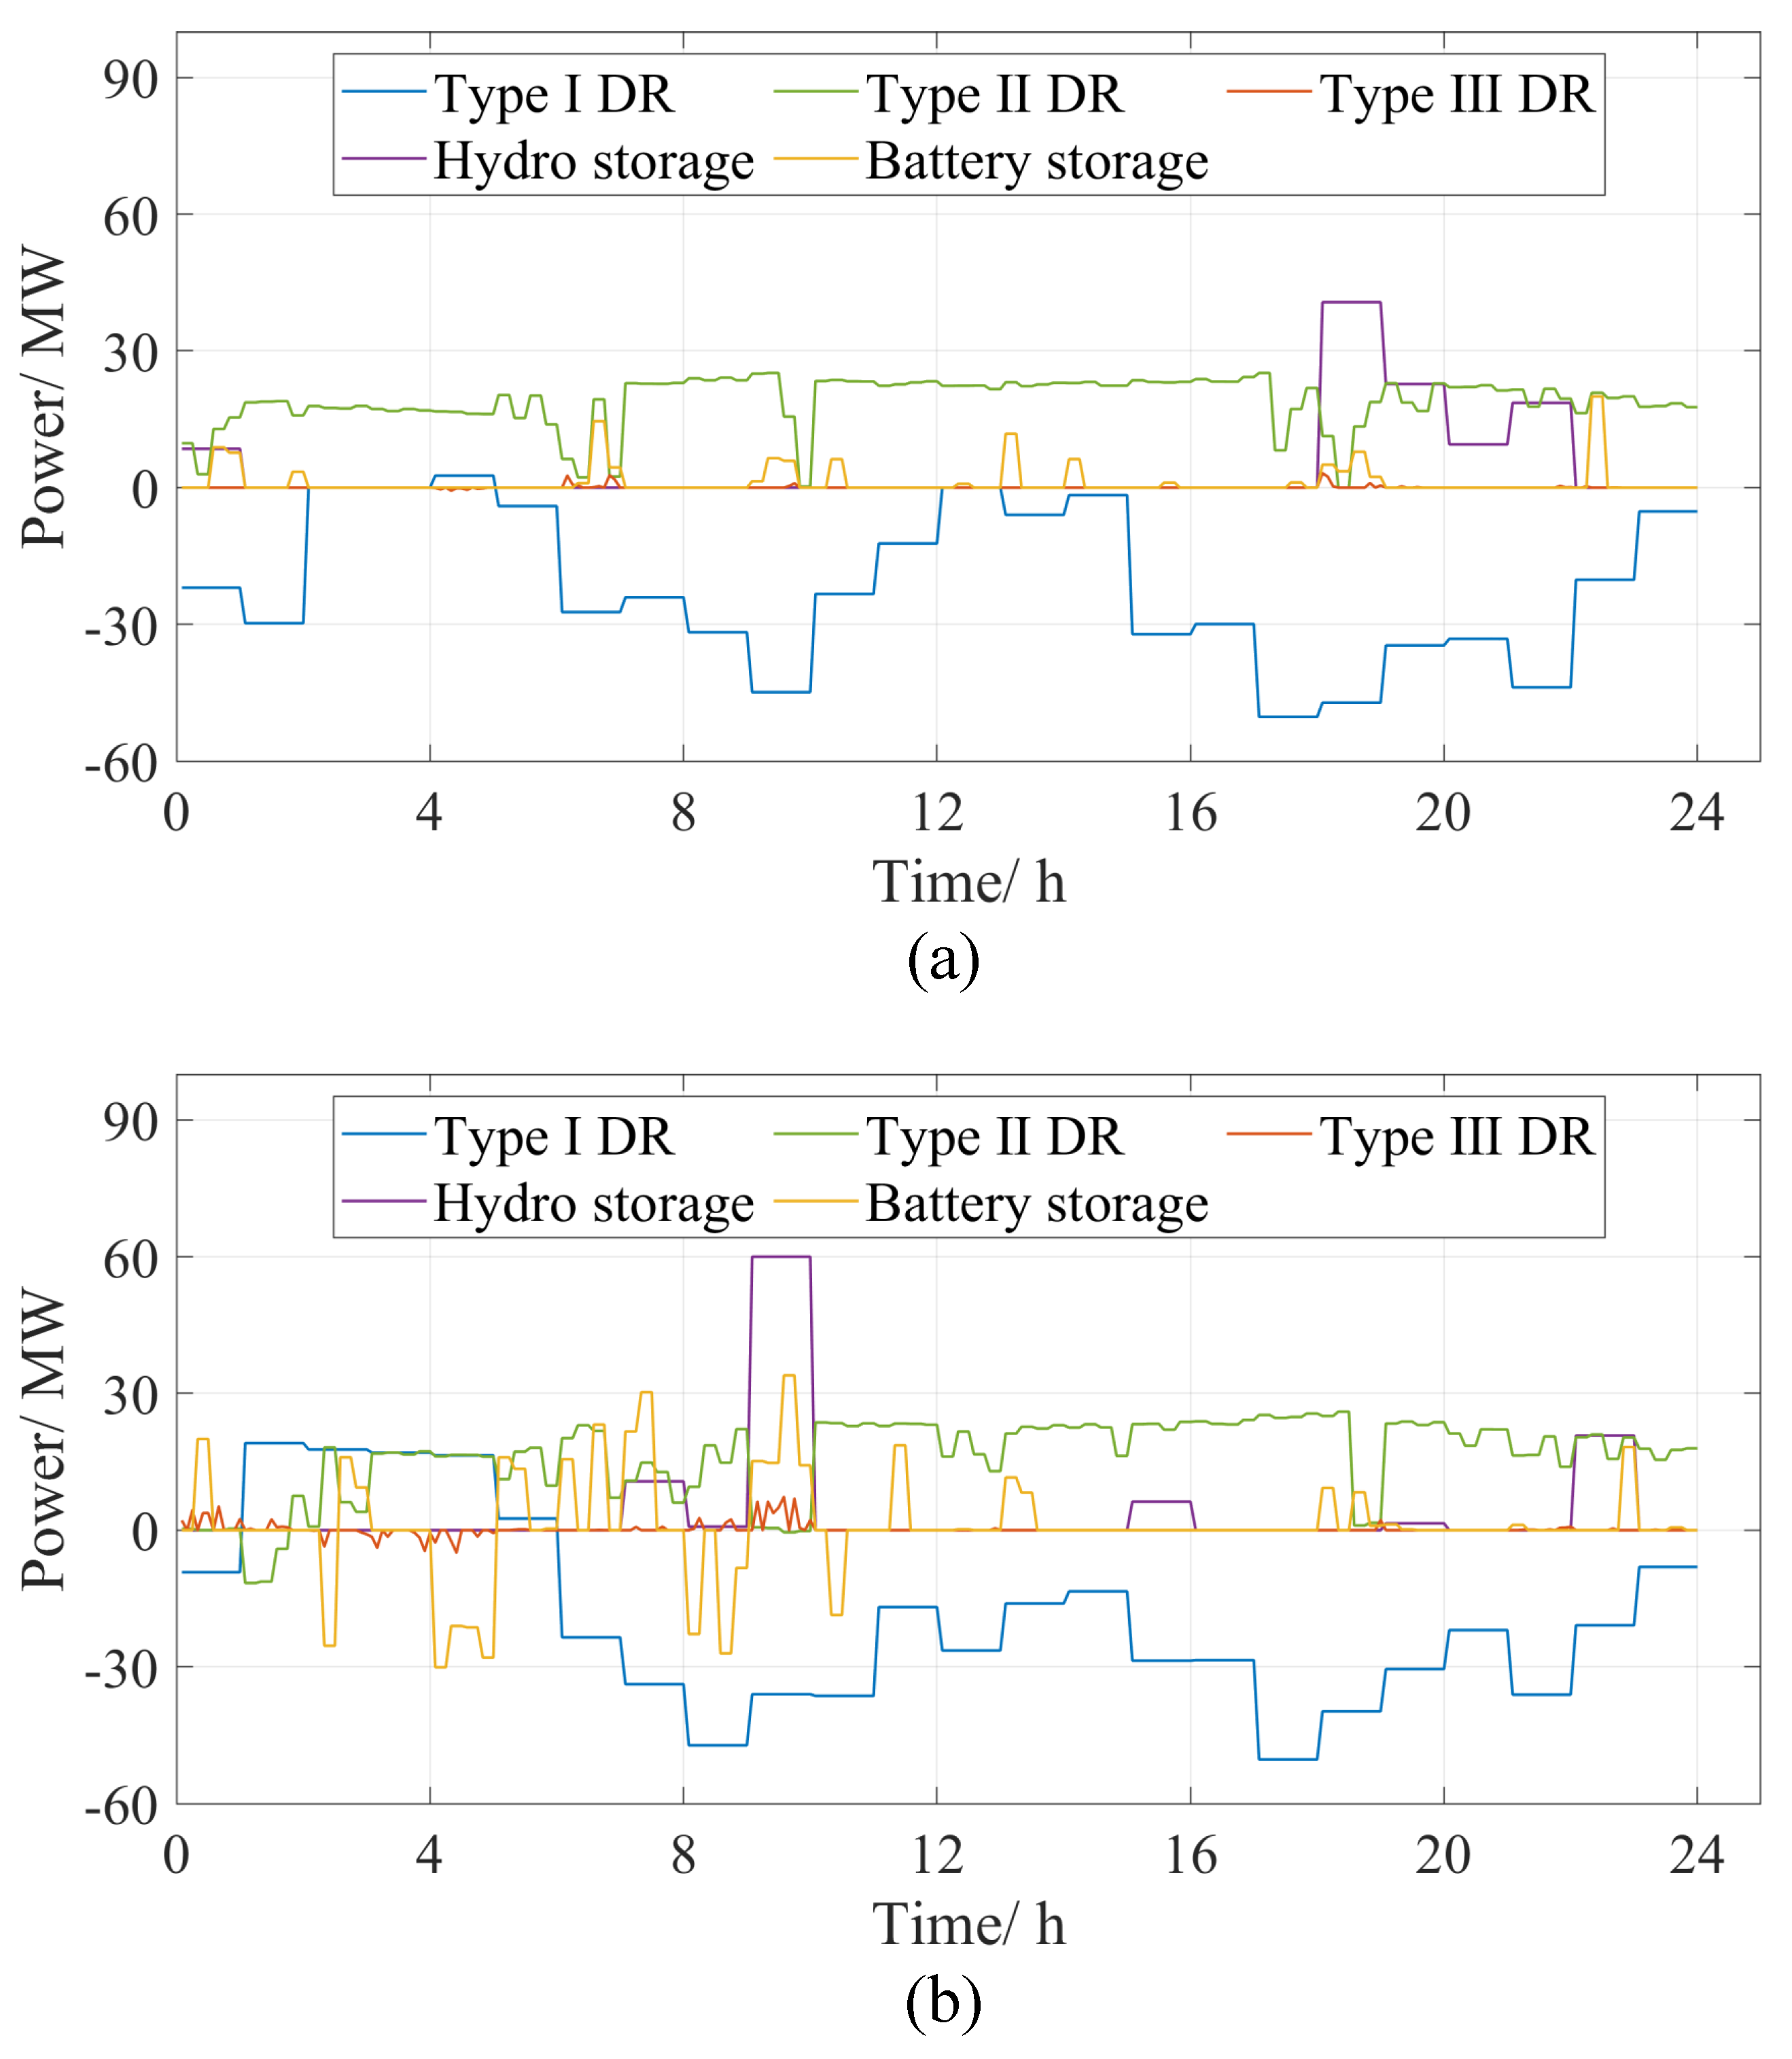
Figure 7 provides a detailed illustration of the charging and discharging profiles for three types of demand response strategies, Type I DR, Type II DR, and Type III DR, alongside two storage technologies, pumped hydro and battery. Pumped hydro storage operates over longer timescales with larger capacity adjustments, complementing the shorter timescales and smaller capacity adjustments of battery storage. Each technology leverages its strengths effectively: pumped hydro for substantial energy adjustments over extended periods and batteries for rapid response and precise adjustments over shorter intervals. Across the DR strategies, there is a clear progression from Type I DR, which features longer durations and higher discharge volumes, prominently active in panel (a), to Type III DR, with shorter durations and lower discharge volumes, more prevalent in panel (b). In panel (a) under scenario 1, battery utilization alongside all DR types is minimal. However, panel (b) under scenario 2 highlights increased variability in wind power during peak load periods, emphasizing the crucial role of flexible strategies in managing forecast errors and uncertainties. These findings underscore the strategic significance of cloud–edge collaboration in optimizing renewable energy utilization and strengthening grid stability, pivotal for advancing sustainable energy transitions.

5. Conclusions

Incorporating renewable energy sources into the grid presents significant challenges due to their inherent variability and uncertainty. This article proposes a cloud–edge collaborative scheduling strategy tailored for distributed multi-energy systems operating across various time scales. By integrating day-ahead dispatch, intra-day optimization, and real-time adjustments, the strategy aims to minimize operational costs, reduce the wastage of renewable energy, and enhance overall system reliability.
A key strength of the strategy lies in its consideration of the multi-timescale characteristics of two types of ESSs and three types of demand response DR, thereby optimizing resource allocation efficiently. Comparative simulation results underscore the substantial impacts of different ESS and DR types on system performance. Simulations demonstrate that integrating demand response with pumped hydro storage can reduce wind and solar curtailment rates to below 3%, while further incorporating battery storage alongside these technologies can achieve curtailment rates below 1%.
However, the proposed method does not account for the flexibility required to manage unexpected events or emergencies, which can affect system stability. Additionally, the approach assumes that energy storage and demand response resources will fully cooperate without considering real-world trading mechanisms or market interactions. Future research should focus on developing adaptive strategies to handle such contingencies and incorporating market-based trading dynamics to better align with practical scenarios and enhance system resilience.

Author Contributions

Conceptualization, Z.Y. and Z.Z.; methodology, Z.Y. and Z.Z.; software, F.Y. and P.G.; validation, Z.Y. and S.N.; formal analysis, Z.Y.; investigation, Z.Y.; resources, Z.Z.; data curation, F.Y. and H.L.; writing—original draft preparation, Z.Y.; writing—review and editing, Z.Y.; visualization, P.G.; supervision, F.Y.; project administration, F.Y. All authors have read and agreed to the published version of the manuscript.

Funding

This research was funded by the National Natural Science Foundation of China, grant number 52377104.

Data Availability Statement

The original contributions presented in the study are included in the article, further inquiries can be directed to the corresponding author.

Conflicts of Interest

Authors Zhilong Yin, Pan Gao and Haohao Li were employed by the Xi’an Dynamic Inspection and Testing Co., Ltd. Author Zhiyuan Zhou was employed by the Power Dispatch Control Center, State Grid Shaanxi Electric Power Co., Ltd. The remaining authors declare that the research was conducted in the absence of any commercial or financial relationships that could be construed as a potential conflict of interest.

Abbreviations

The following abbreviations are used in this manuscript:
ESSenergy storage system
DRdemand response
RESrenewable energy system

References

  1. Qazi, A.; Hussain, F.; Abd Rahim, N.; Hardaker, G.; Alghazzawi, D.; Shaban, K.; Haruna, K. Towards Sustainable Energy: A Systematic Review of Renewable Energy Sources, Technologies, and Public Opinions. IEEE Access 2019, 7, 63837–63851. [Google Scholar] [CrossRef]
  2. Renewables 2023. Available online: https://www.iea.org/reports/renewables-2023 (accessed on 13 May 2024).
  3. Li, J.; Fang, Z.; Wang, Q.; Zhang, M.; Li, Y.; Zhang, W. Optimal Operation with Dynamic Partitioning Strategy for Centralized Shared Energy Storage Station with Integration of Large-Scale Renewable Energy. J. Modern Power Syst. Clean Energy 2024, 12, 359–370. [Google Scholar] [CrossRef]
  4. Abomazid, A.M.; El-Taweel, N.A.; Farag, H.E.Z. Optimal Energy Management of Hydrogen Energy Facility Using Integrated Battery Energy Storage and Solar Photovoltaic Systems. IEEE Trans. Sustain. Energy 2024, 13, 1457–1468. [Google Scholar] [CrossRef]
  5. Chen, K.; Zhang, Z. In-Flight Wireless Charging: A Promising Application-Oriented Charging Technique for Drones. IEEE Ind. Electron. Mag. 2024, 18, 6–16. [Google Scholar] [CrossRef]
  6. Ruan, J.; Liang, G.; Zhao, J.; Lei, S.; He, B.; Qiu, J.; Dong, Z.Y. Graph Deep-Learning-Based Retail Dynamic Pricing for Demand Response. IEEE Trans. Smart Grid 2023, 14, 4385–4397. [Google Scholar] [CrossRef]
  7. Li, C.; Yan, Z.; Yao, Y.; Deng, Y.; Shao, C.; Zhang, Q. Coordinated Low-Carbon Dispatching on Source-Demand Side for Integrated Electricity-Gas System Based on Integrated Demand Response Exchange. IEEE Trans. Power Syst. 2024, 39, 1287–1303. [Google Scholar] [CrossRef]
  8. Azizi, A.; Jahromi, M.Z.; Dehghanian, P.; Chamorro, H.R.; Mírez, J.; Sood, V.K. Decentralized Multi-Objective Energy Management With Dynamic Power Electronic Converters and Demand Response Constraints. IEEE Access 2023, 11, 146297–146312. [Google Scholar] [CrossRef]
  9. Wang, S.; Jia, R.; Shi, X.; An, Y.; Huang, Q.; Guo, P.; Luo, C. Hybrid Time-Scale Optimal Scheduling Considering Multi-Energy Complementary Characteristic. IEEE Access 2021, 9, 94087–94098. [Google Scholar] [CrossRef]
  10. Ali, M.; Abdulgalil, M.A.; Habiballah, I.; Khalid, M. Optimal Scheduling of Isolated Microgrids with Hybrid Renewables and Energy Storage Systems Considering Demand Response. IEEE Access 2023, 9, 80266–80273. [Google Scholar] [CrossRef]
  11. Wu, H.; Shahidehpour, M.; Alabdulwahab, A.; Abusorrah, A. Demand Response Exchange in the Stochastic Day-Ahead Scheduling With Variable Renewable Generation. IEEE Trans. Sustain. Energy 2015, 6, 516–525. [Google Scholar] [CrossRef]
  12. Cui, Y.; Hu, Z.; Luo, H. Optimal Day-Ahead Charging and Frequency Reserve Scheduling of Electric Vehicles Considering the Regulation Signal Uncertainty. IEEE Trans. Ind. Appl. 2020, 56, 5824–5835. [Google Scholar] [CrossRef]
  13. Fujimoto, Y.; Inagaki, M.; Kaneko, A.; Minotsu, S.; Hayashi, Y. Day-Ahead Scheduling of Wind-Hydro Balancing Group Operation to Maximize Expected Revenue Considering Wind Power Output Uncertainty. IEEE Access 2023, 11, 119200–119218. [Google Scholar] [CrossRef]
  14. Shuai, H.; Fang, J.; Ai, X.; Tang, Y.; Wen, J.; He, H. Stochastic Optimization of Economic Dispatch for Microgrid Based on Approximate Dynamic Programming. IEEE Trans. Smart Grid 2019, 10, 2440–2452. [Google Scholar] [CrossRef]
  15. Li, X.; Wang, W.; Wang, H. Hybrid time-scale energy optimal scheduling strategy for integrated energy system with bilateral interaction with supply and demand. Appl. Energy 2021, 285, 116458. [Google Scholar] [CrossRef]
  16. Sharma, S.; Xu, Y.; Verma, A.; Panigrahi, B.K. Time-coordinated multienergy management of smart buildings under uncertainties. IEEE Trans. Ind. Inform. 2019, 15, 4788–4798. [Google Scholar] [CrossRef]
  17. Liu, W.; Li, P.; Yang, W.; Chung, C.Y. Optimal Energy Flow for Integrated Energy Systems Considering Gas Transients. IEEE Trans. Power Syst. 2019, 34, 5076–5079. [Google Scholar] [CrossRef]
  18. Pan, Z.; Guo, Q.; Sun, H. Interactions of district electricity and heating systems considering time-scale characteristics based on quasi-steady multi-energy flow. Appl. Energy 2016, 167, 230–243. [Google Scholar] [CrossRef]
  19. Fang, J.; Zeng, Q.; Ai, X.; Chen, Z.; Wen, J. Dynamic Optimal Energy Flow in the Integrated Natural Gas and Electrical Power Systems. IEEE Trans. Sustain. Energy 2018, 9, 188–198. [Google Scholar] [CrossRef]
  20. Dou, X.; Wang, J.; Wang, Z.; Li, L.; Bai, L.; Ren, S.; Gao, M. A Dispatching Method for Integrated Energy System Based on Dynamic Time-interval of Model Predictive Control. J. Modern Power Syst. Clean Energy 2020, 8, 841–852. [Google Scholar] [CrossRef]
  21. Sheng, H.; Wang, C.; Li, B.; Liang, J.; Yang, M.; Dong, Y. Multi-timescale Active Distribution Network Scheduling Considering Demand Response and User Comprehensive Satisfaction. IEEE Trans. Ind. Appl. 2021, 57, 1995–2005. [Google Scholar] [CrossRef]
  22. Yang, Y.; Yang, P.; Zhao, Z.; Lai, L.L. A Multi-Timescale Coordinated Optimization Framework for Economic Dispatch of Micro-Energy Grid Considering Prediction Error. IEEE Trans. Power Syst. 2024, 39, 3211–3226. [Google Scholar] [CrossRef]
  23. Sannigrahi, S.; Ghatak, S.R.; Acharjee, P. Multi-Scenario Based Bi-Level Coordinated Planning of Active Distribution System Under Uncertain Environment. IEEE Trans. Ind. Appl. 2020, 56, 850–863. [Google Scholar] [CrossRef]
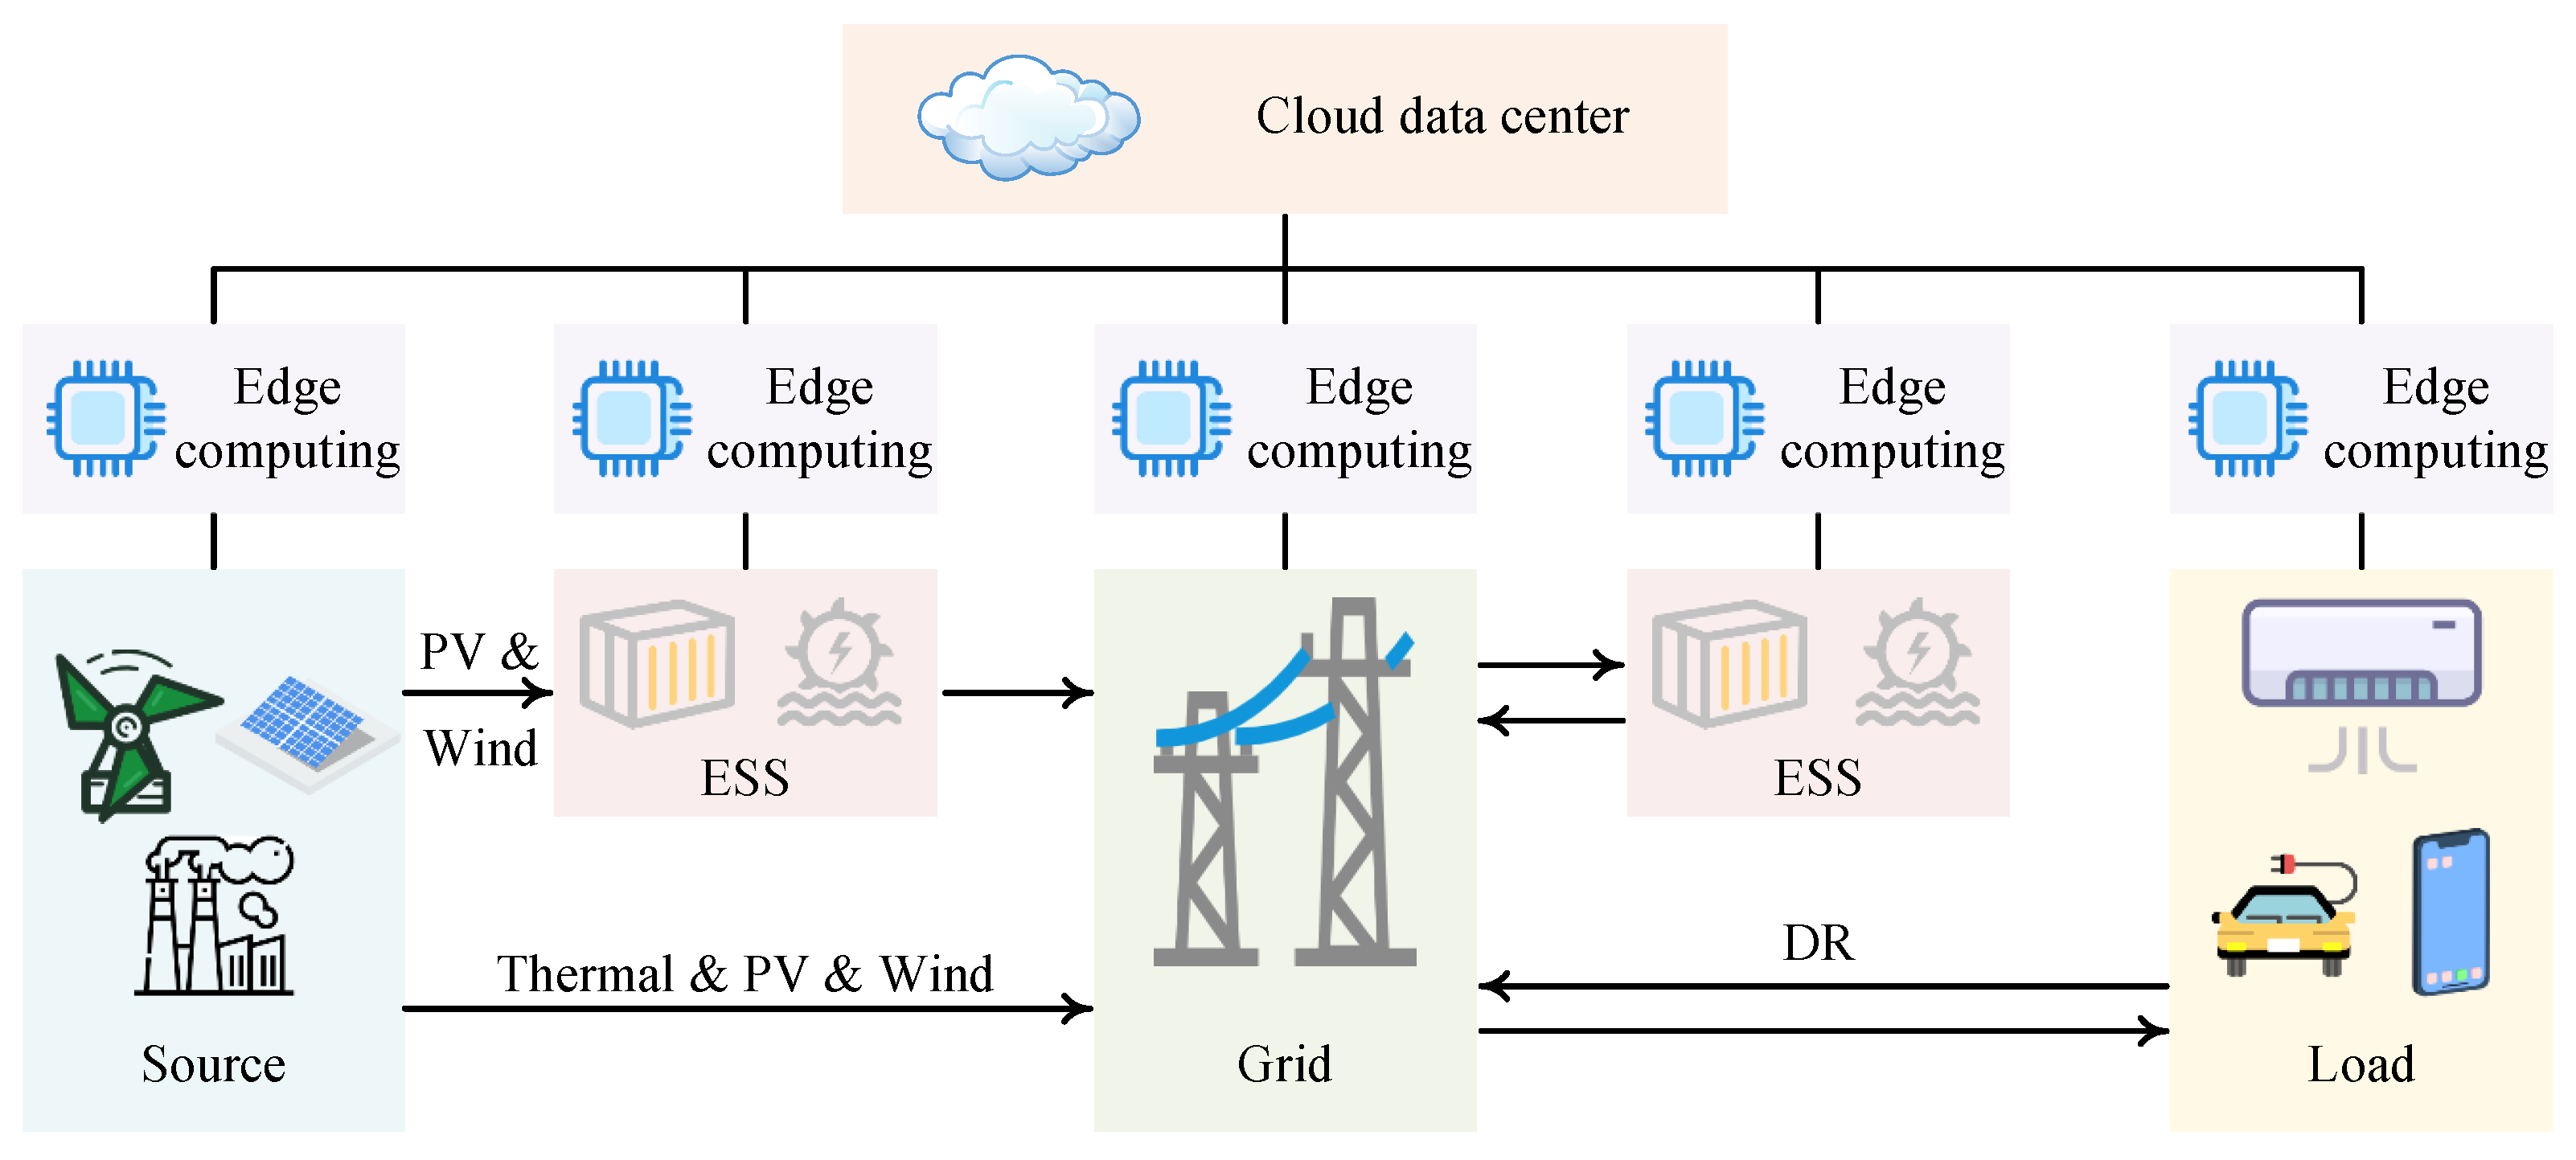
Figure 1. Schematic of a typical multi-energy system.
Energies 17 03764 g001
Figure 2. Flowchart of the proposed cloud–edge collaborative multi-timescale scheduling strategy.
Energies 17 03764 g002
Figure 3. Schematic representation of the distribution and connectivity of load, energy, and storage components in the distributed multi-energy system.
Energies 17 03764 g003
Figure 4. Predicted power of RESs and loads. (a) Power of loads. (b) PV power generation. (c) Wind power generation in scenario 1. (d) Wind power generation in scenario 2.
Energies 17 03764 g004aEnergies 17 03764 g004b
Figure 5. Scheduling results in scenario 1. (a) Case 1. (b) Case 2. (c) Case 3.
Energies 17 03764 g005
Figure 6. Scheduling results in scenario 2. (a) Case 1. (b) Case 2. (c) Case 3.
Energies 17 03764 g006
Figure 7. (a,b) DR and storage technology charging profiles during scheduling.
Energies 17 03764 g007
Table 1. Operational parameters of electrical power system components.
Power or StorageMaximum Power/MWMinimum Power/MWCapacity/(MW·H)Ramp Rate/(MW/min)
Thermal power 112040/1.2
Thermal power 28020/0.7
Thermal power 36015/0.6
Thermal power 46010/0.5
Thermal power 54515/0.45
Thermal power 64010/0.4
PV power2000/20
Wind power2000/20
Hydro storage100040040
Battery storage50020020
Table 2. Participation of battery storage, pumped hydro storage, and DR in each case study.
CaseBattery StorageHydro StorageDR
Case 1××
Case 2×
Case 3
Disclaimer/Publisher’s Note: The statements, opinions and data contained in all publications are solely those of the individual author(s) and contributor(s) and not of MDPI and/or the editor(s). MDPI and/or the editor(s) disclaim responsibility for any injury to people or property resulting from any ideas, methods, instructions or products referred to in the content.