Article

Research on Photovoltaic Power Generation Characteristics of Small Ocean Observation Unmanned Surface Vehicles

1
National Ocean Technology Center, Tianjin 300112, China
2
Key Laboratory of Ocean Observation Technology, Tianjin 300112, China
*
Author to whom correspondence should be addressed.
Energies 2024, 17(15), 3699; https://doi.org/10.3390/en17153699
Submission received: 24 June 2024 / Revised: 23 July 2024 / Accepted: 24 July 2024 / Published: 26 July 2024
(This article belongs to the Section E: Electric Vehicles)

Abstract

:
Under the action of waves, a small unmanned surface vehicle (USV) will experience continuous oscillation, significantly impacting its photovoltaic power generation system. This paper proposes a USV photovoltaic power generation simulation model, and the efficiency of photovoltaic MPPT control under wave action is studied. A simulation model for solar irradiance on solar panels of USV under wave action is established based on CFD and solar irradiation models. The dynamic changes in irradiance of USV solar panels under typical wave conditions are analyzed. The MPPT efficiency of USV photovoltaic power generation devices under continuously changing irradiance conditions is studied on this basis. The simulation research results indicate that waves and solar altitude angles significantly impact the instantaneous irradiation energy of USV photovoltaic devices. However, the impact of waves on the average irradiance is relatively tiny. The sustained oscillation of irradiance poses certain requirements for the Maximum Power Point Tracking (MPPT) control frequency of USV photovoltaic systems; a disturbance control frequency of no less than 50 Hz is proposed.

1. Introduction

Small unmanned surface vehicles (USVs) have received widespread attention in the field of ocean observation in recent years, such as using wave gliders, small sail unmanned vehicles, and small ocean observation solar-powered unmanned vehicles [1,2]. Under marine environmental conditions, the USVs will experience sustained shaking synchronized with wave periods, causing rapid changes in solar irradiance on the USV panels’ surface, significantly impacting USV energy capture and power generation processes. At present, research on small USVs mainly focuses on dynamic characteristic analysis [3,4,5], motion control [6,7], and application research [8,9]. Research on their solar power generation systems mainly refers to conventional onshore photovoltaic (PV) power generation devices. The operative mode of conventional photovoltaic power generation systems is relatively stable, and their photovoltaic modules are mostly fixed tilt angles [10]. Even for tracking solar power generation devices, the orientation and inclination of photovoltaic modules change very slowly with the movement of the sun [11,12].
Compared to the continuous changes in solar panels in cycles of several seconds under wave action, the working state of tracking solar devices belongs to a very stable category. In photovoltaic power generation systems, the theoretical model of solar panels is equivalent to a current source [13,14]. The output power of solar panels is influenced by various factors, including objective factors such as irradiance and environmental temperature [15], as well as factors for adjusting the operating points of solar panels [16,17]. Maximum power extraction from the PV system plays a critical role in increasing the efficiency of solar power generation. Therefore, a suitable maximum power point tracking (MPPT) technique to track the maximum power point (MPP) is of high need [18,19,20]. Several MPPT algorithms have been presented, and they were classified into four categories, i.e., classical, intelligent, optimal, and hybrid, depending on the tracking algorithm [21,22]. Many studies have been conducted comparing the performance of different algorithms. However, it has become difficult to adequately determine which method is most suitable for a given PV system [23,24,25]. New, improved algorithms are still being thoroughly studied. Three hybrid MPPT techniques have been proposed, including Water Cycle Optimization–Perturb and Observe (WCO-PO), Artificial Neural Network Supported Adaptable Stepped-Scaled Perturb and Observe (ANN-ASSPO), Grey Wolf Optimization-Modified Fast Terminal Sliding Mode Controller (GWO-MFTSMC), with the WCO-PO performing better when compared to other two hybrid MPPTs in terms of conversion efficiency and settling time [26]. A comparative research of seven widely adopted MPPT algorithms was carried out, and the results show that the best MPPT technique was the modified P&O for the highest efficiency in all situations considered [27]. Five different P&O MPPT algorithms were compared on both transient and steady-state performance, and it is suggested that MPPT algorithms must be evaluated according to more realistic operating conditions [28]. A modification variable step size P&O algorithm was implemented using fuzzy logic control to ameliorate the tracking speed and steady-state accuracy further [29]. By analyzing the output characteristics of a solar cell, an improved MPPT algorithm based on the neural network (NN) method was put forward to obtain the most accurate results within the shortest possible time span [30]. An adaptive control design in a photovoltaic system for MPPT was provided, and the simulation outcomes indicate that the presented controller exhibits excellent tracking characteristics [31]. A new hybrid MPPT technique based on the Genetic Algorithm (GA) and FOCV was proposed; the simulation results demonstrate that the proposed algorithm improves the efficiency of the conventional FOCV method by almost 3% [32]. An isolated PV system that utilizes a push–pull converter in conjunction with a fuzzy logic-based MPPT technique was investigated [33]. A new MPPT approach based on the combination of ANFIS and Terminal Robust Sliding Mode Control (ANFIS-TRSMC) was developed, for resisting the PV system against uncertain conditions and tracking the optimal power point [34]. An adjustable step-size Theta approach for photovoltaic system applications to extract the real MPP under various atmospheric conditions was studied, which significantly boosts the tracking performance and reduces power loss [35]. Because it is very simple and basic, the P&O method is still the most widely used MPPT algorithm [36,37,38].
The MPPT of a photovoltaic array is typically performed using a discrete-time control system, so the sampling time of an MPPT controller plays a crucial role in determining its transient performance [39]. The research on photovoltaic MPPT that has been carried out focuses on optimizing step-size determination and search methods to improve work efficiency and dynamic response characteristics, but more attention needs to be paid to the impact of MPPT control frequency. Due to the slow changes in irradiance on sunny and cloudy days, as well as the short duration of rapid fluctuations in irradiance caused by the passage of clouds, the annual power generation loss caused by these impacts is approximately 0.5% for a good MPPT. An effective tracking speed of 0.1% to 1% of the rated MPP voltage per second is considered sufficient [40]. The harmonic interaction between multiple multilevel PV inverters based on the well-known T-type neutral-point-clamped inverter (3L-TNPC) was researched, and the MPPT was based on the P&O algorithm, with a fixed-step voltage of 10 V and running at 20 Hz [41]. In a study on the impact of harmonic current compensation on the efficiency of MPPT, the P&O algorithm was analyzed, and the MPPT control frequency used in the algorithm was 5–20 Hz [42]. A Cuckoo search algorithm (CSA) combined with the Incremental conductance Algorithm (INC) was proposed, and the MPPT controller’s sampling time was set to 0.01 s [43]. To avoid the computational burden and drift effect, an enhanced P&O MPPT technique was presented, and the perturbation time was selected as 10 ms for the simulation analysis [44]. A reliable and effective PV emulator was developed for testing various MPPT techniques, and the MPPT sampling time was 0.01 s [45]. The P&O and IC MPPT algorithms were evaluated by an experimental PV testing system, and the perturbation frequency of the P&O algorithm was tested, with values of 1 Hz, 10 Hz, and 30 Hz, respectively [46]. An improved MPPT algorithm was compared with a conventional incremental conductance algorithm using simulation methods, and the sampling time for the MPPT controller was 0.05 s [47].
In this paper, a small long-endurance USV is developed. The solar radiation characteristics of USV photovoltaic devices in marine environments are analyzed, and the influence of sampling frequency on the efficiency of MPPT is studied.
The remainder of this paper is organized as follows. In Section 2, a detailed description of the long-endurance USV is presented. In Section 3, an instantaneous calculation model for photovoltaic power generation of USV is presented, and two measurement devices are built to verify the calculation method of irradiance on the inclined plane and photovoltaic power. Section 4 analyzes the representative relative position relationship between the sun and small USV solar panels, and a simulation study is conducted on the variation characteristics of solar irradiance on the surface of small USV solar panels. In Section 5, the influence of sampling frequency on MPPT efficiency is analyzed. Finally, conclusions are presented in Section 6.

2. Small Long-Endurance USV

The small long-endurance USV is mainly used for long-period observation of sea–air interface environmental elements, including sea surface wind speed, wind direction, air temperature, air pressure, sea surface temperature, and salinity. The designed speed of the USV is 2.0 kn, the maximum speed in still water is 4.0 kn, and the endurance is three months. It can work normally under third-level sea conditions. The USV mainly comprises the main structure, PV power supply unit, drive unit, control unit, observation unit, and communication unit, as shown in Figure 1.
The main structure is divided into two parts, the hull and the auxiliary body, and a vertical separation design scheme for the hull and auxiliary body is adopted. The USV is 3.2 m long, 0.9 m high, 0.65 m wide, made of fiberglass, stainless steel, and aluminum alloy, with a total weight of about 81 kg, and the overall center of gravity is located 0.15 m below the design water plane. The PV power supply unit includes two 100 W solar panels, a charge and discharge controller, and a lithium battery pack. The drive unit comprises a propeller, motor driver, and steering gear. The control unit is based on the STM32 chip control system, which processes the observation data of the USV’s state information and controls the operation of the USV. The observation unit includes a sea temperature and salt depth sensor, and other external equipment interfaces are reserved. The communication unit includes satellite communication and a wireless communication module.

3. Simulation Model of USV PV System

3.1. Irradiance Calculation Model

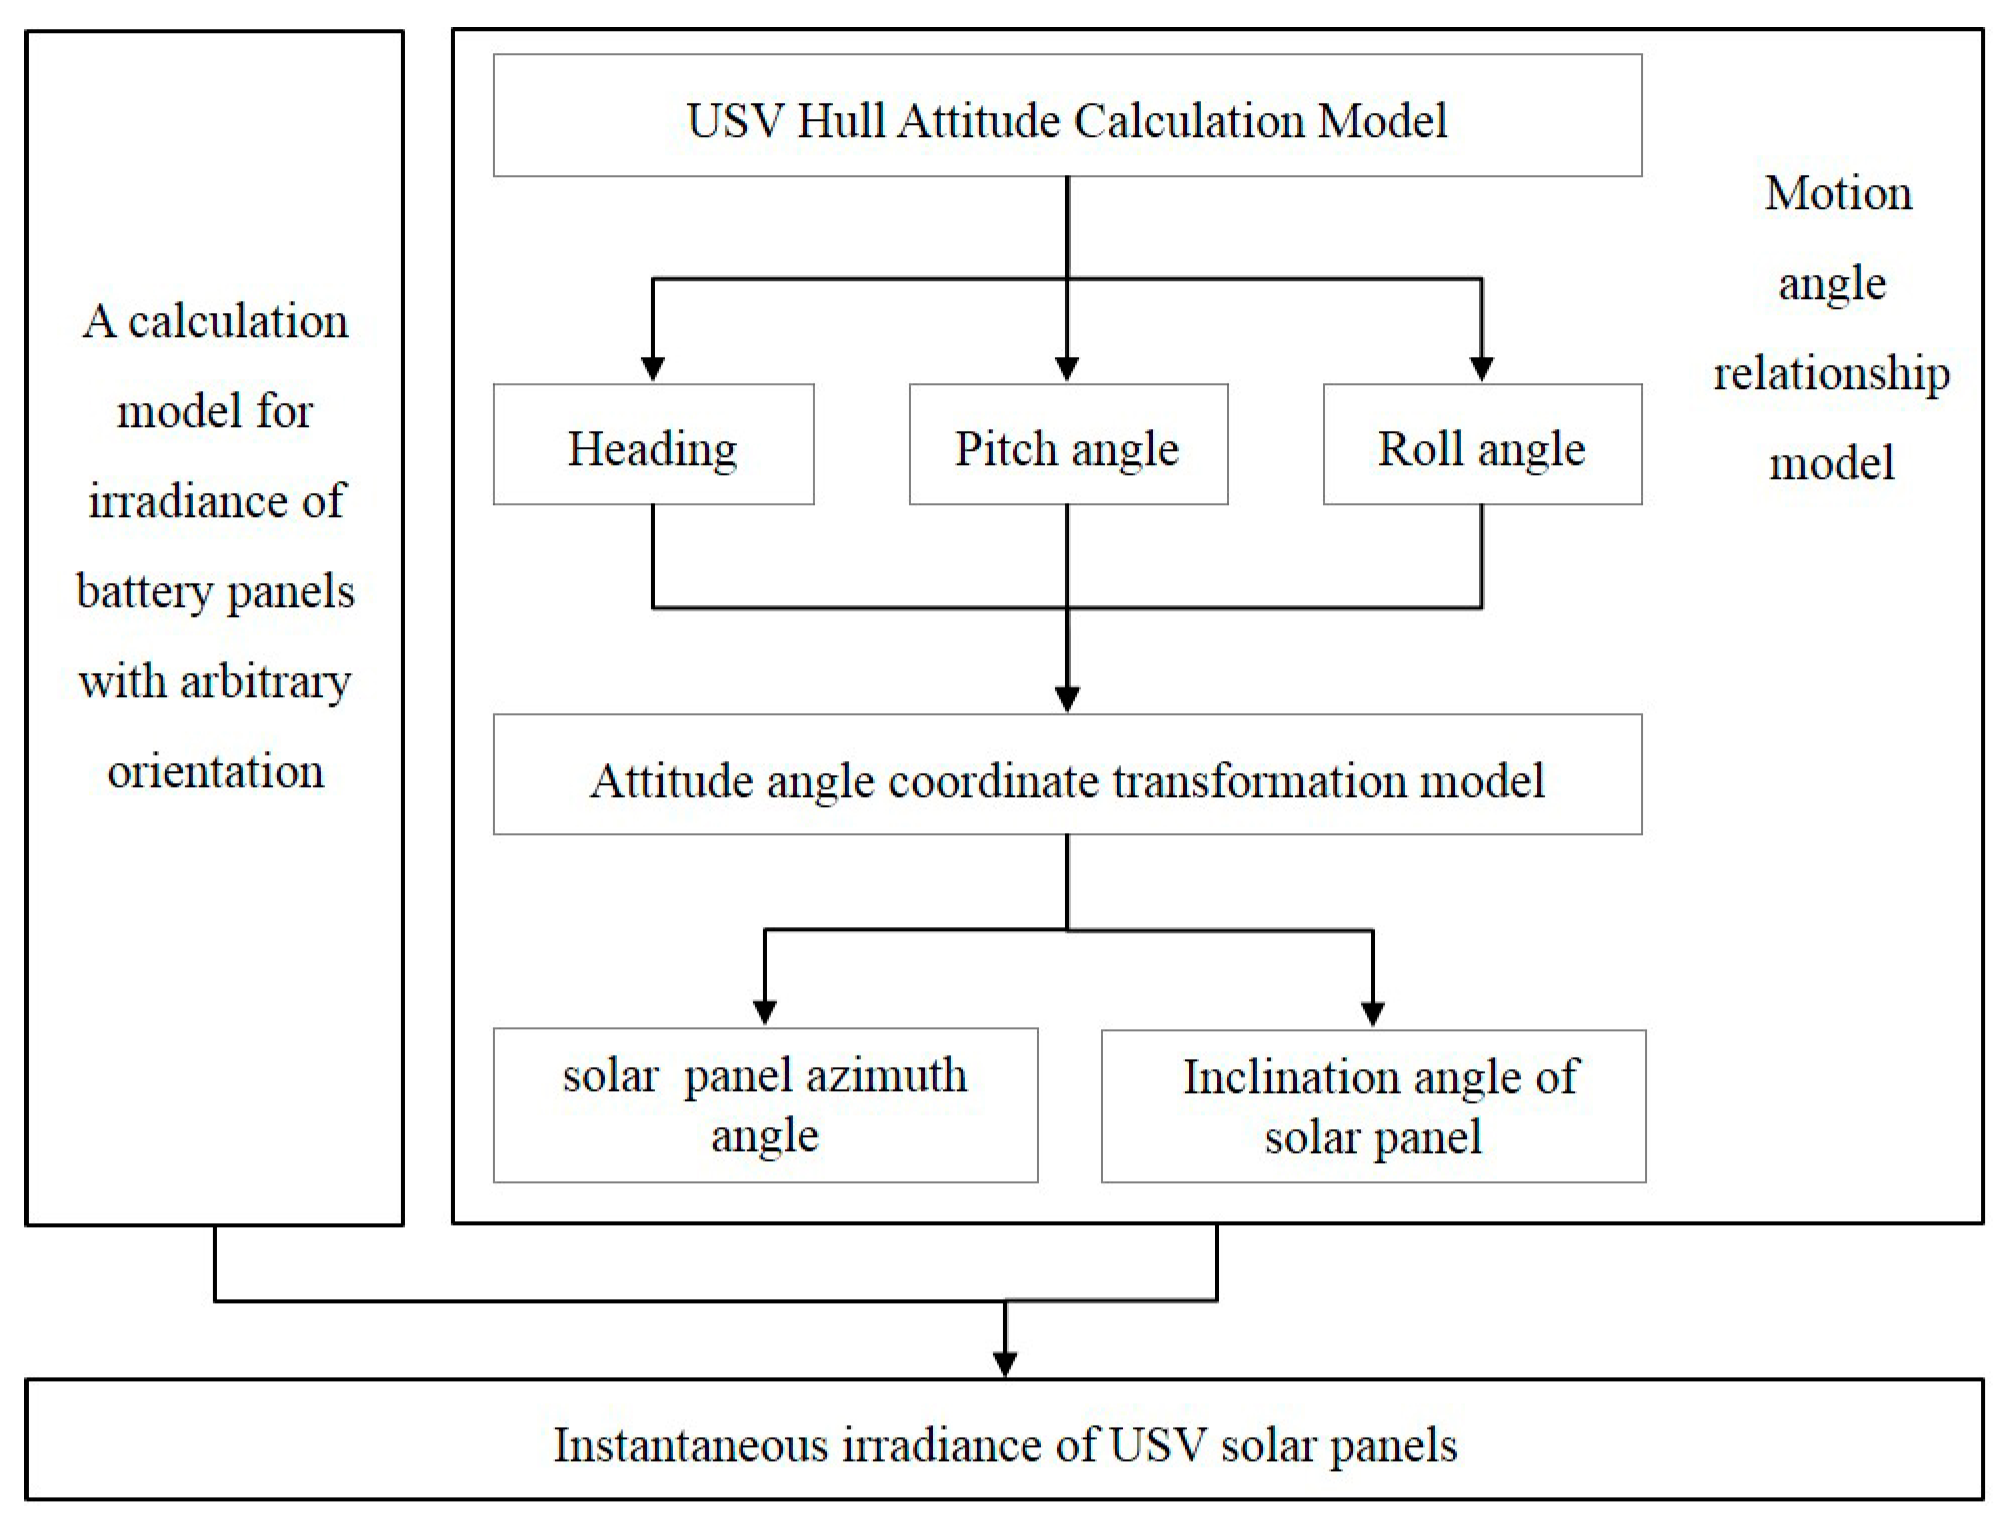
The hull heading, pitch angle, and roll angle determine the orientation and tilt angle of the small USV solar panels. The irradiance calculation model of a small USV solar device includes two parts: the irradiance calculation model of the panel under any azimuth and inclination conditions, and the conversion model of the azimuth inclination and the pitch angle of the USV, the roll angle, and the course. The calculation model is shown in Figure 2.
The arbitrary orientation panel irradiance calculation model is used to calculate the surface solar irradiance of small USV solar panels at any orientation and inclination. The input parameters of the model are the instantaneous azimuth and inclination angle of the USV solar panel, and the output is the instantaneous solar irradiance of the panel surface. The conversion model between azimuth angle and pitch angle, and roll angle and course angle includes the USV attitude calculation model and attitude angle coordinate conversion model. The USV attitude calculation model is used to calculate the instantaneous course angle, pitch angle, and roll angle of USV under the conditions of any given USV course, speed, wave direction, and wave condition. The attitude angle coordinate conversion model is used to convert the instantaneous heading angle, pitch angle, and roll angle of USV into the instantaneous azimuth angle and inclination angle of solar panels, and provide input parameters for the irradiance calculation model of arbitrary orientation panels.

3.1.1. Irradiance Calculation Model of Arbitrary Orientation Panel

During offshore operations, the solar panels of a small USV may exhibit arbitrary orientation and inclination changes. Based on the Liu–Jordan model, a calculation model of solar irradiance on the surface of small USV solar panels is established on the assumption that the solar scattering radiation in the sea surface atmosphere is isotropic and the physical properties of the scattering quantities in different directions are the same. The solar radiation toward the surface of the solar panel is composed of three parts: direct radiation Itb, reflected radiation Itr, and scattered radiation Itd [48,49]. The formula for calculating the total irradiance It of the surface of the solar panel is as follows:
I t = I tb + I td + I tr = R b I b + I d 2 1 + cos β + ρ 2 I 1 cos β
where Itb is the direct irradiance of the solar panel surface, W/m2; Itd is the scattered irradiance of the solar panel surface, W/m2; Itr is the reflected irradiance of the solar panel surface, W/m2; and Rb is a radiation factor. Ib is horizontal direct irradiance, W/m2; Id is horizontal scattered irradiance, W/m2; I is the total irradiance of the horizontal plane, W/m2; ρ is the reflection factor, deg. β is the solar panel inclination, and deg. Rb is the ratio of Itb and Ib, and the formula is as follows:
R b = I tb I b = cos γ sin β cos h ° cos A + sin γ sin β cos h ° sin A + cos β sin h ° sin φ sin δ + cos φ cos δ cos ω
where γ is the solar panel azimuth angle, deg; h° is the altitude angle of the sun, deg; A is the sun’s azimuth, deg; φ is the latitude of the measurement site, deg; δ is the declination angle of the sun on the observed day, deg; ω time angle, ω = ±15°z, z is the time from noon, deg. The formula for calculating the sun’s altitude angle and azimuth angle is as follows:
sin h ° = sin δ sin φ + cos δ cos φ cos ω
cos A = sin h ° sin φ sin δ / cos h ° cos φ

3.1.2. USV Attitude Calculation Model

Based on the potential flow theory, assuming that the fluid is irrotational and an incompressible ideal fluid without considering viscosity, the motion response equation of the USV under the action of waves can be expressed as follows [50]:
M + Δ M u ¨ i + C u u ˙ i + K u u i = F c t + F w t + F b t + G
J + Δ J R ¨ i + C R R ˙ i + K R R i = T c t + T w t + T b t
where M is the mass of USV, kg; ΔM is the additional mass of USV, kg; ui is the displacement along the coordinate axis of USV, i is x, y, or z, respectively, m; Cu is translational motion damping, N·s/m; Ku is translational motion damping stiffness, N/m; G is the gravity of USV, N; Fc is the resistance around the flow, N; Fw indicates wave force, N; Fb is the buoyancy force of USV, N; where J is the moment of inertia, N·m; ΔJ is the additional moment of inertia, N·m; R is the motion variable of USV, i is x, y, or z, respectively, rad; CR is rotational motion damping, N·m·s/rad; KR is rotational motion damping stiffness, N·m/rad; Tc is flow resistance moment, N·m; Tw is wave action moment, N·m; Tb is the buoyancy moment of USV, N·m.
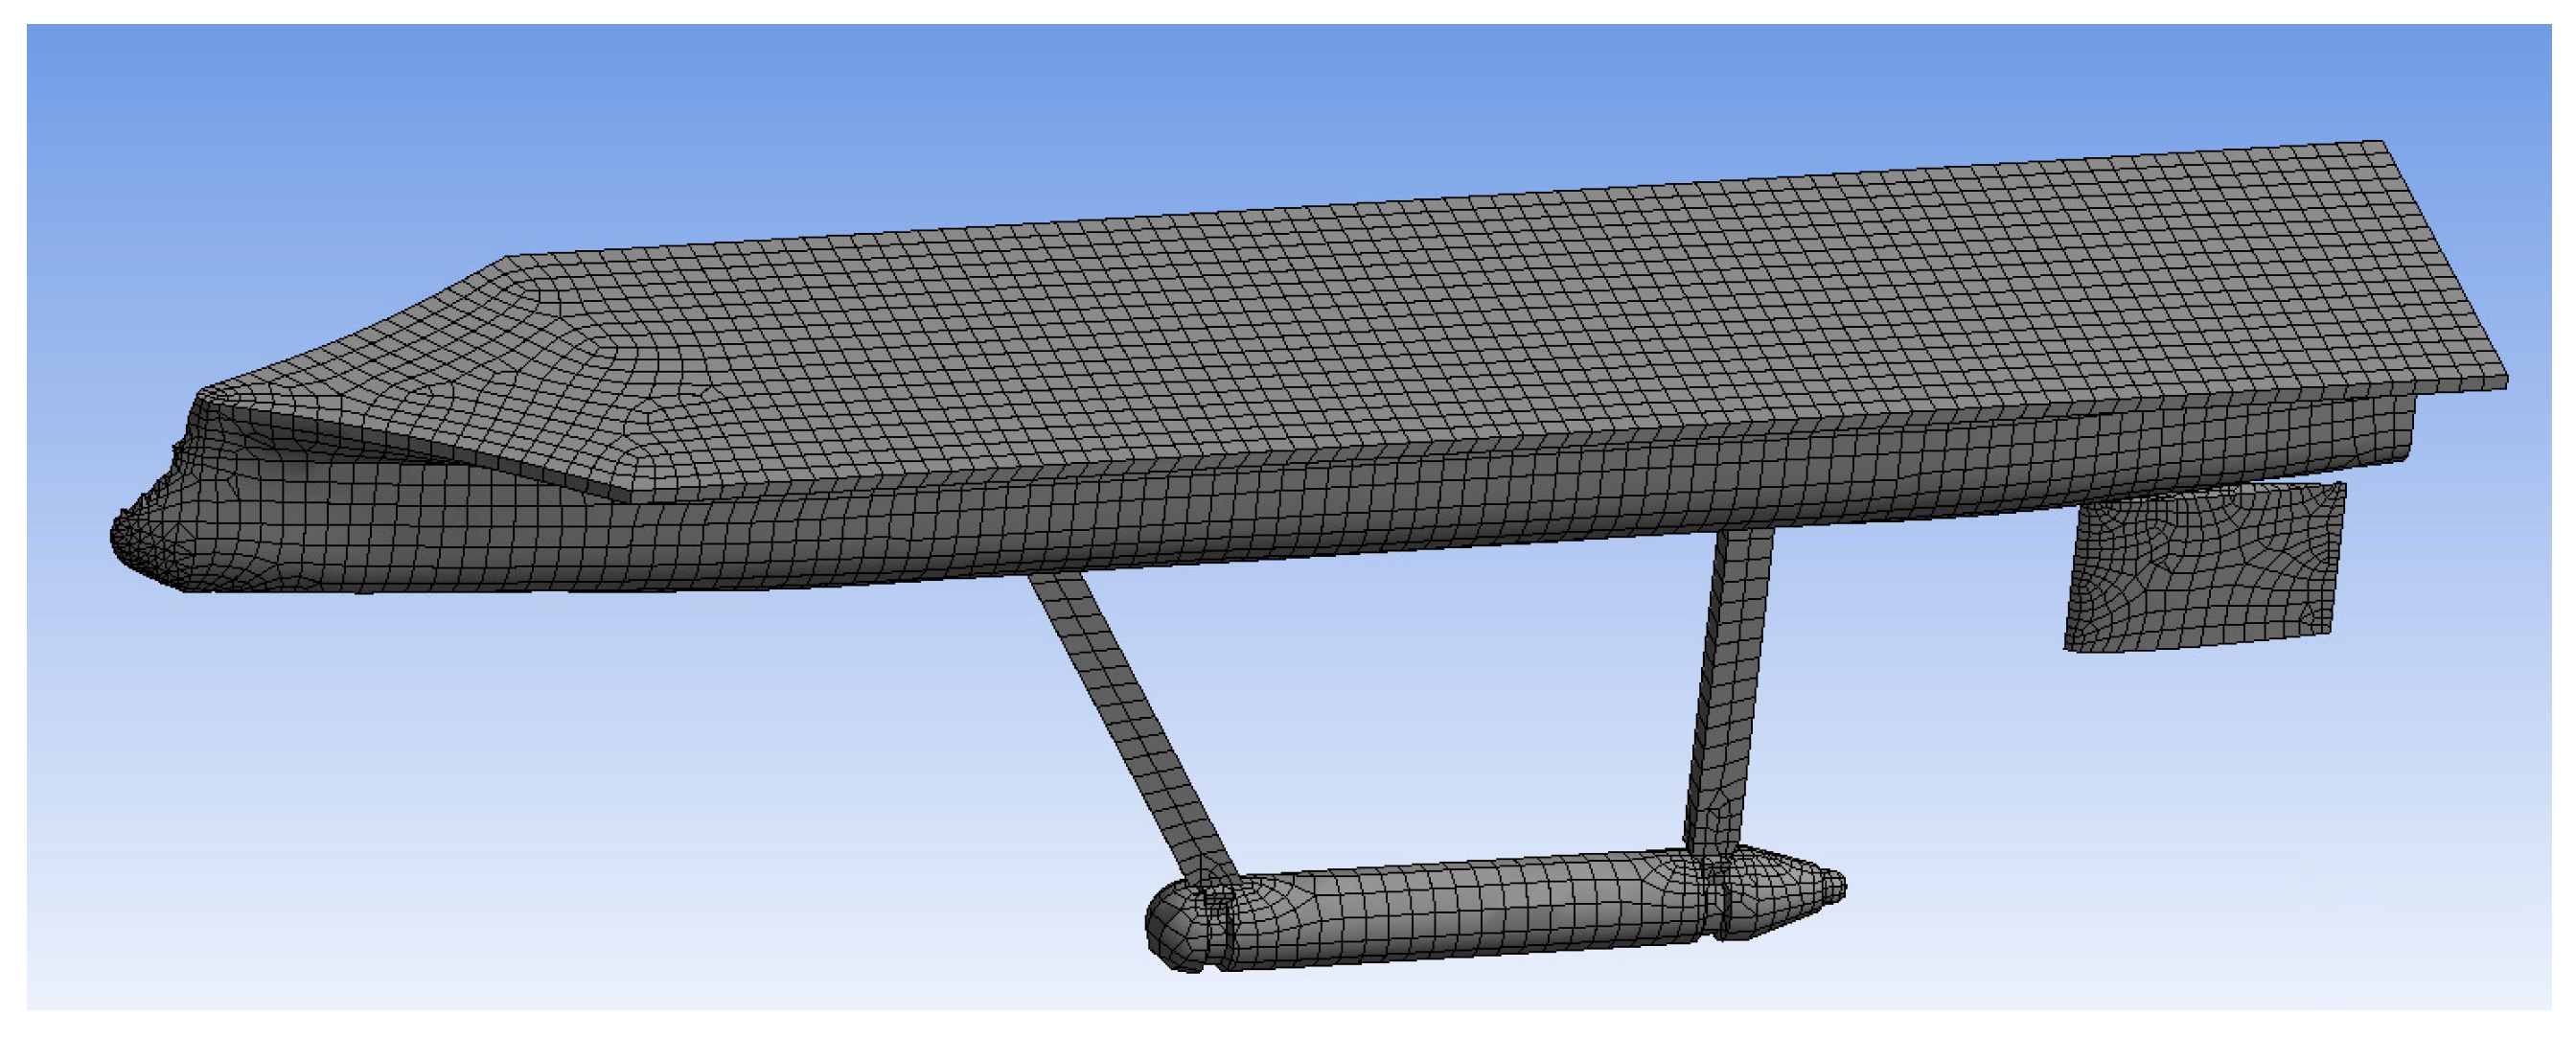
Based on calculation software, the motion response model of a vehicle under wave excitation is established [51]. In the simulation process, the Response Amplitude Operator (RAO) is calculated first, and then the dynamic response of the USV attitude angle in the time domain is calculated. The water depth condition of the calculation model is set as 1000 m according to the deep-water condition. The density of seawater is 1025 kg/m3. The grid of the USV is divided into surface grids. The size of the grid elements is between 0.005 and 0.04 m. The total number of junction points is 7183, the total number of elements is 7646, and the number of diffraction nodes is 4528, as shown in Figure 3.

3.1.3. Attitude Angle Coordinate Transformation Model

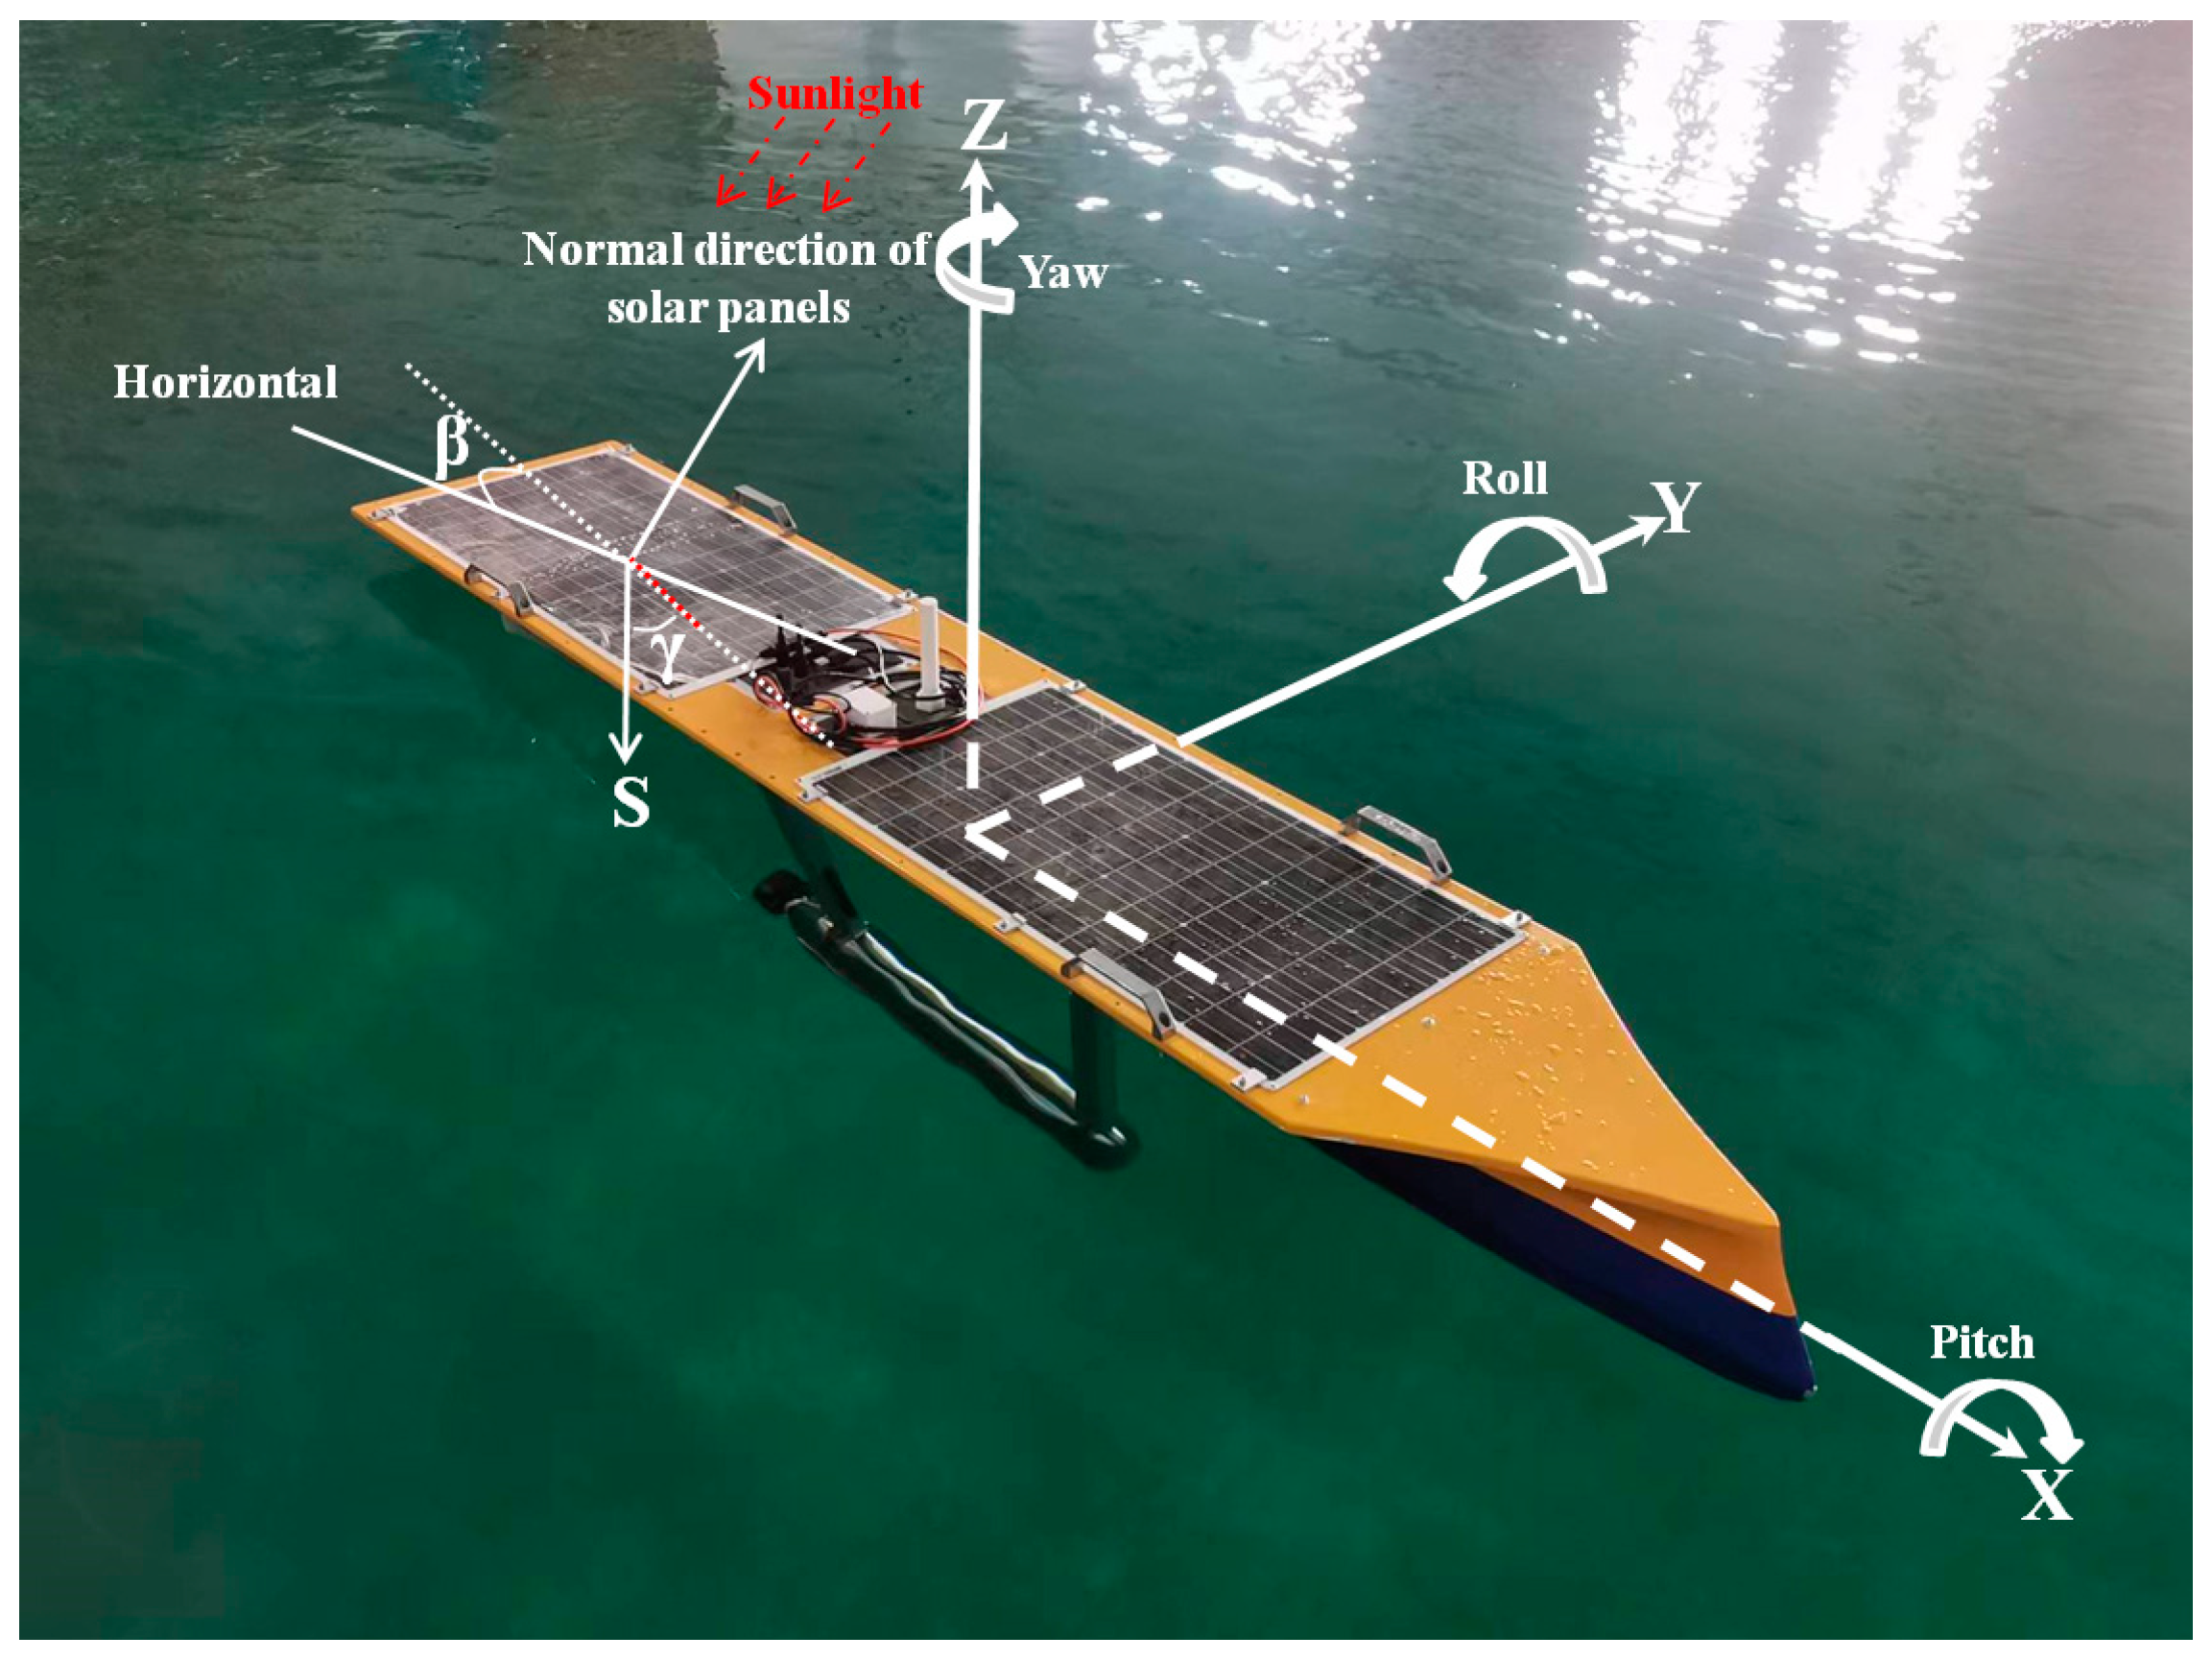
The ship coordinate system is established, taking the center of the ship’s weight as the coordinate origin, the forward direction is the horizontal X axis forward, the perpendicular to the surface of the ship’s body is the Z axis forward, and the left side of the ship’s body is the Y axis forward. The roll angle is the change in angle of the USV around the X axis, the pitch angle is the change in angle of the USV around the Y axis during the movement, and the yaw angle is the swing of the USV around the Z axis. The angle between the projection of the solar panel regular on the horizontal plane and the direction of due South is azimuth angle γ, positive to the west, negative to the east, and the value range is −180° to 180°. The angle between the plane where the solar panel is located and the horizontal plane is inclination β, which is only positive and ranges from 0° to 90°, as shown in Figure 4.
Based on the principle of coordinate conversion, the transformation relationship between the azimuth angle and inclination angle of the small USV solar panel and the USV heading, roll angle, and pitch angle is established. The formulas of the azimuth angle γ and inclination angle β of the solar panel are as follows:
tan γ = cos R x sin R y sin R z + cos R z sin R x sin R x sin R z cos R x cos R z sin R y
cos β = cos R x cos R y
where Rx is the roll angle of the solar panel, deg; Ry is the pitch angle of the solar panel, deg; and Rz is the yaw angle of the solar panel, deg.

3.1.4. Computational Model Verification

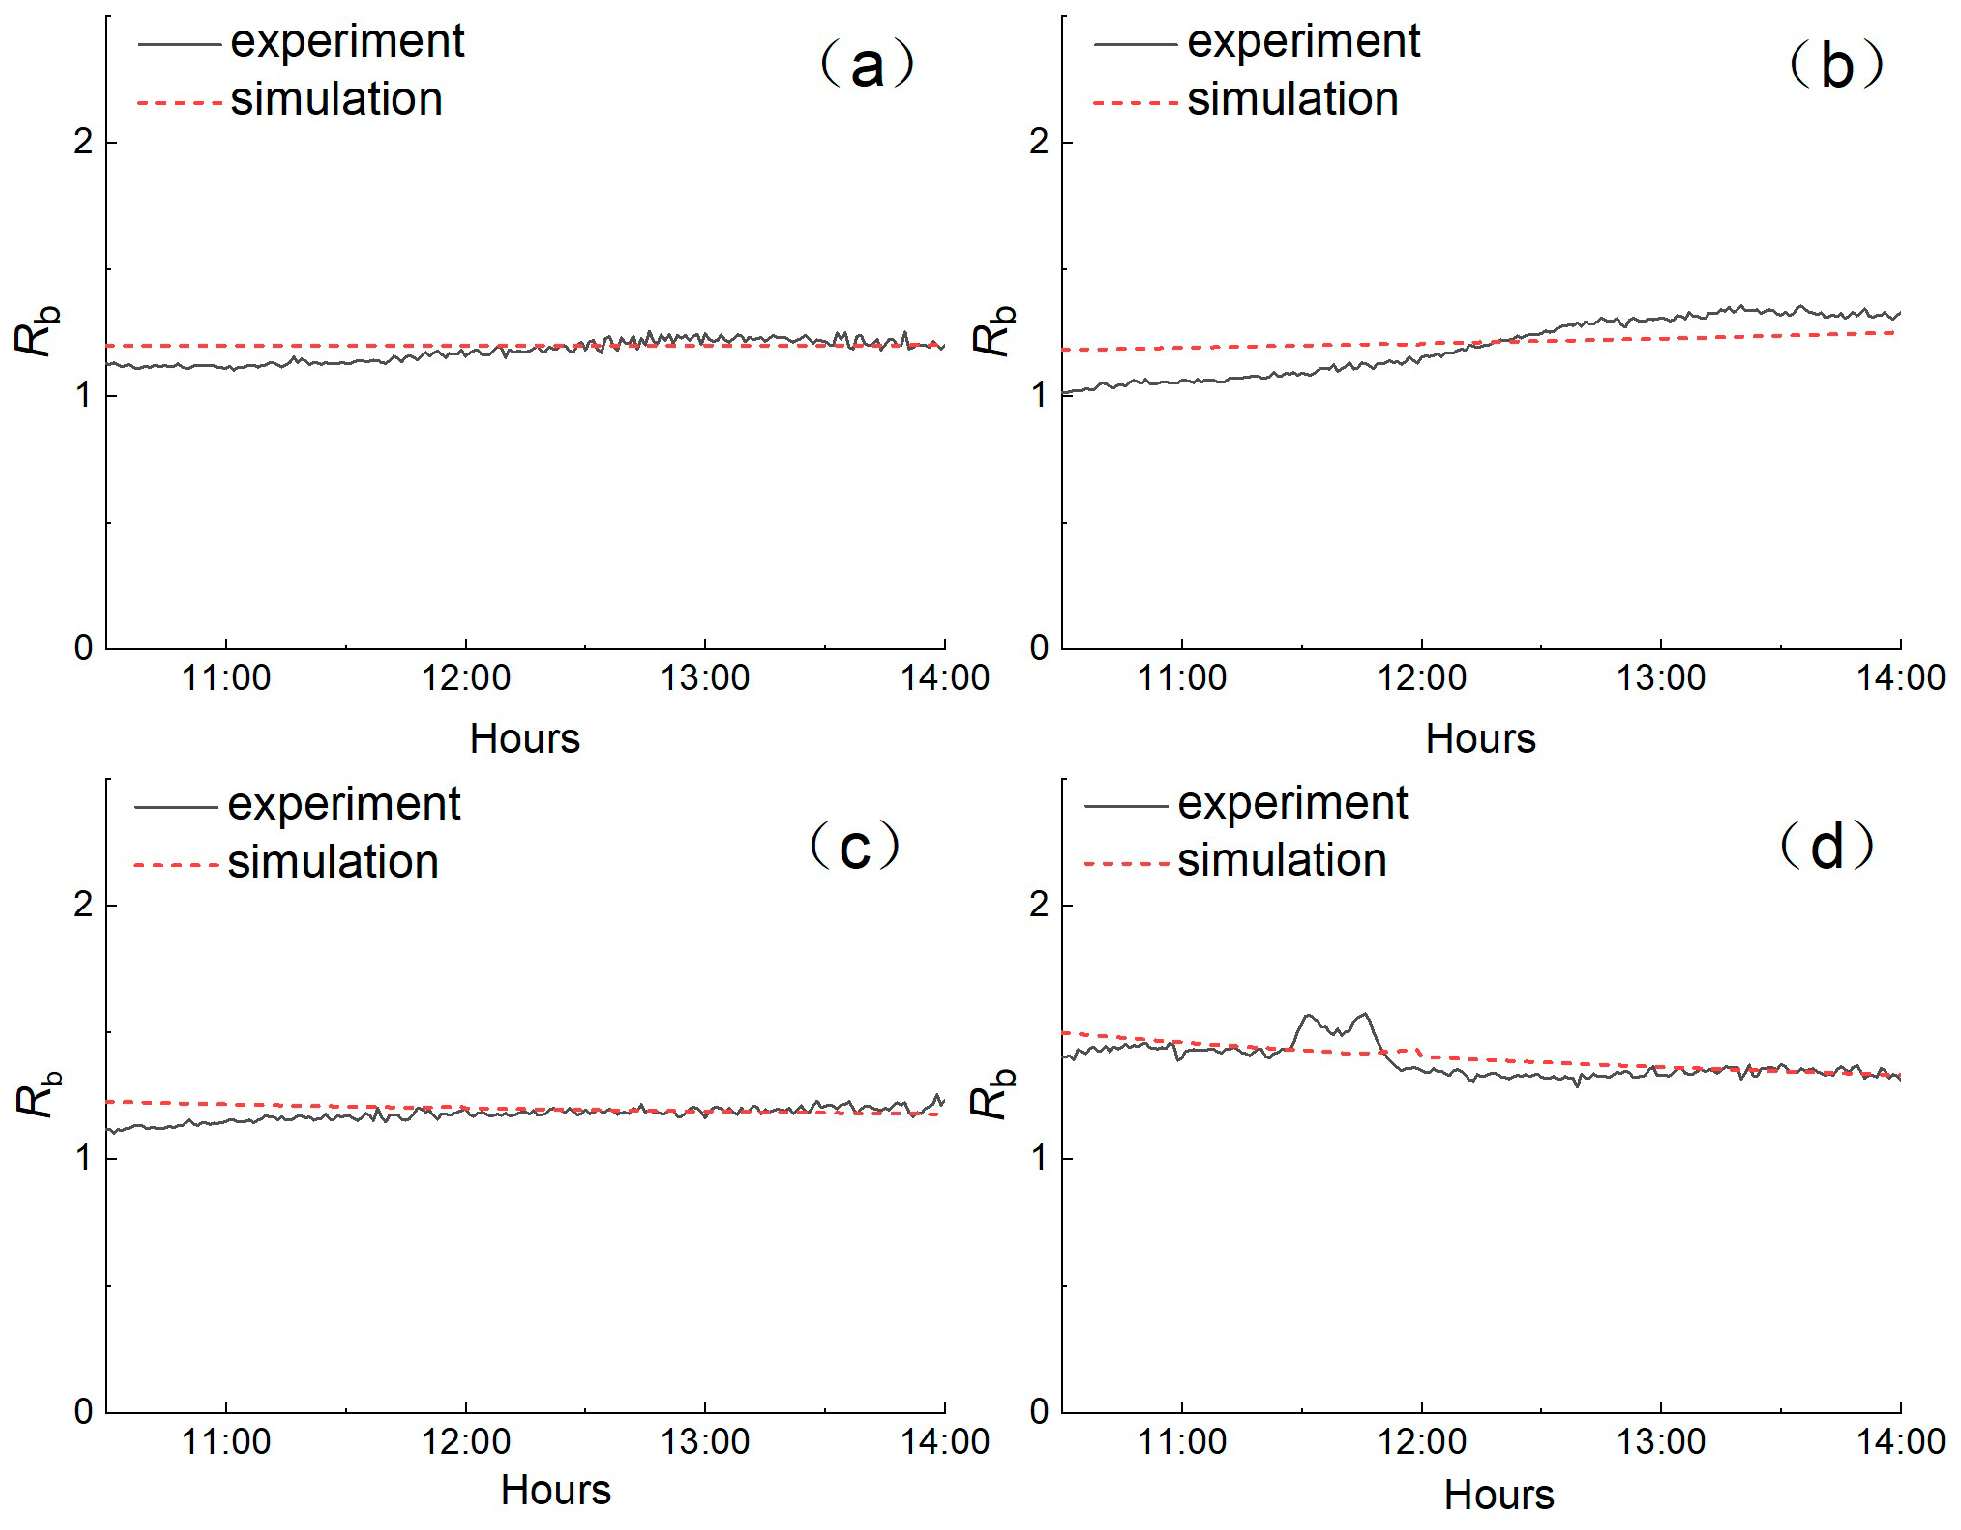
A verification test device for the irradiance calculation model of any facing panel is established, including two sets of TBQ-2 total radiation meter, TBS-2A direct radiation meter, TBD-1 diffuse radiation meter, and TBQ-2 inverse radiation meter. The nonlinear error of the instrument is less than 3%. In addition, the test equipment also includes a set of meteorological observation instruments, which can measure the ambient temperature, wind speed, and direction and air pressure of the test site. One set of solar irradiance measuring devices is placed horizontally and the other at a set angle, as shown in Figure 5. The solar radiation, direct radiation, scattering, and reflection values measured by two sets of solar irradiance measurement devices are comprehensively used to obtain the direct solar radiation values of the horizontal and set slope planes. Then, the corresponding radiation factor Rb value is calculated by Formula (2).
The test selected four time periods between September and November 2022, ranging from 10:30 to 14:00, with an azimuth of 0° due South, 10° due South by West, 10° due South by East, and 19° due South, and an inclination of 16.5°, 13°, and 21.7°, respectively. The comparison between Rb simulation results and the test results obtained by using the test device is shown in Figure 6. As can be seen from the figure, at 11:00, the test results of Rb are divided into 1.11, 1.06, 1.15, and 1.39, and the simulation results are 1.20, 1.19, 1.22, and 1.46, respectively, with an average error of 7.02%. At 12:00, the test results of Rb are divided into 1.16, 1.15, 1.20, and 1.35, and the simulation results are 1.20, 1.21, 1.20, and 1.40, respectively, with an average error of 2.98%. At 13:00, the test results of Rb are divided into 1.25, 1.31, 1.16, and 1.33, and the simulation results are 1.99, 1.23, 1.89, and 1.36, respectively, with an average error of 1.57%. At 14:00, the test results of Rb are divided into 1.20, 1.33, 1.23, and 1.31, and the simulation results are 1.20, 1.25, 1.17, and 1.33, respectively, with an average error of 2.31%. The simulation results of Rb are in good agreement with the test results. The maximum relative mistake of Rb is 9.78%. The main reasons for the error are cloudy days, air quality, and cloud cover, which leads to some deviation of direct observation data.

3.2. Photovoltaic Power System

3.2.1. Power System and Simulation Model

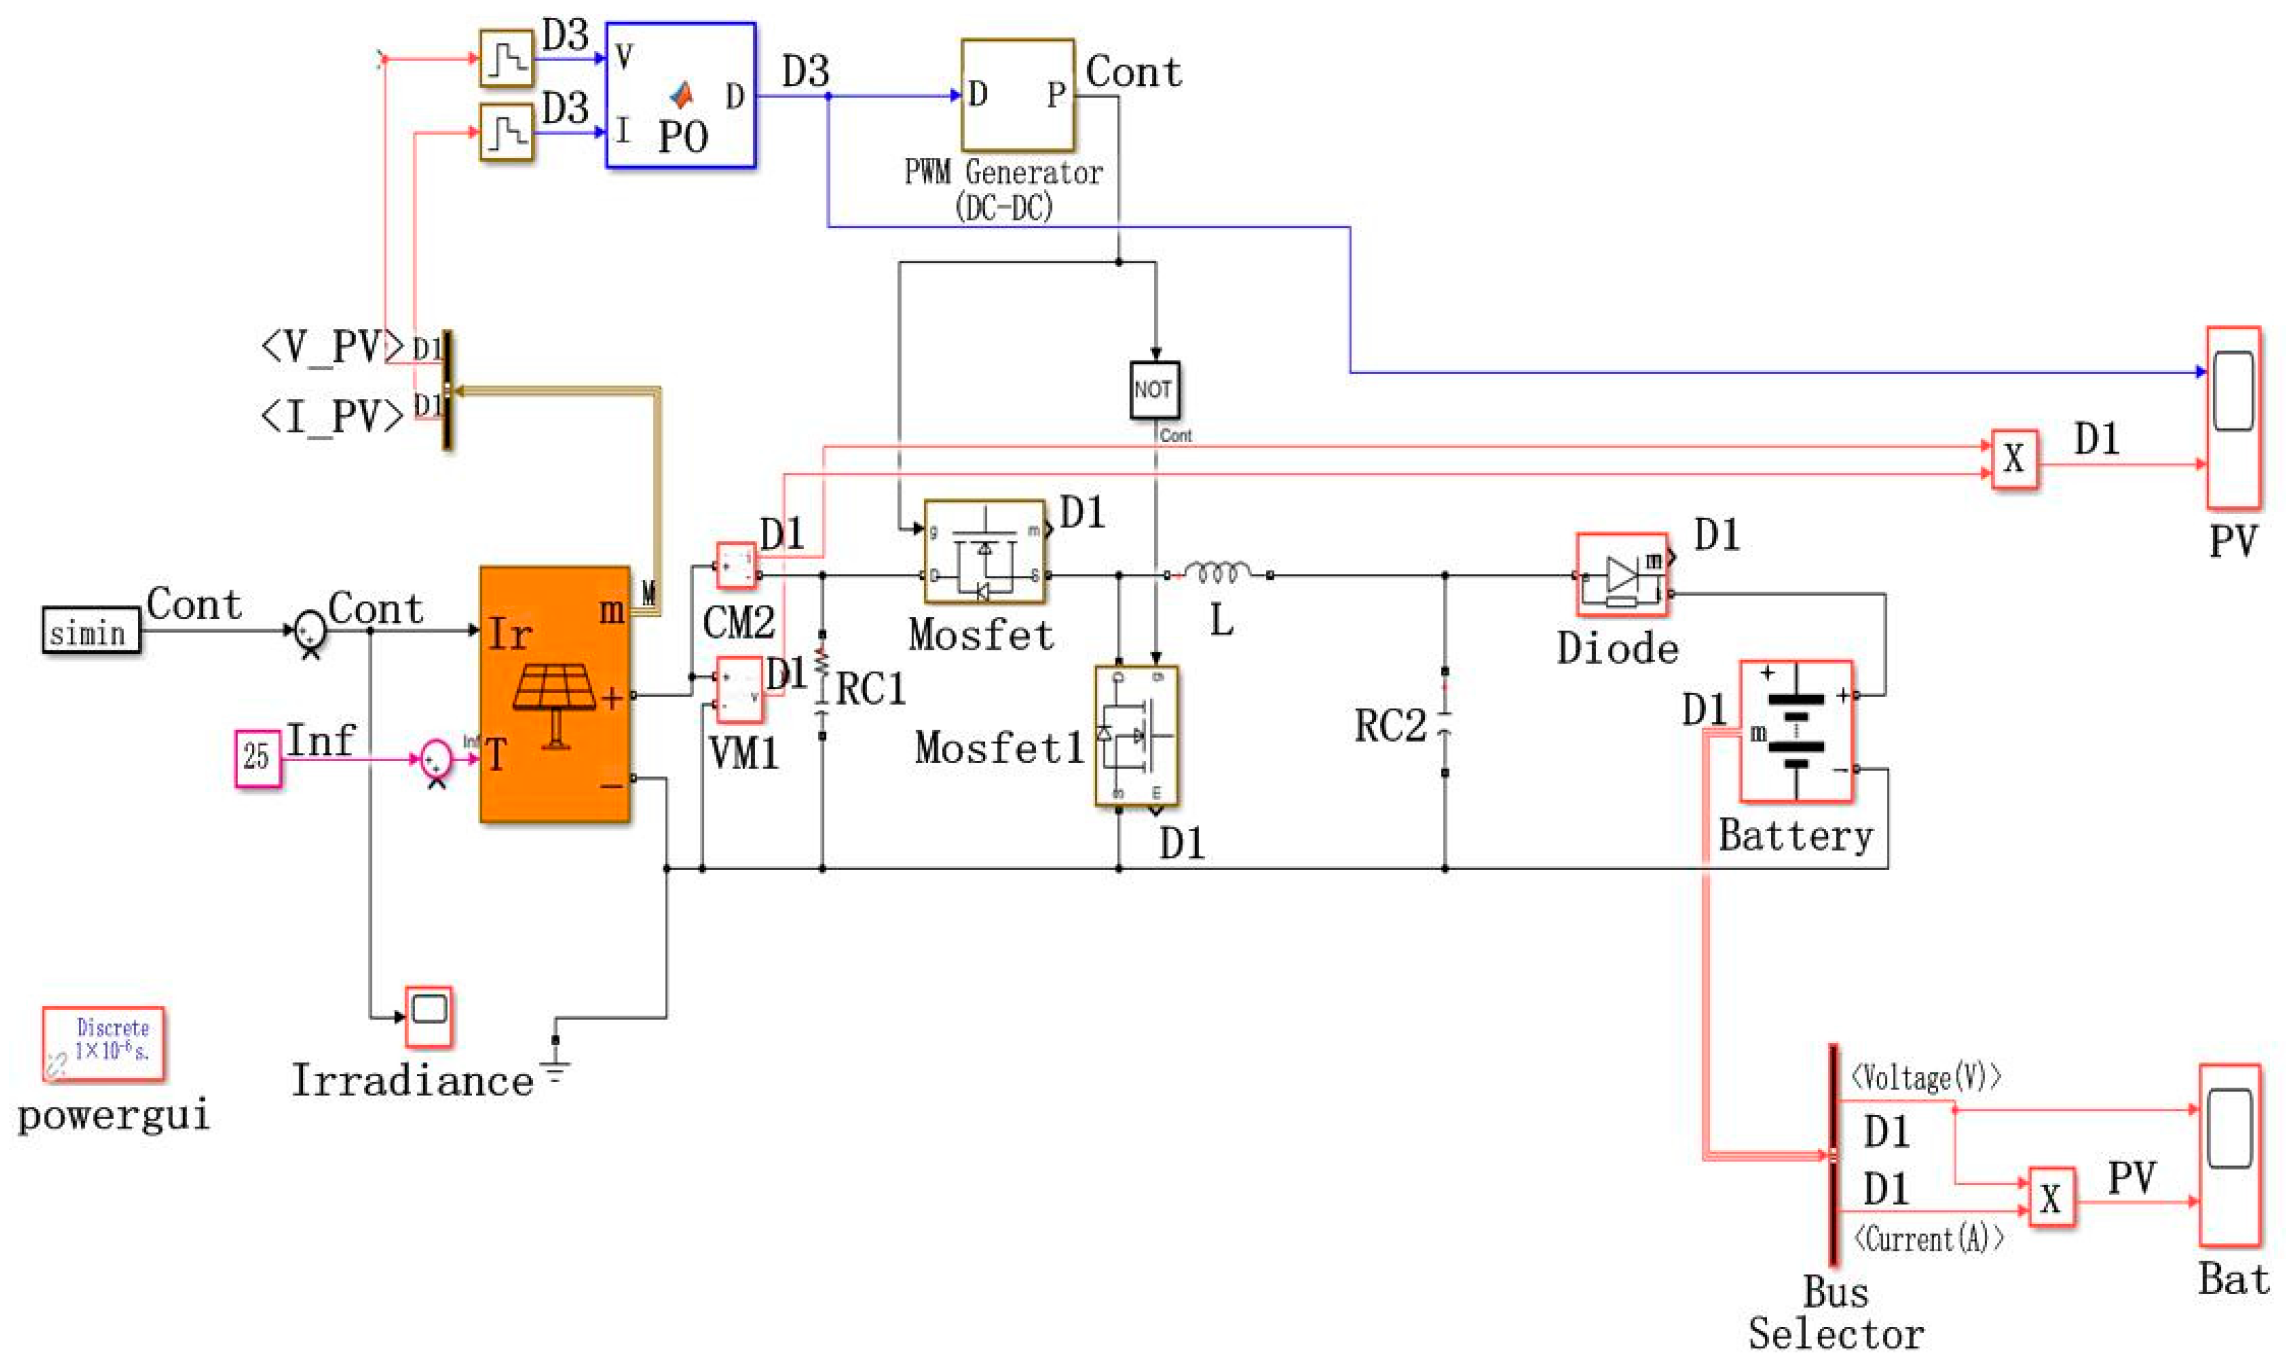
The USV photovoltaic power generation system consists of photovoltaic panel arrays, MPPT controllers, energy storage battery packs, and other components. The photovoltaic cell array consists of two SWM100 flexible photovoltaic panels (Yike Solar Energy Co., Ltd. in Guangzhou, China) with a nominal power of 100 W, which are set in series on the deck surface of the USV. The photovoltaic panel is 1015 in length, with a width of 515 mm and 3 mm in height. Under standard test conditions, the maximum power point voltage of the panel is 18.68 V, with a maximum power point current of 5.35 A, an open-circuit voltage of 22.30 V, and a short-circuit current of 5.63 A. The main topology structure of the MPPT controller is a DC-DC buck converter circuit. The voltage and current acquisition module is used to collect the output voltage and current of the photovoltaic panel, and the output voltage and current are used as input parameters for the MPPT controller. The MPPT controller adjusts the duty cycle of the PWM signal and drives the MOSFET in the buck circuit to control the charging process. The perturbation observation algorithm is used to achieve MPPT control.
Lithium iron phosphate battery packs were selected as energy storage units. Compared with lead-acid batteries and nickel–cadmium batteries, lithium iron phosphate batteries have advantages such as high energy density, long cycle life, and safety and environmental protection, making them ideal chemical energy storage components in marine observation equipment. Five 18,650 lithium-ion batteries are connected in parallel to form a subunit, and eight groups of subunits are connected in series to form a USV energy storage unit. The rated voltage of the battery pack is 25.6 V, the discharge cutoff voltage is 20 V, and the charging cutoff voltage is 29.6 V.
The simulation model of the photovoltaic power generation system is shown in Figure 7. The algorithm of [52] is used for the simulation of photoelectric conversion, but the parameters of photovoltaic panels in this paper are adopted.

3.2.2. Experimental Verification

The simulation model of the USV photovoltaic power system is validated using a swing test bench, which is shown in Figure 8. The USV is fixed on a roll test rig, which can sway around the x-axis of the hull to simulate rapid attitude changes of the USV photovoltaic power generation device. A set of test results on the attitude change of the USV is shown in Figure 8. As shown in the figure, the average oscillation period of the USV is 6.63 s, which is close to the average period of the waves. The output end of the photovoltaic panel array is directly connected to a 7.6 Ω resistance load, and under the load of this resistance value, the photovoltaic panel operates close to the maximum power point. To measure the instantaneous rolling of the USV, a HWT905 sensor (Weite Technology Co., Ltd. in Shenzhen, China) is installed on the USV deck, with a measurement accuracy of 0.05°. The rolling angle value is transmitted to the computer through the RS 485 interface (Weite Technology Co., Ltd. in Shenzhen, China), and the voltage of the photovoltaic panel is also transmitted to the computer through the data acquisition module. The meteorological parameters during the experiment are measured by the PC-4 environmental monitoring instrument (Sunshine Weather in Jinzhou, China).
The local longitude and latitude of the experimental site are 117.110° E and 19.136° N. The test was conducted on 18 May 2023, at 11:21 a.m., with an ambient temperature of 33.4 °C and clear weather. During the experiment, the total solar irradiance is 835 W·m−2, with direct radiation being 509 W·m−2. The experimental and simulation results of the output of the photovoltaic power generation device are shown in Figure 8b. The simulation calculation result is consistent with the test result, with a maximum error of only 1.1%.

4. Irradiance Characteristics of USV PV Modules under Typical Wave Conditions

4.1. Simulation Condition

The operating wave conditions of small long-endurance USVs are generally below Class 4 sea conditions, with an average speed of about 1.0 kn. For sea conditions below class 3, due to small waves, the amplitude of the swing angle of the USV body is relatively small, and the influence on the irradiance change of the solar panel is also relatively small. The attitude changes and irradiance characteristics of small USV solar panels under Class 4 sea conditions are investigated, as shown in Table 1. The irregular wave is selected, and the JONSWAP spectrum is selected. The wave approach direction is the angle between the wave propagation direction and the x-axis of the USV body.
Under the action and influence of waves, the inclination of small USV solar panels shows apparent high-frequency volatility and periodically swings around the horizontal plane. When the sun is at different heights, t the change in the direct angle of solar panels has a significant impact on the irradiance of the panels. The irradiance characteristics of small USV solar panels are analyzed based on the influence of solar irradiance on photoelectric conversion efficiency. In northern China, the height angle of the sun reaches a maximum of about 74° during the summer solstice; combined with the intensity of irradiance, the starting time of photovoltaic power generation units is about 7:00~8:00. Taking into account general issues, May 18 is selected as the reference day. Three working hours, namely, 7:00, 9:00, and 12:00, represent the respective lower, medium, and higher solar altitude angles; the corresponding solar altitude angles are 24.22°, 47.32°, and 70.23°, respectively. The instantaneous irradiance of the horizontal solar panels is 250, 569, and 887 W/m2, respectively.
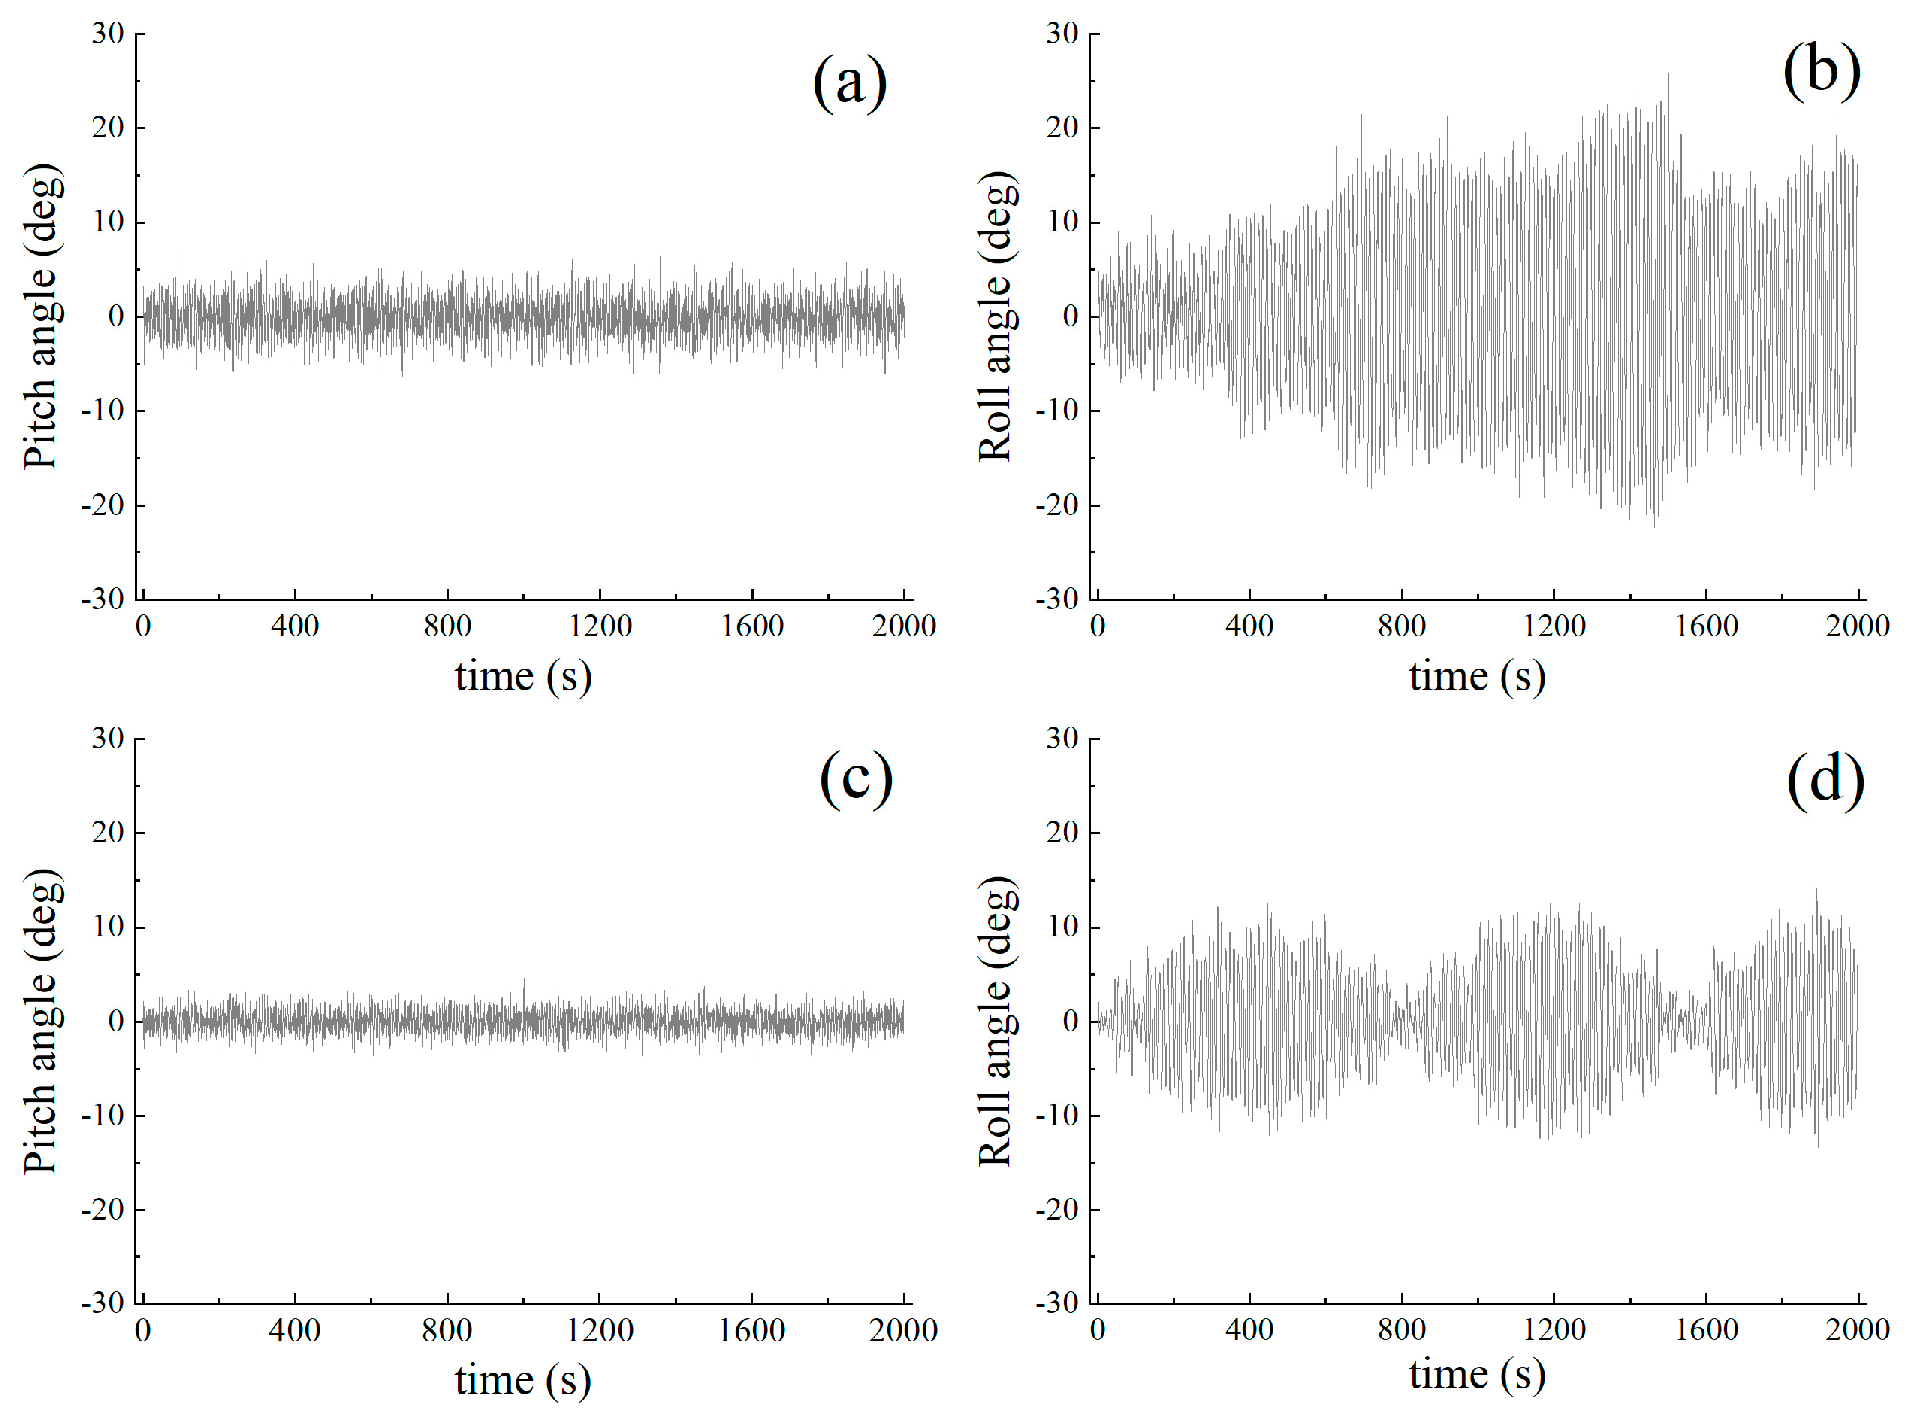
By using the simulation model, the attitude changes of the USV under three working conditions are investigated. The simulation results are shown in Figure 9. As can be seen from the figure, the variation range of pitch angle reaches 13.11° at 0° wave-facing direction. When the wave is 90°, the range of roll angle is 48.23°. When the wave is 45°, the variation range of roll angle reaches 27.73°, and the variation range of pitch angle reaches 8.30°.

4.2. Effect of Waves on Irradiance at Lower Solar Altitude Angles

The simulation model is used to calculate the irradiance variation of small USV panels at a lower solar altitude angle, and the calculation results are shown in Figure 10. As can be seen from the figure, under the action of the three wave directions of 0°, 45°, and 90°, the average irradiance is 249.74, 249.07, and 245.43 W/m2, respectively, and the average irradiance oscillation is 0.83, 36.16, and 74.14 W/m2, respectively. The maximum values of irradiance oscillations are 10.16, 202.31, and 329.14 W/m2, respectively. At the lower solar altitude, the average irradiance of the panels under different wave directions changes little, the maximum difference is 4.31 W/m2, and the relative deviation is 1.7%. However, there is a significant difference between the mean value and the maximum value of irradiance oscillation, and the maximum difference in the mean value is 73.31 W/m2, accounting for 29.9% of the mean value. The maximum value of irradiance oscillation changes dramatically, and the maximum difference in the maximum radiation value at different times reaches 318.97 W/m2, accounting for 130.0% of the average value. The change in wave direction has little effect on the change in the average irradiance, but has a more severe impact on the amplitude of irradiance oscillation. In order to facilitate comparative analysis, the solar irradiance of the horizontal plane with a fixed orientation at the same time is plotted together in the figure. The value of the horizontal azimuth irradiance is 250 W/m2, and the maximum relative deviation from the average instantaneous irradiance of the solar panels on the USV’s surface is 0.1%.

4.3. Effect of Waves on Irradiance at Medium Solar Altitude Angle

By using the simulation model, the irradiance variation of the small USV panel at the medium solar altitude angle is calculated, and the calculation results are shown in Figure 11. As can be seen from the figure, under the action of the three wave directions, the average irradiance is 568.33, 564.98, and 548.77 W/m2, respectively, the average irradiance oscillation is 4.59, 39.41, and 83.29 W/m2, respectively, and the maximum irradiance oscillation is 43.00, 238.44, and 490.40 W/m2, respectively. Compared with the lower solar altitude angle, the average irradiance of the panels at the medium solar altitude angle with different waves is relatively increased, the maximum difference is 19.56 W/m2, and the relative deviation is 3.6%. The maximum difference in the mean value of irradiance oscillation is 78.69 W/m2, accounting for 14.3% of the mean value, which is slightly lower than that under a low solar altitude angle. The maximum value of the oscillation changes sharply, and the maximum difference at different times reaches 447.40 W/m2, accounting for 81.5% of the average value. The wave direction is still an essential factor affecting the significant change in the amplitude of the irradiance oscillation. In order to facilitate comparative analysis, the solar irradiance of the horizontal plane with a fixed orientation at the same time is plotted together in the figure. The value of the horizontal azimuth irradiance is 569 W/m2, and the maximum relative deviation from the average instantaneous irradiance of the solar panels on the surface of the USV is 0.9%.

4.4. Effect of Waves on Irradiance at Higher Solar Altitude Angle

The simulation model is used to calculate the irradiance variation of small USV panels at higher solar altitude angles, and the calculation results are shown in Figure 12. As can be seen from the figure, under the action of the three wave directions, the average irradiance is 886.05, 879.25, and 854.12 W/m2, and the average irradiance oscillation is 8.10, 10.09, and 30.78 W/m2, respectively. The maximum irradiance oscillation is 72.52, 81.70, and 260.58 W/m2, respectively. In the case of higher solar altitudes and different wave directions, the average irradiance of the panel changes the most, the maximum difference is 31.92 W/m2, and the relative deviation is 3.7%. The difference between the mean value and the maximum value of irradiance oscillation is the smallest, and the maximum difference in the mean value is 22.69 W/m2, accounting for 2.6% of the mean value. The maximum value of oscillation changes the least, and the maximum difference in the maximum value at different times is 188.06, accounting for 22.0% of the average value. In order to facilitate comparative analysis, the solar irradiance of the fixed orientation of the horizontal plane at the same time is plotted together in the figure. The value of the horizontal orientation irradiance is 887 W/m2, and the maximum relative deviation from the average instantaneous irradiance of the solar panels on the surface of the USV is 3.7%.

5. Characteristics of Photovoltaic MPPT under Wave Excitation

5.1. Changes in Irradiance

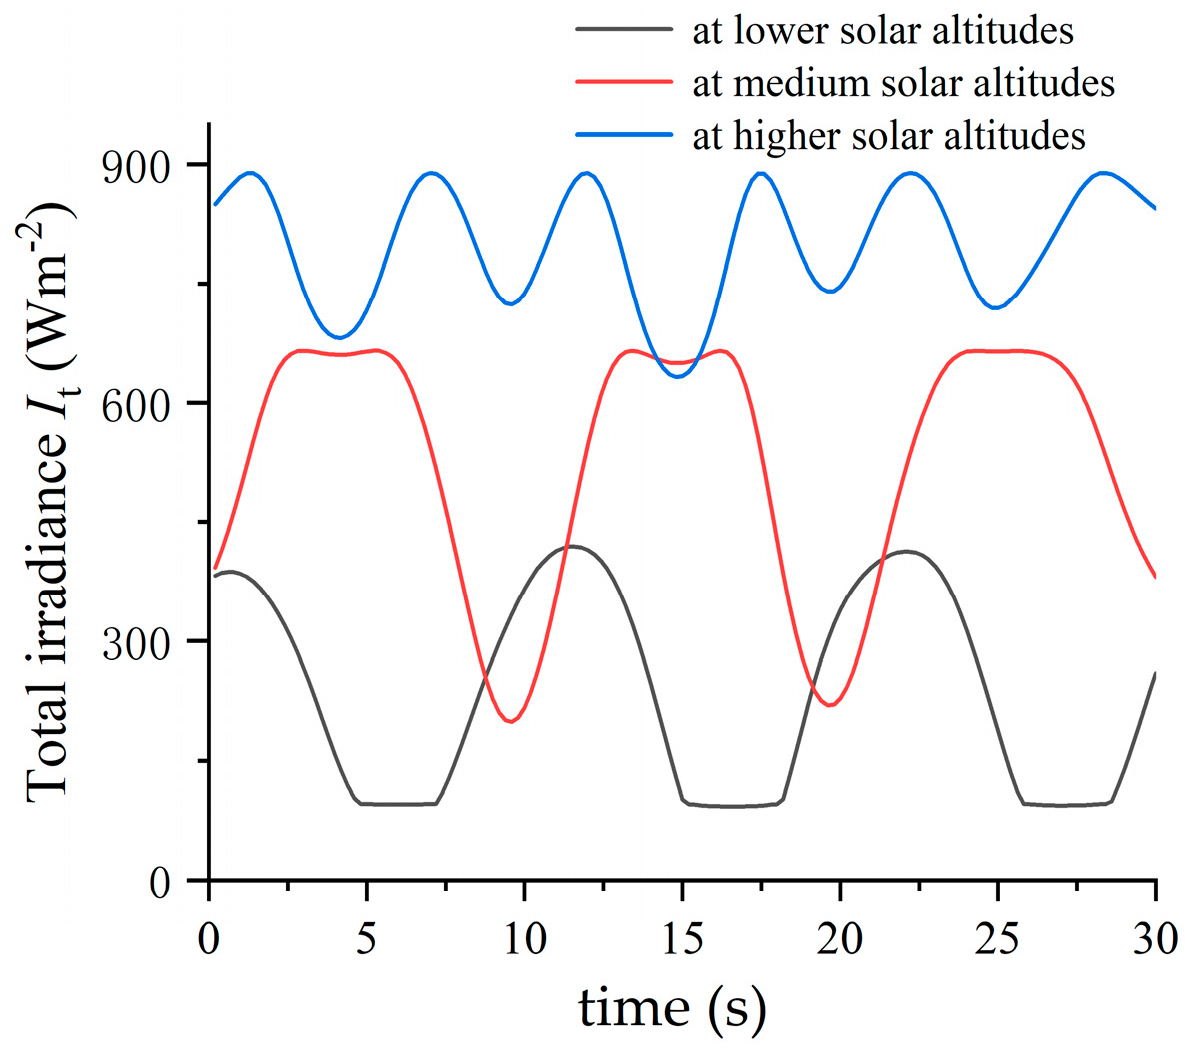
Under three different solar altitude angle conditions, the roll angle of the USV changes most dramatically when the incident wave direction is 90°. A small segment of the curve with the most severe oscillation amplitude is selected as the input to investigate the influence of attitude changes on the control characteristics of MPPT, which are shown in Figure 13. The topmost curve represents the change in irradiance on the solar panel caused by waves when the solar altitude angle is large, and the change follows a sinusoidal pattern with a frequency of about 5 s. The red curve in the middle represents the variation in irradiance on the surface of the solar panel at a moderate solar altitude angle, exhibiting square wave characteristics with an irradiance variation period of approximately 11 s. The bottom curve shows the variation in irradiance on the surface of the solar panel at lower solar altitudes, which exhibits an inverted square wave characteristic with a variation period of approximately 10 s. Due to the use of a random wave model in the dynamic analysis of USV, the periods of some line segments extracted from the attitude angle time-domain variation curve are different. The period of variation of the topmost curve is close to the average wave period of the wave, while the other two cases correspond to the wave period with a higher wave height in a wave observation cycle.

5.2. Simulation Analysis of MPPT under Wave Influence

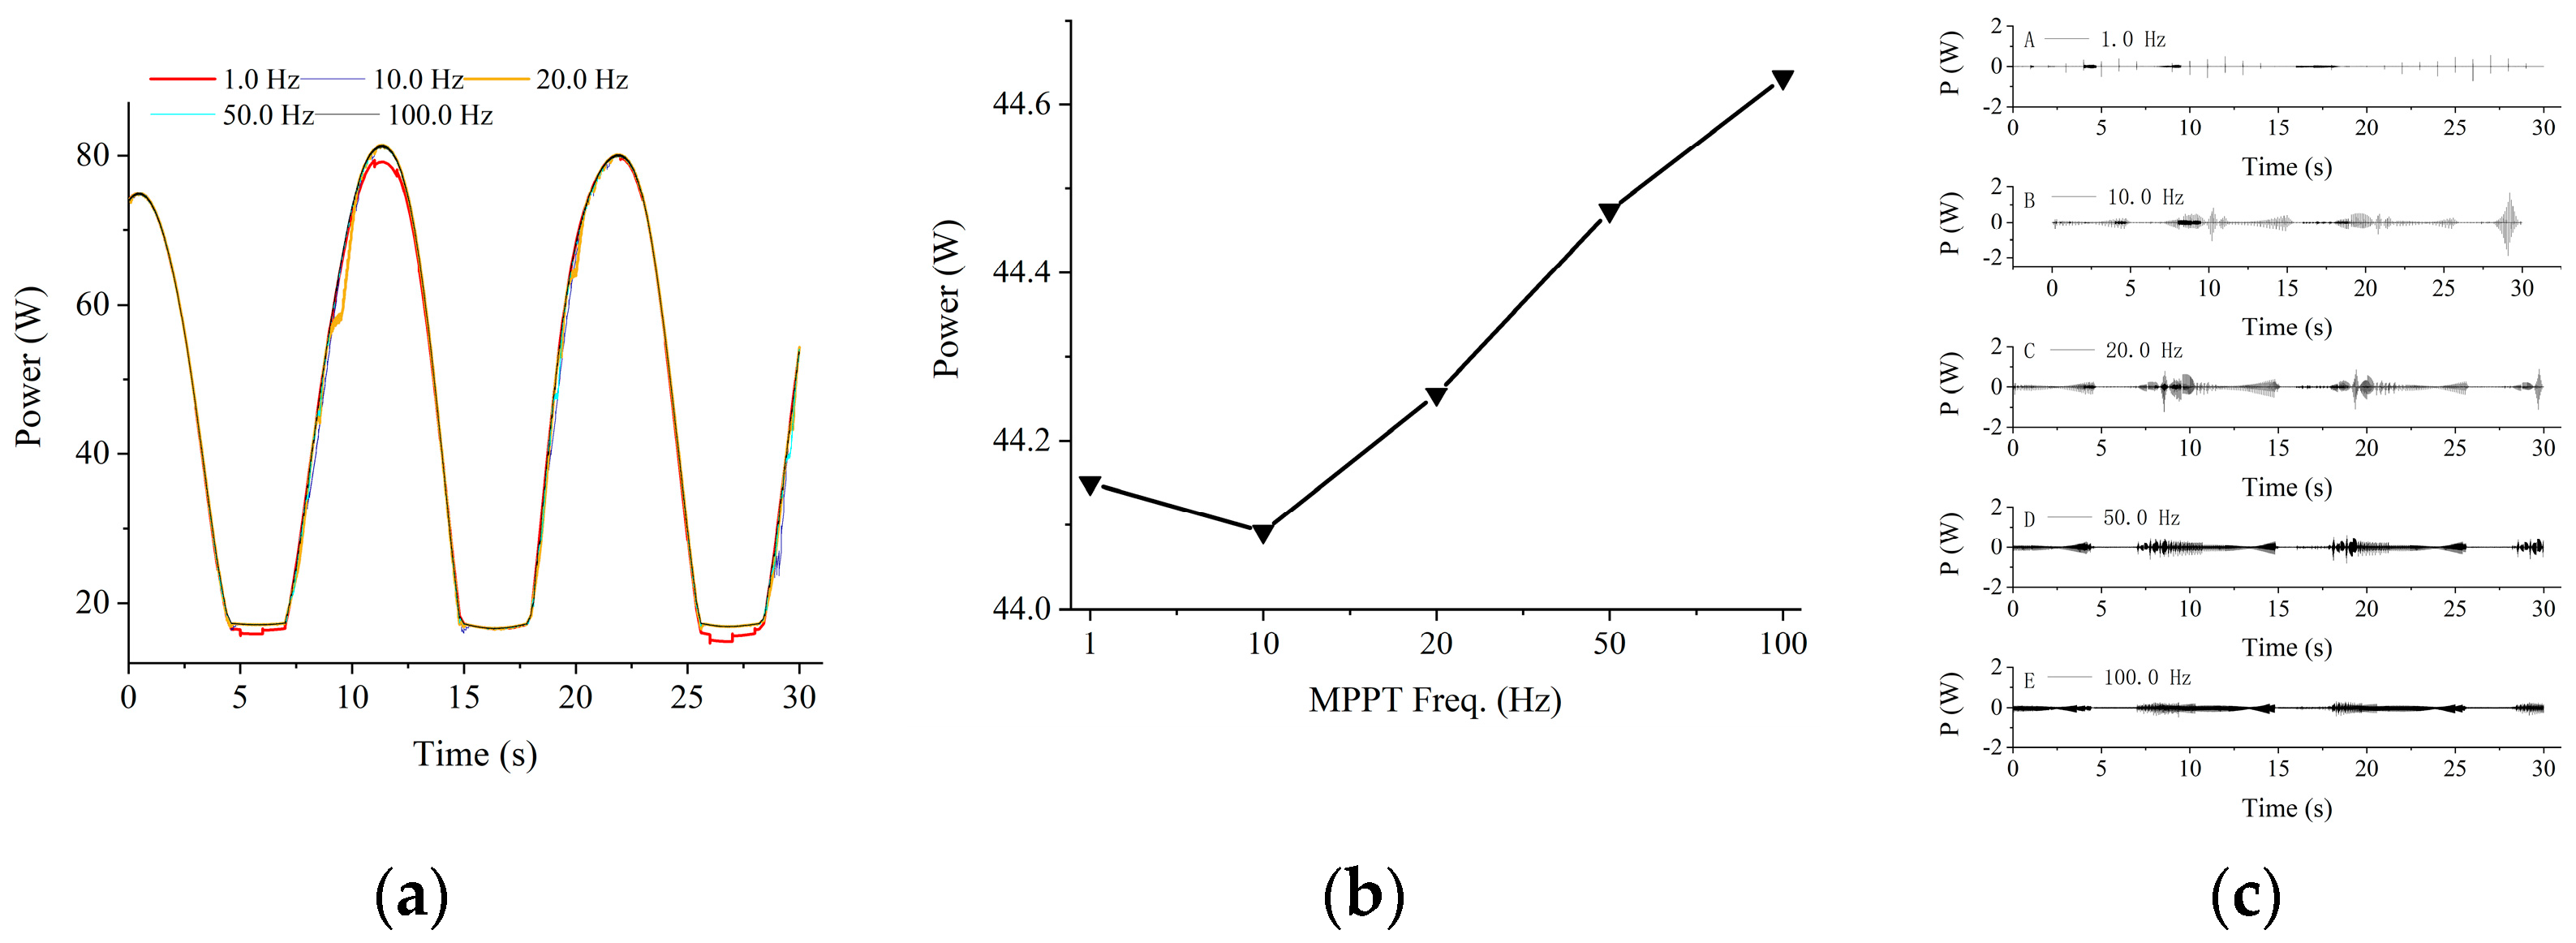
In the research of conventional photovoltaic systems, the control frequency of MPPT is in the range of 1–100 Hz, and simulation studies mostly use 100 Hz, while the control frequency of actual experimental devices is about 20 Hz. The adjustment frequency of small photovoltaic MPPT controller products on the market is only 1.0 Hz. For the photovoltaic power generation system of small USVs, the continuous high-frequency changes in solar irradiance caused by the continuous oscillation of the hull have a certain impact on the control effect of MPPT. Simulation is conducted on the control effect of MPPT at different control frequencies for the irradiance variation given in Figure 13. The calculation results are shown in Figure 14, Figure 15 and Figure 16.
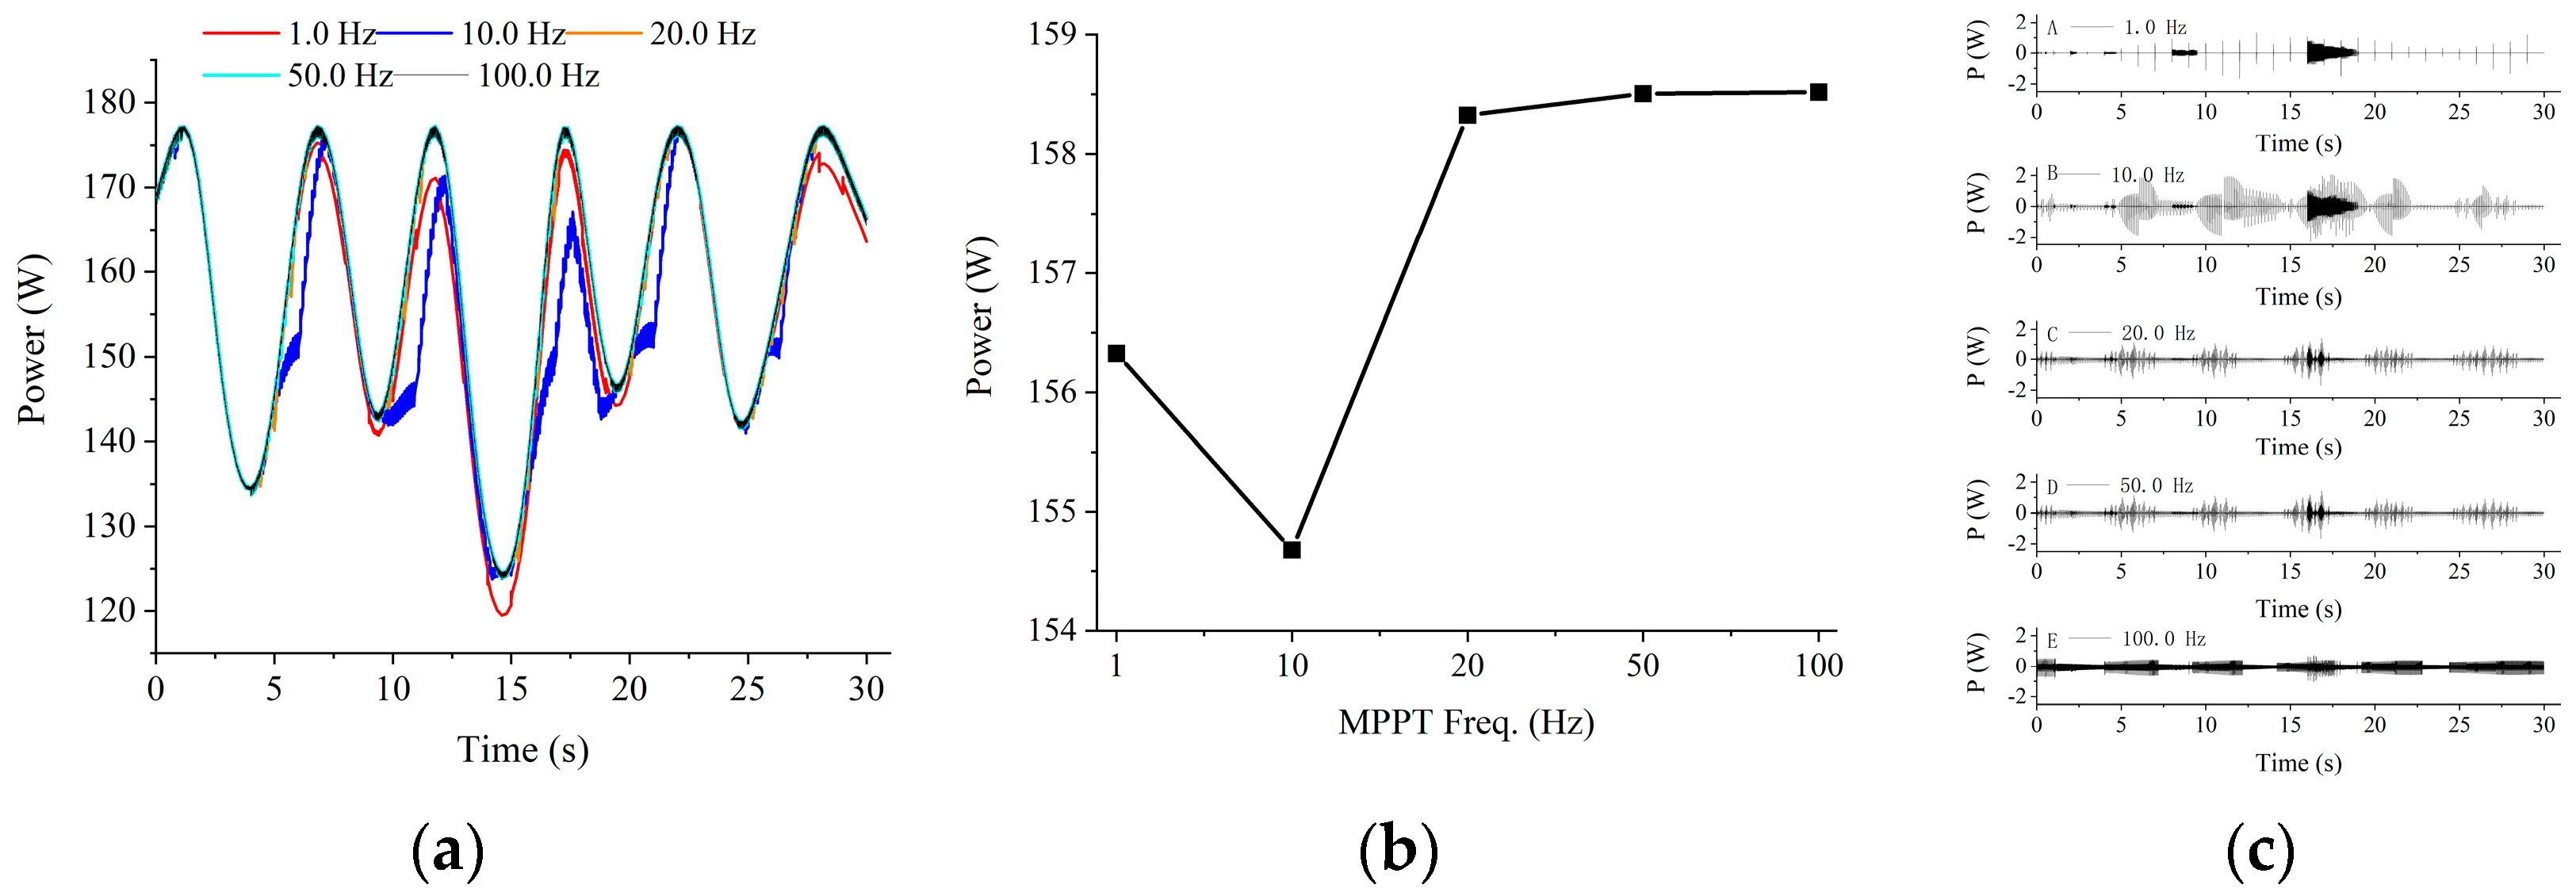
From Figure 14a, it can be seen that due to the drastic changes in irradiance, the MPPT control frequency has a significant impact on the output of the solar PV power system. For most of the time from the fifth second, the output power at lower MPPT control frequencies of 1.0 Hz or 10.0 Hz is significantly lower than that under higher control frequency conditions. The maximum difference between the output by using a 100.0 Hz control frequency and that of using a 10.0 Hz control frequency is 23.4 W, with a relative difference of approximately 13.5%. The maximum difference between the output by using a 100.0 Hz control frequency and that of a 1.0 Hz control frequency is 7.2 W, with a relative difference of approximately 4.4%. The relative deviation between the output power of the 20.0 Hz control frequency and the power output of the 100.0 Hz control frequency is less than 2.8%. When using 50.0 Hz and 100.0 Hz, respectively, the relative deviation of their output power is less than 2%. In addition, the output curve of power devices with lower frequency control by MPPT shows significant distortion, indicating that their ability to adapt to changing irradiance caused by waves is relatively poor.
By examining the smoothness of the power curves in Figure 14, it can be seen that there is a certain degree of high-frequency oscillation in each power curve. The high-frequency oscillation amplitude changes of each power curve can be calculated using the following method:
P i = P i 1 11 j = i 5 i + 5 P i
P i is the instantaneous output power of the photovoltaic panel at a certain moment, W; and P i is the high-frequency oscillation component of the output power at that moment, W, as shown in Figure 14c. As the MPPT control frequency increases, the oscillation amplitude of the high-frequency component in the output power shows a decreasing trend. The high-frequency oscillation of the power curve with a control frequency of 10.0 Hz is the most severe, with many dense oscillation regions with amplitudes of ±2.0 W. The power curve with a control frequency of 1.0 Hz exhibits some isolated oscillations, with a maximum amplitude close to 1.5 W. For the power curve with a control frequency of 100.0 Hz, although the high-frequency oscillation amplitude is only about ±0.5 W, the oscillation frequency is relatively large, and the curve exhibits a characteristic of narrow and dense distribution.
The simulation results of the average output of the device under different MPPT control frequency conditions at a larger solar altitude angle are shown in Figure 14b. The average power under the control frequency of 10.0 Hz MPPT is the lowest, only 154.7 W. The average power under the control frequency of 1.0 Hz MPPT is relatively small, about 156.3 W. The average power of the photovoltaic device with control frequencies of 20.0, 50.0, and 100.0 Hz, respectively, is almost the same, with the value of 158.5 W being significantly higher than the other two cases.
From Figure 15a, it can be seen that in the peak region of the output power curve, there is a clear separation between the curves. Especially in the third peak, using a higher control frequency for output power has a significant advantage, and during this period, the maximum difference between the output power when using a 100 Hz control frequency and the power when using a 1.0 Hz control frequency is 5.6 W, with a relative deviation of about 4.3%. The simulation results of the average output power of PV devices under different MPPT control frequency conditions are shown in Figure 15b. Similar to the situation at larger solar altitudes, the average power under the control frequency of 10.0 Hz MPPT is the lowest, only 101.3 W. The average power under the control frequency of 1.0 Hz MPPT is relatively small, about 101.5 W. When the MPPT control frequency is greater than 10.0 Hz, the average power of the photovoltaic device shows a trend of increasing with the increase in control frequency, with a maximum value of 102.7 W at 100.0 Hz.
The high-frequency oscillation component of the power generation of the USV photovoltaic system at a moderate solar altitude angle is shown in Figure 15c. Similarly, there are individual isolated oscillations in the power curve with a control frequency of 1.0 Hz, with oscillation amplitudes approaching 1.0 W. The high-frequency oscillation of the power curve with a control frequency of 10.0 Hz is the most severe, with a few dense oscillation areas with amplitudes of ±2.0 W. The power curve with a control frequency of 100.0 Hz also exhibits a feature of small amplitude and dense distribution, with an oscillation amplitude of approximately ±0.4 W. The characteristics of the high-frequency component with a control frequency of 50.0 Hz are relatively close to that of 100.0 Hz.
From Figure 16, it can be seen that the MPPT control frequency of 1.0 Hz has poor performance in the first and third trough of the wave, and the output power of the PV device is significantly smaller than that of other control frequencies, with deviations of about 7.3% and 12.0%, separately. In the rising section of the second peak, the output power at 20.0 Hz control frequency shows an abnormality, with a maximum relative deviation of about 12.1% from the output power at 100.0 Hz control frequency. When the solar altitude angle is low, the impact of MPPT control frequency on average power generation is almost the same as that of a moderate solar altitude angle. The power with a control frequency of 10.0 Hz is the smallest, and the average power generation in the range of 10.0 Hz to 100.0 Hz increases with the increase in MPPT control frequency.
When the solar altitude angle is small, the local high-frequency oscillation of each power curve improves. When approaching 30 s, the power curve of the MPPT control frequency at 20.0 Hz exhibits a significant local oscillation of ±2.0 W. The power curve with a control frequency of 1.0 Hz exhibits individual oscillations with amplitudes close to 1.0 W. The oscillation amplitude of the high-frequency component of the power curve with control frequencies of 50.0 Hz and 100.0 Hz is approximately 0.25 W

6. Conclusions

In this study, we propose a simulation analysis method for small USV photovoltaic power devices under marine environmental conditions. Based on this simulation analysis method, the variation characteristics of solar radiation on USV solar panels under wave action are studied, and then the impact of sustained and rapid changing irradiance on the control effect of MPPT is studied
Under the action of waves in real sea conditions, the attitude of the small USV hull exhibits high-frequency oscillation characteristics. The direction of incident waves and the angle of solar height have a significant impact on the incident solar energy of USV photovoltaic systems. Lateral waves can cause a larger hull sway angle, resulting in a sharp change in the incident radiation value on the solar panel. The larger the solar altitude angle, the smaller the oscillation amplitude of solar irradiance on the surface of USV solar panels caused by waves.
Although waves can cause significant instantaneous changes in the incident irradiance on USV solar panels, their impact on the average incident radiation is relatively small. When the solar altitude angle remains constant, the average values of incident irradiance on the photovoltaic panel caused by different wave actions do not exceed 3.73%. And the average irradiance is very close to the irradiance on a fixed horizontal plane, with a maximum deviation of less than 3.71%.
Waves have a certain impact on the MPPT control effect of USV photovoltaic power systems. Overall, a lower frequency of MPPT regulation is not conducive to the operation of USV PV systems, and to some extent, it will lead to a slight decrease in power generation. However, the average power generation of the PV system is not simply a monotonic relationship with the MPPT control frequency. In the range of 1.0 Hz to 100.0 Hz, as the MPPT control frequency increases, the average output power of the PV system exhibits a U-shaped distribution characteristic. When the control frequency is in the range of 1.0–20.0 Hz, a control frequency of 1.0 Hz can also lead to better control effects. When the control frequency is in the higher frequency range of 20.0 Hz to 100.0 Hz, the average output power increases with the increase in MPPT control frequency, and is slightly higher than the average power in the low-frequency range.
Waves can cause high-frequency oscillations in the output power of the MPPT controller. At an extremely low MPPT control frequency of 1.0 Hz, isolated oscillation phenomena will occur in the output power of the photovoltaic system. As the MPPT control frequency increases, the high-frequency oscillation amplitude of the photovoltaic system output power tends to decrease, especially when the MPPT control frequency exceeds 50.0 Hz. However, the frequency of PV output oscillating shows an increasing trend with the increase in MPPT control frequency.
Due to the significant impact of waves on the operating characteristics of USV PV systems, the influence of waves should be considered when designing the MPPT algorithm for USV PV systems. The traditional P&O MPPT algorithm can be applied to USV photovoltaic power generation systems, but it is recommended that a larger MPPT control frequency is adopted, which is not less than 50 Hz.

Author Contributions

Conceptualization, W.Y.; methodology, B.W.; formal analysis, W.Y. and B.W.; software, W.Y., B.W. and S.S.; investigation, W.Y. and X.W.; resources, B.W.; data curation, W.Y.; writing—original draft preparation, B.W. and W.Y.; writing—review and editing, W.Y., B.W. and W.K.; visualization, W.Y. and B.W.; supervision, W.Y.; project administration, B.W.; funding acquisition, B.W. All authors have read and agreed to the published version of the manuscript.

Funding

This research was funded by the Key Laboratory of Ocean Observation Technology (grant no. 2021klootB04).

Data Availability Statement

The original contributions presented in the study are included in the article, further inquiries can be directed to the corresponding author.

Conflicts of Interest

The authors declare no conflicts of interest.

Nomenclature

CFDComputational Fluid Dynamics
FOCVfractional open circuit voltage
MPPmaximum power point
MPPTmaximum power point tracking
PVphotovoltaic
PWMPulse-Width Modulation
P&OPerturb and Observe
USVunmanned surface vehicle
Asun’s azimuth (deg)
CRrotational motion damping (N·m·s/rad)
Cutranslational motion damping (N·s/m)
Fcthe resistance around the flow (N)
Fbthe buoyancy force of USV (N)
Fwindicates wave force (N)
Gthe gravity of USV (N)
h°the altitude angle of the sun (deg)
Ithe total irradiance of the horizontal plane (W/m2)
Ibhorizontal direct irradiance (W/m2)
Idhorizontal scattered irradiance (W/m2)
Itthe total irradiance of the surface of the solar panel (W/m2)
Itbdirect radiation (W/m2)
Itdscattered radiation (W/m2)
Itrreflected radiation (W/m2)
Jthe moment of inertia (N·m)
ΔJthe additional moment of inertia (N·m)
KRrotational motion damping stiffness (N·m/rad)
Kutranslational motion damping stiffness (N/m)
Mthe mass of USV (kg)
ΔMthe additional mass of USV (kg)
Pithe instantaneous output power of the photovoltaic panel at a certain moment (W)
P i the high-frequency oscillation component of the output power at that moment (W)
Rthe motion variable of USV (rad)
Rbradiation factor (W/m2)
Rxthe roll angle of the solar panel (deg)
Rythe pitch angle of the solar panel (deg)
Rzthe yaw angle of the solar panel (deg)
Tcflow resistance moment (N·m)
Tbthe buoyancy moment of USV (N·m)
Twwave action moment (N·m)
uithe displacement along the coordinate axis of USV (m)
βthe solar panel inclination angle (deg)
γthe solar panel azimuth angle (deg)
δthe declination angle of the sun on the observed day (deg)
zthe time from noon (deg)
ρthe reflection factor (deg)
φthe latitude of the measurement site (deg)
ωtime angle (deg)

References

  1. Cokelet, E.D.; Meinig, C.; Lawrence-Slavas, N.; Stabeno, P.J.; Mordy, C.W.; Tabisola, H.M.; Jenkins, R.; Cross, J.N. The use of Saildrones to examine spring conditions in the Bering sea. In Proceedings of the OCEANS 2015-MTS/IEEE Washington, Washington, DC, USA, 19–22 October 2015; pp. 1–7. [Google Scholar]
  2. Wang, P.; Wang, D.; Zhang, X.; Li, X.; Peng, T.; Lu, H.; Tian, X. Numerical and experimental study on the maneuverability of an active propeller control based wave glider. Appl. Ocean Res. 2020, 104, 102369. [Google Scholar] [CrossRef]
  3. Setiawan, F.; Kadir, R.; Gamayanti, N.; Santoso, A.; Bilfaqih, Y.; Hidayat, Z. Dynamic modelling and controlling unmanned surface vehicle. IOP Conf. Ser. Earth Environ. Sci. 2021, 649, 012056. [Google Scholar] [CrossRef]
  4. Setiawan, J.D.; Septiawan, M.A.; Ariyanto, M.; Caesarendra, W.; Munadi, M.; Alimi, S.; Sulowicz, M. Development and performance measurement of an affordable unmanned surface vehicle (USV). Automation 2022, 3, 27–46. [Google Scholar] [CrossRef]
  5. Liu, P.; Su, Y.-m.; Liao, Y.-l. Numerical and experimental studies on the propulsion performance of a Wave Glide propulsor. China Ocean Eng. 2016, 30, 393–406. [Google Scholar] [CrossRef]
  6. Yang, T.; Guo, Y.; Zhou, Y.; Wei, S. Joint communication and control for small underactuated USV based on mobile computing technology. IEEE Access 2019, 7, 160610–160622. [Google Scholar] [CrossRef]
  7. Leifeng, W.; Ye, L.; Yulei, L.; Kaiwen, P.; Weixin, Z. Adaptive heading control of unmanned wave glider with heading information fusion. Control Eng. Pract. 2019, 85, 216–224. [Google Scholar] [CrossRef]
  8. Liu, Y.; Lin, M.; Jiang, X.; Sun, X.; Song, X. A comparison of multiplatform wind products in the South China Sea during summer and autumn in 2019. J. Oceanol. Limnol. 2021, 39, 2181–2194. [Google Scholar] [CrossRef]
  9. Li, C.; Sang, H.; Sun, X.; Qi, Z. Hydrographic and meteorological observation demonstration with wave glider “black pearl”. In Proceedings of the Intelligent Robotics and Applications: 10th International Conference, ICIRA 2017, Wuhan, China, 16–18 August 2017; Proceedings, Part I 10. pp. 790–800. [Google Scholar]
  10. Yunisa, Y.; Zhimwang, J.T.; Aminu, I.; Shaka, O.S.; Frank, L.M. Design and Construction of 5KVA Solar Power Inverter System. Int. J. Adv. Eng. Manag. 2022, 4, 1355–1358. [Google Scholar]
  11. Asnil, K.; Husnaini, I.; Astrid, E. Design and Performance of Dual Axis Solar Tracker Based on Light Sensors to Maximize the Photovoltaic Energy Output. J. Theor. Appl. Inf. Technol. 2022, 100, 6554–6564. [Google Scholar]
  12. Eke, R.; Senturk, A. Performance comparison of a double-axis sun tracking versus fixed PV system. Sol. Energy 2012, 86, 2665–2672. [Google Scholar] [CrossRef]
  13. Fathi, M.; Amjadifard, R.; Eshghi, F.; Kelarestaghi, M. Design and implementation of a novel multi-faceted-efficient pneumatic dual-axis solar tracker. World J. Eng. 2024, 21, 254–266. [Google Scholar] [CrossRef]
  14. Ye, L.; Sun, H.B.; Song, X.R.; Li, L.C. Dynamic modeling of a hybrid wind/solar/hydro microgrid in EMTP/ATP. Renew. Energy 2012, 39, 96–106. [Google Scholar] [CrossRef]
  15. Motahhir, S.; El Hammoumi, A.; El Ghzizal, A. The most used MPPT algorithms: Review and the suitable low-cost embedded board for each algorithm. J. Clean. Prod. 2020, 246, 118983. [Google Scholar] [CrossRef]
  16. Robles Algarín, C.; Taborda Giraldo, J.; Rodriguez Alvarez, O. Fuzzy logic based MPPT controller for a PV system. Energies 2017, 10, 2036. [Google Scholar] [CrossRef]
  17. Bollipo, R.B.; Mikkili, S.; Bonthagorla, P.K. Hybrid, optimal, intelligent and classical PV MPPT techniques: A review. CSEE J. Power Energy Syst. 2020, 7, 9–33. [Google Scholar]
  18. Karami, N.; Moubayed, N.; Outbib, R. General review and classification of different MPPT Techniques. Renew. Sustain. Energy Rev. 2017, 68, 1–18. [Google Scholar] [CrossRef]
  19. Sumathi, V.; Jayapragash, R.; Bakshi, A.; Akella, P.K. Solar tracking methods to maximize PV system output—A review of the methods adopted in recent decade. Renew. Sustain. Energy Rev. 2017, 74, 130–138. [Google Scholar] [CrossRef]
  20. Subudhi, B.; Pradhan, R. A comparative study on maximum power point tracking techniques for photovoltaic power systems. IEEE Trans. Sustain. Energy 2012, 4, 89–98. [Google Scholar] [CrossRef]
  21. Podder, A.K.; Roy, N.K.; Pota, H.R. MPPT methods for solar PV systems: A critical review based on tracking nature. IET Renew. Power Gener. 2019, 13, 1615–1632. [Google Scholar] [CrossRef]
  22. Bendib, B.; Belmili, H.; Krim, F. A survey of the most used MPPT methods: Conventional and advanced algorithms applied for photovoltaic systems. Renew. Sustain. Energy Rev. 2015, 45, 637–648. [Google Scholar] [CrossRef]
  23. El Gouri, R.; Brahim, M.; Hlou, L. A Comparative Study of Mppt Technical Based on Fuzzy Logic and Perturb Observe Algorithms for Photovoltaic Systems. J. Theor. Appl. Inf. Technol. 2013, 58, 337–346. [Google Scholar]
  24. Rezk, H.; Eltamaly, A.M. A comprehensive comparison of different MPPT techniques for photovoltaic systems. Sol. Energy 2015, 112, 1–11. [Google Scholar] [CrossRef]
  25. Esram, T.; Chapman, P.L. Comparison of photovoltaic array maximum power point tracking techniques. IEEE Trans. Energy Convers. 2007, 22, 439–449. [Google Scholar] [CrossRef]
  26. Krishnaram, K.; Sivamani, S.; Alaas, Z.; Ahmed, M.; Senthilkumar, S.; Raj, S.A. Experimental design and analysis of advanced three phase converter for PV application with WCO-P&O MPPT controller. Sci. Rep. 2024, 14, 10984. [Google Scholar] [PubMed]
  27. Dolara, A.; Faranda, R.; Leva, S. Energy comparison of seven MPPT techniques for PV systems. J. Electromagn. Anal. Appl. 2009, 2009, 725. [Google Scholar] [CrossRef]
  28. Chen, P.-C.; Chen, P.-Y.; Liu, Y.-H.; Chen, J.-H.; Luo, Y.-F. A comparative study on maximum power point tracking techniques for photovoltaic generation systems operating under fast changing environments. Sol. Energy 2015, 119, 261–276. [Google Scholar] [CrossRef]
  29. Lagdani, O.; Trihi, M.; Bossoufi, B. PV array connected to the grid with the implementation of MPPT algorithms (INC, P&O and FL method). Int. J. Power Electron. Drive Syst. 2019, 10, 2084. [Google Scholar]
  30. Sharmin, R.; Chowdhury, S.S.; Abedin, F.; Rahman, K.M. Implementation of an MPPT technique of a solar module with supervised machine learning. Front. Energy Res. 2022, 10, 932653. [Google Scholar] [CrossRef]
  31. Manna, S.; Singh, D.K.; Akella, A.K.; Kotb, H.; AboRas, K.M.; Zawbaa, H.M.; Kamel, S. Design and implementation of a new adaptive MPPT controller for solar PV systems. Energy Rep. 2023, 9, 1818–1829. [Google Scholar] [CrossRef]
  32. Hassan, A.; Bass, O.; Masoum, M.A. An improved genetic algorithm based fractional open circuit voltage MPPT for solar PV systems. Energy Rep. 2023, 9, 1535–1548. [Google Scholar] [CrossRef]
  33. Hai, T.; Aksoy, M.; Nishihara, K. Optimized MPPT model for different environmental conditions to improve efficacy of a photovoltaic system. Soft Comput. 2024, 28, 2161–2179. [Google Scholar] [CrossRef]
  34. Mbarki, B.; Fethi, F.; Chrouta, J.; Zaafouri, A. Adaptive neuro-fuzzy inference system algorithm-based robust terminal sliding mode control MPPT for a photovoltaic system. Trans. Inst. Meas. Control 2024, 46, 316–325. [Google Scholar] [CrossRef]
  35. Chellakhi, A.; Beid, S.E.; Abouelmahjoub, Y. A novel theta MPPT approach based on adjustable step size for photovoltaic system applications under various atmospheric conditions. Energy Syst. 2024, 15, 89–114. [Google Scholar] [CrossRef]
  36. Ibrahim, O.; Yahaya, N.Z.; Saad, N.; Umar, M.W. Matlab/Simulink model of solar PV array with perturb and observe MPPT for maximising PV array efficiency. In Proceedings of the 2015 IEEE conference on energy conversion (CENCON), Johor Bahru, Malaysia, 19–20 October 2015; pp. 254–258. [Google Scholar]
  37. De Dieu Nguimfack-Ndongmo, J.; Harrison, A.; Alombah, N.H.; Kuate-Fochie, R.; Asoh, D.A.; Kenné, G. Adaptive terminal synergetic-backstepping technique based machine learning regression algorithm for MPPT control of PV systems under real climatic conditions. ISA Trans. 2024, 145, 423–442. [Google Scholar] [CrossRef]
  38. Yadav, I.; Sachan, S.; Gholian-Jouybari, F.; Maurya, S.K.; Hajiaghaei-Keshteli, M. A performance analysis of step-voltage and step-duty size-based MPPT controller used for solar PV applications. Soft Comput. 2024, 28, 7465–7479. [Google Scholar] [CrossRef]
  39. Kolakaluri, V.K.; Aalam, M.N.; Sarkar, V. Sampling Time Modulation of a Photovoltaic Power Tracking Controller Based upon Real-time Monitoring of Converter Dynamics. IEEE Trans. Power Electron. 2023, 39, 2822–2834. [Google Scholar] [CrossRef]
  40. Schmidt, H.; Burger, B.; Bussemas, U.; Elies, S. How fast does an MPP tracker really need to be? In Proceedings of the 24th European Photovoltaic Solar Energy Conference and Exhibition, Hamburg, Germany, 21–25 September 2009. [Google Scholar]
  41. Rojas, C.A.; Kouro, S.; Inzunza, R.; Mitsugi, Y.; Alcaide, A.M. Harmonic impedance model of multiple utility-interactive multilevel photovoltaic inverters. Energies 2022, 15, 9462. [Google Scholar] [CrossRef]
  42. de Jesus, V.M.R.; Cupertino, A.F.; Xavier, L.S.; Pereira, H.A.; Mendes, V.F. Comparison of MPPT strategies in three-phase photovoltaic inverters applied for harmonic compensation. IEEE Trans. Ind. Appl. 2019, 55, 5141–5152. [Google Scholar] [CrossRef]
  43. Hou, T.; Wang, S. Research on the MPPT of Photovoltaic Power Generation Based on the CSA-INC Algorithm. Energy Eng. 2023, 120, 87–106. [Google Scholar] [CrossRef]
  44. Manoharan, P.; Subramaniam, U.; Babu, T.S.; Padmanaban, S.; Holm-Nielsen, J.B.; Mitolo, M.; Ravichandran, S. Improved perturb and observation maximum power point tracking technique for solar photovoltaic power generation systems. IEEE Syst. J. 2020, 15, 3024–3035. [Google Scholar] [CrossRef]
  45. Ahmed, M.; Harbi, I.; Kennel, R.; Abdelrahem, M. Maximum Power Point Tracking Implementation under Partial Shading Conditions Using Low-Cost Photovoltaic Emulator. Eng 2022, 3, 424–438. [Google Scholar] [CrossRef]
  46. Soulatiantork, P. Experimental Performance Evaluation of P&O and IC MPPT Algorithms for Photovoltaic Systems under Constant and Variable Environmental Conditions. Int. J. Energy Eng. 2020, 10, 46–58. [Google Scholar]
  47. Soon, T.K.; Mekhilef, S. A fast-converging MPPT technique for photovoltaic system under fast-varying solar irradiation and load resistance. IEEE Trans. Ind. Inform. 2014, 11, 176–186. [Google Scholar] [CrossRef]
  48. Paulescu, E.; Paulescu, M. A Semi-Analytical Model for Separating Diffuse and Direct Solar Radiation Components. Appl. Sci. 2022, 12, 12759. [Google Scholar] [CrossRef]
  49. El Mghouchi, Y.; El Bouardi, A.; Choulli, Z.; Ajzoul, T. Models for obtaining the daily direct, diffuse and global solar radiations. Renew. Sustain. Energy Rev. 2016, 56, 87–99. [Google Scholar] [CrossRef]
  50. Li, Z.H.Y.; Zhang, X.S. Research on seakeeping performance of catamaran based on potential flow model. Ocean Eng. 2023, 41, 57–67. [Google Scholar]
  51. Niu, J. Research on Seakeeping Performance of Longitudinal Motion of SWATH Ship. Master’s Thesis, Dalian University of Technology, Dalian, Chian, 2021. [Google Scholar]
  52. Wang, B.Z.; Zhang, Y.F.; Chen, X.Y. Study on Characteristics of 30 kW PV system in ZHONGSHAN Station, Antarctica. Acta Energiae Solaris Sin. 2021, 42, 272–277. [Google Scholar]
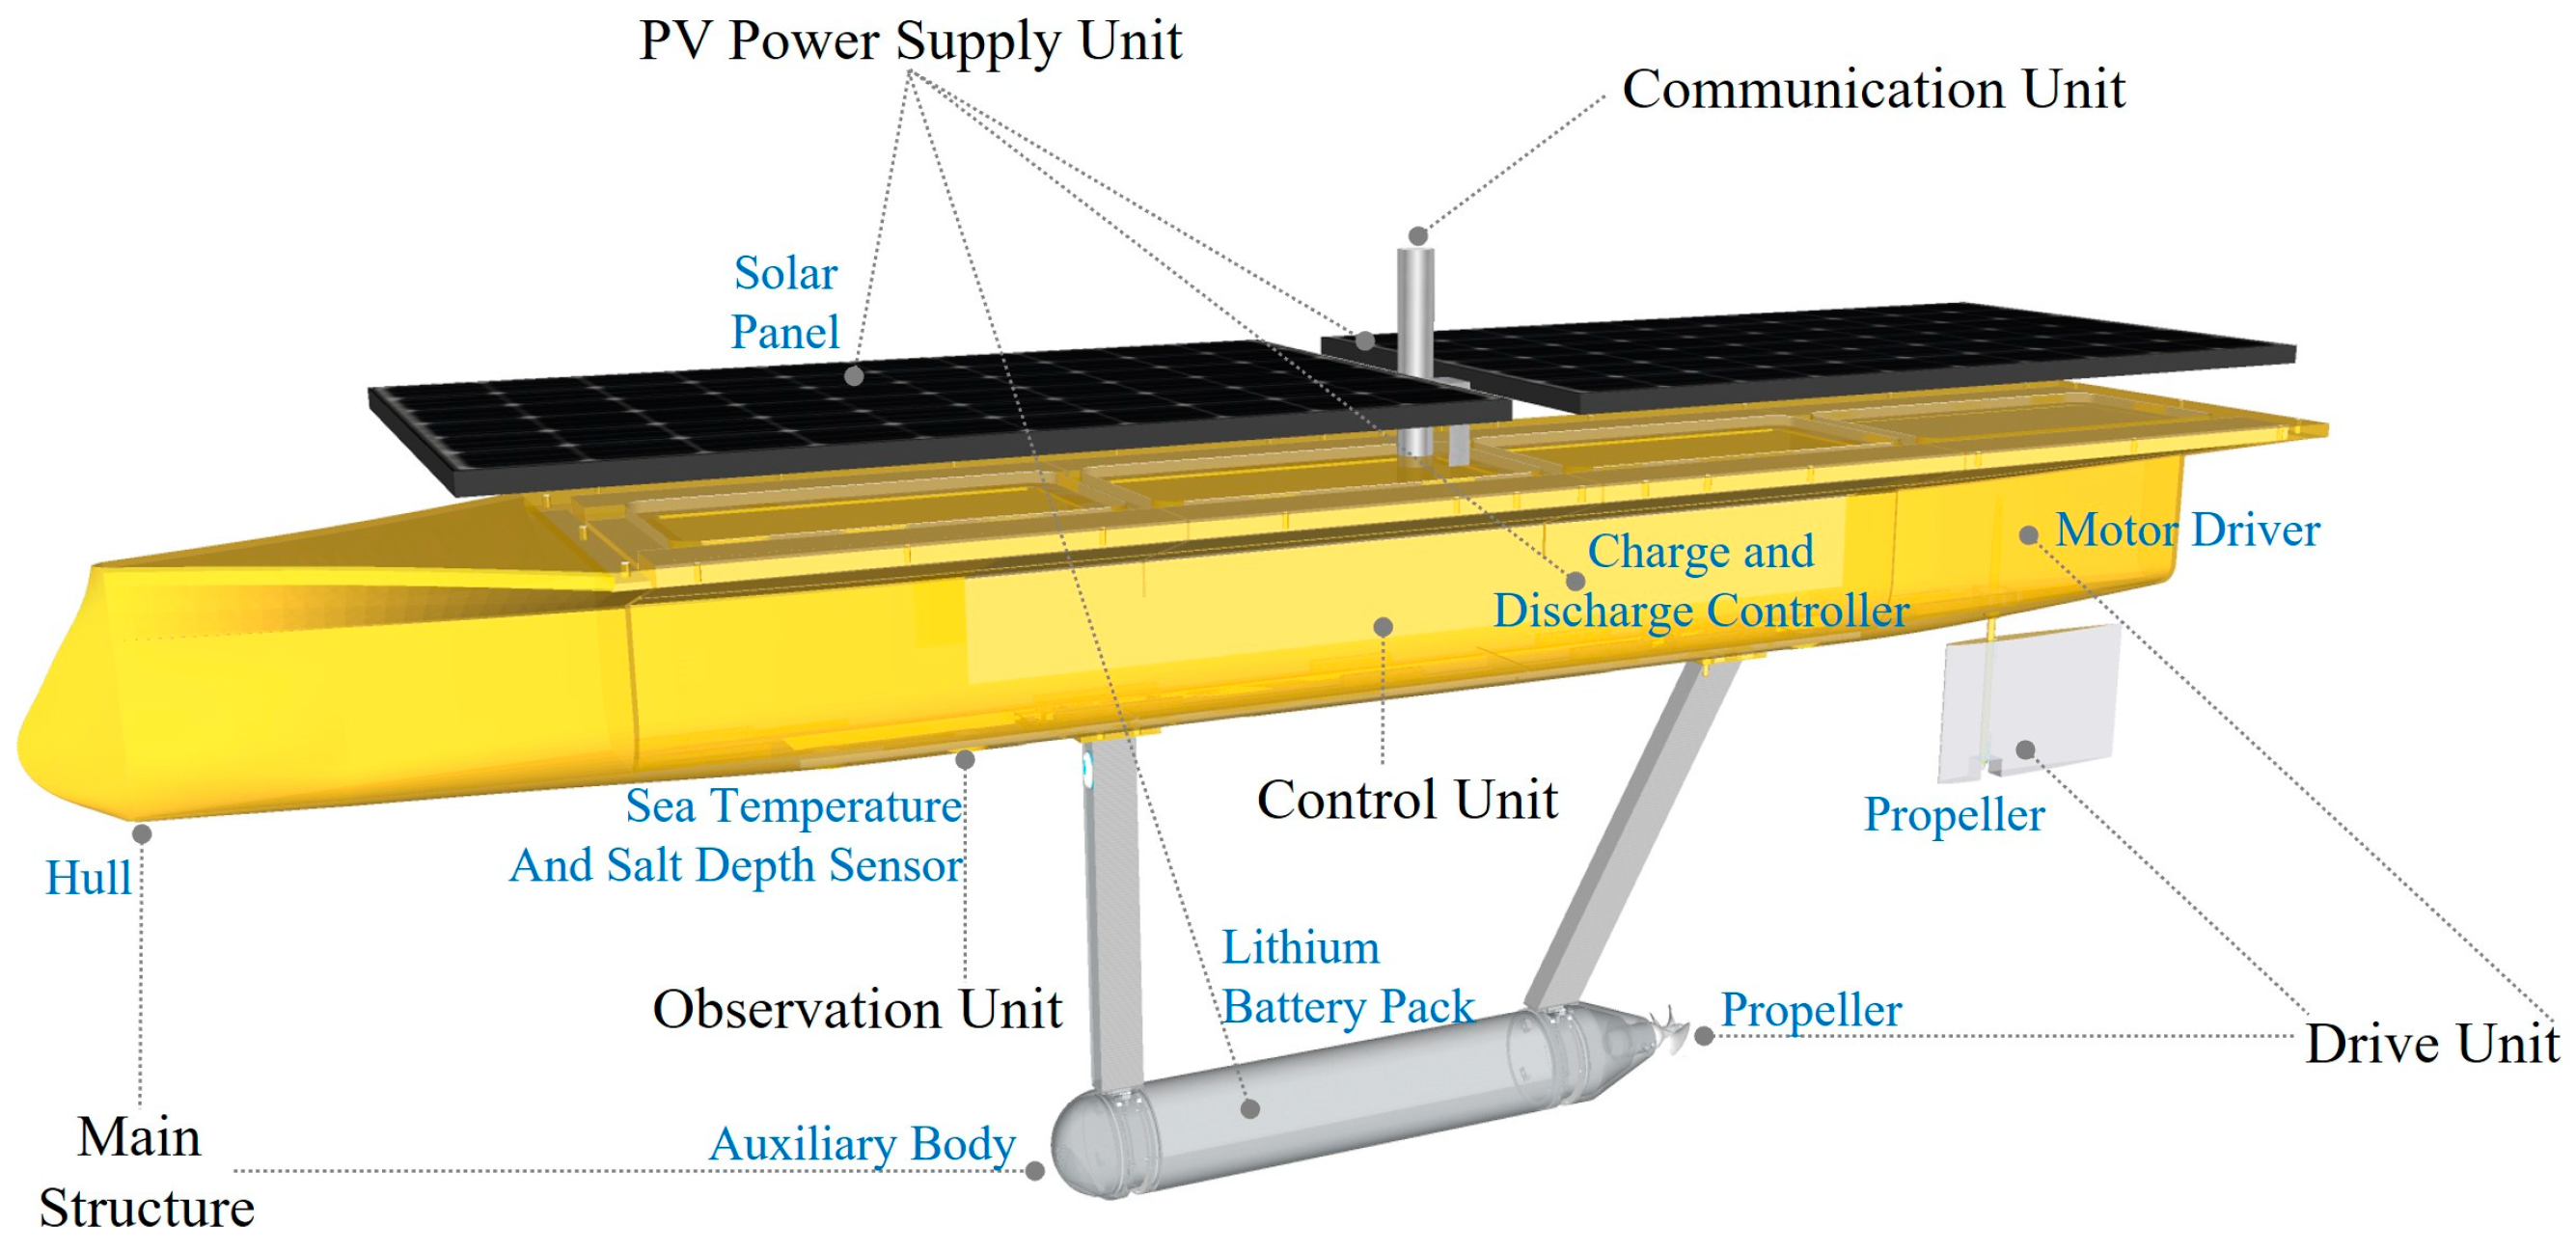
Figure 1. Small long-endurance USV.
Energies 17 03699 g001
Figure 2. USV irradiance calculation model.
Energies 17 03699 g002
Figure 3. USV hull discretized mesh diagram.
Energies 17 03699 g003
Figure 4. USV attitude angle coordinate system.
Energies 17 03699 g004
Figure 5. Field measurement of solar irradiance: (a) Horizontal observation; (b) Dip angle observation.
Energies 17 03699 g005
Figure 6. Measurement results and simulation results of Rb: (a) 2022.09.26, azimuth 0°, dip angle 16.5°; (b) 2022.09.29, azimuth 10°, dip angle 16.5°; (c) 2022.10.11, azimuth −10°, dip angle 13°; (d) 2022.11.04, azimuth −19°, dip angle 21.7°.
Energies 17 03699 g006
Figure 7. Simulation system diagram.
Energies 17 03699 g007
Figure 8. Test and verification of USV photovoltaic power generation simulation model: (a) The test device of USV Photovoltaic Power system; (b) Results of experimental and simulation.
Energies 17 03699 g008
Figure 9. USV hull attitude angle calculation results: (a) Wave direction 0°, pitch angle; (b) Wave direction 90°, roll angle; (c) Wave direction 45°, pitch angle; (b) Wave direction 45°, roll angle.
Energies 17 03699 g009
Figure 10. Changes in irradiance at a lower solar altitude angle: (a) Irradiance variation at 0° wave direction; (b) Irradiance variation at 45° wave direction; (c) Irradiance variation at 90° wave direction.
Energies 17 03699 g010
Figure 11. Changes in irradiance at a medium solar altitude angle (a) Irradiance variation at 0° wave direction; (b) Irradiance variation at 45° wave direction; (c) Irradiance variation at 90° wave direction.
Energies 17 03699 g011
Figure 12. Changes in irradiance at a higher solar altitude angle (a) Irradiance variation at 0° wave direction; (b) Irradiance variation at 45° wave direction; (c) Irradiance variation at 90° wave direction.
Energies 17 03699 g012
Figure 13. Irradiance on photovoltaic power generation devices.
Energies 17 03699 g013
Figure 14. Control effect of MPPT under wave influence at large solar altitude angles: (a) Simulation results of power generation; (b) Average power generation under different MPPT control frequencies; (c) High-frequency oscillation component of PV output power.
Energies 17 03699 g014
Figure 15. Control effect of MPPT under wave influence at medium solar altitude angles: (a) Simulation results of power generation; (b) Average power generation under different MPPT control frequencies; (c) High-frequency oscillation component of PV output power.
Energies 17 03699 g015
Figure 16. Control effect of MPPT under wave influence at small solar altitude angles: (a) Simulation results of power generation; (b) Average power generation under different MPPT control frequencies; (c) High-frequency oscillation component of PV output power.
Energies 17 03699 g016
Table 1. USV operating conditions.
Working
Condition
Speed/KnotSignificant Wave Height/mSpectrum Peak Period/sWave
Direction/deg
Wave
Condition
111.580Level 4
211.5845Level 4
311.5890Level 4
Disclaimer/Publisher’s Note: The statements, opinions and data contained in all publications are solely those of the individual author(s) and contributor(s) and not of MDPI and/or the editor(s). MDPI and/or the editor(s) disclaim responsibility for any injury to people or property resulting from any ideas, methods, instructions or products referred to in the content.