Abstract
In this study, the co-pyrolysis of sewage sludge (SS), two-component special municipal waste (SMW) and plastic waste (Plastic) was studied using thermogravimetric equipment and a scaled-up tubular reactor. During the experiments, the effects of the raw material composition and pyrolysis temperature on the decomposition processes, the product yields and compositions were investigated. It was found that co-pyrolysis was a series of complex reactions and resulted in more volatile and lower residue yield than the pyrolysis of the individual raw materials. In some cases (e.g., 25%SMW + 75%Plastic, 25%SS + 75%Plastic, 50%SS + 50%Plastic blends), it also caused a higher synthesis gas yield and H2/CO ratio. During the thermogravimetric analysis, the beneficial effects occurred at lower temperatures, but in the scaled-up experiments, these effects only prevailed at 900 °C as a result of the larger amount of raw materials and the worse heat transfer. The produced gases can be characterized by a lower heating value of 17.3–35 MJ/Nm3. Therefore, they can be used for energetic purposes; however, before chemical use, further quality improvement is needed due to the lower H2/CO ratios.
1. Introduction
The amount of annually generated sewage sludge is growing steadily as the population increases and the living standard improves [1]. Sewage sludge contains proteins, carbohydrates, lipids or fats, organic and inorganic compounds and various harmful materials (e.g., bacteria, viruses, polyaromatics, dioxins, furans, polychlorinated biphenyls, detergents, drug residues, body care products and synthetic steroids) [2]. Although nutrients and organic matters could be beneficial for the soil, the listed harmful components have serious socioeconomic and environmental impacts (e.g., accumulation to the environment, soil and natural water pollution) and necessitate the introduction of more feasible processes [3,4]. In addition, consumer concerns about the safety of food grown with sewage sludge can affect market acceptance and reduce the economic value of such crops. To reduce the harmful effects, pyrolysis seems to be a promising option [5,6]. During pyrolysis, the sludge is heated in an oxygen-free atmosphere and volatilization, dehydration, dehydrogenation, decarboxylation and pyrolysis of the heavier compounds take place, resulting in the formation of 5–40% gas, 16–40% liquid and 20–70% solid product [7,8,9,10,11]. In general, the gas product contains hydrogen (H2), carbon monoxide (CO), carbon dioxide (CO2), methane (CH4), and heteroatom-containing compounds; therefore, it is most often used for heat and electricity generation. However, after purification and adjustment of the H2/CO ratio, it can also be used as raw material for the well-known Fischer–Tropsch or methanol synthesis [12]. The sewage sludge-derived pyrolysis oil is a dark brown or black colored, viscous, corrosive organic liquid [13]. It contains hundreds of organic compounds (n-alkanes, n-alkenes, mono-, di-, and polyaromatics), nitrogen-containing molecules (e.g., nitriles, amines, amides, heterocyclic nitrogen compounds) and oxygenates (e.g., carboxylic acids, ketones, esters and steroids) [14]. The increased oxygen and nitrogen concentration in sewage-sludge-derived pyrolysis oil reduces the calorific value and energy density, and it also lowers the oil stability [15,16], which can only be improved by hydrogenation [17]. However, hydrogenation requires the usage of a relatively high temperature and pressure, and a significant amount of hydrogen is also consumed, of which petroleum refineries usually do not have a surplus [18,19]. The char contains a substantial amount of heavy metals which must be stabilized or transformed into more stable fractions before the use as a soil amendment [20,21]. This is particularly attractive, because the char contains useful nutrients for the soil (e.g., nitrogen, organic carbon, phosphorus and potassium) and can promote the plant growth [22]. In addition, it can also be used as a sorbent in wastewater treatment [23]. However, in this case, it is inevitable to enhance the adsorption capacity and to create the adequate functional groups on the surface [24].
Although sewage sludge pyrolysis has some advantages, the product quality is far from adequate [25]. However, co-pyrolysis can be a promising way to influence decomposition reactions, modify the product structure in a more favorable direction and reduce the requirement or the extent of upgrading processes [26]. Based on these facts, it is a very popular research topic nowadays. Several research groups have reported results about the co-pyrolysis of sewage sludge and lignocellulosic biomass. Wang et al. [27] pyrolyzed sewage sludge, wheat straw and their mixtures in a thermogravimetric analyzer and a fixed-bed reactor. The research focused on the effects of the percentage of wheat straw in wheat straw–sewage sludge mixtures on product distributions and gas composition. During the co-pyrolysis, synergistic effects prevailed and pyrolysis reactions also became faster. These effects resulted in higher gas and liquid product yields with a decreasing amount of char. It is important to highlight that the required heat of co-pyrolysis was also lower than for the pyrolysis of sewage sludge and wheat straw alone. Zhang et al. [28] used a vacuum reactor for the pyrolysis of sewage sludge, rice husk and their blend (T = 900 °C). In the co-pyrolysis experiments, a synergistic effect on gas production was observed, and H2/CO ratios and lower heating values were also improved. The higher gas yields and lower heating values were attributed to the more intense CO2-char and H2O-char gasification. Similar findings were made by Zhu et al. [29], who also highlighted that reforming reactions became more significant when wet sewage sludge is used. In addition to the improved gas product formation, co-pyrolysis can also reduce the amount of oxygenated compounds by 46–93% [30]. Further benefit was that co-pyrolysis (raw material: sewage sludge and rice husk) increased the carbon content of the solid residue and immobilized heavy metals in char samples [31].
In some cases, sewage sludge was co-pyrolyzed with polyolefin. Ling and Li [32] carried out thermogravimetric co-pyrolysis experiments with sewage sludge–polypropylene (PP) and sewage sludge–high-density polyethylene (HDPE) mixtures at different mixing ratios and heating rates. The results indicated that synergistic interactions took place between H-radicals of PP/HDPE and oxygenated intermediates of sewage sludge; therefore, the volatile conversion and degradation rates became higher, and the activation energies decreased. Zaker et al. [33] also confirmed the synergistic effect of low-density polyethylene on sewage sludge pyrolysis. It is important to highlight that real plastic waste contains not only polyolefin but also other plastics such as polyethylene terephthalate, polystyrene etc., which can influence the decomposition processes in different ways. Nevertheless, there is practically no information available on the co-pyrolysis of real plastic waste with sewage sludge. Some research groups also published results about the co-pyrolysis of ternary mixtures of waste materials. For example, Azizi et al. [34] investigated the degradation behavior of microalgae, wood and scrap tire containing blends in a temperature range of 25–600 °C applying a heating rate of 10–40 °C/min. Meanwhile, Batuer et al. [35] co-pyrolyzed paper, plastic and textile blends in order to determine the optimal blending ratios. However, to the best of our knowledge, no results have been published on the co-pyrolysis of sewage sludge, two-component special municipal waste and waste plastic, even though the cost of waste shorting could also be significantly reduced this way. Therefore, further studies are needed, including the proper blending and operating conditions to make the process available for commercial purposes. Based on the aforementioned, in this study, the co-pyrolysis of sewage sludge (SS), two-component special municipal waste (SMW) and plastic waste (Plastic) was studied in a thermogravimetric equipment and a scaled-up tubular reactor. During the experiments, effects of the raw material composition and pyrolysis temperature were investigated on the decomposition processes, the product yields and compositions.
2. Materials and Methods
2.1. Raw Materials
SS was originated from a Hungarian municipal wastewater treatment plant and dried to mass constancy at 110 °C before the experiments. Municipal solid waste was also used as raw material, which was separated into fractions of 2–4 cm by an optical sorter. After the sorting, SMW and Plastic were isolated and ground by a DM 200 type disc mill (Retsch) to a particle size of 200 µm.
SS had a moisture content of 0.6% and was characterized by 47.5% volatile and 51.9% ash content [36]. The moisture, volatile and ash content of SMW was 4.7, 65.8 and 29.5% and the same characteristics of the Plastic were 2.6, 80.0 and 17.4%. The municipal sourced SMW contained 41% of textile and 59% of paper, while the main constituents of Plastic were 59.2% polypropylene (PP), 29.6% polyvinyl chloride (PVC), 5.3% high-density polyethylene (HDPE), 3.0% polyethylene terephthalate (PET) and 3.0% polyurethane (PUR). The results of elemental analysis of the raw materials can be seen in Table 1. According to data, the carbon content of the raw materials was 31–39%, and oxygen + other elements (e.g., Si, Ca, Al, Fe, K and P) were present in a concentration of 53–59%. Interestingly, Plastic contained only 39% of carbon, which could be attributed to the fact that the real plastic waste was significantly contaminated with soil.

Table 1.
Elemental analysis of the raw materials.
2.2. Pyrolysis Process
The thermogravimetric experiments were performed by a thermogravimetric analyzer (TG 209 F1 Libra, NETZSCH) in a temperature range of 30–900 °C. For each experiment, about 4 mg of sample was used, and a nitrogen flow of 20 mL/min was set to maintain the inert atmosphere. The heating rate was 25 °C/min, and all experiments were repeated three times to obtain the average results and plot the TG curves.
The scaled-up experiments were carried out in a horizontal tubular reactor (Figure 1) using 4.0 g of raw material at a temperature of 500 and 900 °C and also repeated three times. During the experiments, an argon flow of 20 mL/min was used to maintain an inert atmosphere, and the heating rate was 25 °C/min. The reaction time was 30 min after the pre-heating period. As Figure 1 shows, the reaction system was also equipped with a mist eliminator and a silica gel-filled tube to condense the vapors leaving the reactor and remove the moisture from the produced gas. The gas product was collected in a gas bag, and product yields were estimated by a simple mass balance difference.
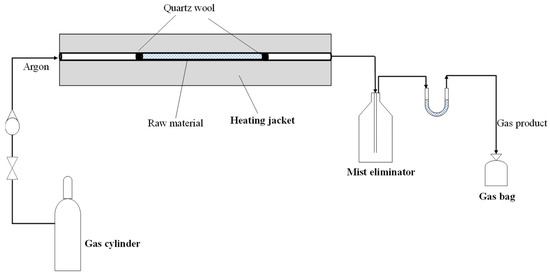
Figure 1.
Experimental apparatus.
2.3. Analysis
The moisture, volatile and ash content of the raw materials was determined by thermogravimetric analysis (TG 209 F1 Libra, Netzsch) in a temperature range of 30–900 °C (heating rate: 25 °C/min). The C, H, N, S contents were measured by a Carlo Erba type elemental analyzer, and the oxygen+other element contents were determined by the difference.
For determination of the constituents of the Plastic, a representative amount of Plastic fraction was analyzed by a Tensor 27 type FTIR spectrometer (4000–400 cm−1 wavenumber range, germanium crystal, room temperature, 32 scans and resolution of 3 cm−1), and each particle was weighted using a laboratory scale. The identification of each particle was performed by using spectral databases. The numerical composition was determined by dividing the weight of each fraction that was identified with the total weight of the representative sample. The composition of the municipal solid waste sourced SMW was also determined by weight measurement.
The gas product of the scaled-up experiments was analyzed by a DANI type gas chromatograph using flame ionization and thermal conductivity detectors (FIDs and TCDs). The equipment contained two columns (Rtx-1 PONA (100 m × 0.25 mm × 0.5 µm) and Carboxen TM 1006 PLOT (30 m × 0.53 mm)). In case of the PONA column, isothermal conditions and 230 °C of injector and detector temperature was applied. For the Carboxen TM 1006 PLOT column, the applied heating program used was 35 °C for 18 min, heating to 120 °C with a heating rate of 15 °C/min and held at 120 °C for 2 min. The retention times of the components were determined using gas mixtures and individual components. Based on the results of gas chromatographic analysis, a lower heating value (LHV) of the produced gases was calculated using (Equation (1)), where [H2], [CO], [CH4] and [C2–5] are the molar fractions of H2, CO, CH4 and C2–5 hydrocarbons in the gas product.
LHV [MJ/Nm3] = 10.78 MJ/Nm3 × [H2] + 12.63 MJ/Nm3 × [CO] + 35.88 MJ/Nm3 × [CH4] + 70 MJ/Nm3 × [C2–5]
2.4. Calculation Methods
In order to quantify the effects of SMW and/or Plastic addition, calculated TG values and synthesis gas yields were determined. The calculated TG values were obtained using the equation given as Equation (2), where x refers to the ratio of the corresponding individual raw material in the blend. TGSS, TGSMW and TGPlastic represent the experimental values from individual SS, SMW and Plastic degradation.
TGcalculated = xSS ∗ TGSS + xSMW ∗ TGSMW + xPlastic ∗ TGPlastic
The calculated synthesis gas yields were obtained using the equation given as Equation (3), where x refers to the ratio of the corresponding individual raw material in the blend and YSS, YSMW and YPlastic represent the experimental synthesis gas yield of SS, SMW and Plastic degradation.
Synthesis gas yield calculated = xSS ∗ YSS + xSMW ∗ YSMW + xPlastic ∗ YPlastic
3. Results
3.1. Thermogravimetric Experiments
The main aim of the TG experiments was to investigate the thermal behavior of individual raw materials and their mixtures. As Figure 2A–D show, SS, SMW, Plastic and their mixtures had different decomposition behavior, which was attributed to the different compositions and the complex degradation processes. The decomposition of SS took place in three steps. In the first step (up to 200 °C), dehydration and decomposition of the bonded hydrated compounds took place, as also pointed out by Kan et al. [37]. The main decomposition and thus the major mass loss (~38%) were observed between 200 and 600 °C. In temperature range of 200–400 °C, the biodegradable compounds (e.g., polysaccharides) were decomposed, and between 400 and 600 °C, the higher molecular weight, less reactive compounds (e.g., carbohydrates) were degraded. The last decomposition step started above 600 °C and was mainly due to the decomposition of inorganic compounds. It was accompanied by a mass loss rate of 10%, and the final residue of SS was approximately 52%. Similar to SS, the main decomposition reactions took also place in the temperature range of 200–600 °C in case of Plastic and SMW. The decomposition of SMW (containing mainly paper and textile) took also place up to 600 °C with weight loss of 56%, and the complex reactions resulted in ~30% of the final residue. In the case of Plastic, strong degradation and approximately 50% of weight loss was observed between 400 and 600 °C. As it was highlighted before, the Plastic composed 59.2% of PP, 29.6% of PVC, 5.3% of HDPE, 3.0% of PET and 3.0% of PUR. According to the main structure and side groups, polymers have different behaviors in thermo- or thermochemical degradation processes. For example, the degradation of PVC and PUR took place in a temperature range of 300–400 °C. Regarding the degradation temperature of PP, it can be said that the decomposition generally starts at 350 °C and completes at 450–500 °C. In case of HDPE, a slightly higher initial decomposition temperature (~450 °C) is required, and to decompose the PS and the PET, 450–500 and 350–550 °C is necessary [38,39]. As a result, the weight loss in the temperature range of 200–400 °C (~23%) can be attributed to the decomposition of the PVC, PUR, and the first degradation step of PP. The definite peak between 400 and 600 °C was the result of the degradation of the PP, HDPE, PS and the PET.
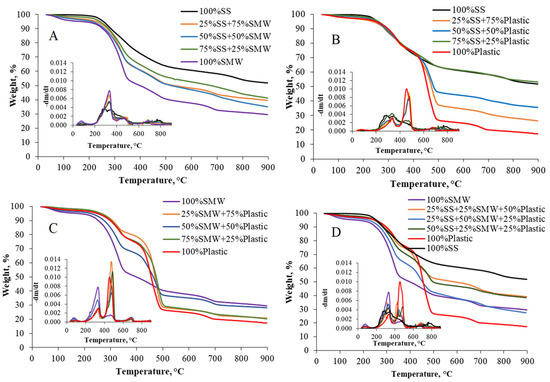
Figure 2.
TG and derivative TG (DTG) curves of individual raw materials and their mixtures (SS = sewage sludge, SMW = two-component special municipal waste, Plastic = plastic waste, (A): SS + SMW blends, (B): SS + Plastic blends, (C): SMW + Plastic blends, (D): Ternary mixtures).
To quantify the effects of SMW and/or Plastic addition, experimental and calculated TG values were also compared. As Figure 3A–D depict, practically, there were no deviations between the experimental and calculated TG values between 30 and 200 °C, because only dehydration reactions took place in this range. However, at higher temperatures, more significant differences have already occurred. The calculated values of mass loss of 75%SS + 25%SMW and 50%SS + 50%SMW raw material blends were lower than the experimental values (Figure 3A), proving that SMW addition had a beneficial effect on SS pyrolysis up to 50% concentration. In general, the effect of Plastic addition on SS was inhibitive (Figure 3B), but in the case of the 25%SS + 75%Plastic blend, a synergistic effect was observed up to 500 °C. From the point of view of SMW/Plastic blends, it can be said that the beneficial effects were present in case of 75%SMW + 25%Plastic and 25%SMW + 75%Plastic raw materials and only above 500 °C (Figure 3C). In experiments, which were carried out with the ternary mixtures, each of the calculated mass loss values was higher than the experimental value; i.e., inhibitive effects prevailed in the total temperature range (Figure 3D).
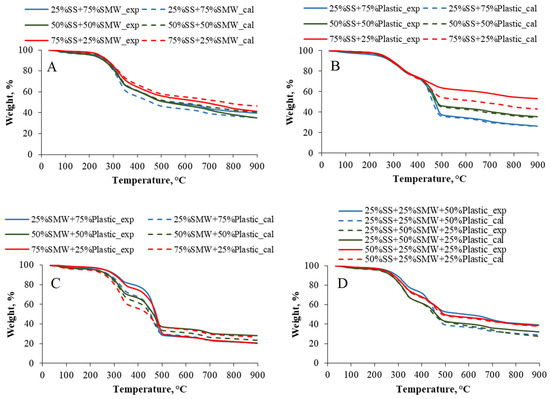
Figure 3.
Experimental and calculated TG curves of the blends ((A): SS + SMW blends, (B): SS + Plastic blends, (C): SMW + Plastic blends, (D): Ternary mixtures).
3.2. Scaled-Up Experiments
In order to justify the results of the TG analysis, the scaled-up experiments were carried out at temperatures of 500 and 900 °C. At 500 °C, 35.9–66.5% gaseous product was formed, while the gas yields were in the range of 41.2–74.6% at 900 °C (Figure 4A–D). During the scaled-up experiments, no detectable amount of liquid product was identified, which was attributed to the design and layout of the tubular reactor. As expected, gas product yields increased with the reaction temperature, and the amount of the so-called char varied along the opposite trend. These tendencies were attributed to the lower thermal stability of components at higher temperatures and to the higher degree of devolatilization and secondary reactions [40]. The product yields were also affected by the raw materials. As the data show, SMW and Plastic addition increased the gas yields and decreased the amount of the final residues. The reason for this is the higher carbon and hydrogen content of the mentioned raw materials as well as the higher heating value, which results in different thermal decomposition profiles compared to sewage sludge [41]. In addition, the higher heat release from Plastic and SMW decomposition can provide the necessary thermal energy to drive the endothermic reactions of sewage sludge pyrolysis, improving the overall energy efficiency and increasing gas yields. SMW and Plastic addition can also improve the gas yields and accelerate the degradation reactions. In addition, the interaction between the decomposition products of SMW, Plastic and sewage sludge can lead to intermediate reactions that enhance the overall process. Other than the reasons listed, the higher gas and lower residue yields observed during the co-pyrolysis can be attributed to the higher reactivity of tertiary carbon atoms present in PP, HDPE, PVC, PUR and PET [42], while in case of SMW-containing blends, the tendency was the result of the lower thermal stability of paper and textile [43].
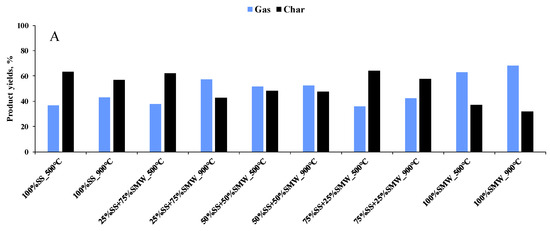
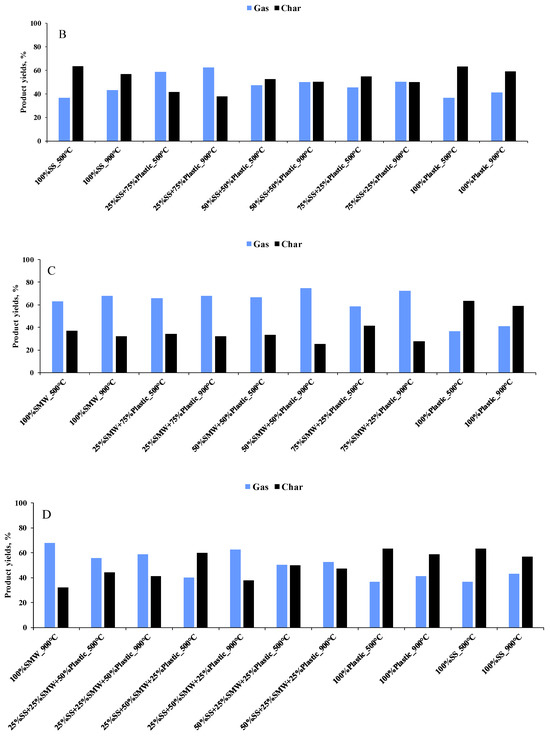
Figure 4.
Product yields of scaled-up experiments ((A): SS + SMW blends, (B): SS + Plastic blends, (C): SMW + Plastic blends, (D): Ternary mixtures).
The composition of gases (Figure 5A–D) was determined by gas chromatography. Based on the results, it can be seen that there were clear differences in the gas composition depending on the temperature. During the thermal degradation, H2, CO, CO2, CH4 and C2–C5 hydrocarbons were formed. At 500 °C, 4.3–22.3% H2 was obtained, while the concentration of CO, CO2, CH4 and C2–C5 hydrocarbons was in the range of 7.3–36.3, 31.3–54.5, 3.3–5.8 and 15.5–44.9%, respectively. As the temperature increased, the formation of synthesis gas was more significant: the content of H2 (18.0–33.0%) and CO (25.0–46.0%) increased, while CO2 and C2–C5 hydrocarbon contents (15.3–24.8 and 8.7–27.1%) decreased. These facts confirmed that pyrolysis had a series of complex reactions. The higher H2 and CO, and lower CO2 and C2–C5 hydrocarbon contents, can be attributed to the fact that at higher reaction temperatures, Boudouard reactions become more favorable and larger hydrocarbons (C2–C5) tend to thermally crack into smaller molecules [44]. According to the Le Chatelier’s principle, increasing the temperature shifts the product equilibrium of endothermic reactions toward the production of more products. In the context of pyrolysis, this means that more H2 and CO is produced, while CO2 and larger hydrocarbons are consumed or decomposed [45]. As the temperature increases, CO2 can react with carbon to produce CO via the Boudouard reaction, reducing the carbon dioxide content in the synthesis gas [46].
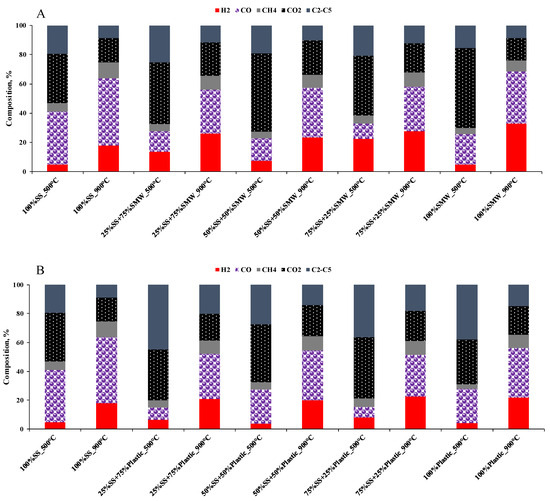
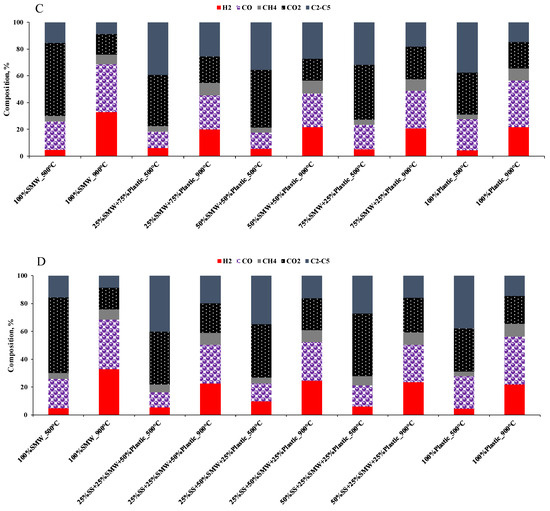
Figure 5.
Gas composition of the scaled-up experiments ((A): SS + SMW blends, (B): SS + Plastic blends, (C): SMW + Plastic blends, (D): Ternary mixtures).
The gas composition was also influenced by the composition of the raw material. In general, SMW and/or Plastic addition to sewage sludge increased the H2 content and reduced the amount of CO and CO2. The reason for this is that SMW and/or Plastic containing sewage sludge blends already contained more H2 than sewage sludge itself, and the higher thermal decomposition and more efficient cracking may have also contributed to the reduction in CO2 concentration (Figure 5A,B). In those cases, when SMW + Plastic blends and the ternary mixtures were pyrolyzed (Figure 5C,D), the same tendency occurred; however, the highest H2 formation was observed during the pyrolysis of the 25%SS + 50%SMW + 25%Plastic blend.
In order to further investigate the effect of SMW and/or Plastic addition, experimental and calculated synthesis gas yields (Figure 6A–D), H2/CO ratios and lower heating values of the obtained gases (Table 2) have also been determined. As Figure 6A–D depict, synthesis gas yields were influenced by SMW and Plastic waste blending, but the synergistic effects—where the blending of raw materials resulted in higher synthesis gas production than the calculated value—practically prevailed at 900 °C only in case of SMW-containing plastic (25%SMW + 75%Plastic, Figure 6C) mixtures and plastic waste containing SS blends (25%SS + 75%Plastic, 50%SS + 50%Plastic, Figure 6B). The higher temperature, which was necessary for the emergence of the synergistic effects, was attributed to the higher amount of the raw materials and the worse heat transfer, which resulted in decreased gas–solid and/or gas–gas interactions during the devolatilization, the liquid–liquid and/or gas–gas interactions during the condensation and the deceleration of the decomposition process [47].
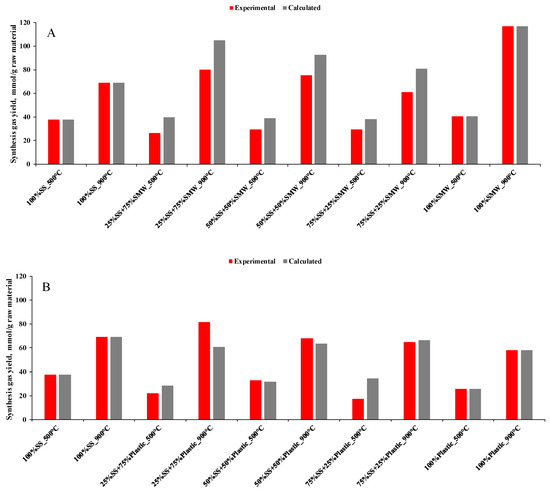
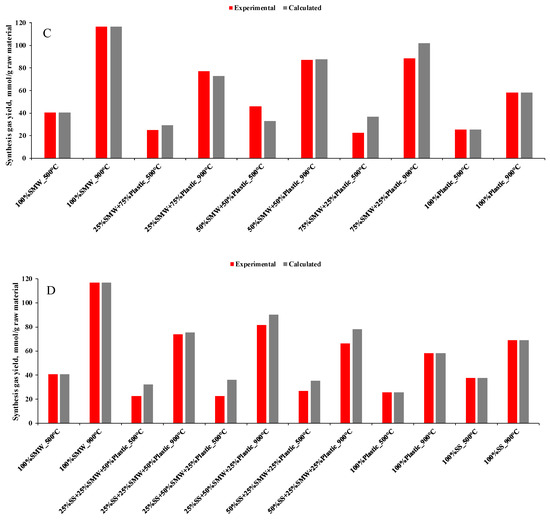
Figure 6.
Experimental and calculated synthesis gas yields ((A): SS + SMW blends, (B): SS + Plastic blends, (C): SMW + Plastic blends, (D): Ternary mixtures).

Table 2.
H2/CO ratios and LHVs of the produced gases.
The H2/CO ratios of the gases (Table 2) were mainly present in the range of 0.1–1.0, confirming that further quality improvement is needed prior to their use for chemical synthesis (e.g., cobalt catalyzed low-temperature Fischer–Tropsch or methanol, which has a theoretical H2/CO ratio of 2). From the point of view of energetic purpose utilization, the heating value is the most important property. The lower heating values of the gases varied between 16.8 and 32.1 MJ/Nm3. Although the addition of SMW and Plastic to the raw material generally resulted in higher LHVs, the highest increase was observed in cases where the proportion of the Plastic was 75% in the raw material blend. The increasing SMW content influenced the heating values oppositely. This effect can be attributed to the lower share of C2–C5 hydrocarbons and the fact that C2–C5 hydrocarbons have significantly higher heating value than hydrogen and carbon monoxide. Based on the aforementioned, it can be said that the pyrolysis of 25%SS + 75%Plastic, 25%SMW + 75%Plastic and 25%SS + 25%SMW + 50%Plastic mixtures resulted in gas products that can be advantageously used for energetic purposes.
During the scaled-up experiments, 25.4–63.4% solid product was formed. According to the International Biochar Initiative, solid products obtained in the co-pyrolysis experiments can be considered as biochar, because their C content was higher than 10% (Table 3) [48]. However, in order to determine the possible application, it is inevitable to evaluate the relation between some elements such as carbon to nitrogen (C/N) and hydrogen to carbon (H/C). The C/N ratio could be a positive parameter to determine the microbial activity and the possibility for application as a soil improver. In addition, the H/C ratio can also be an important parameter used to understand the reactions taking place in the co-pyrolysis. As the atomic ratios show, pyrolysis changed the chemical compositions by detachment of the functional groups. Due to the detachment of these groups, the S and N contents became lower, and as a result of CO, CO2 and CH4 formation, the carbon contents also decreased.

Table 3.
Elemental analysis of the solid residue.
4. Conclusions
In this study, sewage sludge (SS), two-component special municipal waste (SMW), plastic waste (Plastic) and their two- or three-component containing mixtures were pyrolyzed in a thermogravimetric equipment and a scaled-up tubular reactor. Based on the results, it was found that co-pyrolysis was advantageous and resulted in the formation of more volatiles and lower amount of residues. In the studied temperature range, synergistic effects also occurred, which were primarily manifested in higher weight loss than that calculated in the thermogravimetric analysis. During the thermogravimetric analysis, the beneficial effect prevailed by the following raw material blends: 50%SS + 50%SMW, 75%SS + 25%SMW, 25%SS + 75%Plastic, 75%SMW + 25%Plastic and 25%SMW + 75%Plastic. However, these beneficial effects only occurred in the scaled-up experiments at 900 °C, and in the case of SMW-containing plastic mixture (25%SMW + 75%Plastic) and plastic waste containing SS blends (25%SS + 75%Plastic, 50%SS + 50%Plastic). The produced gases can be used for energetic purposes, but before the chemical use, further quality improvement is needed due to the lower H2/CO ratios.
Author Contributions
Conceptualization, S.T. and N.M.; Formal analysis, S.T.; Investigation, S.T.; Methodology, S.T. and N.M.; Supervision, N.M.; Validation, S.T.; Visualization, S.T.; Writing—original draft, S.T. and N.M.; Revision of the manuscript, S.T and N.M.; All authors have read and agreed to the published version of the manuscript.
Funding
This project (2019-2.1.13-TÉT_IN-2020-00071) was financed by the Ministry of Innovation and Technology from the National Research Development and Innovation Fund, within the 2019-2.1.13-TÉT_IN program. This work has been implemented by the TKP2021-NKTA-21 project with the support provided by the Ministry for Innovation and Technology of Hungary from the National Research, Development and Innovation Fund, financed under the 2021 Thematic Excellence Programme funding scheme.
Data Availability Statement
The original contributions presented in the study are included in the article, further inquiries can be directed to the corresponding author.
Conflicts of Interest
The authors declare no conflicts of interest.
Abbreviations/Acronyms
| DTG | derivative thermogravimetric |
| FID | flame ionization detector |
| HDPE | high-density polyethylene |
| LDPE | low-density polyethylene |
| PET | polyethylene terephthalate |
| PP | polypropylene |
| PUR | polyurethane |
| PVC | polyvinylchloride |
| SMW | two-component special municipal waste |
| SS | sewage sludge |
| TCD | thermal conductivity detector |
| TG | thermogravimetric |
References
- Lee, S.; Kim, Y.-M.; Siddiqui, M.Z.; Park, Y.-K. Different pyrolysis kinetics and product distribution of municipal and livestock manure sewage sludge. Environ. Pollut. 2021, 285, 117197. [Google Scholar] [CrossRef] [PubMed]
- Fytili, D.; Zabaniotou, A. Utilization of sewage sludge in EU application of old and new methods—A review. Renew. Sustain. Energy Rev. 2008, 12, 116–140. [Google Scholar] [CrossRef]
- Lamastra, L.; Suciu, N.A.; Trevisan, M. Sewage sludge for sustainable agriculture: Contaminants’ contents and potential use as a fertilizer. Chem. Biol. Technol. Agric. 2018, 5, 10. [Google Scholar] [CrossRef]
- López, A.; Rodrígez-Chueca, J.; Mosteo, R.; Gómez, J.; Ormad, M.P. Microbiological quality of sewage sludge after digestion treatment: A pilot scale case of study. J. Clean. Prod. 2020, 254, 120101. [Google Scholar] [CrossRef]
- Naqvi, S.R.; Tariq, R.; Hameed, Z.; Ali, I.; Naqvi, M.; Chen, W.-H.; Ceylan, S.; Rashid, H.; Ahmad, J.; Taqvi, S.A.; et al. Pyrolysis of high ash sewage sludge: Kinetics and thermodynamic analysis using Coats-Redfern method. Renew. Sustain. Energy Rev. 2009, 131, 854–860. [Google Scholar] [CrossRef]
- Liu, H.; Xu, G.; Li, G. Pyrolysis characteristic and kinetic analysis of sewage sludge using model-free and master plots methods. Process. Saf. Environ. Prot. 2021, 149, 48–55. [Google Scholar] [CrossRef]
- Gao, N.; Li, J.; Qi, B.; Li, A.; Duan, Y.; Wang, Z. Thermal analysis and products distribution of dried sewage sludge pyrolysis. J. Anal. Appl. Pyrolysis 2014, 105, 43–48. [Google Scholar] [CrossRef]
- Nowicki, L.; Ledakowicz, S. Comprehensive characterization of thermal decomposition of sewage sludge by TG–MS. J. Anal. Appl. Pyrolysis 2014, 110, 220–228. [Google Scholar] [CrossRef]
- Syed-Hassan, S.S.A.; Wang, Y.; Hu, S.; Su, S.; Xiang, J. Thermochemical processing of sewage sludge to energy and fuel: Fundamentals, challenges and considerations. Renew. Sustain. Energy Rev. 2017, 80, 888–913. [Google Scholar] [CrossRef]
- Liu, Y.; Lin, R.; Man, Y.; Ren, J. Recent developments of hydrogen production from sewage sludge by biological and thermochemical process. Int. J. Hydrogen Energy 2019, 44, 19676–19697. [Google Scholar] [CrossRef]
- Mosko, J.; Pohorely, M.; Skoblia, S.; Beno, Z.; Jeremias, S. Detailed analysis of sewage sludge pyrolysis gas: Effect of pyrolysis temperature. Energies 2020, 13, 4087. [Google Scholar] [CrossRef]
- Gao, N.; Kamran, K.; Quan, C.; Williams, P.T. Thermochemical conversion of sewage sludge: A critical review. Prog. Energy Combust. Sci. 2020, 79, 100843. [Google Scholar] [CrossRef]
- Ighalo, J.O.; Iwuchukwu, F.U.; Eyankware, O.E.; Iwuozor, K.O.; Olotu, K.; Bright, O.C.; Igwegbe, C.A. Flash pyrolysis of biomass: A review of recent advances. Clean Technol. Environ. Policy 2022, 2, 2349–2363. [Google Scholar] [CrossRef]
- Gao, N.; Quan, C.; Liu, B.; Li, Z.; Wu, C.; Li, A. Continuous pyrolysis of sewage sludge in a screw-feeding reactor: Products characterization and ecological risk assessment of heavy metals. Energy Fuels 2017, 31, 5063–5072. [Google Scholar] [CrossRef]
- Xin, C.; Zhao, J.; Ruan, R.; Addy, M.M.; Liu, S.; Mu, D. Economical feasibility of bio-oil production from sewage sludge through pyrolysis. Thermal Sci. 2018, 22, 459–467. [Google Scholar] [CrossRef]
- Kim, Y.; Parker, W. A technical and economic evaluation of the pyrolysis of sewage sludge for the production of bio-oil. Bioresour. Technol. 2008, 99, 1409–1416. [Google Scholar] [CrossRef] [PubMed]
- Haghighat, M.; Majidian, N.; Hallajisani, A.; Samipourgiri, M. Production of bio-oil from sewage sludge: A review on the thermal and catalytic conversion by pyrolysis. Sustain. Energy Technol. Assess. 2020, 42, 100870. [Google Scholar] [CrossRef]
- Tomasek, S.; Bárkányi, Á.; Egedy, A.; Miskolczi, N. Model-based determination of optimal operating parameters for different solid waste gasification. Chem. Eng. J. Adv. 2024, 17, 100586. [Google Scholar] [CrossRef]
- Umana, B.; Shoaib, A.; Zhang, N.; Smith, R. Integrating hydroprocessors in refinery hydrogen network optimisation. Appl Energy 2014, 133, 169–182. [Google Scholar] [CrossRef]
- Liu, Y.; Liu, Q.; Chen, M.; Ma, L.; Yand, B.; Chen, J.; Lv, Z.; Liang, Q.; Yang, P. Evaluation of migration of heavy metals and performance of product during co-pyrolysis process of municipal sewage sludge and walnut shell. Environ. Sci. Pollut. Res. 2017, 24, 22082–22090. [Google Scholar] [CrossRef]
- Amin, R.A.; Huang, Y.; He, Y.; Zhang, R.; Liu, G.; Chen, C. Biochar applications and modern techniques for characterization. Clean Technol. Environ. Policy 2016, 18, 1457–1473. [Google Scholar] [CrossRef]
- Yue, Y.; Cui, L.; Lin, Q.; Li, G.; Zhao, X. Efficiency of sewage sludge biochar in improving urban soil properties and promoting grass growth. Chemosphere 2017, 173, 551–556. [Google Scholar] [CrossRef] [PubMed]
- Gupta, A.; Garg, A. Primary sewage sludge-derived activated carbon: Characterisation and application in wastewater treatment. Clean Technol. Environ. Policy 2015, 17, 1619–1631. [Google Scholar] [CrossRef]
- Sizmur, T.; Fresno, T.; Akgül, G.; Frost, H.; Moreno-Jiménez, E. Biochar modification to enhance sorption of inorganics from water. Bioresour. Technol. 2017, 246, 34–47. [Google Scholar] [CrossRef]
- Mohamed, B.A.; Ruan, R.; Bilal, M.; Periyasamy, S.; Awasthi, M.K.; Rajamohan, N.; Leng, L. Sewage sludge co-pyrolysis with agricultural/forest residues: A comparative life-cycle assessment. Renew. Sustain. Energy Rev. 2024, 192, 114168. [Google Scholar] [CrossRef]
- Lin, B.; Huang, Q.; Chi, Y. Co-pyrolysis of oily sludge and rice husk for improving pyrolysis oil quality. Fuel Process. Technol. 2018, 177, 275–282. [Google Scholar] [CrossRef]
- Wang, X.; Deng, S.; Tan, H.; Adeosun, A.; Vujanović, M.; Yang, F.; Duić, N. Synergetic effect of sewage sludge and biomass co-pyrolysis: A combined study in a thermogravimetric analyser and a fixed bed reactor. Energy Convers. Manag. 2016, 118, 399–405. [Google Scholar] [CrossRef]
- Zhang, W.; Yuan, C.; Xu, J.; Yang, X. Beneficial synergetic effect on gas production during co-pyrolysis of sewage sludge and biomass in a vacuum reactor. Bioresour. Technol. 2015, 183, 255–258. [Google Scholar] [CrossRef]
- Zhu, J.; Yang, Y.; Yang, L.; Zhu, Y. High quality syngas produced from the co-pyrolysis of wet sewage sludge with sawdust. Int. J. Hydrogen Energy 2018, 43, 5463–5472. [Google Scholar] [CrossRef]
- Singh, S.V.; Ming, Z.; Fennel, P.S.; Shah, N.; Anthony, E.J. Progress in biofuel production from gasification. Prog. Energy Combust. Sci. 2017, 61, 189–248. [Google Scholar] [CrossRef]
- Dong, Q.; Zhang, S.; Wu, B.; Pi, M.; Xiong, Y.; Zhang, H. Co-pyrolysis of sewage sludge and rice straw: Thermal behavior and char characteristic evaluation. Energy Fuels 2019, 34, 607–615. [Google Scholar] [CrossRef]
- Ling, C.C.Y.; Li, S.F.Y. Synergistic interactions between sewage sludge, polypropylene, and high-density polyethylene during co-pyrolysis: An investigation based on iso-conversional model-free methods and master plot analysis. J. Hazard. Mater. 2023, 455, 131600. [Google Scholar] [CrossRef]
- Zaker, A.; Chen, Z.; Zaheer-Uddin, M.; Guo, J. Co-pyrolysis of sewage sludge and low-density polyethylene—A thermogravimetric study of thermo-kinetics and thermodynamic parameters. J. Environ. Chem. Eng. 2021, 9, 104554. [Google Scholar] [CrossRef]
- Azizi, K.; Haghighi, A.M.; Moraveji, M.K.; Olazar, M.; Lopez, G. Co-pyrolysis of binary and ternary mixtures of microalgae, wood and waste tires through TGA. Renew. Energy 2019, 142, 264–271. [Google Scholar] [CrossRef]
- Batuer, A.; Long, J.; Du, H.; Chen, D. Multi-products oriented co-pyrolysis of papers, plastics, and textiles in MSW and the synergistic effects. J. Anal. Appl. Pyrolysis 2022, 163, 105478. [Google Scholar] [CrossRef]
- Tomasek, S.; Miskolczi, N. Investigation of pyrolysis behavior of sewage sludge by thermogravimetric analysis coupled with Fourier Transform Infrared Spectrometry using different heating rates. Energies 2022, 15, 5116. [Google Scholar] [CrossRef]
- Kan, T.; Strezov, V.; Evans, T. Effect of the heating rate on the thermochemical behavior and biofuel properties of sewage sludge pyrolysis. Energy Fuels 2016, 30, 1564–1570. [Google Scholar] [CrossRef]
- Tomaszewska, K.; Kaluzna-Czapliñska, J.; Józwiak, K. Thermal and thermo-catalytic degradation of polyolefins as a simple and efficient method of landfill clearing. Pol. J. Chem. Technol. 2010, 12, 50–57. [Google Scholar] [CrossRef]
- Adnan, A.; Shah, J.; Rasul, J.M. Thermo-catalytic pyrolysis of polystyrene in the presence of zinc bulk catalysts. J. Taiwan Inst. Chem. Eng. 2014, 45, 2494–2500. [Google Scholar] [CrossRef]
- Bermudez, J.M.; Fidalgo, B. Production of bio-syngas and bio-hydrogen via gasification. In Handbook of Biofuels Production, 2nd ed.; Elsevier Ltd.: Amsterdam, The Netherlands, 2016. [Google Scholar] [CrossRef]
- Chen, G.-B.; Huang, K.-C. A study of copyrolysis characteristics of sewage sludge and waste polypropylene. Int. J. Energy Res. 2023, 2023, 1406397. [Google Scholar] [CrossRef]
- Almeida, D.; de Fátima Marques, M. Thermal and catalytic pyrolysis of plastic waste. Polimeros 2016, 26, 44–51. [Google Scholar] [CrossRef]
- Özsin, G.; Pütün, A.E. An investigation on pyrolysis of textile wastes: Kinetics, thermodynamics, in-situ monitoring of evolved gasses and analysis of the char reaidue. J. Environ. Chem. Eng. 2022, 10, 107748. [Google Scholar] [CrossRef]
- Lim, J.Y.; McGregor, J.; Sederman, A.J.; Dennis, J.S. The role of the Boudouard and water-gas shift reactions in the methanation of CO or CO2 over Ni/γ-Al2O3 catalyst. Chem. Eng. Sci. 2016, 152, 754–766. [Google Scholar] [CrossRef]
- Muhiiwa, R.F.; Sempuga, B.; Hildebrandt, D.; Van Der Walt, J. Study the effects of temperature on syngas composition from pyrolysis of wood pellets using a nitrogen plasma torch reactor. J. Anal. Appl. Pyrolysis 2018, 130, 159–168. [Google Scholar] [CrossRef]
- Lahijani, P.; Zainal, Z.A.; Mohammadi, M.; Mohamed, A.R. Conversion of the greenhouse gas CO2 to the fuel gas CO via the Boudouard reaction: A review. Renew. Sustain. Energy Rev. 2015, 41, 615–632. [Google Scholar] [CrossRef]
- Gunasee, S.D.; Danon, B.; Görgens, J.F.; Mohee, R. Co-pyrolysis of LDPE and cellulose: Synergies during devolatilization and condensation. J. Anal. Appl. Pyrolysis 2017, 126, 307–314. [Google Scholar] [CrossRef]
- Kim, S.S.; Agblevor, F.A.; Lim, J. Fast pyrolysis of chicken litter and turkey litter in a fluidized bed reactor. J. Ind. Eng. Chem. 2009, 15, 247–252. [Google Scholar] [CrossRef]
Disclaimer/Publisher’s Note: The statements, opinions and data contained in all publications are solely those of the individual author(s) and contributor(s) and not of MDPI and/or the editor(s). MDPI and/or the editor(s) disclaim responsibility for any injury to people or property resulting from any ideas, methods, instructions or products referred to in the content. |
© 2024 by the authors. Licensee MDPI, Basel, Switzerland. This article is an open access article distributed under the terms and conditions of the Creative Commons Attribution (CC BY) license (https://creativecommons.org/licenses/by/4.0/).