Article

Research on the Optimization of the Heating Effect of Lithium-Ion Batteries at a Low Temperature Based on an Electromagnetic Induction Heating System

School of Mechanical Engineering, Shenyang University of Technology, Shenyang 110178, China
*
Author to whom correspondence should be addressed.
Energies 2024, 17(15), 3678; https://doi.org/10.3390/en17153678
Submission received: 8 July 2024 / Revised: 19 July 2024 / Accepted: 22 July 2024 / Published: 25 July 2024
(This article belongs to the Section E: Electric Vehicles)

Abstract

:
Based on an electromagnetic induction heating system that was recently developed in a previous work, an orthogonal test with three elements and nine levels was carried out to improve the heating effect of the system. This was intended to achieve a balance between the heating rate and temperature uniformity, where the electrochemical and thermal behaviors of the heated lithium-ion battery could be characterized by a high-accuracy electrochemical–thermal coupling model. This was validated against constant-current discharge and HPPC test data at room temperature and different low temperatures. Under the optimal parameter combination that was found in the orthogonal test, the battery temperature could rise to 293.15 K from 243.15 K in 494 s, with a maximum temperature rise rate of 0.133 K·s−1. The temperature difference after heating reached 4.21 K, which resulted from the heat conductivity of the battery material due to the skin depth of the battery shell and the material properties inside the battery. Due to the internal resistance, which decreased to no more than a quarter of the low-temperature level, both the usable energy and pulse power were increased more than 2.5 and 3 times, respectively. The enhancement of the energy output ability could provide a greater cruise range and improved dynamics for electric vehicles. The capacity calibration results obtained during the heating cycles indicated that there was only a 3.61% reduction in capacity retention after 120 repetitive heating cycles, which was 0.008 Ah below the normal cycle at 293.15 K, even compared with room-temperature capacity calibration, thus reducing the effect on the battery’s lifetime. Therefore, the electromagnetic induction heating system with a heating strategy could achieve a beneficial compromise between the temperature rise behavior, cycle lifetime, and working ability, indicating considerable potential for the optimization of the heating effect.

1. Introduction

The normal operating temperature range of a lithium-ion battery (LiB) is between 273.15 and 318.15 K. The electrochemical performance in cold weather suffers from severe degradation, which has a negative influence when used in electric vehicles (EVs) in cold regions [1]. At low temperatures, inactive positive and negative electrode materials can give rise to the slow kinetics of Li+ intercalation/de-intercalation in the electrodes. Moreover, high electrolyte viscosity can cause slow Li+ diffusion and low ionic electrical conductivity in the electrolyte, so the internal resistance of the LiB drastically increases, thereby leading to the significant loss of both the pulse power and usable energy, which can reduce the driving range and power performance of EVs [1,2,3,4,5]. In addition, if an LiB is forcibly charged under low-temperature conditions, the Li+ electrical deposition on the surface of the carbon electrode will replace the intercalation reaction [1]. When a deposition interface appears, the obvious concentration gradient of the Li+ lithium can be deposited on the graphite electrode’s surface in the form of undesirable dendrites, and the growth of a dendrite structure can cause substantial capacity loss and thermal runaway [6,7,8]. Therefore, it is necessary for a battery thermal management system (BTMS) to heat the LiB to a reasonable operating temperature in order to improve the working ability and safety of LiBs at low temperatures.
Heating approaches can be divided into external and internal methods, depending on their thermal conduction paths [9]. External heating, in which heat is transferred from the outside of the LiB’s modules to the inside by taking advantage of external heat sources, which include fluids, wild-line metal films, Peltier effect heaters, and others, can be safely and conveniently integrated with existing BTMSs and easily implemented. However, the external method exhibits a low heating velocity and efficiency because of the thermal dissipation required to cool the air in each intermediate path of the heat transfer process. It also exhibits a non-uniform temperature distribution in the interior of the LiB during the heating process, resulting in the degradation of the electrode materials and a localized heat-induced aging effect that reduces the LiB’s cycle lifetime [9,10,11,12,13]. In contrast, the internal heating strategy implements the current excitation passing through the LiB to generate Joule heat due to the increasing internal resistance of the LiB in cold climates; such solutions include self-heating Li-ion battery (SHLB) structures [14,15,16], electrically triggered heating [17], alternating current heating [8], and so on. The internal method achieves less energy loss, and there is a better heat generation rate and temperature gradient within the LiB than with the external method. However, the current excitation, which is similar to that in internal/external short circuits, can give rise to safety hazards and battery life degradation. Moreover, the selection rules for the current excitation parameters are still unknown, although there is substantial potential to warm LiBs to room temperature with high efficiency and a high heat production rate. Table 1 shows the heating performance of the heating methods used in batteries. It can be seen from Table 1 and Refs. [18,19,20,21,22] that existing heating/preheating technologies can achieve a good effect for a certain target, such as the heat generation rate, safety, the recovery of the charging/discharging ability, and so on. However, it is difficult for BTMSs to balance the temperature rise, electrochemical performance, cycle lifetime, and safety. Thus, the development of a mature heating method is still a long-term goal for the application of LiBs in cold weather. To solve this, Xiong et al. [12] proposed a hybrid heating strategy based on AC heating and wide-wire metal film heating methods. The technology led to 32% and 23% improvements in the heating rate and energy consumption compared to the AC heating method, respectively. Yang et al. [4] introduced the multi-sheet battery design on the basis of an all-climate cell structure; this could achieve 25–30% improvements in both the energy consumption and activation time, as well as an improved cell lifetime compared with the one-sheet cell structure. Ruan et al. [23] proposed an AC heating strategy with a constant sinusoidal alternating polarization voltage in order to balance the temperature rise and the health of the LiB. The heating rate and temperature difference inside the battery reached 3.73 K·min−1 and 1.6 K, respectively, and the strategy caused less damage to the health state of the LiBs.
According to the above research, our academic team recently developed an extremely fast electromagnetic induction heating system (EIHS) so as to improve the working ability of LiBs. It applies the eddy current produced by the action of electromagnetic induction to realize conversion between electrical and thermal energy through the LiB’s resistance. In this way, the heating system can achieve a satisfactory average temperature rise rate (ATR) and temperature difference at the end of the heating process, and the EIHS has no apparent effect on the LiB’s interior [29]. Aiming to select the appropriate induction coil parameters for the optimization of the heating effect, our team developed the EIHS to explore the optimal parameter combination by designing an orthogonal test on the basis of the electrochemical–thermal coupling model (ETCM). Then, we studied the working performance of an LiB with this optimal combination. Based on the optimal parameter combination found in the orthogonal test, the heating strategy could achieve good temperature rise behavior by taking advantage of the eddy current passing through the heated LiB under the action of electromagnetic induction, which resembles internal alternating current heating. In the meantime, the heating method can avoid thermal runaway and other risks induced by self-discharging with a large current, so this heating strategy can achieve a trade-off among the heating rate, temperature distribution, and safety.
Firstly, based on porous electrode theory, lumped thermal energy conservation, and the electromagnetic induction heating principle, an ETCM was validated against the normal and pulse discharge experimental results at different temperatures and was used to research the terminal voltage output, temperature rise, and field performance during the heating process. Moreover, the induction heat production value was embedded into the thermal model in the form of an internal heat source. Secondly, the ATR and temperature uniformity were adopted as the optimal targets, and we designed an orthogonal test to carry out multi-factor exploration. We took advantage of a range analysis to find the optimal copper coil parameter combination in order to improve the heating effect of the proposed EIHS. Thirdly, under the optimal parameter combination, the heating strategy could achieve a compromise between the heating rate and temperature difference inside the LiB. The temperature difference refers to the difference in temperature from the exterior of the shell to the mandrel after the heating process. The temperature difference inside the LiB mainly exists in the active material and mandrel and results from the fact that the skin depth of the shell is larger than the shell thickness. Moreover, the active material and mandrel are non-ferromagnetic materials that cannot be permeated by the eddy current. The temperature field is discussed in Section 4.5. Furthermore, the significantly enhanced temperature rise performance can decrease the internal resistance to a quarter of the low-temperature level, hence improving the usable energy and charging/discharging pulse power. Additionally, the proposed EIHS causes less damage to the LiB’s cycle lifespan and exhibits no apparent energy degradation as compared to the normal situation at room temperature. Finally, under the comprehensive action of electromagnetic induction and heat conduction, the formation of a temperature field inside the LiB during the heating process was determined via the skin effect and material properties. We studied the relationship between the temperature gradient and electromagnetic field distribution within the LiB and the influence of the thermal conductivity of the active material of the LiB on the temperature uniformity inside the LiB during the heating process in order to analyze the decisive factors regarding temperature field generation. All of the parameters adopted in the study can be seen in the Nomenclature.

2. Electrochemical–Thermal Coupling Model

2.1. Model Structure

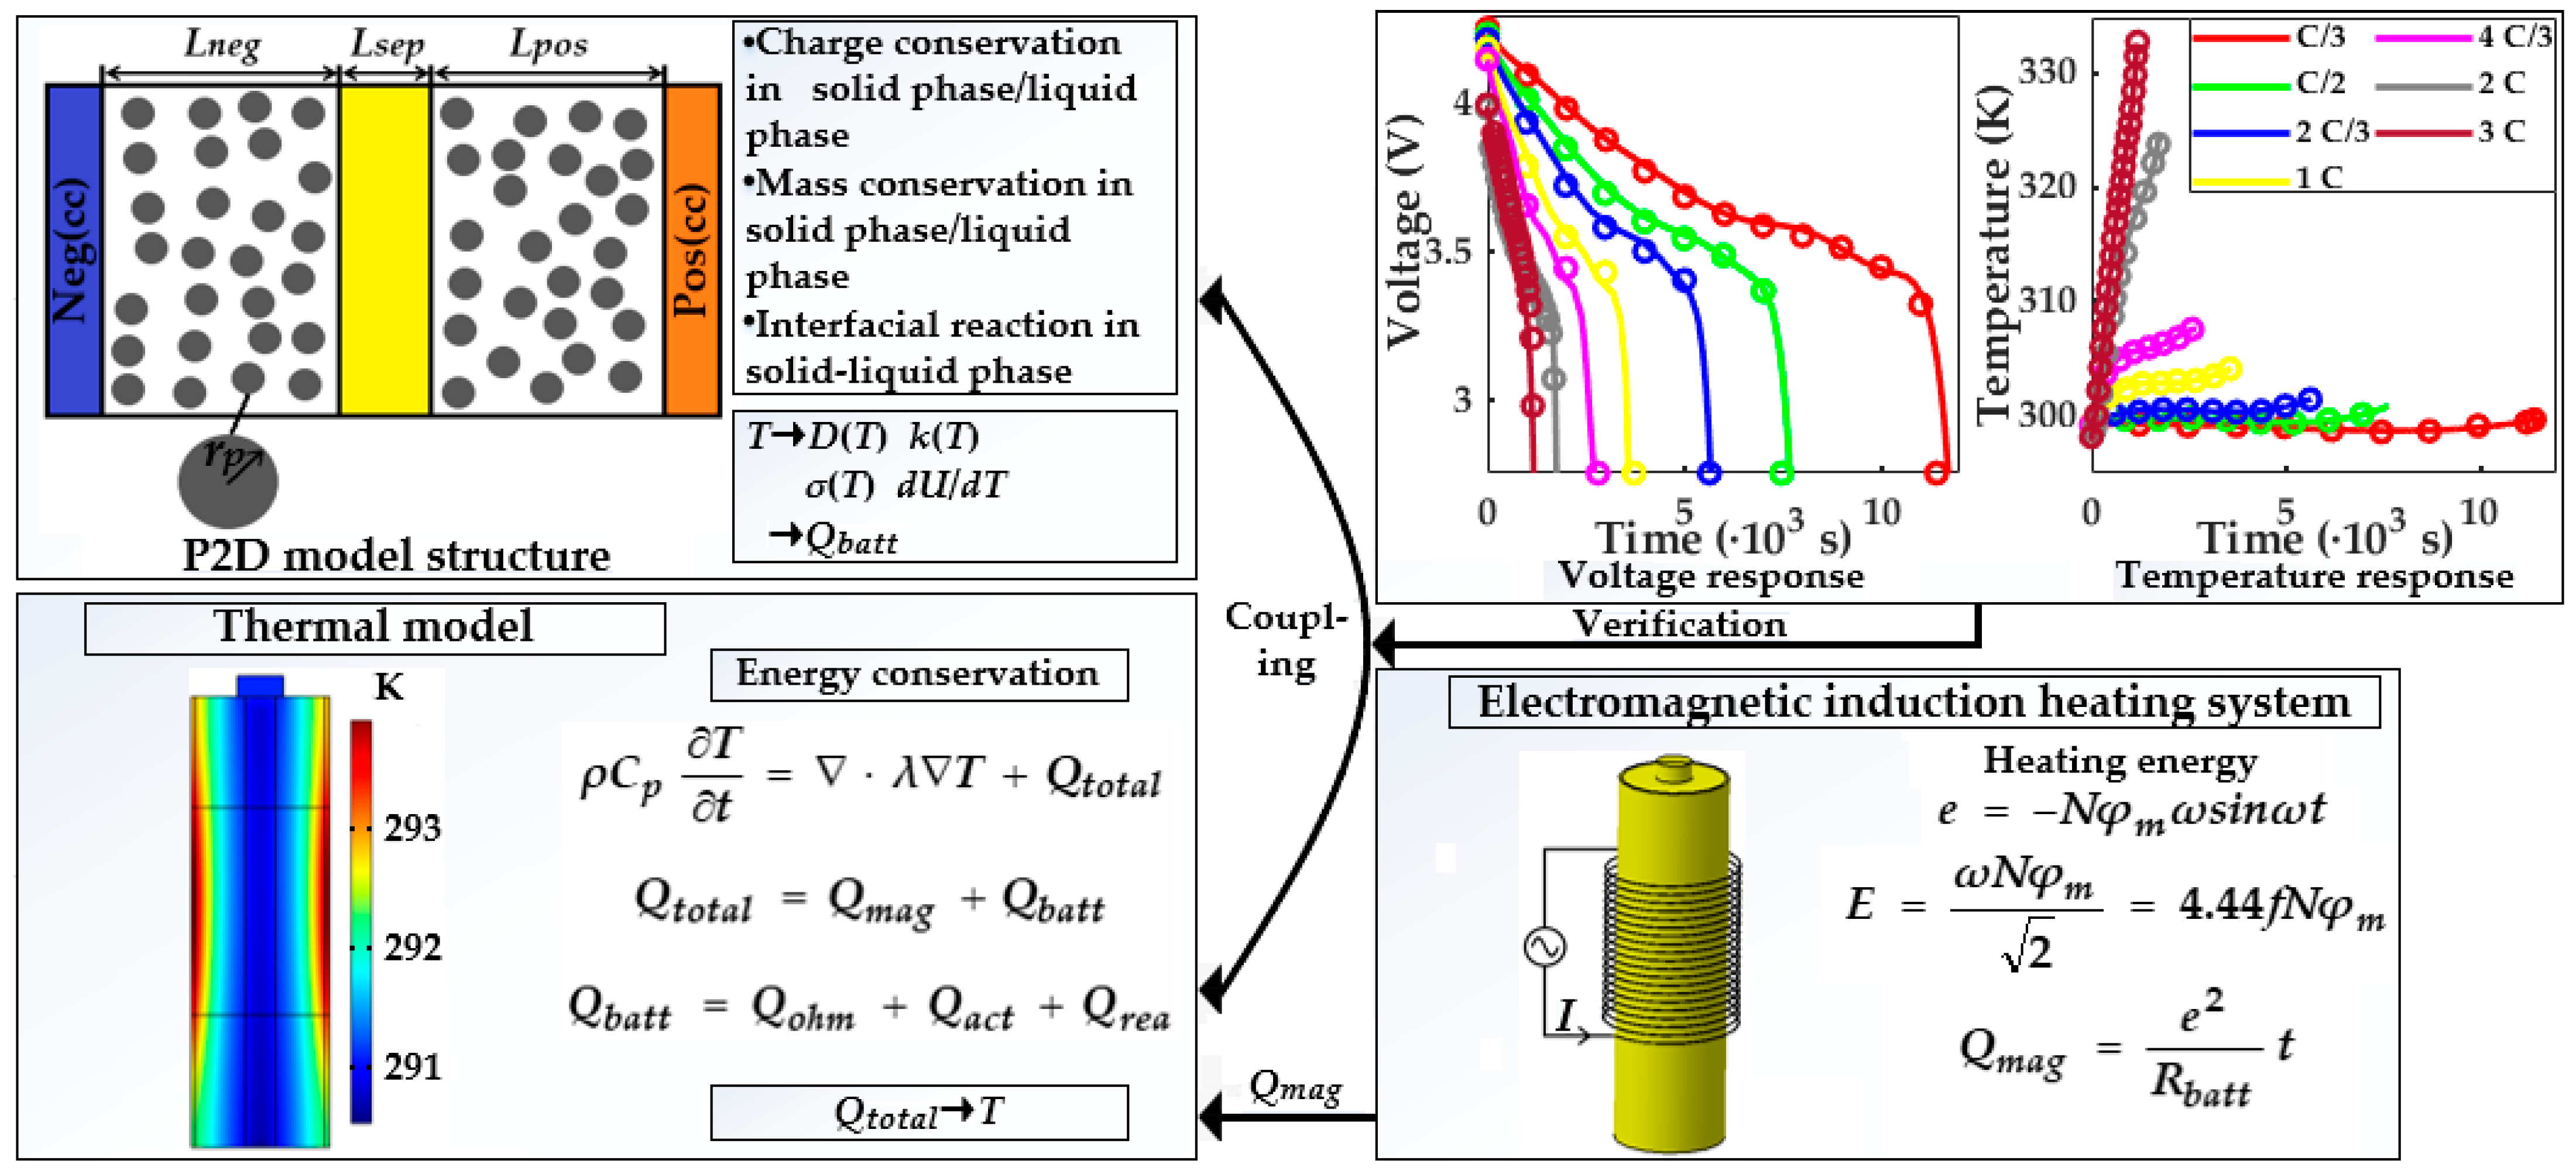
In this work, we established an ETCM to accurately characterize the voltage output of the LiB and the variation in the LiB’s temperature during the heating process. Figure 1 exhibits the ETCM’s structure, in which the heat generated by electromagnetic induction as part of the total heat generation of the LiB is input into the thermal model to reflect the temperature output. In the process of computation, the thermal production from the interior of the LiB and the electromagnetic induction heat are input into the governing equation in the thermal model as the total heat source. Then, the LiB temperature calculated in the thermal model is fed back to the electrochemical model in order to update the temperature-dependent parameters and hence the chemical reaction-induced heat generation inside the LiB. Thus, the electrochemical–thermal closed-loop feedback function can be realized by correcting the temperature-sensitive parameters in the electrochemical model on the basis of the computed temperature, such as the reaction rate constant, liquid-phase diffusivity, and so on. The response precision of the ETCM was studied through normal and pulse discharging experiments at various temperature conditions, which can be seen in Section 4.1.

2.2. Electrochemical Model

As one of the most precise electrochemical models, based on the electrode kinetics, the Li+ diffusion in the solid and liquid phases, concentrated solutions, and porous electrodes, the pseudo-two-dimensional (P2D) model introduced by Doyle and Newman has been applied in many commercialized simulation programs. Thus, the P2D model was adopted in this study to depict the internal state of the LiB according to the electrochemical reaction mechanism. The governing equations are shown in Table 2 [29,30,31].
As can be seen from the governing equations, the P2D model consists of four independent partial differential equations, which are associated via the electrochemical kinetic equation depicting the relationship between the net reaction rate and the electrode potential in the electrode reaction process [32]. The model can describe the Li+ diffusion in the solid phase, the mass transfer in the electrolyte, and the Li+ intercalation/de-intercalation process at the solid–liquid phase interface.

2.3. Thermal Model

The P2D model is an isothermal model and cannot consider the interaction between a chemical reaction and heat generation. However, the accumulation of thermal energy during the heating and electrochemical reaction process inevitably gives rise to a change in the ionic transportation property and chemical reaction rate, which can be directly reflected in the variation in the reaction rate constant, the Li+ electrical conductivity and diffusivity, and other electrochemical parameters that are related to the operating temperature of the LiB. Thus, it is essential for the isothermal P2D model to be coupled with a heat generation model in order to ensure the computational accuracy of the operating state of the LiB at each temperature interval.
The heat generation during the charging/discharging process includes activation polarization, reaction, and ohmic heat, which represent the electrode polarization, enthalpy variation, and ohmic potential, respectively. Together, these constitute the total heat production with electromagnetic induction heat. Considering the consistency of the heat generation rate between the interior and the surface of an 18650 battery, the three-dimensional temperature distribution lumped heat generation model with an internal heat source was applied as the energy conservation equation in the three-dimensional cylindrical coordinate system. The boundary condition can be described by Newton’s law of cooling: when there is a temperature difference between the heated LiB and the environment, the LiB can transfer the heat energy to the air in the form of thermal convection during the heating process. The convention heat transfer coefficient was set as 20 W·m−2·K−1 in this study. The governing equations of the thermal model are shown in Table 3.
According to the temperature-sensitive parameters updated in the electrochemical model, the heat production from the LiB itself was input in the energy conservation equation, which, together with the eddy current loss, determines the temperature rise at the current computation cycle by calculating the governing model in the thermal model.

2.4. Electromagnetic Induction Heating Theory

Electromagnetic induction heating technology can excite the eddy current inside the conductor in order to cause the LiB temperature to rise in a short time through a series of energy conversions. This results in a high heating velocity and efficiency, excellent adaptability, and no pollution; the EIHS can be observed in Figure 2.
It can be seen from Figure 2 that the proposed heating system is composed of an alternating power source, the heated LiB, and an induction copper coil. When the copper coil is subjected to an alternating current through the wire, the produced alternating magnetic field with the same frequency around the copper coil leads to a magnetic flux variation inside the LiB. Then, induction electromotive force (IEF) inside the LiB is produced, because the LiB in the closed loop can cut the magnetic induction line under the action of electromagnetic induction, which can cause the directional movement of the electrons in the interior of the LiB to generate an annular closed induction current inside the LiB due to the Lorentz force. Due to the impedance effect of the LiB, the induction current flowing through it can bring about an eddy current loss to realize the conversion from electrical to thermal energy so as to heat the LiB in the form of Joule heat. Furthermore, besides eddy current loss, the magnetic hysteresis heat effect, as part of the heat generation, is much lower, so it will be ignored in this study.
Besides the cylindrical battery, the proposed ETCM can be applied to other battery structures by adjusting the arrangement of the induction coils based on the shape of the heated battery. For example, for a square battery structure, the copper coil needs to be arranged around the battery in the form of a square cross-section, rather than the annular section adopted with the cylindrical battery.
According to Lenz’s law, the direction of the magnetic flux produced by the induction current prevents the variation of the original one inducing the eddy current; in other words, the induction current attempts to keep the original one constant, so the IEF can be written as
e = N d φ d t
If the evolution of the magnetic flux exhibits a sinusoidal form, then
e = N φ m ω c o s ( ω t ) = N B m S ω c o s ( ω t )
Thus, the effective value of the IEF can be expressed as
E = ω N φ m 2 = 4.44 f N φ m = 4.44 N f B m S
The Joule heat induced by the eddy current combined with the impedance effect of the conductor can be written as
Q m a g = e 2 R b a t t t = I 2 R b a t t t
Therefore, there are three energy conservations that occur in the electromagnetic induction heating process. First, the alternating current passing through the copper coil is converted into magnetic energy; then, the magnetic energy is converted into electrical energy because the LiB under the varying magnetic flux cuts the magnetic induction line to generate the induction current; finally, the induction current flowing through the interior of the LiB produces an eddy current loss through the resistance effect of the conductor, resulting in the conversion of electrical energy into Joule heat.
It is noted that the temperature rise is the combined action of electromagnetic induction and heat conduction, which results from the skin effect, and the electrical conductivity of the active material and mandrel in the interior of the LiB. The LiB shell has a high temperature rate, especially on the outer surface of the shell, which holds the majority of the eddy current loss. This transfers the heat energy to the interior of the LiB in the form of thermal conduction, so the induction heat has a direct impact on the thermal conduction. An analysis of the relation between the heat transfer mode and the temperature field is presented in Section 4.5.
According to the skin effect, when the conductor is subjected to an alternating current, the free electrons in the cross-section of the conductor present a decreasing exponential distribution, so the eddy current distribution from the outer to the internal surface of the LiB and the skin depth can be expressed as
I x = I 0 e x δ
δ = 2 ω μ 0 μ r σ
The skin effect shows a negative correlation between the eddy permeation depth and alternating current frequency, which can give rise to non-consistency of the eddy current distribution inside the LiB shell, leading to an inhomogeneous temperature rise during the heating process.

2.5. Electrochemical–Thermal Coupling Effect

Considering the temperature dependence of the chemical reaction inside the LiB, the coupling action between the electrochemical and thermal processes can be realized by correcting the temperature-sensitive parameters in the P2D model. Among these, the evolution of the reaction rate constant and the Li+ electrical conductivity in the electrode can be expressed via the Arrhenius equation [33].
ψ = ψ r e f e x p E a c t R 1 T r e f 1 T
Furthermore, the variations in the Li+ diffusivity and electrical conductivity in the liquid phase with the temperature can be approximately expressed in the form of the Arrhenius equation, in which the reference values of the parameters need to be achieved via interpolation on the basis of experimental data; they are not constant, as with the parameters mentioned in the previous paragraph.
The LiB temperature calculated in the thermal model can be fed back to the P2D model. It reflects the real-time electrochemical state, which, together with the induction heat, conversely affects the total heat generation related to the LiB temperature. Therefore, the output and input variables of the thermal model are the temperature and heat generation, which consists of the heat generated by the electrochemical reaction and the eddy current loss. Thus, the electrochemical and thermal coupling action can be realized by updating the temperature-sensitive parameters in real time and concurrently calculating the P2D and heat transfer models.

3. Simulation Test

3.1. Research Object

A commercial 18650 lithium battery with a graphite anode and NCA cathode material was tested to evaluate the heating effect of the proposed EIHS; the technical specifications are shown in Table 4 [29]. The manufacturer and model of the battery are Panasonic and NCR18650, respectively. The solid-phase potential difference between the anode and cathode ends was adopted as the LiB terminal voltage output.

3.2. Model Establishment

The proposed ETCM with a 3-dimensional structure was established in COMSOL Multiphysics 6.0 to perform the finite element simulation. All of the parameters involved in the model are listed in [29], in which the “Electromagnetic heat” multi-physics interface simultaneously coupled the “Magnetic field” and “Heat transfer in solid” modules in order to calculate the temperature rise, magnetic field, and temperature distribution inside the LiB during the heating process. The heat generation in the operating process of the LiB was input in the “Heat transfer in solid” module as an internal heat source. The temperature in the “Lithium battery” module was treated as a whole, ignoring the temperature difference among the separator, positive, and negative electrodes to ensure computational efficiency. The “Magnetic field” module, the “Lithium battery” and “Heat transfer in solid” modules, and the “Electromagnetic heat” multi-physics interface were examined using frequency-domain and transient solvers, respectively.
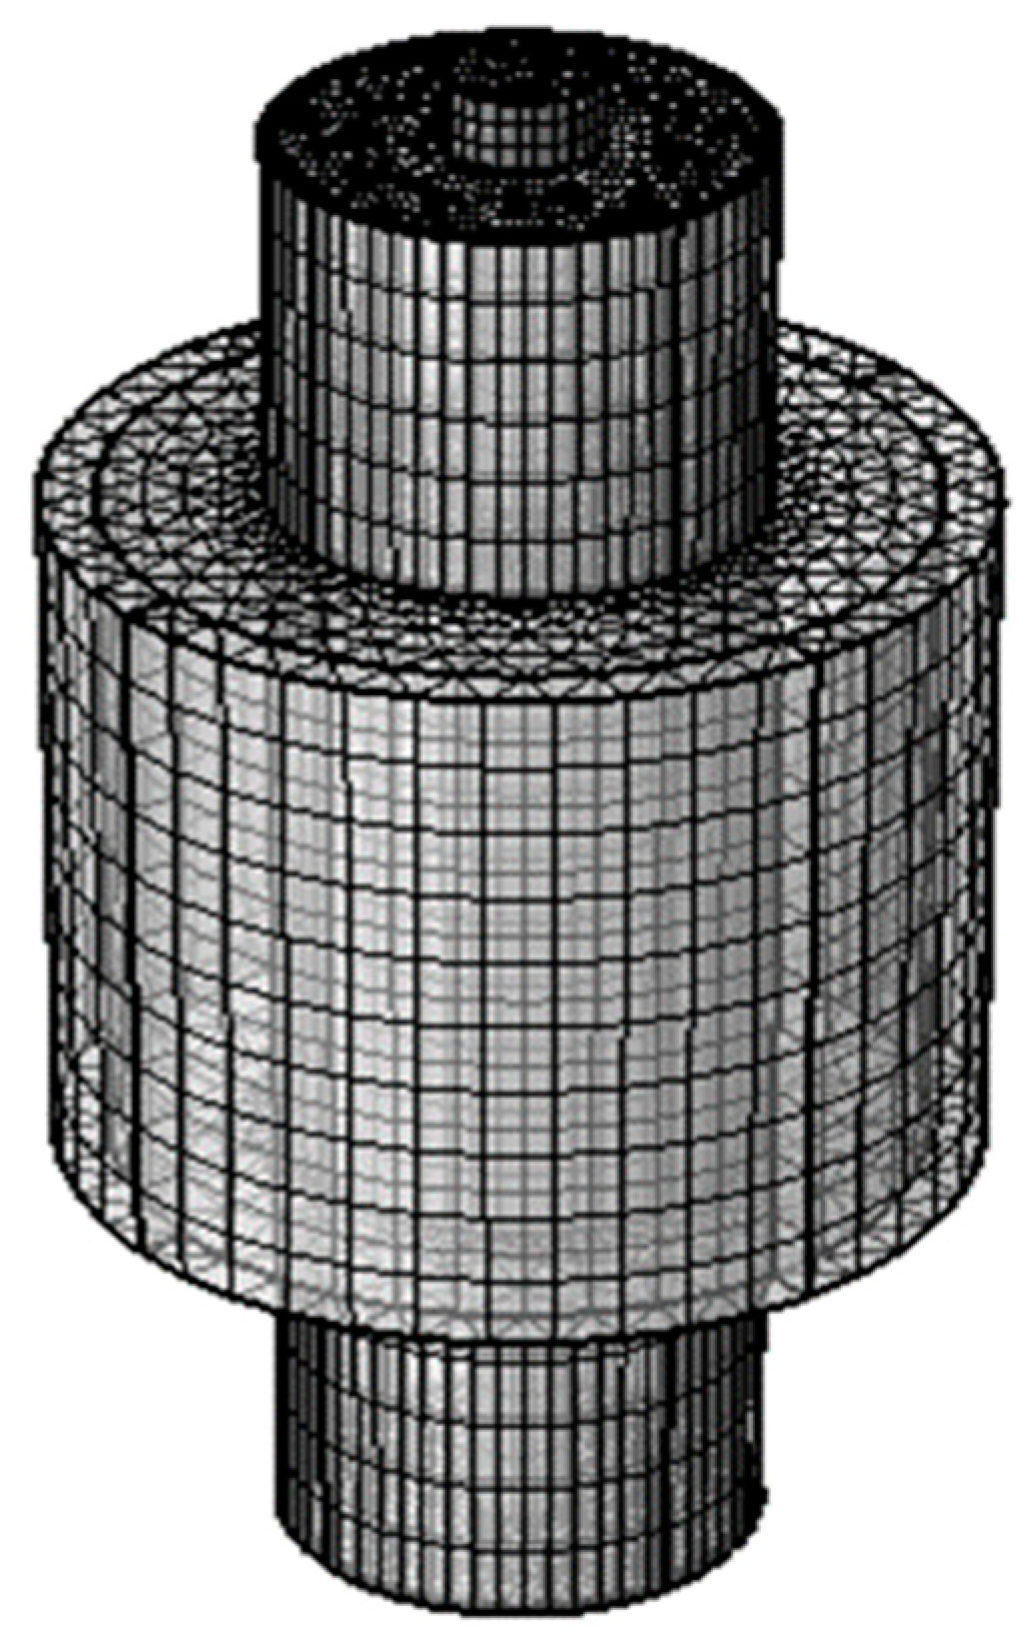
Figure 3 shows the EIHS mesh grid structure, in which the LiB and coil were built in the form of mapping and sweeping on the basis of a free triangular mesh grid. The copper coil that was replaced by the hollow cylinder was uniformly placed at the middle region of the LiB. The air region between the induction coil and LiB shell was divided on the basis of a free tetrahedron mesh grid with a maximum unit of 9 mm.
Although the copper coil needs to cover the LiB in a ring-like manner in engineering applications, as seen in Figure 2, the numerical induction coil was simplified as a hollow cylinder with the uniform multi-turn wire model. This was applied in order to ignore the magnetic field distribution and skin effect inside the coil in the simulation calculations, because this research was focused on the temperature rise and magnetic field distribution of the LiB, rather than the magnetic effect of the coil. In this way, the complexity of the computation and geometric division was decreased, and they could be realized by taking advantage of the “Coil” function in the “Magnetic field” module in COMSOL.

3.3. Orthogonal Test

It can be seen from Section 2.4 that the intensity and frequency of the excitation source played an important role in the permeation depth and intensity of the induction current, and there was a positive correlation between the IEF and the number of coil turns, thereby influencing the eddy current loss and hence the temperature rise. In this work, the orthogonal test was introduced to find the optimal parameter combination to obtain an excellent heating effect, in which the alternating current amplitude and frequency and the induction copper coil turns were adopted as the influencing factors. In the design of the orthogonal test, the greater the number of test instances, the higher the computational cost but the more accurate the optimal parameter combination. Thus, we set 9 levels for each factor and conducted 81 tests in order to balance the computational complexity and the accuracy of the heating effect optimization. Therefore, the “L81(93)” orthogonal test with three factors and nine levels was carried out to investigate the impact of the influencing factors on the temperature rise effect in order to improve the heating performance of the EIHS. The orthogonal test design parameters are exhibited in Table 5. A, B, and C represent the alternating current amplitude, frequency, and copper coil turns, respectively. It can be seen from Table 5 that the computational ranges of each parameter were 4–12 A, 1 to 10 kHz, and 140–300 for the alternating current amplitude, frequency, and coil turns, respectively, and each factor was evenly divided into nine levels within the corresponding range.
In this study, the heating priority was to enable the LiB’s temperature to rise rapidly in a short time so that the charging/discharging performance could be recovered to the room-temperature level. The temperature consistency during the heating time was the secondary goal, so the ATR and temperature difference inside the LiB were adopted as the primary and secondary targets. Therefore, we set a 5% weight difference between the heating rate and temperature difference, and the temperature rise effect could be quantified using the following scoring rule:
S c o r e = 0.525 A T R A T R m i n A T R m a x A T R m i n + 0.475 d m a x d d m a x d m i n 100
where d is the temperature difference at the end of heating, and ATRmax/min and dmax/min are the maximum/minimal ATR and d among every orthogonal test group.

3.4. Temperature Rise Effect Simulation

A line diagram can be seen in Figure 4. We carried out the orthogonal test to study the influence of the induction coil parameters on the temperature rise of an LiB placed in a constant low-temperature environment and then explored the optimal parameter combination to optimize the heating performance. Under the best factor group, the heating simulation was carried out to determine the real-time temperature variations and differences inside the LiB in order to evaluate the temperature rise behavior, in which the temperature distribution was described using cloud charts. The terminal voltage output in the heating process could be collected to calculate the discharging energy and pulse power, which served to determine the driving range and dynamics of EVs. Moreover, 1 C discharging capacity calibrations were performed after the heating cycle to assess the impact of the proposed heating strategy on the lifespan of the heated LiB, as this has a direct influence on the state of health of the LiB. Moreover, in order to explore the primary influencing factors in the generation of the temperature field inside the LiB during the heating process, we investigated the relationship between the temperature gradient and skin depth by taking advantage of the eddy current distribution inside the LiB, as produced in COMSOL. Additionally, the effect of the LiB’s material properties on the heat generation uniformity was studied through the adjustment of the heat conductivity of the LiB material.
Unless otherwise specified, the heating ended if the LiB temperature rose to 293.15 K, as this temperature was the average temperature of the LiB shell region. Unlike the LiB placed in an aluminum battery container in [29], the heated LiB was directly exposed to the external air in order to reflect engineering applications, which means that the LiB would be able to achieve heat exchange with the environment. The ambient temperature was set at 243.15 K, and the heat dissipation from the LiB to the external cold air was realized through thermal convection with a heat transfer coefficient of 20 W·m−2·K−1.
Under the optimal parameter combination achieved by our range analysis, based on the orthogonal test results, we explored the heating effect of the proposed EIHS through the temperature rise curve and temperature gradient in the heating process. A temperature cloud chart could be produced using the two-dimensional drawing tool in COMSOL by building a quick YZ cut plane on the basis of the dataset of the transient solver.
According to the skin effect and Ref. [4], the induction current mainly exists on the outer surface of the LiB shell. The heat generation in the interior of the LiB is realized through heat conduction, so the heat generation effect in the heating process depends on both the skin depth and the thermal conduction property of the LiB material. Thus, the relation between the temperature field, magnetic flux, and induction current density distribution inside the LiB could be explored using temperature and magnetic field images in order to study the impact of the EIHS on the temperature distribution during the heating process. The magnetic flux and induction current density cloud charts inside the LiB could be obtained by establishing a quick cut plane on the basis of the dataset of the frequency-domain solver. The effect of heat conductivity on the temperature uniformity in the heat transfer process was studied by setting the radial heat conductivity of the active material to 0.9, 0.8, and 0.7 W·m−1·K−1.

3.5. Electrochemical Performance Simulation

Aiming to investigate the enhancement of the terminal voltage output, which has a decisive impact on the dynamics of EVs, the LiB (at 243.15 K with a 100% state of charge (SOC)) was fully discharged to 3.0 V with 1 C during the heating process. The usable energy of the LiB was determined via the voltage–capacity curve produced in COMSOL, so as to study the improvement in the energy output performance. Besides the usable energy, the pulse power also plays an important role in the energy release behavior, so a HPPC test was carried out to calculate the pulse power and internal resistance. This was achieved by collecting the open circuit potential (OCP) and the terminal voltage at the starting and stopping moments of pulse charge/discharge after the LiB that was fully charged with a constant current–constant voltage (CC–CV) to 4.2 V until 0.05 C was heated to 293.15 K. The HPPC test process is exhibited in Figure 5; this test revealed the dynamic charging/discharging capacity through the pulse feedback at each SOC interval.
In order to investigate the influence of the proposed EIHS on the extent of the LiB’s aging, using an LiB fully charged to 100% SOC at 293.15 K, a cooling–heating cycle test was carried out to calibrate the discharge capacity at every 15 heating cycles until the cycle number reached 120. This allowed us to evaluate the LiB’s health state based on the capacity loss during the cycle process; the heating cycle test procedure can be seen in Figure 6. The discharge capacity calibration means that the LiB soaked at 293.15 K was charged back to 100% SOC with CC-CV until 4.2 V/0.05 C, and it was discharged to the discharge cutoff voltage with 1 C. The discharge capacity was regarded as the capacity calibration result. By comparing the discharge capacity difference between the heating and normal charge–discharge cycles, the EIHS-induced aging effect could be quantified to study the electrochemical performance degradation of the LiB through the calculated capacity retention.

4. Results and Discussion

4.1. Model Validation

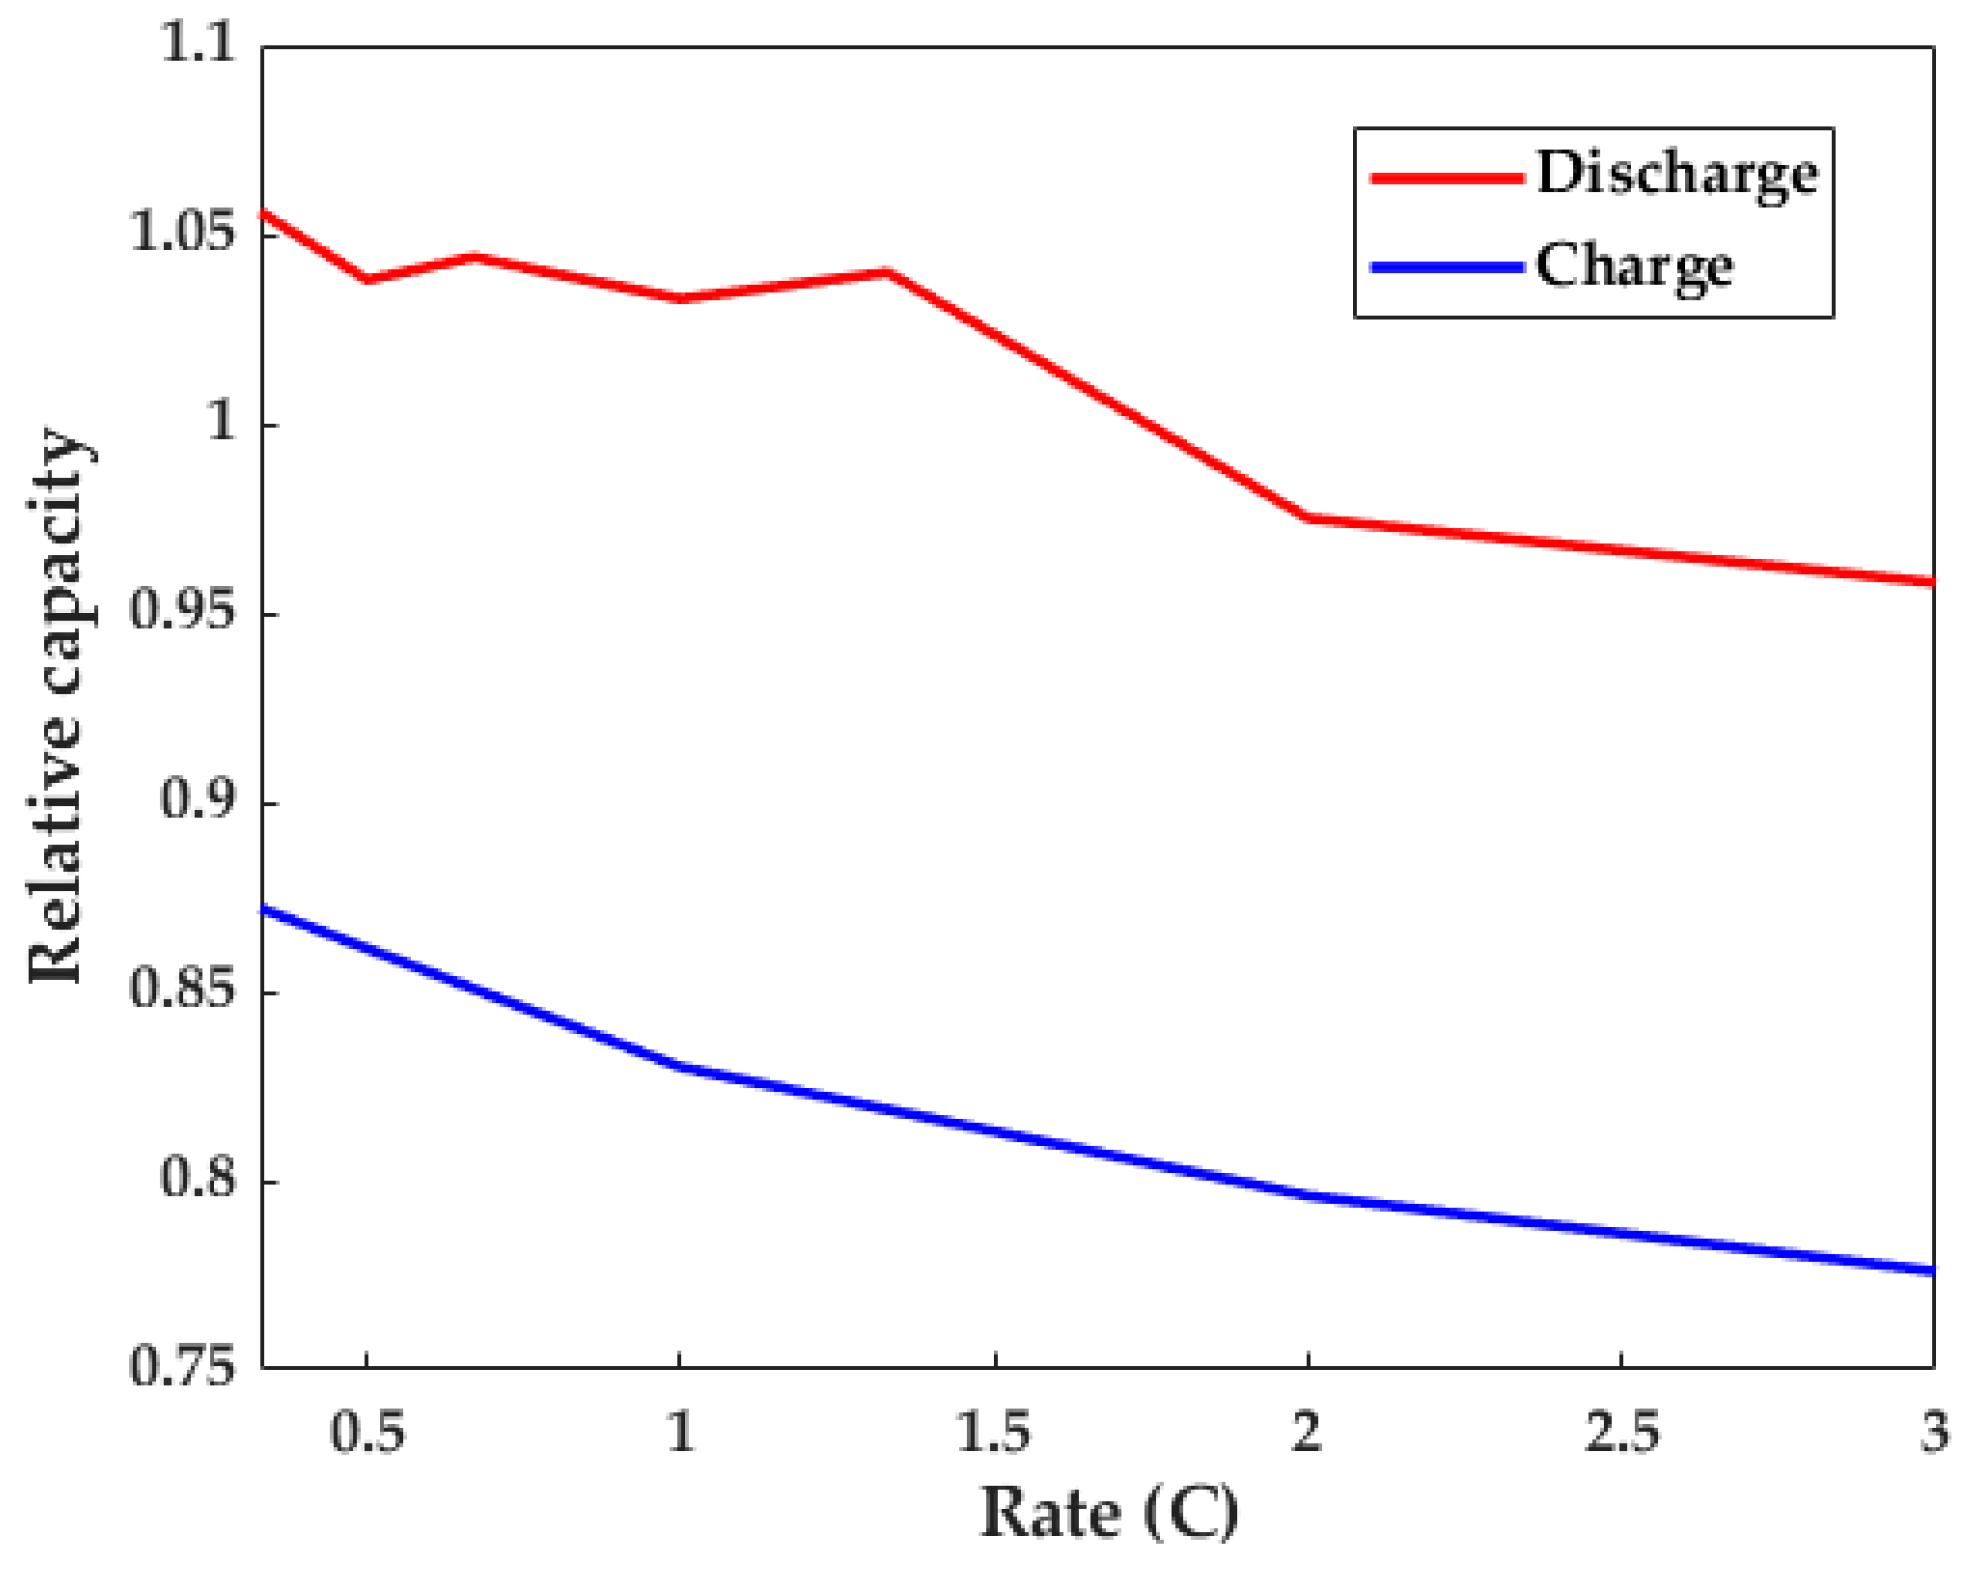
In this study, the accuracy of the proposed ETCM was evaluated through a series of normal and pulse charging/discharging tests at various temperatures. Figure 7 shows the terminal voltage and temperature responses in the CC discharging results with a variety of C-rates at 298.15 K; the experimental data were obtained from [34,35,36]. With an increase in the discharge rate, the discharge time exhibited a decreasing trend from 11406 s for C/3 to 5642 s for 2 C/3, to 2810 s for 4 C/3, and to 1150 s for 3 C, meaning that the discharge capacity decreased to 98.92% for 2 C/3, 98.53% for 4 C/3, and 90.75% for 3 C of the level at C/3. This resulted from the fact that the increasing rate could give rise to the intensification of ohmic consumption, and the ionic diffusion and electrical migration velocity in the electrode were lower than the electron motion velocity, leading to the weak action of charge transfer. In fact, both the discharging and charging performance can deteriorate with an increase in this rate. It can be seen from Figure 8 that when the rate was increased from 0.33 C to 3 C, there were 9.75% and 9.57% losses for the charging and discharging capacities. The cause of the charging behavior degradation was that the enhancement of the electrode polarization resulting from the rate difference between the electrode reaction and electron movement led to a rapid rise in the terminal voltage until the charging cutoff voltage was reached, thereby reducing the charging time and capacity of the LiB [34,35,36,37]. Besides the decreasing discharge capacity, the increase in the temperature rise with the rate was also so noteworthy, as it could be increased from 0.38 K for C/3 to 8.19 K for 4 C/3 and to 34.69 K for 3 C. This was caused by the fact that the polarization enhancement with the operating current gave rise to an increase in both reversible and irreversible heat, especially in ohmic and activation polarization heat [38]. It can be observed from Figure 7 that the calculated voltage and temperature match well with the experimental results, and the average errors were lower than 29.8 mV and 0.4 K, so the proposed ETCM has a satisfactory normal response capacity at room temperature.
Therefore, the responses of the voltage and temperature at different rates indicate that the heat-sensitive parameters in the P2D model yielded excellent predictions at different temperature intervals, even in high-temperature conditions, which could be fed back to the thermal model in turn by calculating the heat generation from the LiB itself. This suggests that the model enables the accurate computation of the Qbatt and temperature. In other words, the proposed ETCM can achieve high-precision coupling between the electrochemical and heat transfer performance during the operating process of an LiB.
Figure 9 compares the variation in the voltage with the discharge capacity from [39] and shows the corresponding simulation results at various low temperatures. It is noteworthy that with the decrease in the ambient temperature, the discharge capacity significantly deteriorated from 2.09 Ah for 273.15 K to 1.53 Ah for 253.15 K, which resulted from the fact that the LiB’s impedance rise induced by the low temperature led to the rising partial voltage of the internal resistance, which sped up the decrease in the terminal voltage. Due to the underestimation of the SEI film growth induced by the plated lithium at low temperatures, and the inadequate consideration of the poor binder and conductive agent performance, the contact resistance between the collector and negative electrode, and so on, the simulated capacity data were 0.015, 0.04, and 0.06 Ah higher than the experimental results, at 273.15, 263.15, and 253.15 K, respectively. Despite the errors mentioned above, the ETCM could achieve sufficiently high prediction accuracy from both the electrochemical and thermal perspectives.
The OCP and internal resistance based on the HPPC test at various low temperatures from [39] and the corresponding calculated results are exhibited in Figure 10. These allowed us to assess the dynamic response ability of the ETCM. As a result of the slow electrode kinetics, low ionic diffusivity, and liquid-phase electrical conductivity, an increase in the internal resistance can give rise to a decreasing discharge voltage in cold climates. It can be seen from Figure 10 that the errors of the internal resistance and OCP could be limited to 12.2, 18.2, and 24 mV for the OCP and 5.4, 10.1, and 15 mΩ for the internal resistance at 273.15, 263.15, and 253.15 K, respectively, for the reasons mentioned in the previous paragraph. The minor errors indicate that the ETCM has excellent pulse dynamic behavior at different depth of discharge (DOD) intervals and operating temperatures.
Therefore, due to the minor miscalculation of the battery aging, the SEI film growth, and the temperature-sensitive parameters, the responses of the voltage, temperature, internal resistance, and OCP exhibited minor errors between the computational and experimental results. All of the errors in the model predictions were lower than 4% as compared to the test data, indicating that the proposed ETCM provides accurate predictions of the heat generation and electrochemical output of the LiB, which is beneficial for the development of heating strategies.

4.2. Temperature Rise Effect

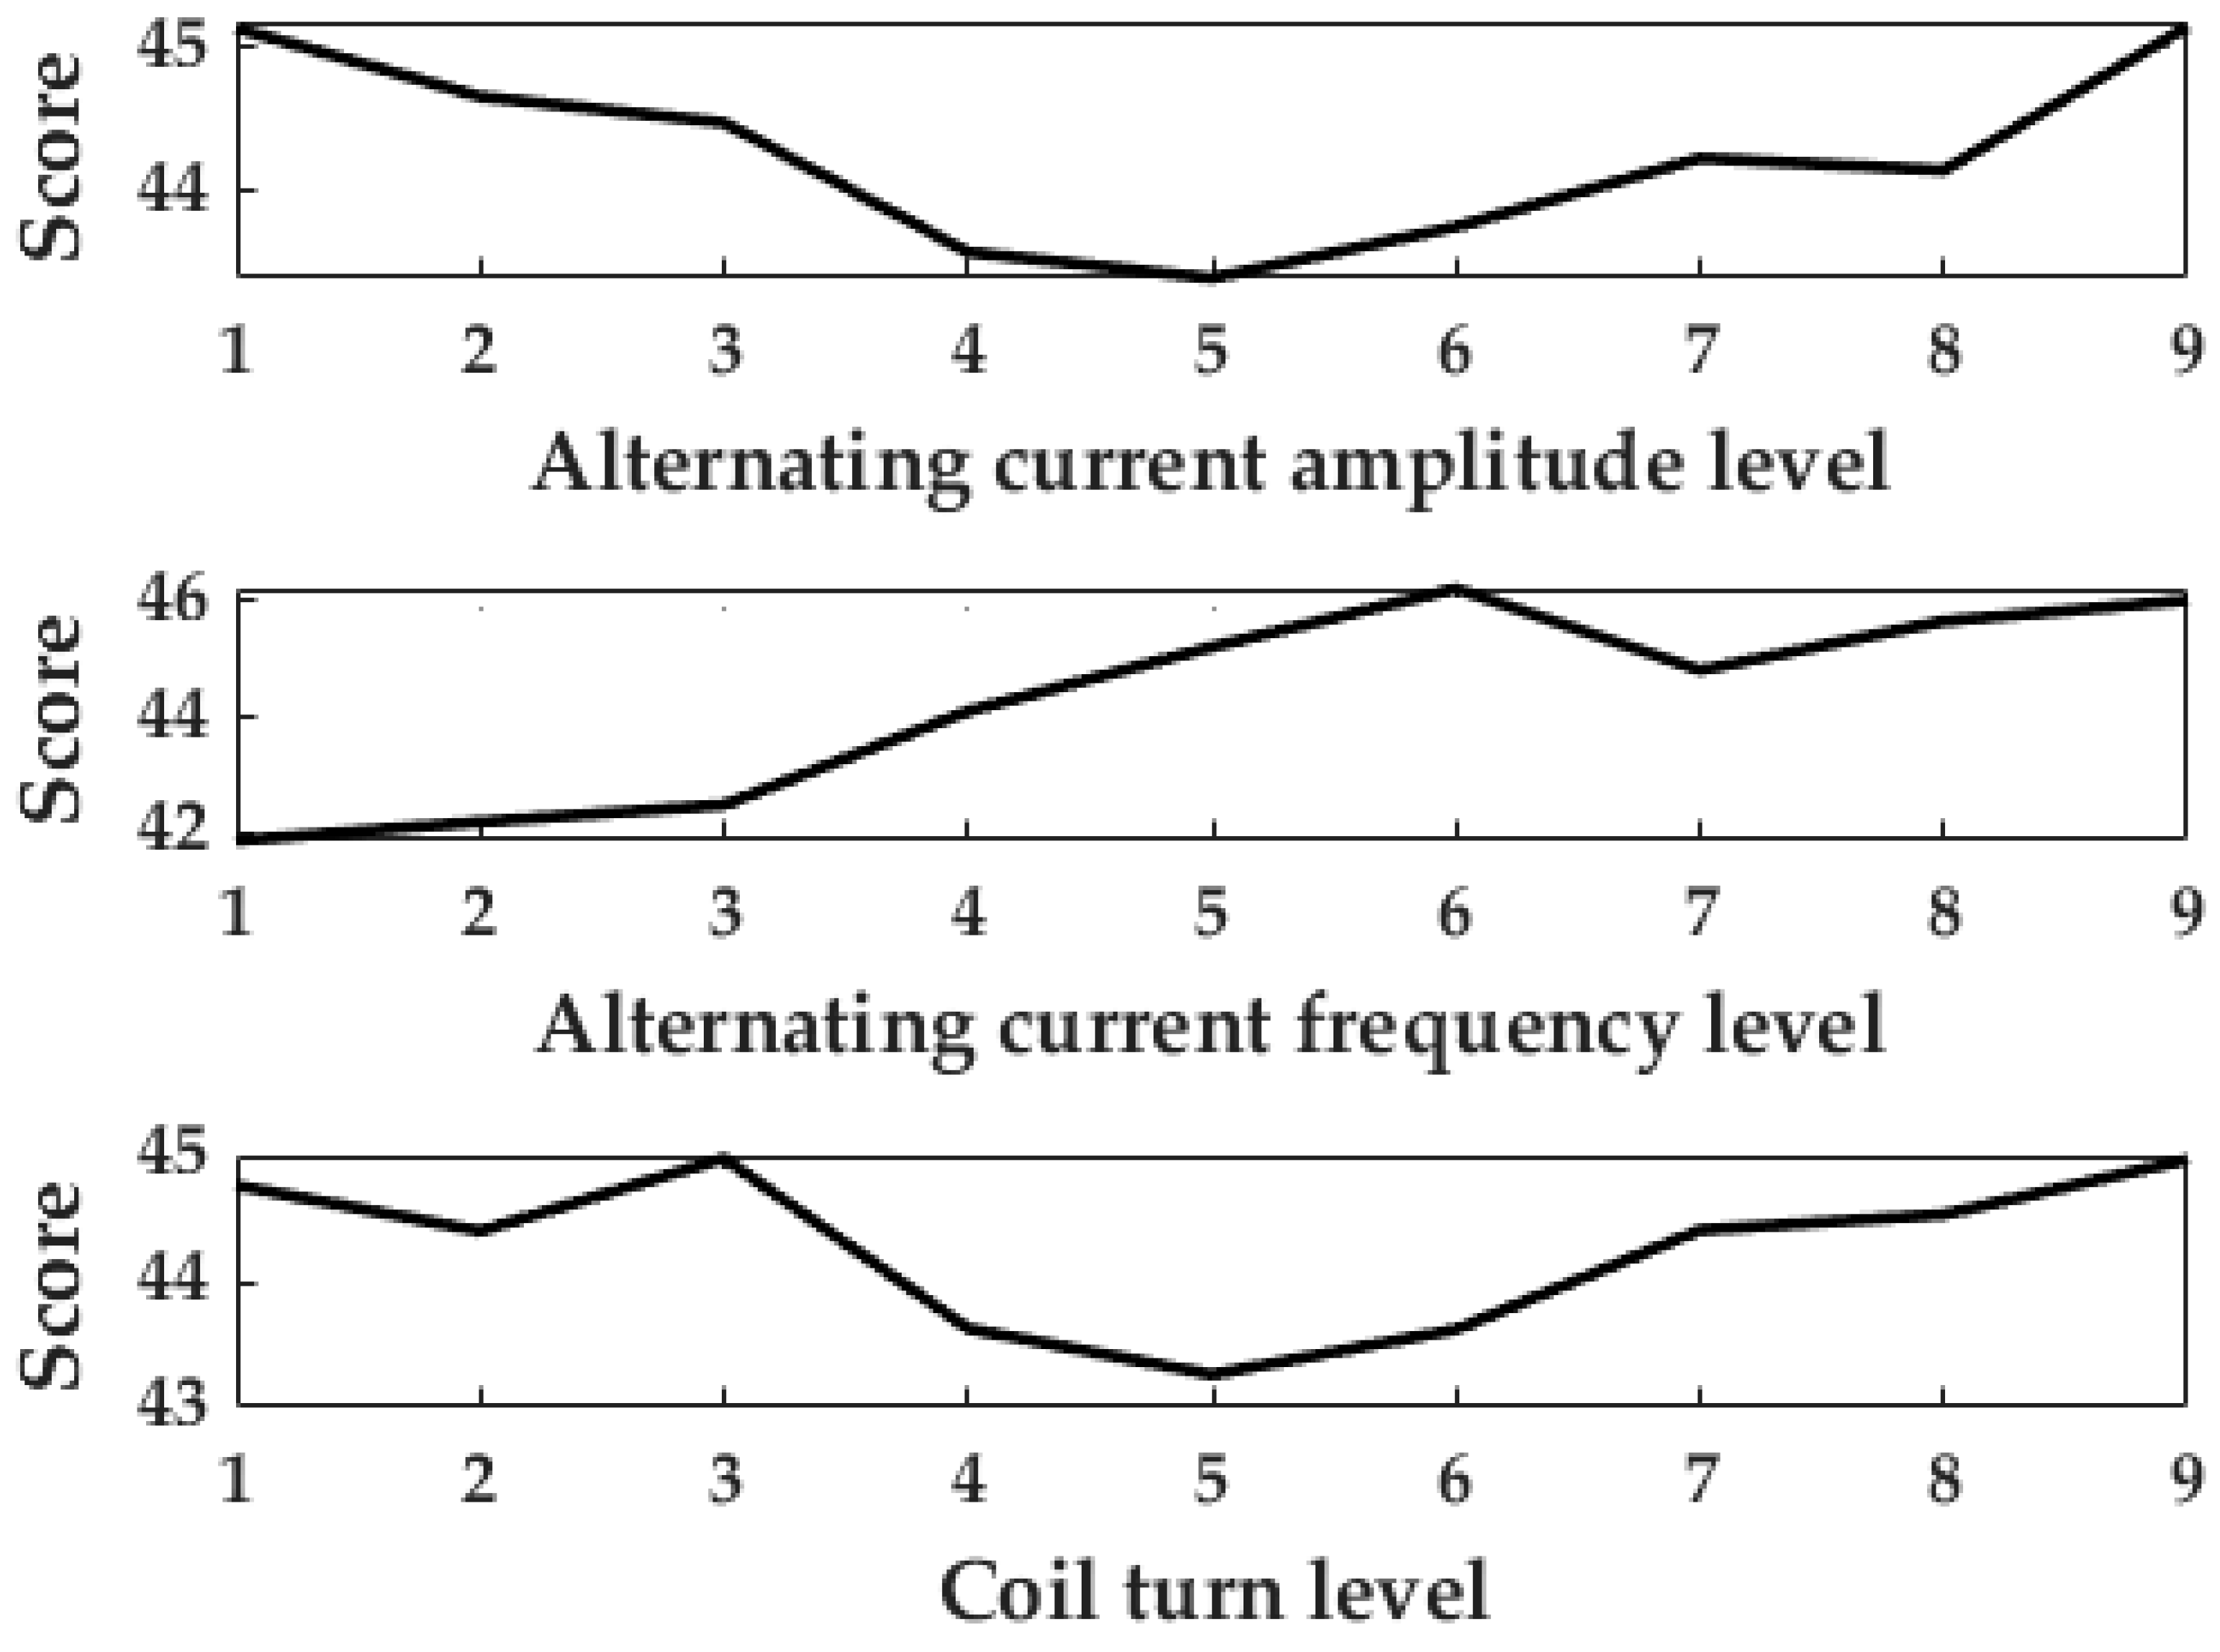
In this study, taking the ATR and temperature difference inside an LiB heated from 243.15 to 293.15 K as the optimal objectives, the temperature rise effect could be quantified by taking advantage of the scoring method described in Section 3.3. This was combined with the range analysis on the basis of the “L8193” orthogonal test results to evaluate the influence of every element on the heating effect and explore the optimal parameter combination. Table 6 shows the range analysis data, where Ki represents the total score value of each factor at the “i” level, ki = Ki/9, and R denotes the range. Figure 11 shows the relationship between the factor level and score.
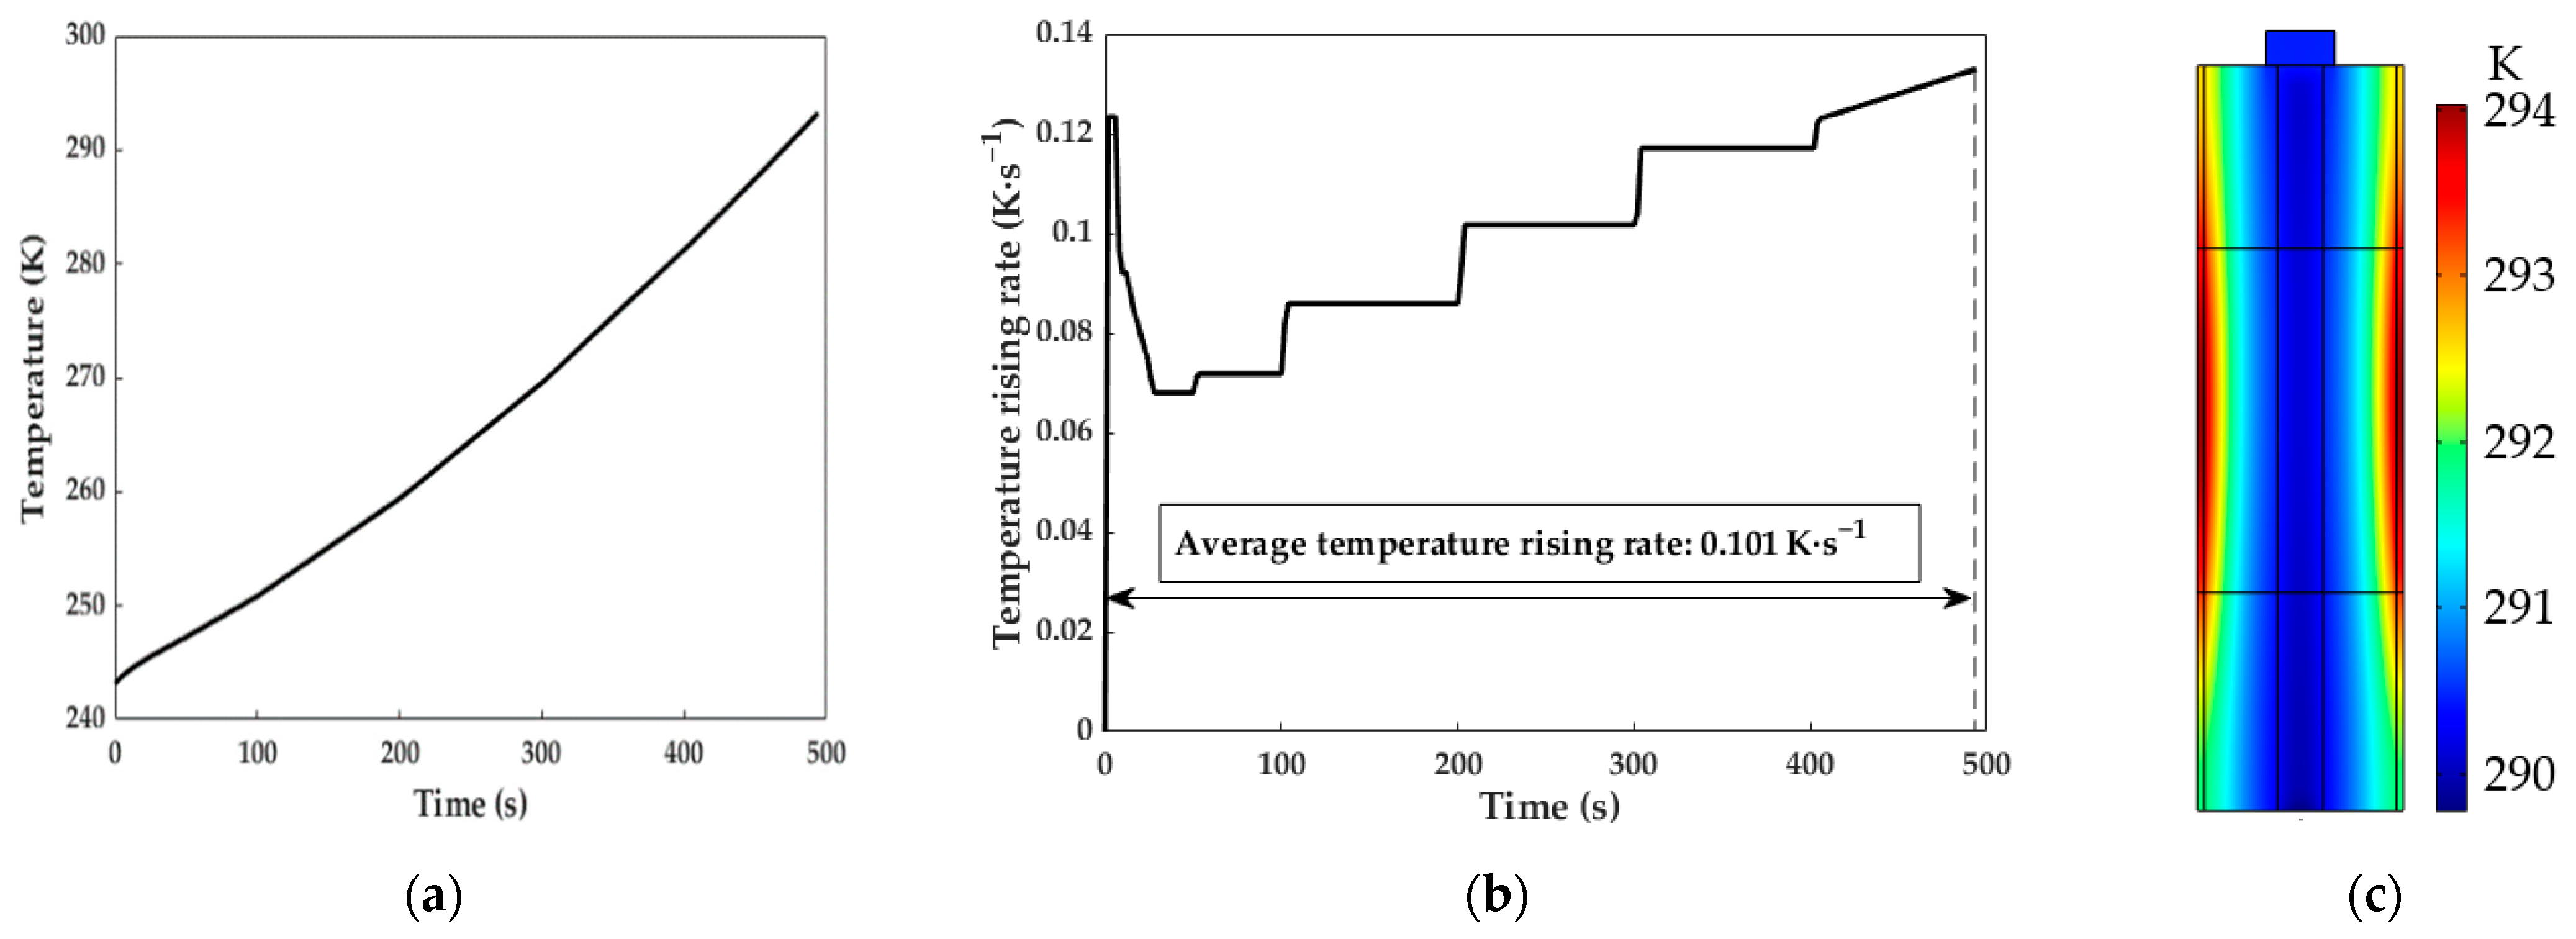
The range of each factor denotes the average response difference among the nine levels of the corresponding factor; the larger the range, the larger the influence of the factor on the temperature rise. The average value of the response at the “i” level refers to the average temperature rise effect of the factor at the current level; the larger the ki, the better average heating performance at the “i” level. Therefore, by comparing the values of the average responses among each level of the corresponding factor and the ranges among each factor from Figure 11 and Table 6, the influencing elements of the temperature rise in descending order were the excitation current frequency, amplitude, and coil turns, and the levels of each factor with the largest average response result were A9, B6, and C3. Thus, the parameter combination with the best heating behavior was “A = 12 A; B = 6 kHz; C = 180” based on the data in Table 5. Under the optimal combination regarding the heating velocity and temperature uniformity, a heating test was performed. Figure 12 shows the temperature characteristics during the heating process.
When the induction coil used 180 turns and was subjected to an alternating current with 12 A and 6 kHz, the LiB could be heated from 243.15 to 293.15 K in 494 s, with the highest instantaneous temperature rise rate of 0.133 K·s−1, which is better than that obtained with the alternating current heating technology with the ATR of 0.034 K·s−1 in [3] and 0.0622 K·s−1 in [23], where the alternating currents were higher than the excitation current used in this work. The temperature difference reached 4.21K within the LiB, indicating that the EIHS with the parameter combination stated above achieved a satisfactory balance between the ATR and temperature distribution. Although the ATR of the heating method was lower than that of the SHLB structure in [14] and the electrically triggered heating strategy in [39], the EIHS could successfully prevent the heated LiB from experiencing external/internal short circuits caused by frequent instantaneous high-circuit self-discharges.
The skin effect indicates that the induction heat energy was generated in the skin depth layer of the LiB shell, and then the electromagnetic heat as the heat power was transferred to the interior of the shell, the active material, and the mandrel inside the LiB in the form of thermal conduction. This resulted in the heat generation rate inside the LiB being lower than that in the exterior of the LiB, so there was a decreasing temperature distribution from the LiB shell to the mandrel, as can be observed in Figure 12c. The induction current distribution and thermophysical properties of the LiB material have a direct impact on the heat source region and heat transfer process, respectively, so the temperature rise process is a comprehensive reflection of the eddy-current-loss-induced Joule heat and thermal conduction. The influence of the induction current and the thermal conductivity of the material on the generation of the temperature field will be studied in detail in Section 4.5.

4.3. Working Performance

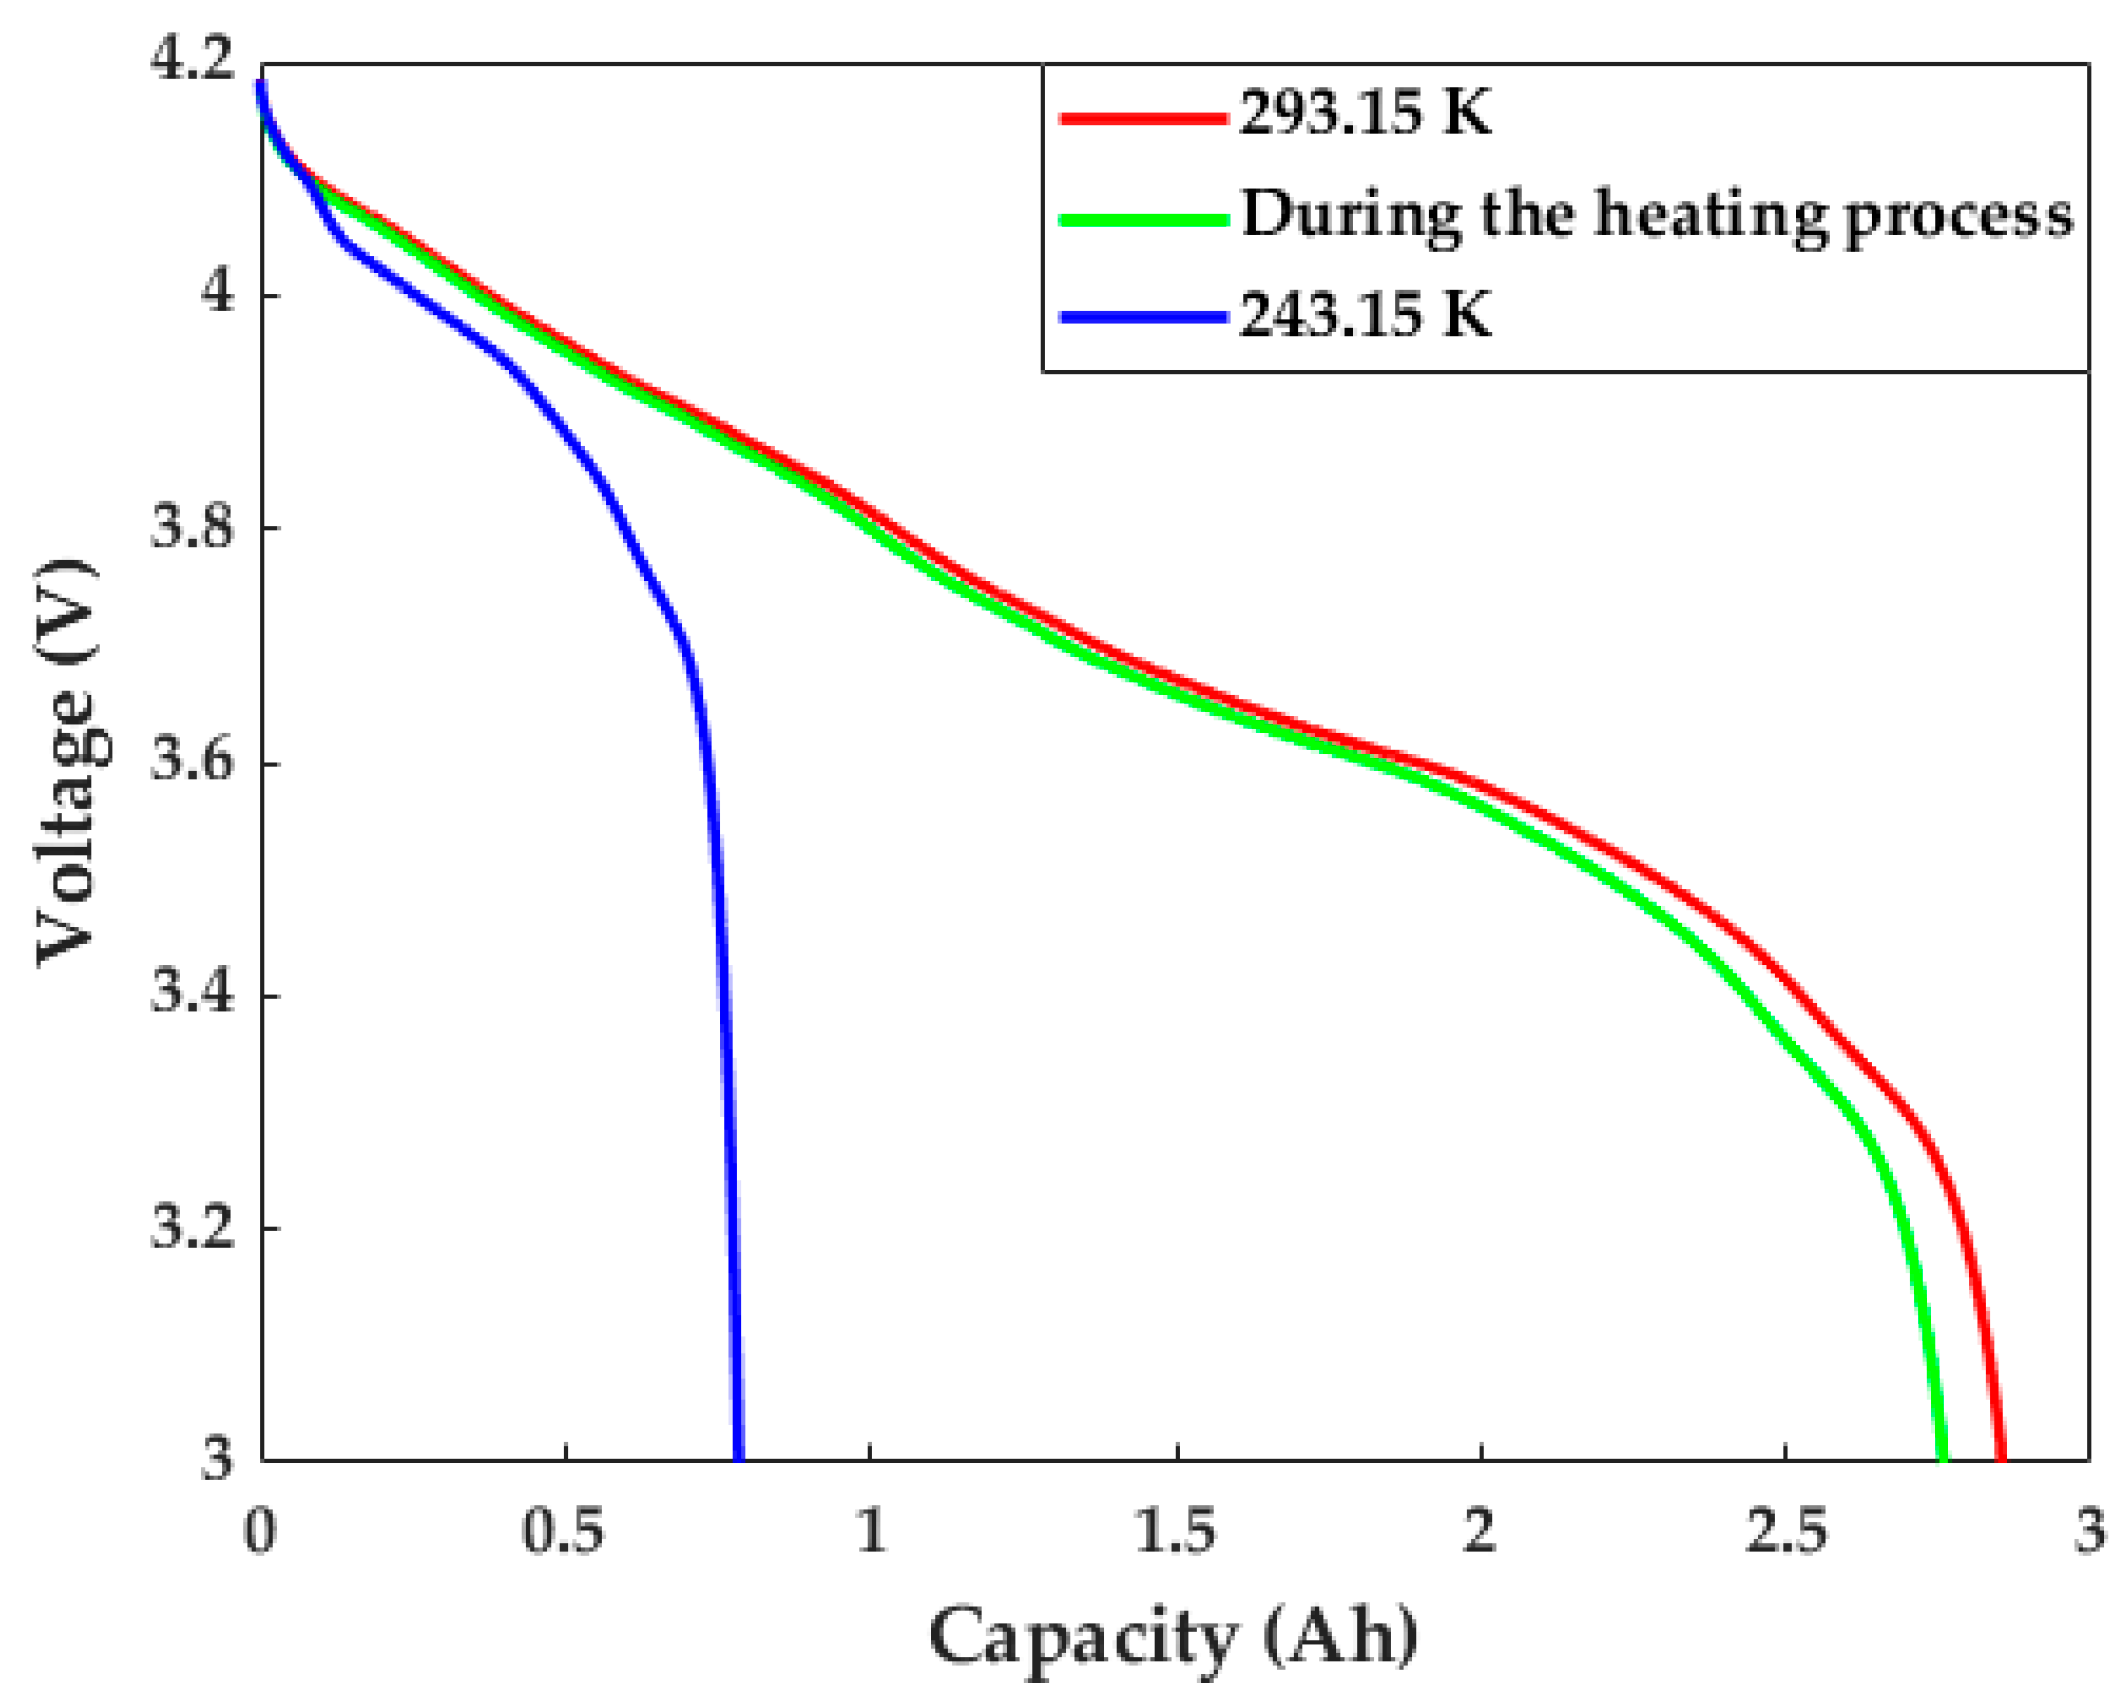
Figure 13 shows the voltage variation with a 1 C discharge capacity during the heating process. The discharge capacity at a 1 C rate reached 96.67% of the normal temperature level, which is 2.52 times better than the situation at 243.15 K. In addition, the 1 C discharge energy computed by integrating the produced voltage–capacity curves in COMSOL with respect to the discharging time was 764.88 kJ·kg−1 for the LiB heated by the EIHS and 791.96 and 234.4 kJ·kg−1 for the LiB operated at 293.15 and 243.15 K, respectively. These results indicate that the enhancement of the terminal voltage output ability can reduce the potential degradation of the LiB material and improve the usable energy of the LiB to a large extent, hence providing a greater driving range for EVs operating in cold climates.
The HPPC test results are exhibited in Figure 14. Both the charging and discharging internal resistance could be decreased to less than a quarter of the low-temperature level, as compared with 46.6% for the heating film in [26] and 36.67% for AC heating in [40]. This indicates that the variation in the temperature-dependent parameters in the electrochemical model can give rise to a decrease in internal resistance to a large degree during the heating process, which has a decisive influence on the pulse power and usable energy. On the one hand, the discharge power was improved by the EIHS from 159.55 to 675.9 W·kg−1 for 90% DOD and 128.16 to 574.87 W·kg−1 for 60% DOD after the heating process, suggesting that the acceleration, climbing performance, maximum speed, and other dynamic parameters can be enhanced so as to introduce greater possibilities for the operating mode when a high power output is needed. On the other hand, besides the discharge power, the improvement in the charge power was impressive, reaching 2.73- and 3.38-times advancements for 90% and 60% DOD as compared to the low-temperature situation, respectively. Thus, the effective utilization of stored energy and fast charging in cold weather can be realized through the enhancement of the EIHS-induced regeneration power output ability.
Therefore, the enhancement of both the pulse power and usable energy at low temperatures can improve the durability and dynamics of EVs in order to enable more applications, such as long-range driving in complex road conditions, the full recovery of the regeneration braking energy, and so on.

4.4. The Effect of the Heating Strategy on the Battery Cycle Lifetime

Figure 15 compares the discharge capacity calibration results obtained every 15 cycles during the heating cycle test with the normal cycle test results at 293.15 K. There was a capacity loss of 0.103 Ah after 120 heating cycles at 1 C, as compared with the initial capacity. When comparing the results with the room-temperature data at 1 C, the capacity calibration profiles are almost the same as in the normal CC discharging situation at 293.15 K. The largest capacity retention difference between heating and normal cycles appeared for 75 cycles at 0.27%, and the difference after 120 heating cycles was only 0.23%. The same situation also arose in the cycle tests at 2 C and 3 C. We can observe from Figure 15a that there was only a 0.27% discharge capacity retention deterioration at 2 C and 3 C, implying that the proposed EIHS has nearly no negative effect on the LiB’s cycle lifespan because of the minor capacity degradation. Thus, the heating strategy does not give rise to LiB aging and causes less damage to the state of health. In other words, the EIHS does not warm the LiB with a high heating velocity at the expense of capacity deterioration. It can be seen from Figure 15a that the variation in the discharging capacity with the cycle time almost exhibited a linearly decreasing trend after 120 heating cycles, so we conclude that there was a 3.83% loss in capacity retention after 2000 cycles at the 1 C rate, based on the collected capacity calibration results.

4.5. Analysis of the Temperature Field

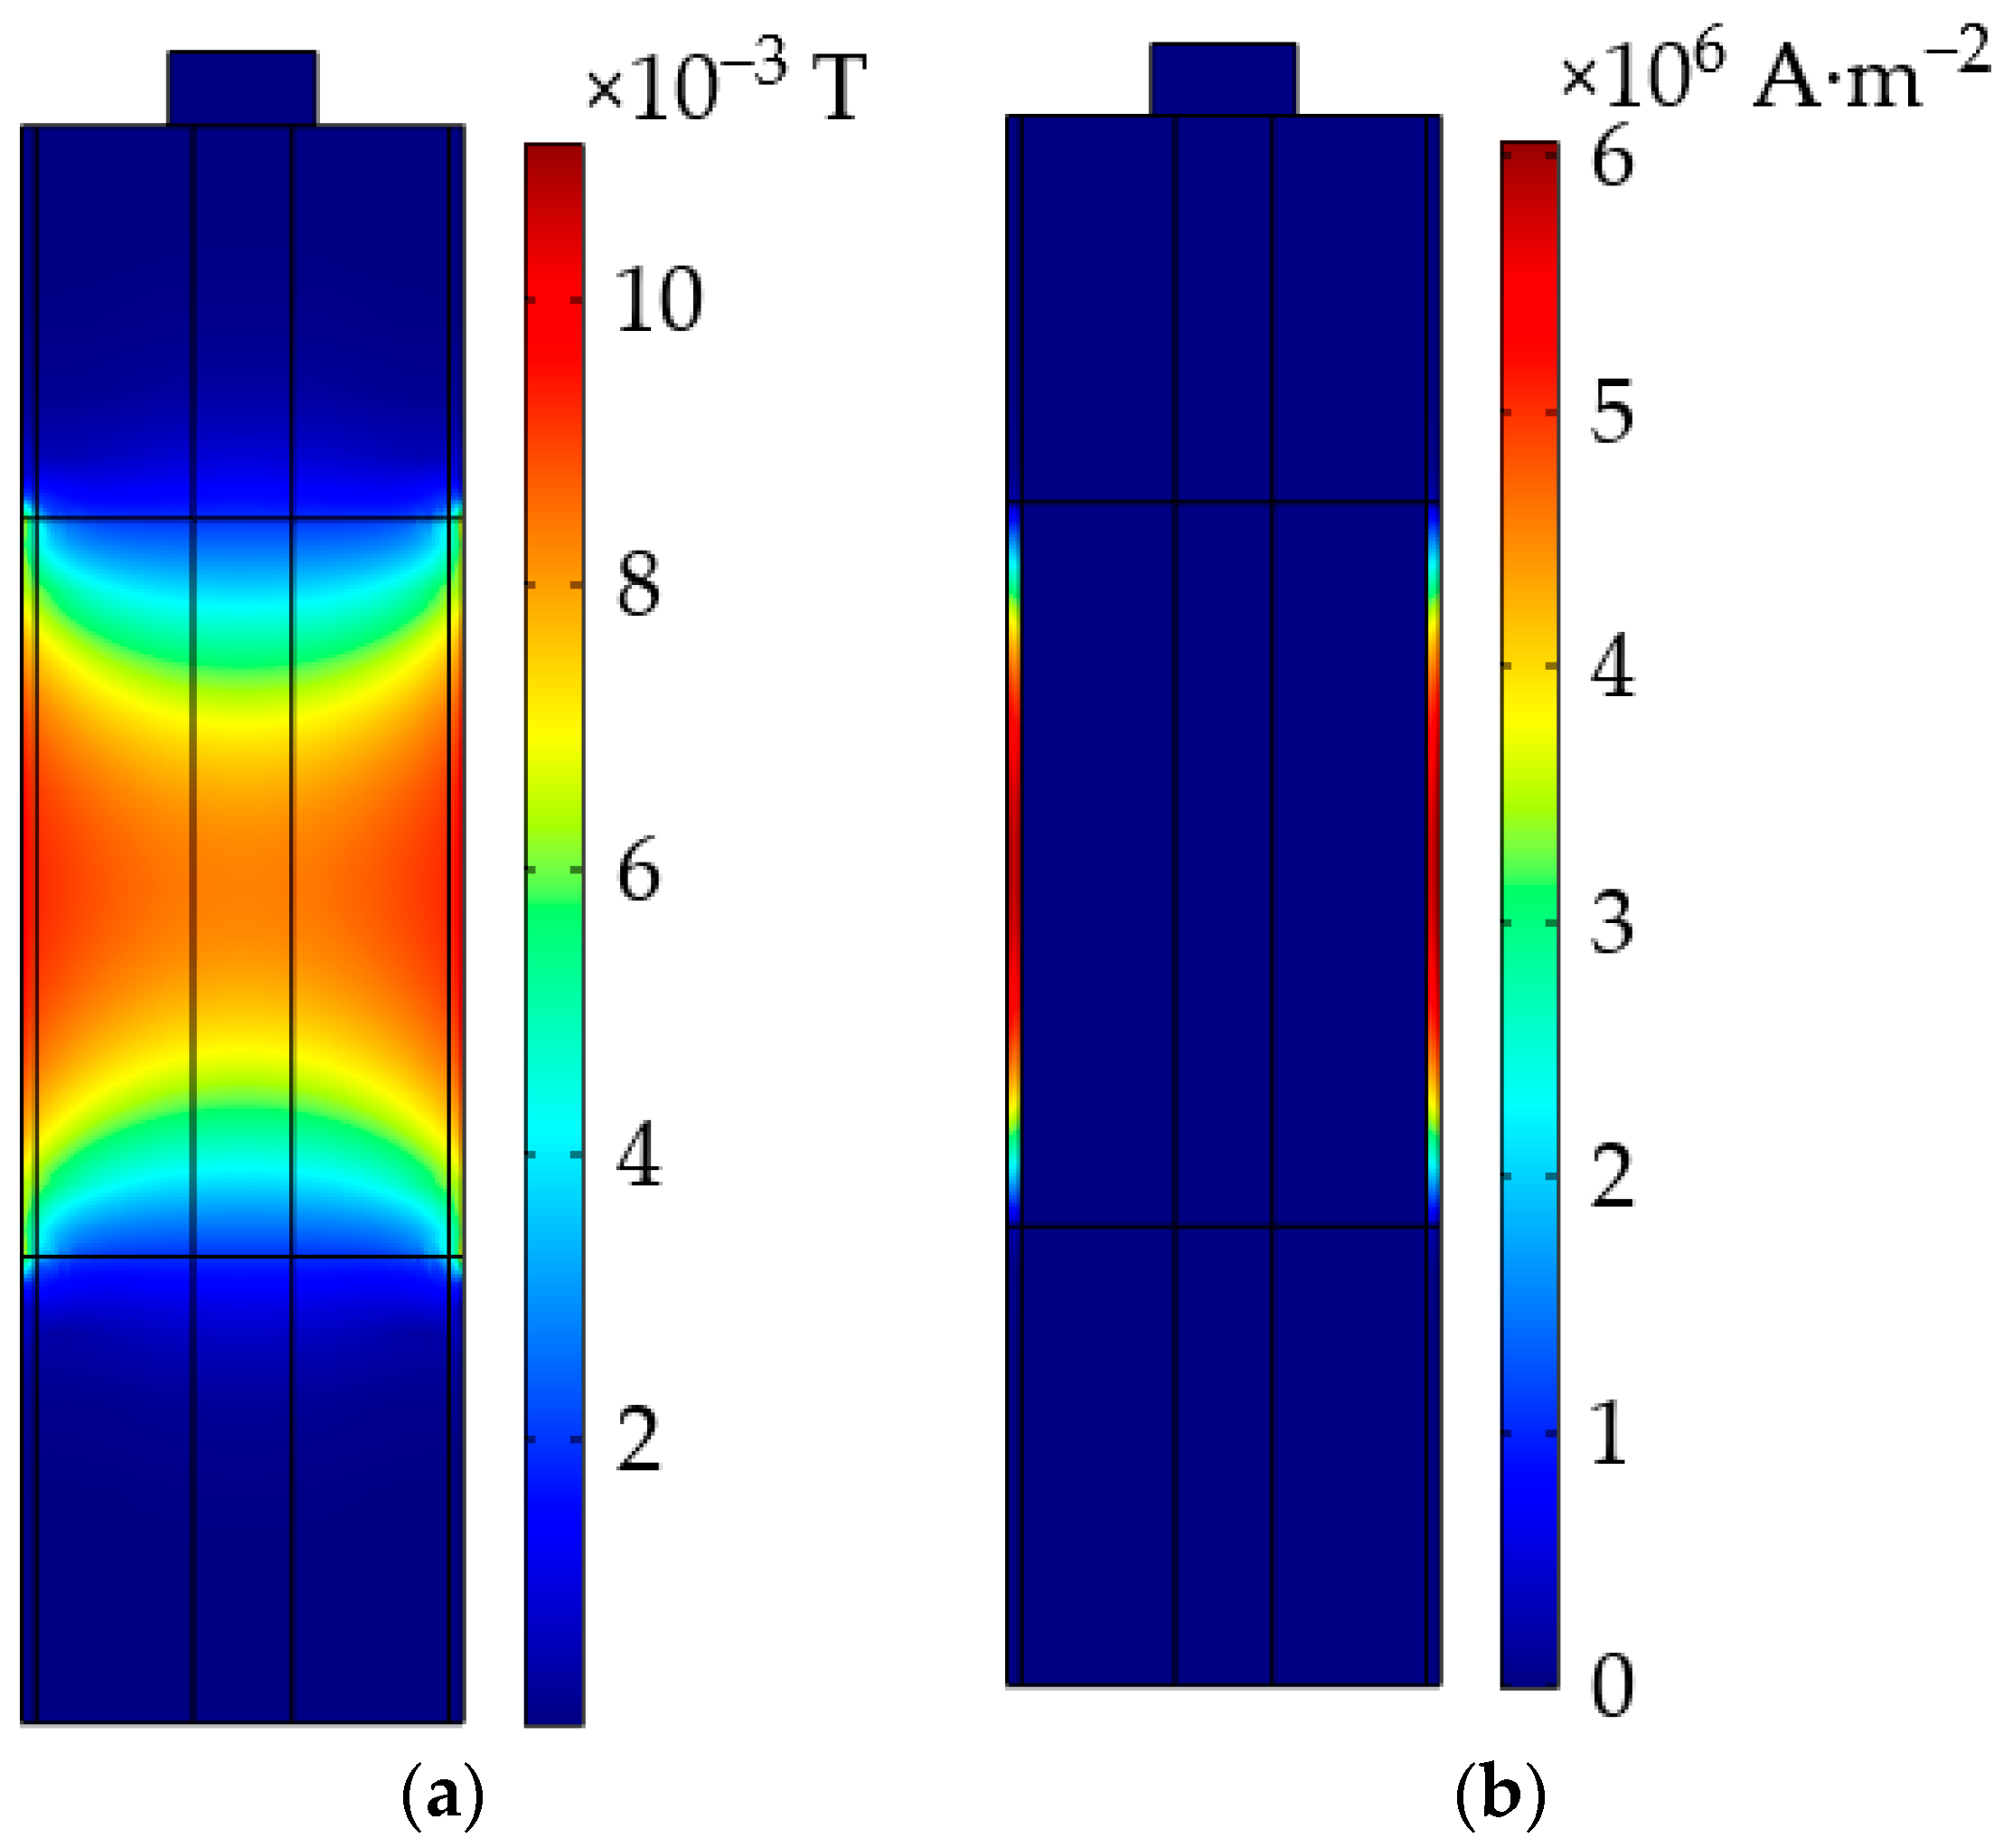
According to the skin effect and Equations (4)–(6), the higher the alternating current amplitude, the greater the induction current distribution difference from the outer surface of the LiB shell to the permeation depth. Moreover, the higher the frequency, the smaller the induction current permeation depth, which has a direct influence on the heat production inside the LiB. Thus, there is a strong interaction between the magnetic field and temperature distribution. As can be seen from Figure 16, the magnetic flux at the cross-section from the shell to the mandrel presented a decreasing distribution, and the maximum magnetic intensity was found on the outer surface of the shell, which corresponds to the skin effect. However, unlike the magnetic flux distribution, the induction current only existed in the interior of the shell because the nylon and active materials were non-ferromagnetic materials which could not be permeated by the eddy current. Moreover, there was almost no induction current distribution difference between the outer and inner surfaces of the shell, which resulted from the fact that the skin depth of the shell calculated with Equation (6) was more than double the shell thickness, so the induction current could be considered to have achieved homogeneous distribution in the interior of the shell. The heat generation inside the LiB shell was realized by the eddy current loss, and the production of a temperature gradient inside the LiB during the heating process entirely depended on the heat conductivity of the LiB materials; this is beneficial for the temperature uniformity inside an LiB. Therefore, combined with the temperature distribution in Figure 12c, the results show that the temperature gradient mainly existed in the active material and mandrel. In other words, the temperature uniformity was determined by the heat transfer property of the LiB material, which is in line with the analysis presented above.
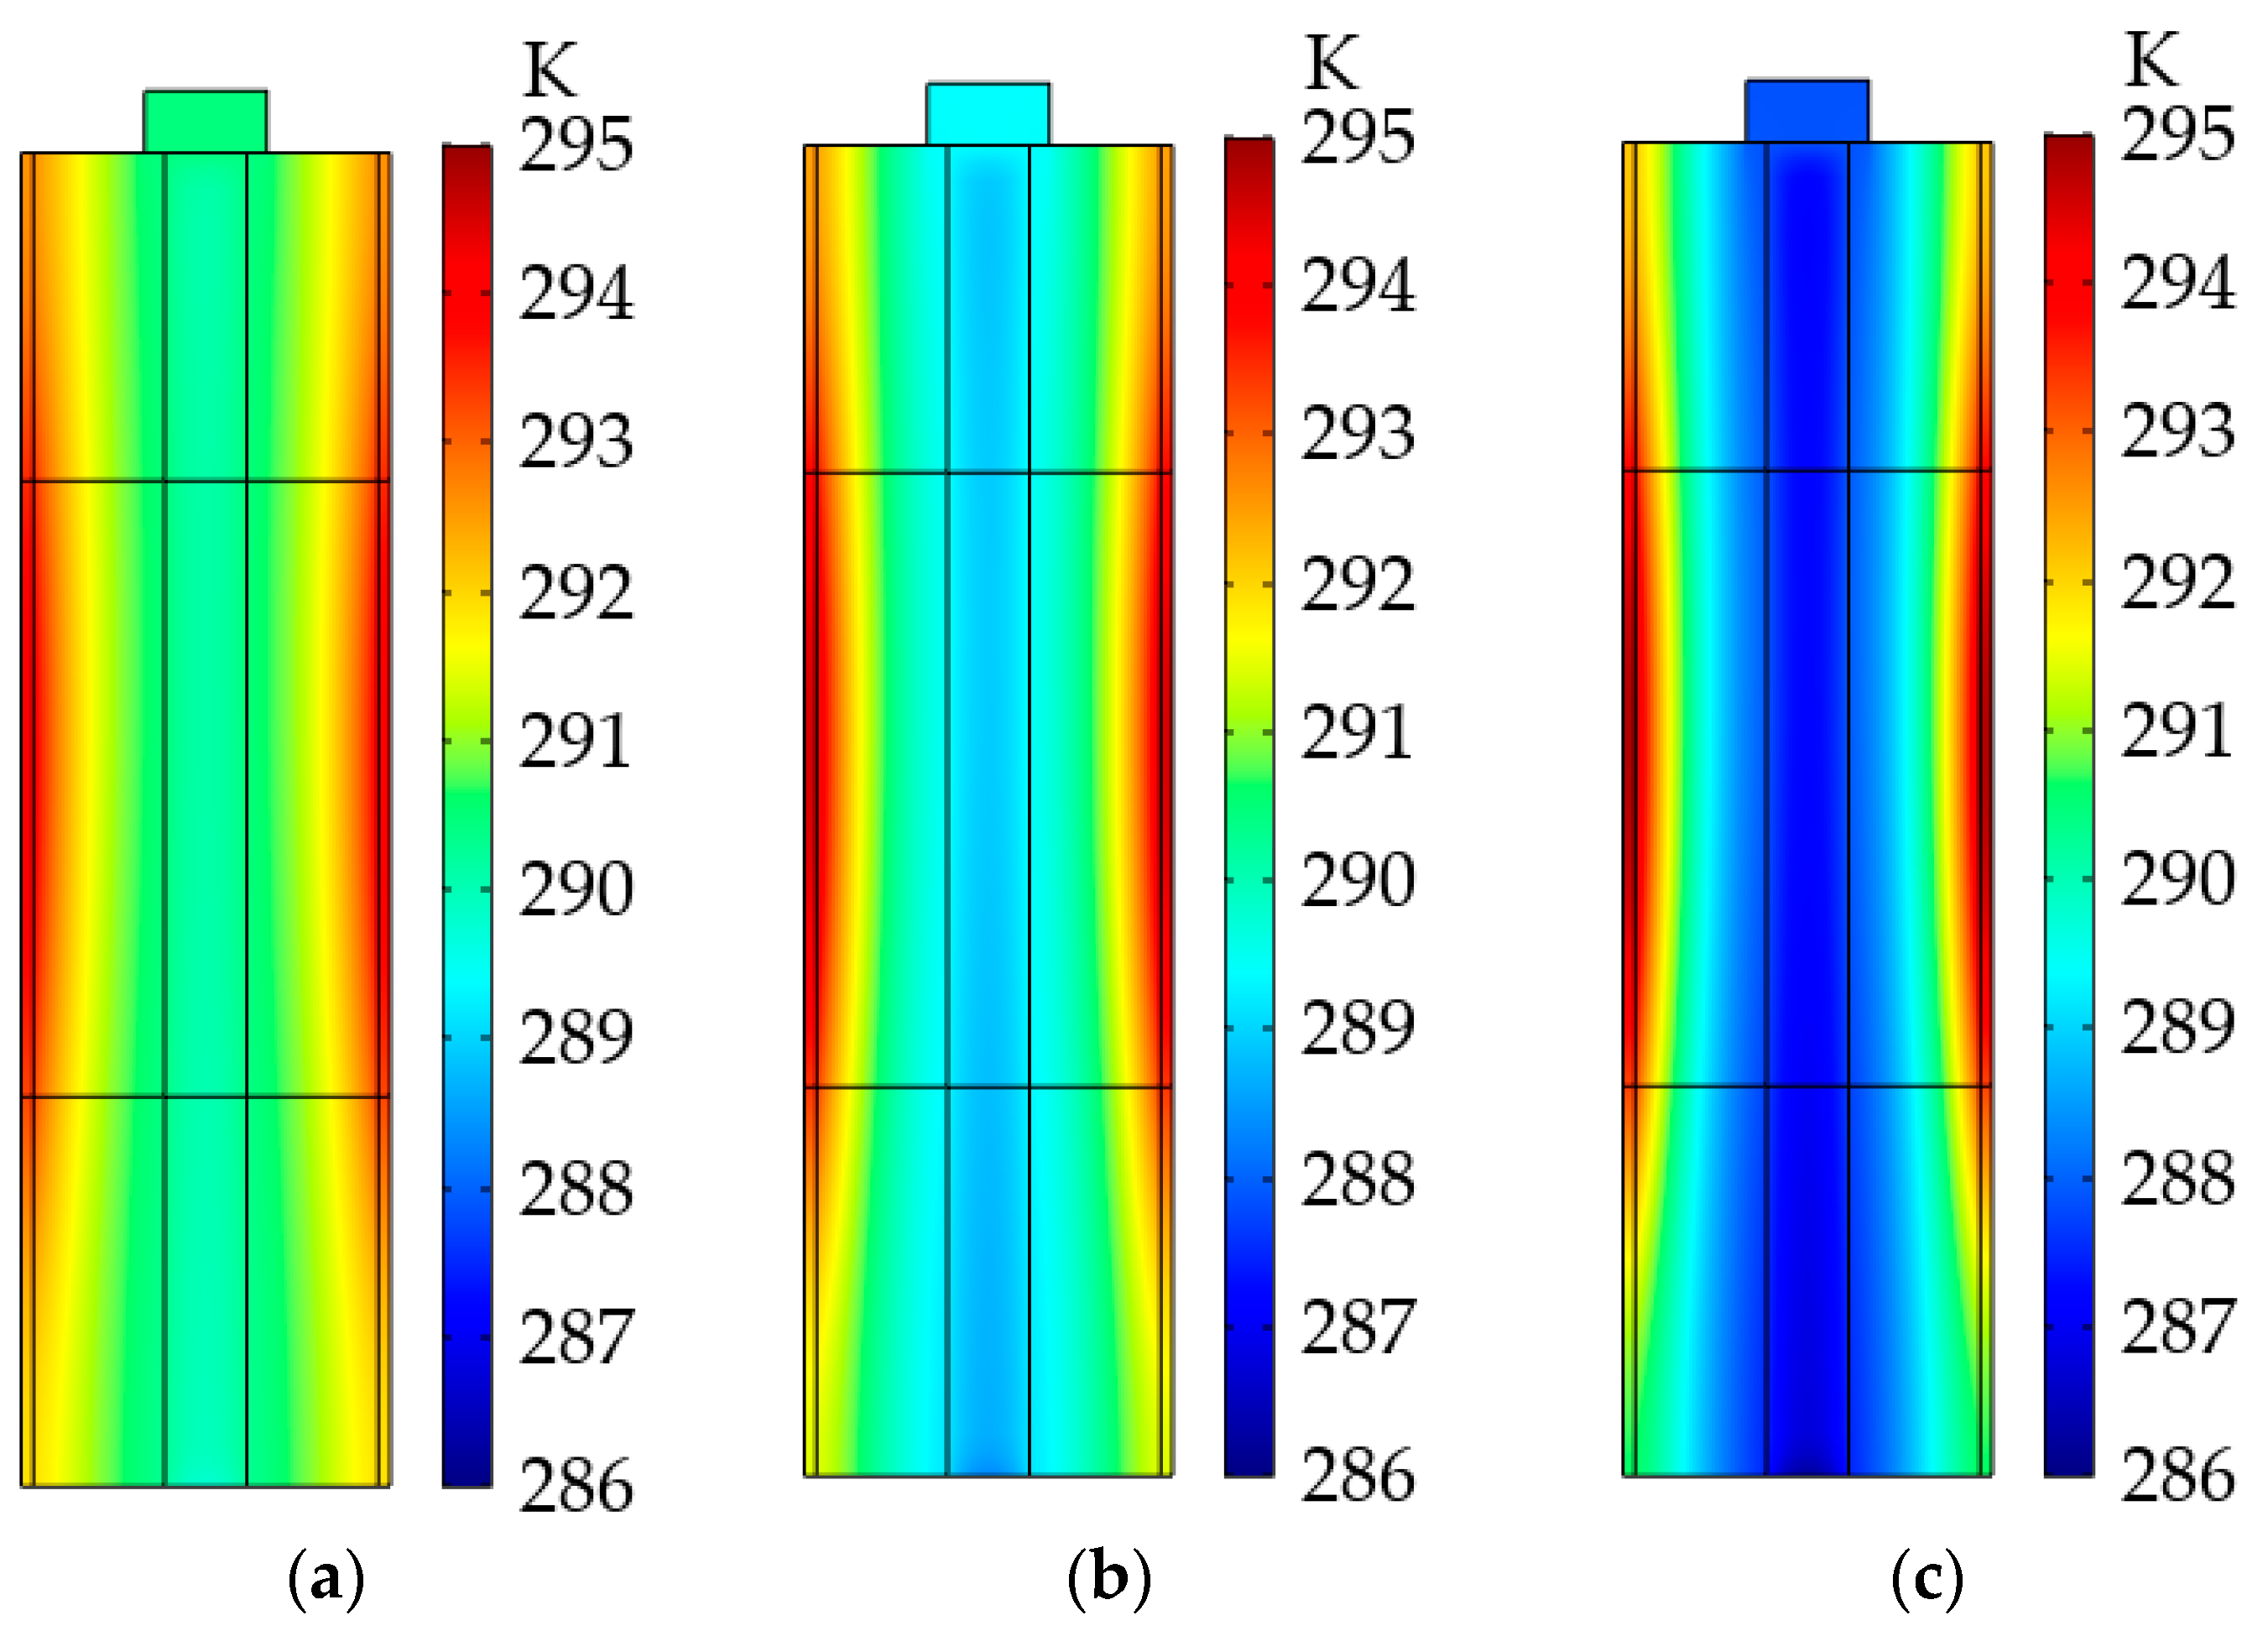
According to the above discussions, the heat transfer in the active material and mandrel of the LiB was achieved via heat conduction from the inner surface of the shell to the mandrel, depending on the thermal conductivity of the LiB material. Figure 17 shows the variation in the temperature distribution after the heating process with the thermal conductivity of the active material. When the thermal conductivity was set at 0.9, 0.8, and 0.7 W·m−1·K−1, the temperature differences in the interior of the LiB reached 4.21, 6.05, and 8.53 K, respectively, suggesting that the heat conduction enhancement of the LiB material can decrease the temperature gradient inside the LiB during the heating process. This would reduce the electrode material’s degradation and localized thermal-induced aging action, so the application of an LiB material with high heat conductivity may be beneficial for the improvement of the heating effect, ensuring the safety and causing less damage to the electrochemical performance.

5. Conclusions

In this work, based on the EIHS with thermal energy generated by the induction current-induced eddy current loss, a “L8193” orthogonal test with three factors (copper coil turns, alternating current amplitude, and frequency) and nine levels was introduced to investigate the effect of the copper coil parameters on the temperature rise behavior so as to optimize the heating performance. Under the optimal parameter combination, the improvements in the electrochemical and thermal performance of the LiB through the proposed heating strategy were characterized by the proposed high-precision ETCM, which was validated against the CC discharge and HPPC test data at room and different low temperatures. The influencing factors and the formation of the temperature field inside the LiB during the heating process were also studied, revealing the following salient features.
(a) A good compromise. Under the best parameter combination (alternating current = 12 A; frequency = 6 kHz; induction coil turns = 180), the LiB could be heated to 293.15 K from 243.15 K within 494 s, with a temperature difference of 4.21 K after the heating process, indicating that the heating strategy can achieve a balance between the heat generation velocity and temperature uniformity.
(b) The improvement of the energy output performance. Due to the internal resistance, which decreased to less than a quarter of that in the low-temperature situation, the enhancement of the terminal voltage output gave rise to a substantial improvement in both the pulse power and usable energy, which could provide a larger cruise range and better dynamics for EVs so as to enhance the practicability of EVs in cold weather.
(c) Almost no negative effect on LiB aging. After 120 heating cycles, the 1 C discharge capacity retention reached 96.39% of the initial level. Compared with the normal charge–discharge cycles at 293.15 K, there was only a 0.23% capacity retention loss, and the capacity calibration results were almost the same. This indicates that the EIHS did not give rise to an apparent capacity deterioration and had almost no impact on the LiB cycle lifetime.
(d) The production of a temperature field. Based on the LiB material’s properties and the fact that the skin depth of the LiB shell was much greater than the thickness of the shell, the heat generation inside the shell showed homogeneous distribution. Moreover, the temperature difference during the heating process depended on the thermal conduction of the materials in the interior of the LiB. The temperature difference inside the LiB could be reduced with an increase in the radial thermal conductivity of the active material.
According to the above research, the EIHS under the optimal parameter combination found in the orthogonal test could achieve an excellent tradeoff among the temperature rise behavior, energy output, and state of health. The optimization of the heat conductivity of the LiB material with regard to safety and a satisfactory working ability is beneficial for the heating effect of the EIHS. In engineering applications, when an LiB operates at subzero temperatures, the heating system could be started automatically upon receiving a temperature signal from a sensor; thus, it could heat the LiB with a high temperature rise rate and uniform heat distribution. However, power batteries can exhibit irreversible aging effects during long-term operating processes, leading to variations in the heating effect of the proposed EIHS. The heating method based on the orthogonal test is only suitable for the current specific usage of LiBs, which does not reflect the LiB application requirements for all statuses and lifecycles. In other words, the optimal parameter combination determined by the heating strategy may not be the best combination for the LiB in each state. In order to further improve the heating performance of the proposed EIHS for various lifespan cycles and operating statuses, future research will focus on a heating strategy with alternating current parameters updated in real time on the basis of the proposed ETCM and an equivalent electrical circuit model for the real-time optimization of the induction coil parameters.
Author Contributions

Conceptualization, B.W.; methodology, B.W. and M.Y.; software, B.W.; validation, B.W.; formal analysis, M.Y.; investigation, B.W. and M.Y.; resources, M.Y.; data curation, B.W. and M.Y.; writing—original draft preparation, B.W.; writing—review and editing, B.W. and M.Y.; visualization, B.W. and M.Y.; supervision, B.W. and M.Y.; project administration, M.Y. All authors have read and agreed to the published version of the manuscript.

Funding

This research received no external funding.

Data Availability Statement

The data presented in this study are available on request from the corresponding author.

Conflicts of Interest

The authors declare no conflicts of interest.

Nomenclature

All of the parameters in the paper are as follows:
SymbolDescription
asspecific superficial area (m−1)
Bmmagnetic induction density (T)
CeLi+ concentration in liquid phase (mol·m−3)
Cpheat capacity at constant pressure (J·kg−1·K−1)
CsLi+ concentration in solid phase (mol·m−3)
CeLi+ concentration in liquid phase (mol·m−3)
Dsionic diffusivity in solid phase (m2·S−1)
D e e f f effective ionic diffusivity in liquid phase (m2·S−1)
dtemperature difference inside battery (K)
dU/dTentropy heat coefficient (V·K−1)
Eeffective value of induced electromotive force (V)
Eactactivation energy (J·mol−1)
einduced electromotive force (V)
FFaraday’s constant (C·mol−1)
hsurface heat transfer coefficient (W·m−2·K−1)
Ieddy current inside battery (A)
I0eddy current on surface of battery shell (A)
i0exchange current density (A·m−2)
i1current density in electrode (A·m−2)
i2current density in electrolyte (A·m−2)
iappapplied current density (A·m−2)
jlocal chemical reaction current density (A·m−2)
kchemical reaction rate constant
Ltotal length of electrode (m)
Lneg, Lpos, Lseplength of negative electrode/positive electrode/separator (m)
Ninduction coil turn
Qactactivation heat (J)
Qbattheat generation during process of electrochemical reaction (J)
Qmagelectromagnetic induction heat (J)
Qohmohmic heat (J)
Qreareaction heat (J)
Qtotaltotal heat generation during heating process (J)
Rgas constant (J·mo1−1·K−1)
Rbattbattery resistance (Ω)
RSEIimpedance of SEI film (Ω)
Scross-section of battery (m2)
Tbattery temperature (K)
Taambient temperature (K)
Treftemperature reference value (K)
ttime (s)
t + 0 transference number
Uelectrode equilibrium potential (V)
Urefeffective value electrode equilibrium potential (V)
xdistance from battery surface (m)
z+charge number
αa, αccharge transfer coefficient
δskin depth (m)
εevolume faction in liquid phase
ηselectrochemical reaction overpotential (V)
λheat conductivity (W·m−1·K−1)
μ0absolute magnetic permeability of battery shell (H·m−1)
μrrelative magnetic permeability of battery shell (1)
ρdensity (mol·m−3)
σelectrical conductivity (S·m−1)
σ e f f e   effective electrical conductivity in liquid phase (S·m−1)
σ s e f f effective electrical conductivity in solid phase (S·m−1)
υ+Li+ stoichiometric number
Φepotential in liquid phase (V)
Φspotential in solid phase (V)
φmagnetic flux (Wb)
φmamplitude of magnetic flux (Wb)
ψtemperature-dependent parameter
ψrefreference value of temperature-dependent parameter
ωangular velocity of alternating current (rad·s−1)
Abbreviation
ACalternating current
ATRaverage temperature rise rate
BTMSbattery thermal management system
CCconstant current
CVconstant voltage
DCdirect current
DODdepth of discharge
EIHSelectromagnetic induction heating system
ETCMelectrochemical–thermal coupling model
EVselectric vehicles
expexponent
IEFinduction electromotive force
LiBlithium-ion battery
OCPopen circuit potential
P2Dpseudo-two-dimensional model
SOCstate of charge

References

  1. Liang, J.; Li, Y.; Yuan, H.; Wang, Y.; WU, Y.; Wang, H. Research progress of low-temperature lithium-ion battery. J. Beijing Univ. Aeronaut. Astronaut. 2021, 47, 2155–2174. [Google Scholar] [CrossRef]
  2. Wu, S.; Xiong, R.; Li, H.; Nian, V.; Ma, S. The state of the art on preheating lithium-ion batteries in cold weather. J. Energy Storage 2020, 27, 101059.1–101059.13. [Google Scholar] [CrossRef]
  3. Guo, S.; Xiong, R.; Wang, K.; Sun, F. A novel echelon internal heating strategy of cold batteries for all-climate electric vehicles application. Appl. Energy 2018, 219, 256–263. [Google Scholar] [CrossRef]
  4. Yang, X.; Zhang, G.; Wang, C. Computational design and refinement of self-heating lithium ion batteries. J. Power Sources 2016, 328, 203–211. [Google Scholar] [CrossRef]
  5. Zhang, S.; Xu, K.; Jow, T. Electrochemical impedance study on the low temperature of Li-ion batteries. Electrochem. Acta 2004, 49, 1057–1061. [Google Scholar] [CrossRef]
  6. Chen, Y.; Dou, X.; Wang, K.; Han, Y. Lithium dendrites inhibition via diffusion enhancement. Adv. Energy Mater. 2019, 9, 1900019.1–1900019.7. [Google Scholar] [CrossRef]
  7. Chen, Y. Inhibition of Lithium Dendrites via Manipulating Chemical Reaction and Diffusion. Ph.D. Thesis, Institute of Process Engineering, Chinese Academy of Sciences, Beijing, China, 2019. [Google Scholar]
  8. Zhang, J.; Ge, H.; Li, Z.; Ding, Z. Internal heating of lithium-ion batteries using alternating current based on the heat generation model in frequency domain. J. Power Sources 2015, 273, 1030–1037. [Google Scholar] [CrossRef]
  9. Zhu, J.; Sun, Z.; Wei, X.; Dai, H.; Fang, Q.; Tang, X. Research progress on low-temperature characteristics and heating techniques of vehicle lithium-ion battery. Automot. Eng. 2019, 41, 571–581+589. [Google Scholar] [CrossRef]
  10. Lee, D.; Cho, C.; Won, J.; Park, Y.; Lee, M. Performance characteristics of mobile heat pump for a large passenger electric vehicle. Appl. Therm. Eng. 2023, 50, 660–669. [Google Scholar] [CrossRef]
  11. Matthe, R.; Turner, L.; Mettlach, H. VOLTEC battery system for electric vehicle with extended range. SAE Int. J. Engines 2011, 4, 1944–1962. [Google Scholar] [CrossRef]
  12. Xiong, R.; Wang, K.; Guo, S. Hybrid preheating method for lithium-ion battery used in cold environment. J. Mech. Eng. 2019, 55, 53–59. [Google Scholar] [CrossRef]
  13. Troxler, Y.; Wu, B.; Marinescu, M.; Yufit, V.; Patel, Y.; Marquis, A.; Brandon, V.; Offer, J. The effect of thermal gradients on the performance of lithium-ion batteries. J. Power Sources 2014, 247, 1018–1025. [Google Scholar] [CrossRef]
  14. Wang, C.; Zhang, G.; Ge, S.; Xu, T.; Ji, Y.; Yang, X.; Leng, Y. Lithium-ion battery structure that self-heats at low temperatures. Nature 2016, 529, 515–518. [Google Scholar] [CrossRef] [PubMed]
  15. Zhang, G.; Ge, S.; Yang, X.; Leng, Y.; Marple, D.; Wang, C. Rapid restoration of electric vehicle battery performance while driving at cold temperatures. J. Power Sources 2017, 371, 35–40. [Google Scholar] [CrossRef]
  16. Ji, Y.; Wang, C. Heating strategies for li-ion batteries operated from subzero temperatures. Electrochim. Acta 2013, 107, 664–674. [Google Scholar] [CrossRef]
  17. Xiong, R.; Ma, S.; Chen, Z.; Sun, F. Electrochemical thermal coupling characteristics and modeling for lithium-ion battery op-erating with extremely self-fast heating. J. Mech. Eng. 2021, 57, 179–189. [Google Scholar] [CrossRef]
  18. Lei, Z.; Zhang, C.; Li, J.; Lin, Z. Preheating method of lithium-ion batteries in an electric vehicle. J. Mod. Power Syst. Clean Energy 2015, 3, 289–296. [Google Scholar] [CrossRef]
  19. Wang, J.; Ruan, L.; Qiu, Y. Research progress on rapid heating methods for lithium-ion batteries in low-temperature. Energy Storage Sci. Technol. 2022, 11, 1563–1574. [Google Scholar] [CrossRef]
  20. Li, J.; Wu, P.; Zhang, C. Study and implementation of thermal management technology for the power batteries of electric vehicles. Automot. Eng. 2016, 38, 22–27. [Google Scholar] [CrossRef]
  21. Hu, X.; Zheng, Y.; Howey, D.; Perez, H.; Foley, A.; Pecht, M. Battery warm-up methodologies at subzero temperatures for automotive applications: Recent advances and perspectives. Prog. Energy Combust. Sci. 2020, 77, 100806. [Google Scholar] [CrossRef]
  22. Yang, Y.; Wei, X.; Liu, Y.; Dai, H.; Zhu, J.; Fang, Q. A research on the AC heating of automotive lithium-ion battery. Automot. Eng. 2016, 7, 901–908. [Google Scholar] [CrossRef]
  23. Ruan, H.; Jiang, J.; Sun, B.; Zhang, W.; Gao, W.; Wang, L.; Ma, Z. A rapid low-temperature internal heating strategy with optimal frequency based on constant polarization voltage for lithium-ion batteries. Appl. Energy 2016, 177, 771–782. [Google Scholar] [CrossRef]
  24. Li, G.; Huang, X.; Fu, X.; Yang, Y. Design research on battery heating and preservation system based on liquid cooling mode. J. Hunan Univ. (Nat. Sci.) 2017, 44, 26–33. [Google Scholar] [CrossRef]
  25. Salameh, Z.; Alaoui, C. Modeling and simulation of a thermal management system for electric vehicles. In Proceedings of the 29th Annual Conference of the IEEE Industrial Electronics Society, Roanoke, VA, USA, 2–6 November 2003. [Google Scholar]
  26. Liu, B. Study on the Control Strategy for Power Battery Thermal Management on Electric Vehicles. Ph.D. Thesis, Beijing Institute of Technology, Beijing, China, 2015. [Google Scholar]
  27. Su, Z. A Lithium Ion Power Battery Heating Device. China Patent CN101710630A, 10 August 2011. [Google Scholar]
  28. Zhu, F.; Jiang, J.; He, Y.; Chen, Y. Study on electric-thermal performance of small scale lithium battery module under low-temperature heating process. Chin. J. Power Sources 2022, 46, 1373–1377. [Google Scholar] [CrossRef]
  29. Wang, B.; Yan, M. Research on the improvement of lithium-Ion battery performance at low temperatures based on electromagnetic induction heating technology. Energies 2023, 16, 7780. [Google Scholar] [CrossRef]
  30. Doyle, M.; Fuller, T.; Newman, J. Modeling of galvanostatic charge and discharge of the lithium/polymer/insertion cell. J. Electrochem. Soc. 1993, 140, 1526–1533. [Google Scholar] [CrossRef]
  31. Newman, J.; Thomas-Alyea, K. Electrochemical Systems, 3rd ed.; John Wiley & Sons, Inc.: Hoboken, NJ, USA, 2004; pp. 517–558. [Google Scholar]
  32. Kong, X.; Plett, G.; Trimboli, M.; Zhang, Z.; Qiao, D.; Zhao, T.; Zheng, Y. Pseudo-two-dimensional model and impedance diagnosis of micro internal short circuit in lithium-ion cells. J. Energy Storage 2020, 27, 101085. [Google Scholar] [CrossRef]
  33. Ren, D.; Kandler, S.; Guo, D.; Han, X.; Feng, X.; Lu, L.; Ouyang, M.; Li, J. Investigation of lithium plating-stripping process in Li-Ion batteries at low temperature using an electrochemical model. J. Electrochem. Soc. 2018, 165, A2167–A2178. [Google Scholar] [CrossRef]
  34. Kuang, K.; Sun, Y.; Ren, D.; Han, X.; Zheng, Y.; Geng, Z. Efficient approach for electrochemical-thermal coupled modeling of large-format lithium-ion power battery. J. Mech. Eng. 2021, 57, 10–22. [Google Scholar] [CrossRef]
  35. Zhang, D.; Wen, H.; Ouyang, H. Research on low-temperature pulse heating of a battery based on an electrochemical-thermal coupled model. Energy Storage Sci. Technol. 2022, 11, 3597. [Google Scholar] [CrossRef]
  36. Yang, J.; Zhang, H.; Xu, Y.; Li, P. Analysis of heat generation in lithium-ion battery components and voltage rebound based on electrochemical and thermal coupled model. J. Energy Storage 2023, 72, 108554. [Google Scholar] [CrossRef]
  37. Sun, T.; Zheng, X.; Zheng, Y.; Lv, Y.; Kuang, K.; Han, X. Fast charging control of lithium-ion batteries based on electrochemical-thermal coupling model. Automot. Eng. 2022, 44, 495–504. [Google Scholar] [CrossRef]
  38. Yu, Q. Electrochemical-Thermal Coupling Simulation of NCM Ternary Power Battery. Master’s Thesis, Chongqing University, Chongqing, China, 2021. [Google Scholar]
  39. Chen, Z.; Xiong, R.; Li, S.; Zhang, B. Extremely fast heating method of the lithium-ion battery at cold climate for electric vehicle. J. Mech. Eng. 2021, 57, 113–120. [Google Scholar] [CrossRef]
  40. He, X.; Sun, B.; Ruan, H.; Wang, Z.; Su, X. A variable-frequency and variable-amplitude AC low-temperature self-heating strategy for lithium-ion battery. Trans. China Electrotech. Soc. 2019, 34, 1798–1805. [Google Scholar] [CrossRef]
Figure 1. The framework of the electrochemical–thermal coupling model.
Energies 17 03678 g001
Figure 2. A diagram of the electrochemical induction heating system.
Energies 17 03678 g002
Figure 3. The heating system’s mesh grid structure.
Energies 17 03678 g003
Figure 4. Line diagram, solid lines = normal cycle at room temperature, dashed lines = heating cycle.
Energies 17 03678 g004
Figure 5. The procedure of the HPPC test.
Energies 17 03678 g005
Figure 6. The procedure of the heating cycle test.
Energies 17 03678 g006
Figure 7. The response results of the constant-current discharge test with 1 C at 298.15 K; solid lines = numerical results, circle markers = test results. (a) Voltage response; (b) temperature response.
Energies 17 03678 g007
Figure 8. Variations in the discharging and charging performance with the C rate.
Energies 17 03678 g008
Figure 9. The capacity–voltage profiles during the constant-current discharge test with 1 C at different low temperatures; solid lines = test results, dashed lines = calculated results.
Energies 17 03678 g009
Figure 10. The pulse response results of the HPPC test at different low temperatures; star markers = simulated results, circle markers = test data. (a) Open circuit potential response; (b) internal resistance response.
Energies 17 03678 g010
Figure 11. The relationship between the factor level and score.
Energies 17 03678 g011
Figure 12. The temperature rise effect. (a) The variation in the temperature with the heating time; (b) the temperature rise rate; (c) the temperature distribution after heating.
Energies 17 03678 g012
Figure 13. Variation in the 1 C discharge voltage with the capacity during the heating process.
Energies 17 03678 g013
Figure 14. The HPPC test results after the heating process; solid line = at the end of heating, dashed line = no heating action. (a) Internal resistance; (b) pulse power.
Energies 17 03678 g014
Figure 15. The discharging capacity calibration results during the heating cycles; solid lines = normal cycle at room temperature, dashed lines = heating cycle. (a) The variation in discharge retention with the heating cycle time; (b) the discharge capacity calibration profiles at 1 C.
Energies 17 03678 g015
Figure 16. The electromagnetic field distribution inside the battery. (a) Magnetic flux distribution; (b) induction current density distribution.
Energies 17 03678 g016
Figure 17. Variation in the temperature distribution with the heat conductivity of the active material. (a) At 0.9 W·m−1·K−1; (b) at 0.8 W·m−1·K−1; (c) at 0.7 W·m−1·K−1.
Energies 17 03678 g017
Table 1. Performance of heating methods used in batteries.
Heating MethodHeating Rate (K·min−1)Temperature Difference (K)SafetyRef.
Fluid heating0.671.6Good[24]
Peltier effect heating18Good[25]
Heating film0.332.41Good[26]
Heating plate0.354.07Good[27]
SHLB6010Bad[14]
AC heating2.212.9Bad[3]
DC heating0.677.5Good[28]
Table 2. The governing equations in the electrochemical model.
Governing EquationsBoundary Conditions
Ohm’s law in solid phase i 1 = σ s e f f Φ s x σ s e f f Φ s x x = 0 = σ s e f f Φ s x x = L = i a p p
Φ s x x = L n e g = Φ s x x = L n e g + L s e p = 0
Ohm’s law in liquid phase i 2 = σ e e f f Φ e x + 2 σ e e f f R T F 1 t + 0 l n C e x Φ e x x = 0 = Φ e x x = L = 0
Mass conservation in solid phase C s t = D s 2 C s r 2 + 2 r C s r = D s r 2 r r 2 C s r C s r r = 0 = 0
D s C s r r = R s = j
Mass conservation in liquid phase ε e C e t = x D e e f f C e x i 2 t + 0 x z + υ + F + a s j 1 t + 0 υ + C e x x = 0 = C e x x = L = 0
Exchange current density i 0 = k C e α a C s , m a x C s , s u r f α a C s , s u r f α c
Reaction rate j = i 0 exp α a F η s R T exp α c F η s R T
Electrode equilibrium potential U = U r e f + T r e f T d U d T
Reaction overpotential η s = Φ s Φ e U j R S E I
Battery terminal voltage V ( t ) = Φ s ( L , t ) Φ s ( 0 , t )
Table 3. The governing equations of the heat transfer model.
Equation NameExpression
Energy conservation equation ρ C p T t = λ T + Q t o t a l = 1 r r λ r r T r + 1 r 2 ϕ λ ϕ T ϕ + Z λ Z T Z + Q t o t a l
Boundary condition λ T n = h T a T
Total heat generation Q t o t a l = Q b a t t + Q m a g = Q a c t + Q r e a + Q o h m + Q m a g
Polarization heat Q a c t = a s F j η s
Reaction heat Q r e a = a s F j T d U d T
Ohmic heat Q o h m = σ s e f f Φ s x 2 + σ e e f f Φ e x 2 + 2 σ e e f f R T F 1 t + 0 l n C e x Φ e x
Table 4. The parameters of the research object.
LiB Material/SpecificationValue
Negative/positive electrode materialGraphite/NCA (LiNi0.8Co0.15Al0.05O2)
Electrolyte materialLiPF6 in 3:7 EC:EMC
Shell/connector materialSteel AISI 4340
Mandrel materialNylon
Nominal voltage3.7 V
Charging/discharging cutoff voltage4.2/3.0 V
Nominal capacity3.0 Ah
Diameter/height18/65 mm
Weight48 g
Specific heat capacity1.72 J·g−1·K−1
Table 5. The orthogonal trial design parameters.
LevelInfluencing Factors
A (A)B (Hz)C
141000140
252000160
363000180
474000200
585000220
696000240
7107000260
8118000280
9129000300
Table 6. Range analysis results based on the orthogonal test.
Evaluation IndexA (A)B (Hz)CBlank Column
K1406.16376.66402.86402.584
K2401.92379.59399.6397.37
K3400.32382.25404.8403.45
K4392.3396.91392.64403.11
K5390.69406.97389.35397.14
K6393.87416.08392.58397.88
K7398.11403.31399.68397.61
K8397.37411400.79393.95
K9406.28414.26404.73393.96
k145.1341.8544.7744.73
k244.6642.1844.444.15
k344.4842.4744.9844.83
k443.5944.143.6344.79
k543.4145.2243.2644.13
k643.7646.2343.6244.21
k744.2344.8144.4144.18
k844.1545.6744.5343.77
k945.1446.0344.9743.77
R1.734.381.721.06
Order of primary and secondary influencing factorsB > A > C
Optimal level combinationA9B6C3
Disclaimer/Publisher’s Note: The statements, opinions and data contained in all publications are solely those of the individual author(s) and contributor(s) and not of MDPI and/or the editor(s). MDPI and/or the editor(s) disclaim responsibility for any injury to people or property resulting from any ideas, methods, instructions or products referred to in the content.