1. Introduction
Geothermal energy has gained major recognition as a sustainable and reliable source for both heat and electricity production. While producing deep geothermal energy and directly utilizing geothermal fluids pose significant challenges, especially outside volcanic areas [
1], shallow geothermal energy is widely used globally for heating buildings and generating hot water through heat pumps. In addition, geothermal heat pump systems also have the ability, in some contexts, of cooling down buildings by injecting heat into the ground.
While Switzerland has encountered several challenges in implementing deep geothermal projects, such as in St. Gallen and Basel, in the northeast and northwest of Switzerland, respectively, Lavex in the Rhône Valley at the base of the Alps, and Haute-Sorne in the Jura mountains, caused by low permeability of the reservoir, water scarcity, and seismic activity [
1], it extensively produces thermal energy through its dense network of shallow geothermal systems coupled with heat pumps, with a production of 4246 GWh
th in 2022 [
2]. Despite the considerably large initial investments, these installations require minimal to no ongoing maintenance, with electricity consumption primarily for the heat and circulation pumps [
3].
Application of heat pumps in Switzerland dates back to 1912 when Heinrich Zoelly patented a ground-source heat pump [
4]. The country then witnessed the inauguration of the world’s first house heating heat pump in 1938, leveraging Zürich’s Limmat river water as a heat source and reaching a coefficient of performance (COP) of 2 [
4]. Heat pumps—specifically with vapor compression mechanisms—can be used to extract energy from different sources such as air, water, or the ground [
5]. To transfer heat to the heating fluid, vapor compression heat pumps use an intermediate working fluid with a low boiling point called a refrigerant, which absorbs heat from the chosen source. As a result, this refrigerant evaporates, and the gas is compressed to raise its heat concentration. After transferring its heat to the heating system, the refrigerant is expanded, reducing its concentration in heat, and being ready to absorb heat again [
5]. This cycle primarily uses energy in the compression process, leading to efforts to improve energy consumption, such as employing multi-stage compressors to optimize performance [
6].
Tunnels represent a significant advantage for harnessing geothermal energy due to their overburden structure. As of 2024, Switzerland has a network of over 1600 tunnels [
7], six of which are utilized for heating purposes, including the Gotthard road tunnel, the Lötschberg railway tunnel, the Ricken railway tunnel, the Furka railway tunnel, the Great St Bernard road tunnel, and the Mappo–Morettina road tunnel, all crossing the Alps in different locations [
2]. Tunnels in the Alpine region, benefitting from a geothermal gradient of approximately 25 °C/km [
8], and specifically 28.2 °C/km around the Bedretto tunnel, offer an advantageous environment for geothermal energy utilization. Depending on the tunnel and environmental conditions, the heat source can be selected from its air, rock wall, or water naturally flowing inside the tunnel.
Building on this concept, other regions have also successfully harnessed tunnel environments for energy extraction. For instance, the London Underground in the UK utilizes tunnel air as a heat source for district heating applications; it is continuously being heated by the breaking of trains and the heat kept in the tunnel by the clayey soil surrounding it, acting like a thermal cover [
9,
10]. The captured air’s heat energy is extracted through a ventilation system, circulating the air towards an air-to-water heat exchanger consisting of copper tubes [
9]. Despite seasonal fluctuations, the ventilation system maintains an average winter temperature of 19 °C, contrasting with a summer average of 26 °C [
9]. The district of Bunhill benefits from this infrastructure, delivering about 3.3 MW
th to more than 1350 homes [
9,
11].
As another example, the Metro Torino line 1 tunnel in Italy has been investigated for heat extraction using the ground as a heat source [
12]. The proposed method for heat extraction was the disposal of absorber pipes harnessing heat from the soil surrounding the tunnel [
12]. The estimated heat that could be extracted per square meter corresponds to 53 W
th (“th” represents thermal energy) and 74 W
th in winter and summer, respectively, with a total of 2822 kW
th for the south extension, which is 1350 m in length [
12].
Base tunnels excavated from mountain ranges, like the Alps, benefit from the geothermal gradient and the overburden acting as a thermal buffer. Such tunnels frequently traverse several water inflow zones, where the water temperature can be influenced by the surrounding rock, presenting a significant potential for thermal energy extraction. Water, with its high specific heat capacity and abundance, serves as an excellent heat carrier and has been utilized for heating in several European tunnels, including the Furka base railway tunnel [
13,
14], the Gotthard road tunnel [
2], and the Lötschberg railway tunnel [
2], all located in the Swiss Alps (see
Table 1). In these examples, the tunnel water is transported to the end users, where its thermal potential is harnessed using heat pumps [
2]. However, despite the great potential of these energy sources, their practical application is often constrained by the limited number of end users at the tunnel portals [
15].
The Bedretto tunnel, situated in the Swiss Alps next to the border with Italy, is a base tunnel with an unexploited thermal energy potential. This study aims to quantitatively determine the most effective heat source within the tunnel between its granitic walls, ventilated air, or water flowing through its drainage channel. Upon determining the most suitable heat source, the study conducts a detailed cost and implementation analysis of a heating system utilizing heat pumps to provide hot water to the nearest village. Several studies have covered the topic of energy extraction from tunnels through numerical modeling or retrospectively from existing projects [
9,
12,
17,
18,
19]. While previous research has addressed the estimation of thermal output from multiple tunnels, to the best of the authors’ knowledge there has been a lack of comprehensive case studies focused on the procedure of selecting the most suitable heat source, calculating its thermal energy output, and devising implementation plans alongside an economic model for district heating in mountainous tunnels. This study aims to fill that gap by conducting such an investigation. Additionally, we propose, as future work, to combine the energy extracted from the tunnel inflow with excess solar energy produced during the warmest months of the year for subsurface heat storage.
2. Site Characterization
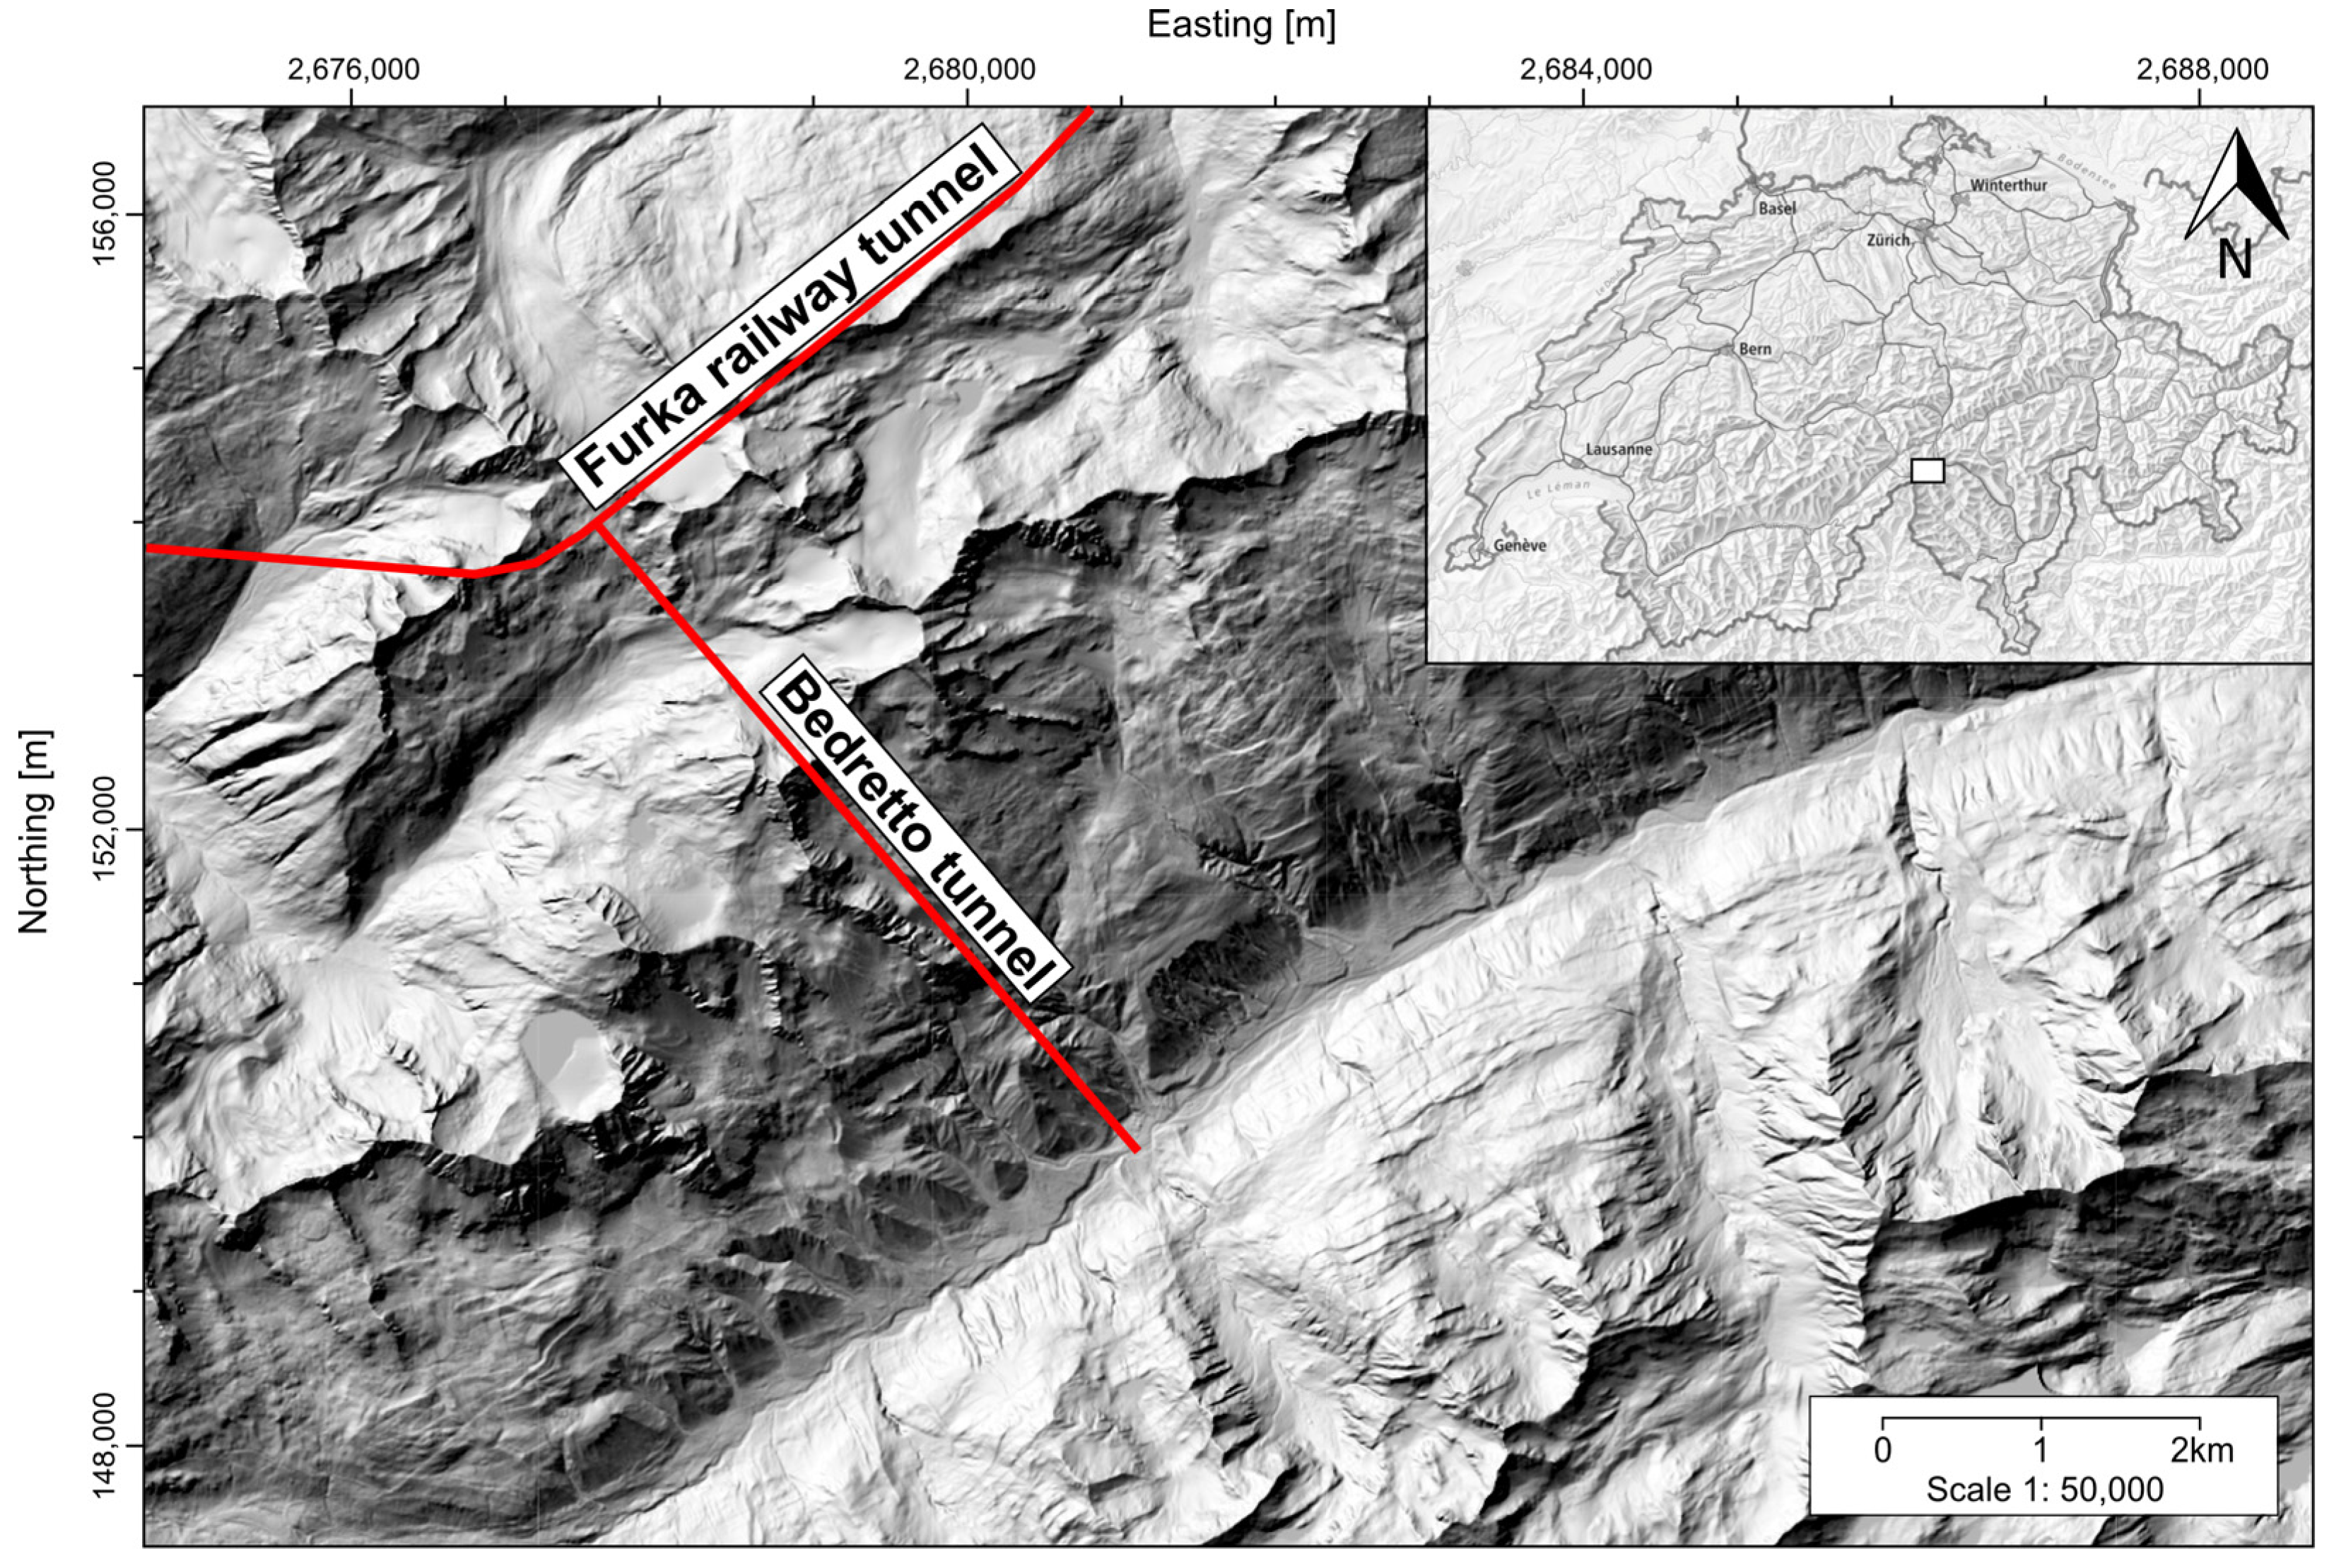
Constructed between 1971 and 1982, the 5.2 km long Bedretto tunnel, extending in the NW–SE direction and perpendicular to the Furka railway tunnel, was developed to facilitate the excavation process of the latter [
20]. This underground infrastructure is in the Swiss Alps, situated in the southern part of Switzerland and close to its border with Italy (
Figure 1). Since 2019, the Bedretto tunnel has been designated as the Bedretto Underground Laboratory for Geosciences and Geoenergies (BULGG), as part of the Swiss Federal Institute of Technology (ETH) of Zürich, as an underground research facility for deep geothermal energy (a comprehensive characterization available in the work of Ma [
21]. The tunnel has a cross-section of about 2.7 m by 2.7 m. In some places, the cross-section is larger due to the initial excavation, with ETH later expanding it slightly to accommodate technical materials used in experiments. Additionally, the measurement system within the tunnel is denoted in tunnel meters (TMs), commencing at the south portal with TM 0. The tunnel is characterized by the natural contours of the rock mass, with a drainage channel for the tunnel inflows located on the northeast side. The drainage channel has a varying width in the range of 0.6 m to 1 m and a depth ranging from 0.4 m to 0.7 m. The channel is open and no thermal insulation has been installed. The tunnel has been excavated with a small slope, with the culmination point being at the intersection with the Furka railway tunnel and the lowest point at the south portal, thereby allowing the water to flow naturally towards the Bedretto valley to the southeast.
2.1. Geology
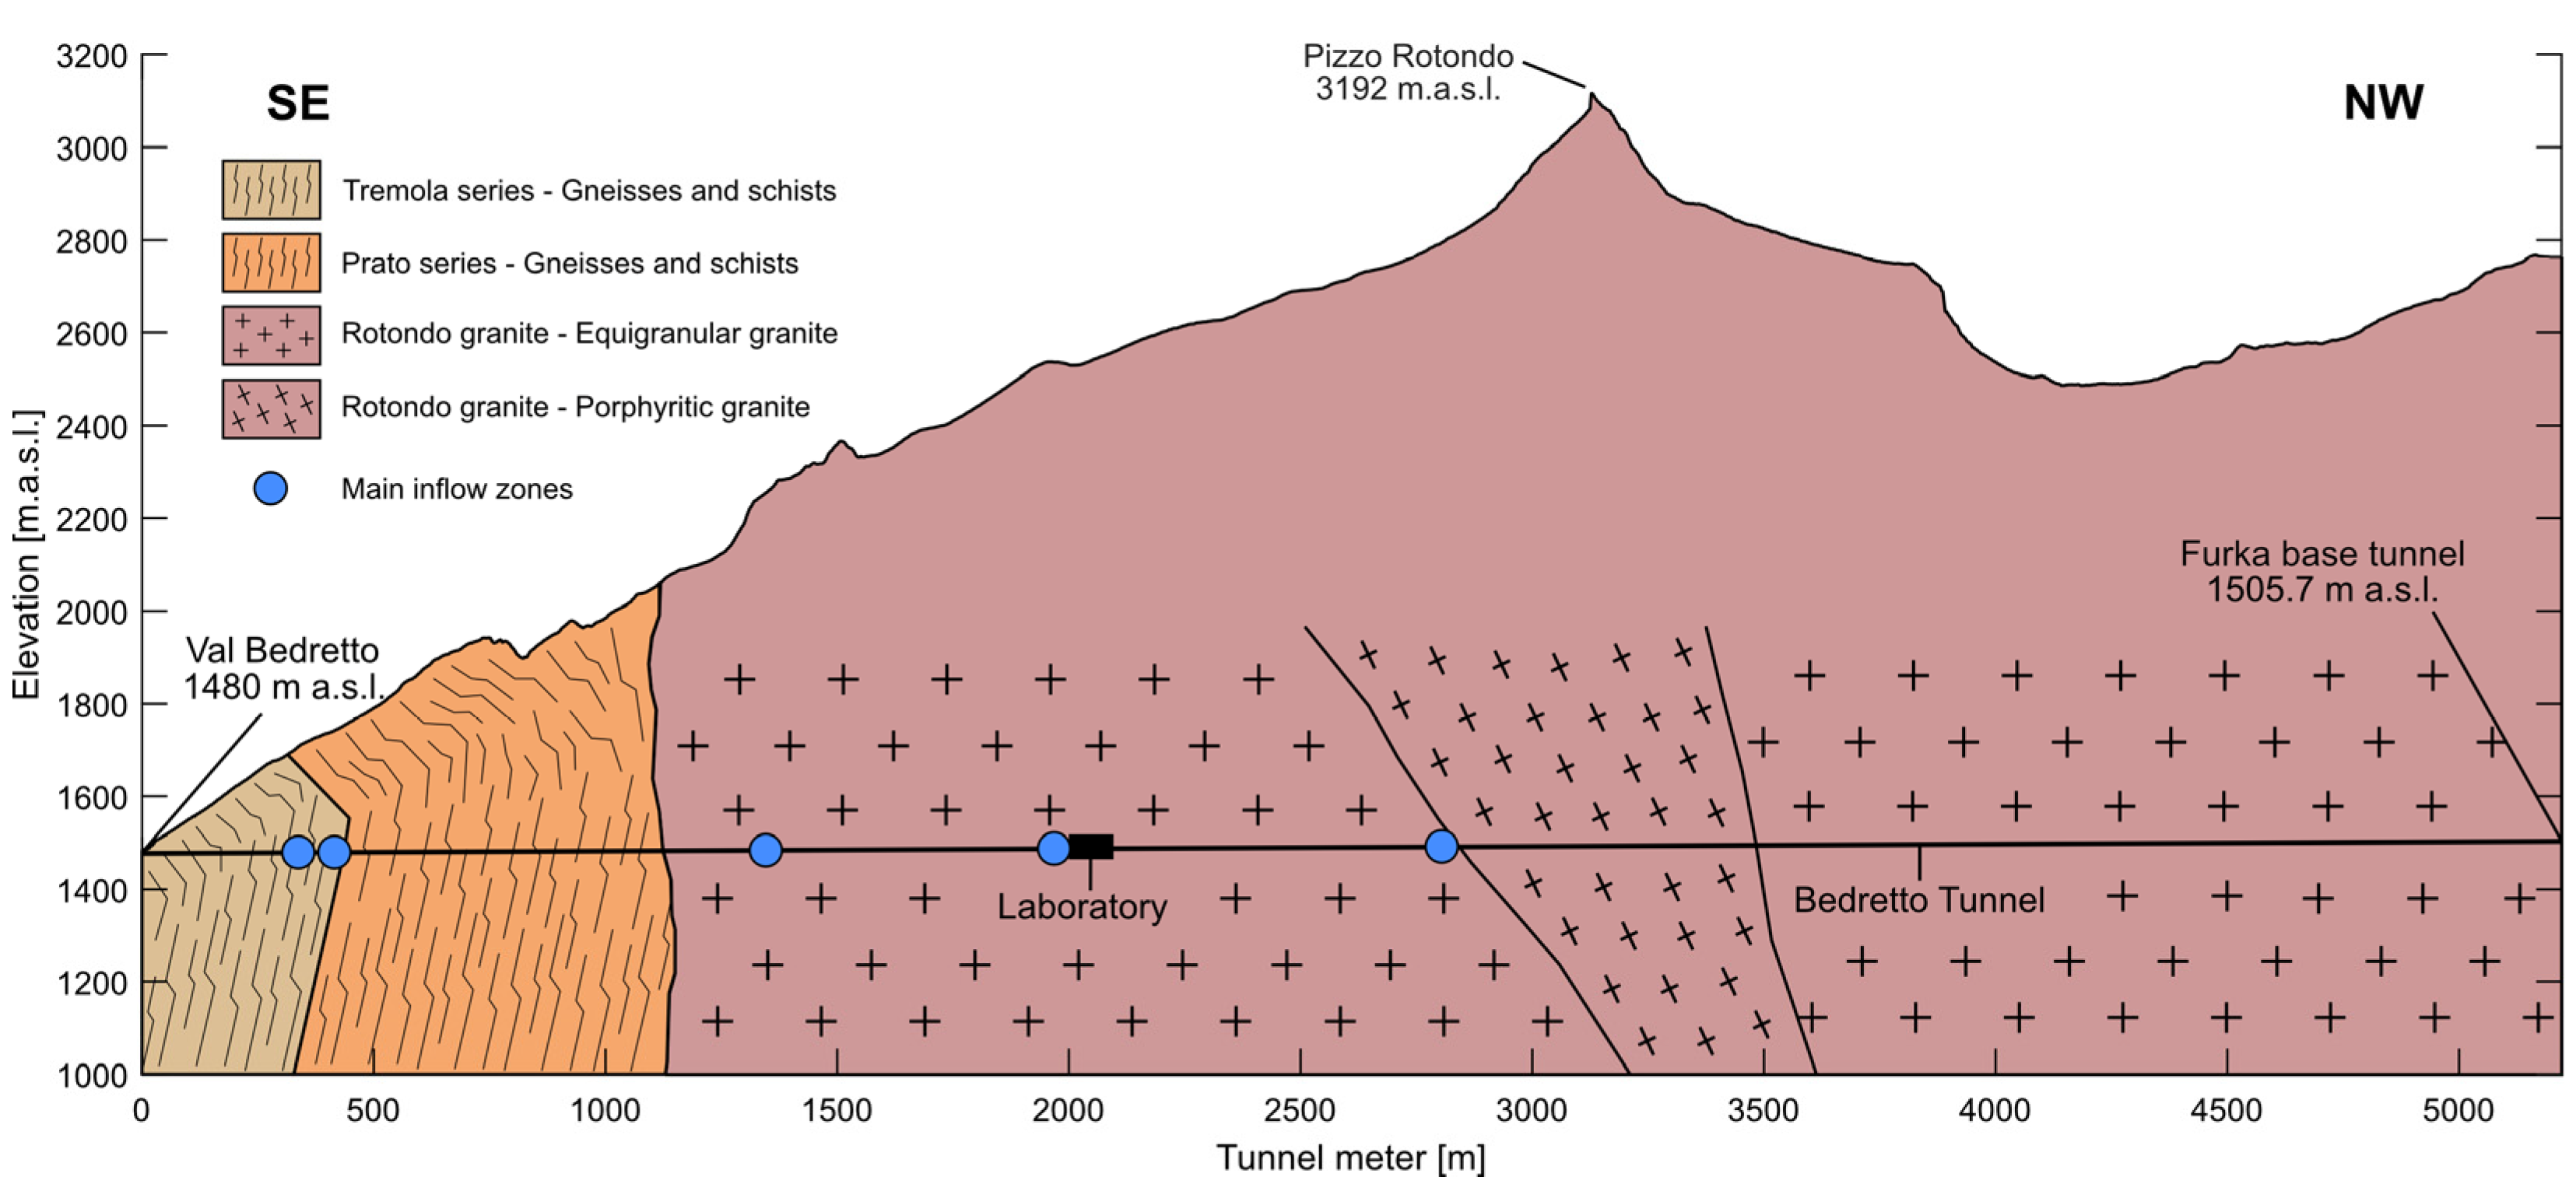
The Bedretto Tunnel passes through various geological formations of the Gotthard massif, as can be seen in the geological cross-section in
Figure 2, along with the location of the main inflow zones up to TM 3000. It begins at the south portal, moving through the Tremola series’ metasedimentary rocks, followed by the Prato series of the Val Nalps gneiss complex, and concludes at the Rotondo granite zone, from TM 1138 up to the Furka railway tunnel [
24]. Each segment features distinct rock types and structural characteristics such as foliations and folds. For more detailed information on these geological formations, refer to the work of Rast [
24]. The Rotondo granite, of Variscian age, is a fine-grained equigranular granite up to TM 2805 and transitions to a porphyroclastic granite up to the Furka railway tunnel [
24,
25]. The transition between the Prato series and the Rotondo granite is marked by a deformed shearing zone, with the granite exhibiting a consistent mineralogy and a steeply dipping main foliation [
24].
2.2. Environmental Conditions
To assess the thermal energy potential of the rock, air, and water, measurement campaigns were conducted with the objective of collecting data to create a representative numerical model of the tunnel environment. The temperatures of the rock, air, and water were measured, as well as the velocity of the air and the discharge of the water naturally flowing in the channel. The measurements and the methods used for their collection are presented below.
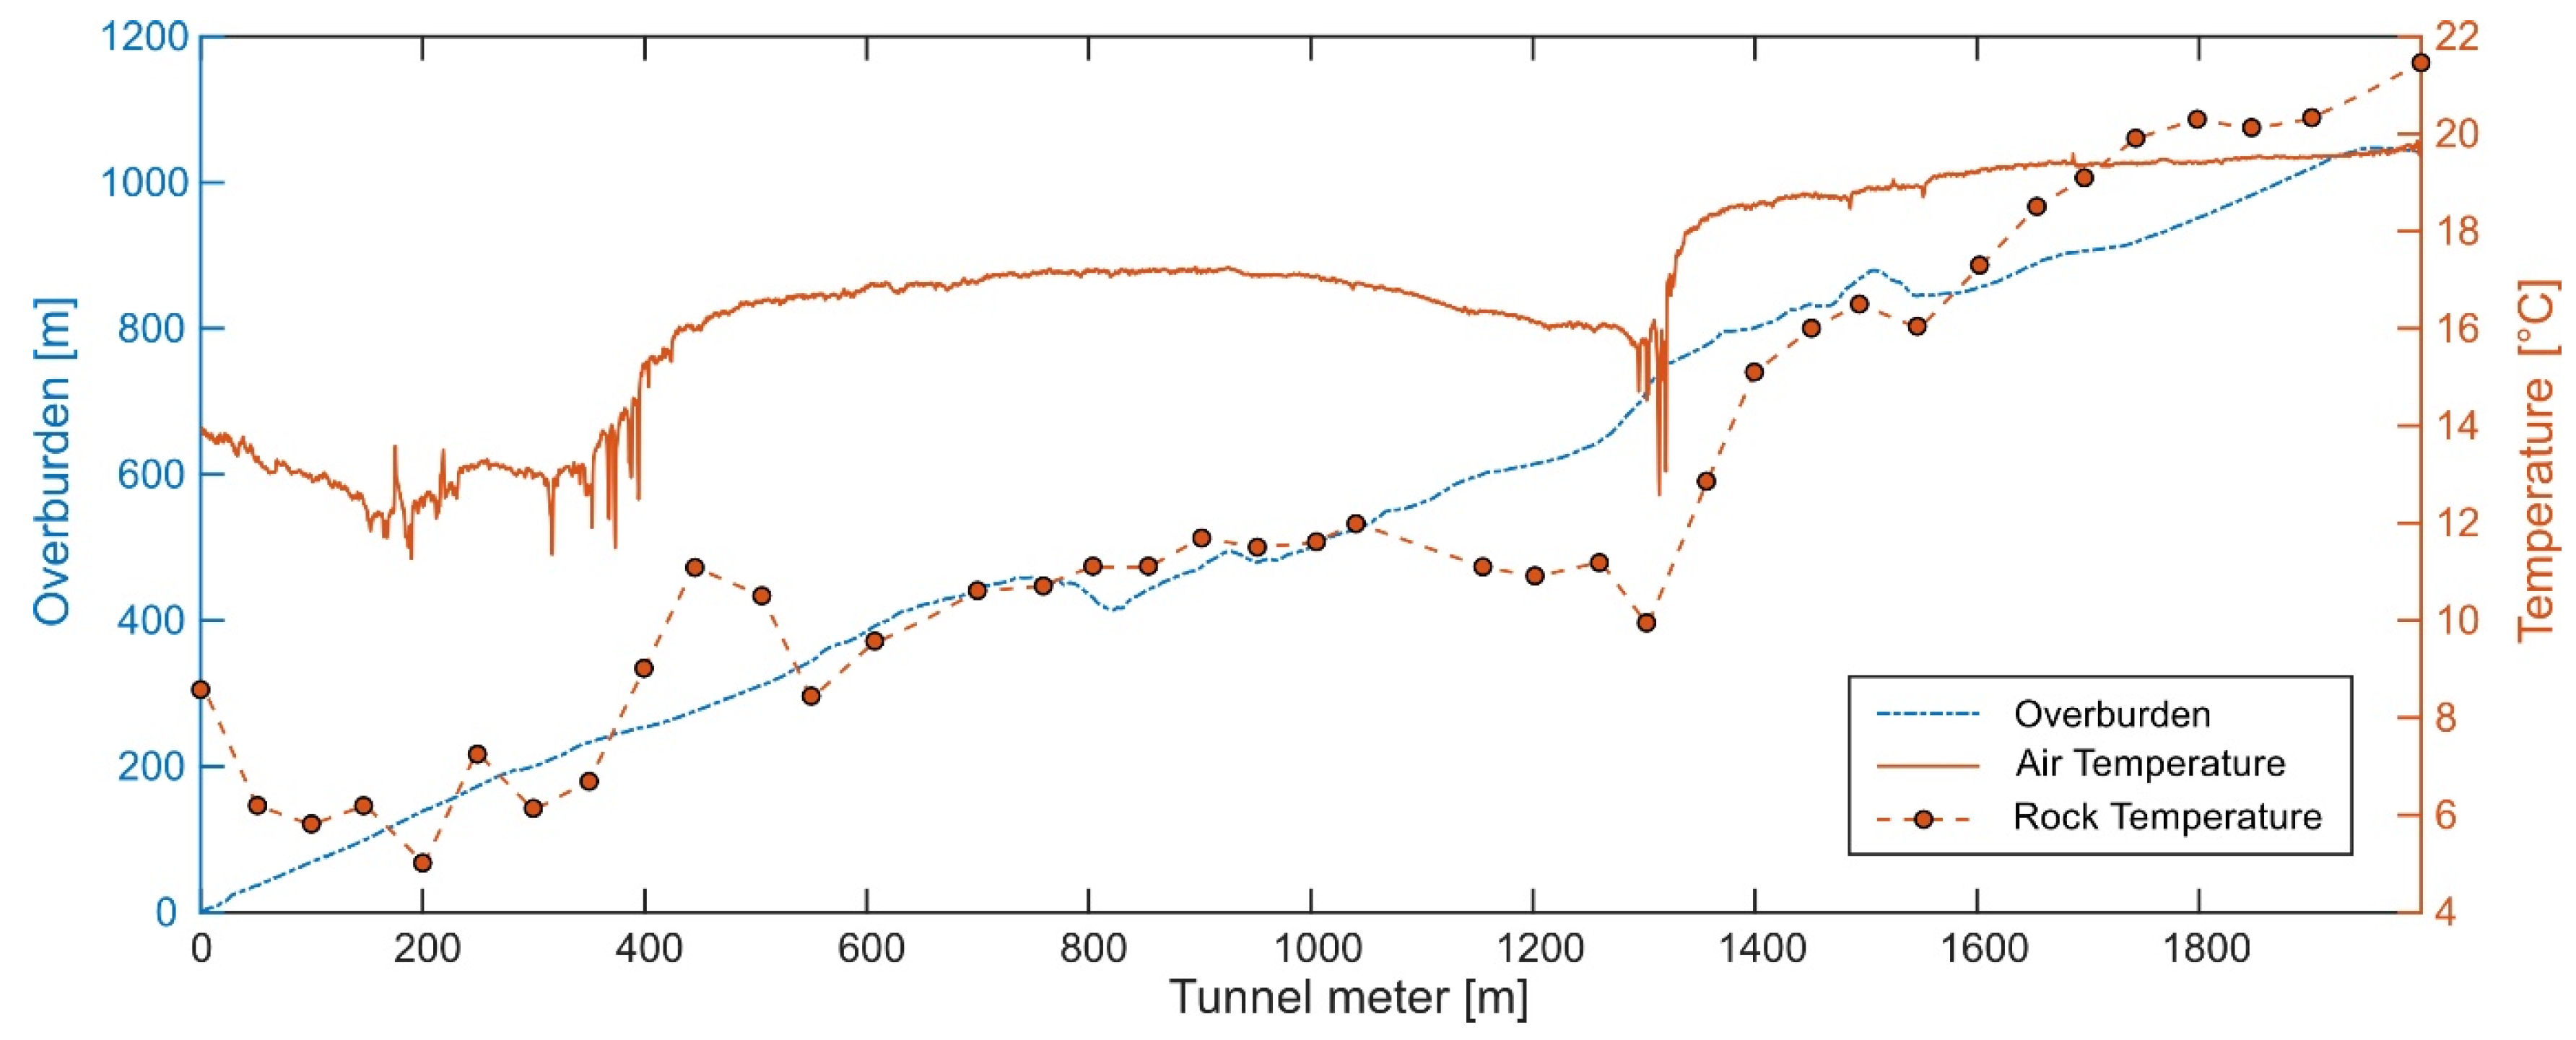
The temperature of the tunnel air was measured up to TM 2000 using the installed multimode optical fibers, which collect the temperature along the tunnel with a spatial resolution of 25 cm and sampling time of every 10 to 30 min. The rock temperature of the ceiling, floor, eastern, and western side walls were also measured on the 16th of August 2023 using an IR thermometer Fluke 561 HVACPro [
27] every 50 m along the tunnel.
Figure 3 shows the air temperature measurements taken by the optical fibers between June and September 2023 (the mean air temperature at every sampling location is presented), as well as the overburden profile along the tunnel up to TM 2000 [
28]. The maximum air and rock temperatures were measured at TM 1996, with temperatures of 19.8 °C and 21.4 °C, respectively. Several significant inflow zones have been identified along the tunnel, particularly at the TMs 400 and 1310, where they are characterized by sharp decreases in air temperature, as can be seen in
Figure 3. It should also be noted that the temperature of the air varies significantly depending on the operating power of the ventilation system. Indeed, the tunnel is ventilated with air coming from outside the tunnel. The air from the ventilation system is introduced at TM 2375, where it then flows towards the southeast portal. Hence, due to the consistently warmer temperature deep within the tunnel compared to the ambient outside air, the influx of cooler air into the tunnel leads to a decrease in the overall tunnel air temperature, irrespective of the season. Specifically, we observed a temperature decrease of 4 °C at TM 2000 from September to November 2023 when the ventilation system was running at full capacity, and a subsequent increase of 4 °C at the beginning of November 2023 up to March 2024 when the ventilation power was reduced.
In addition to the tunnel, several boreholes which are drilled in the main laboratory are also equipped with multimode optical fibers for temperature monitoring, among which, the optical fibers installed in a 390 m long borehole (named ST1) located in the main laboratory (between TM 2000 and 2100) provided an estimation of the representative geothermal gradient of 28.2 °C/km in the Rotondo granite in the region of the current study.
Based on the temperature data in
Figure 3, the warmest location along the first 2 km of the tunnel was identified as TM 1996. Therefore, this location was selected as a potential candidate for using air as the heat source. The velocity of the air in the tunnel was also recorded over several days at the warmest location (TM 1996) using the air velocity meter Testo 400 from the company Testo, which has a resolution of 0.01 m/s for a range of velocities between 0.1 m/s to 15 m/s [
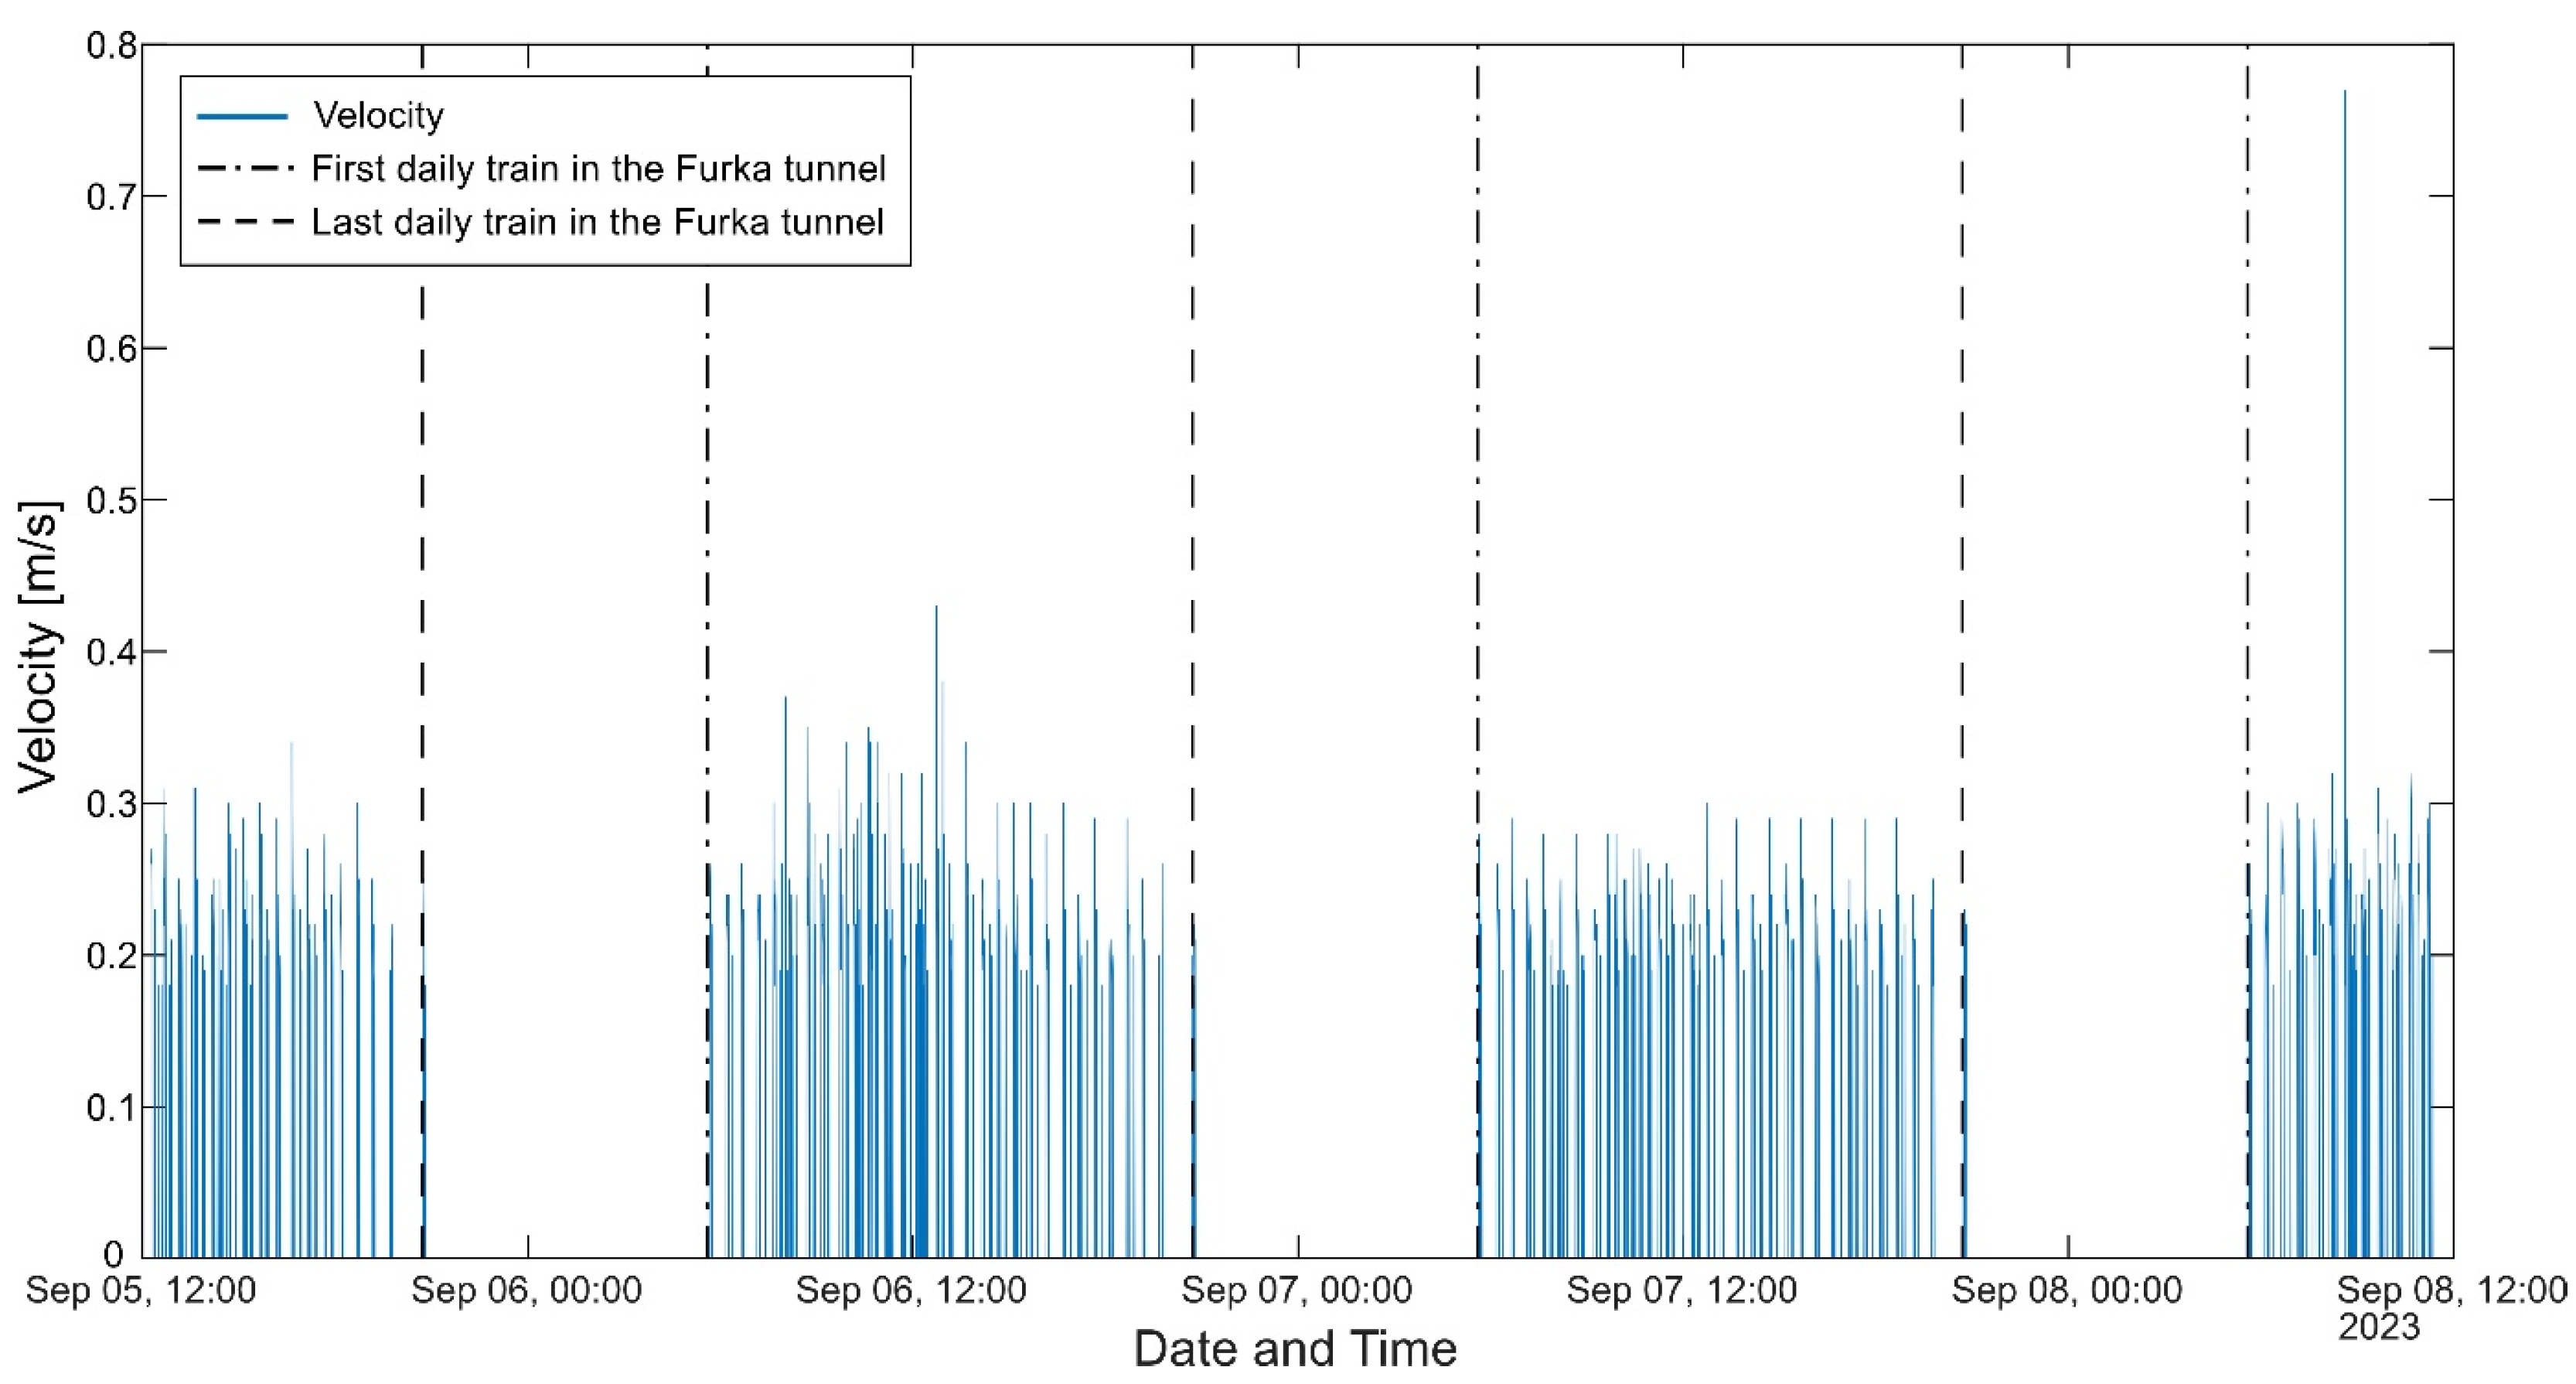
29].
Figure 4 displays the recorded velocity readings taken between the 5th and 8th of September 2023. It is found that the air is flowing towards the Bedretto valley in cycles of varying velocities, intermittently increasing from 0 m/s to 0.2–0.4 m/s in cycles lasting 10 to 20 min, followed by very low air flow (below device’s sampling resolution). This regular pattern agrees well with the passages of trains in the Furka base tunnel, connected perpendicularly to the Bedretto tunnel, which leave the nearest station around 4 min before the corresponding air velocity increases [
30,
31]. Moreover, the air velocity decreases to 0 m/s every night between 8:47 pm and 5:43 am, corresponding to the passage of the last and first daily trains in the Furka tunnel, indicated by the dashed lines in
Figure 4. It is important to consider that the device’s lower measurement threshold is 0.1 m/s, meaning that there are uncertainties in the zero values measured. Additionally, although there is a possibility of air flow below the device’s measurement threshold in both directions, the velocity profile indicates that the air flow in the tunnel is primarily dominated by the passage of trains in the Furka tunnel.
Water from the inflow zones is collected in the tunnel drainage channel and naturally flows toward the southern exit. The discharge and temperature of the water in the channel were measured at various locations using an electrical conductivity meter (model WTW Multi 3420 [
32]) following the procedure outlined in the work of Moore [
33]. This procedure relies on the addition and mixing of a salt solution to the water flowing in the channel. The temporal evolution of the electrical conductivity is then measured and monitored further downstream until it reaches the initial background electrical conductivity. Discharge measurements in the water channel were also attempted by estimating the flow velocity with a current meter (model OTT Z200 [
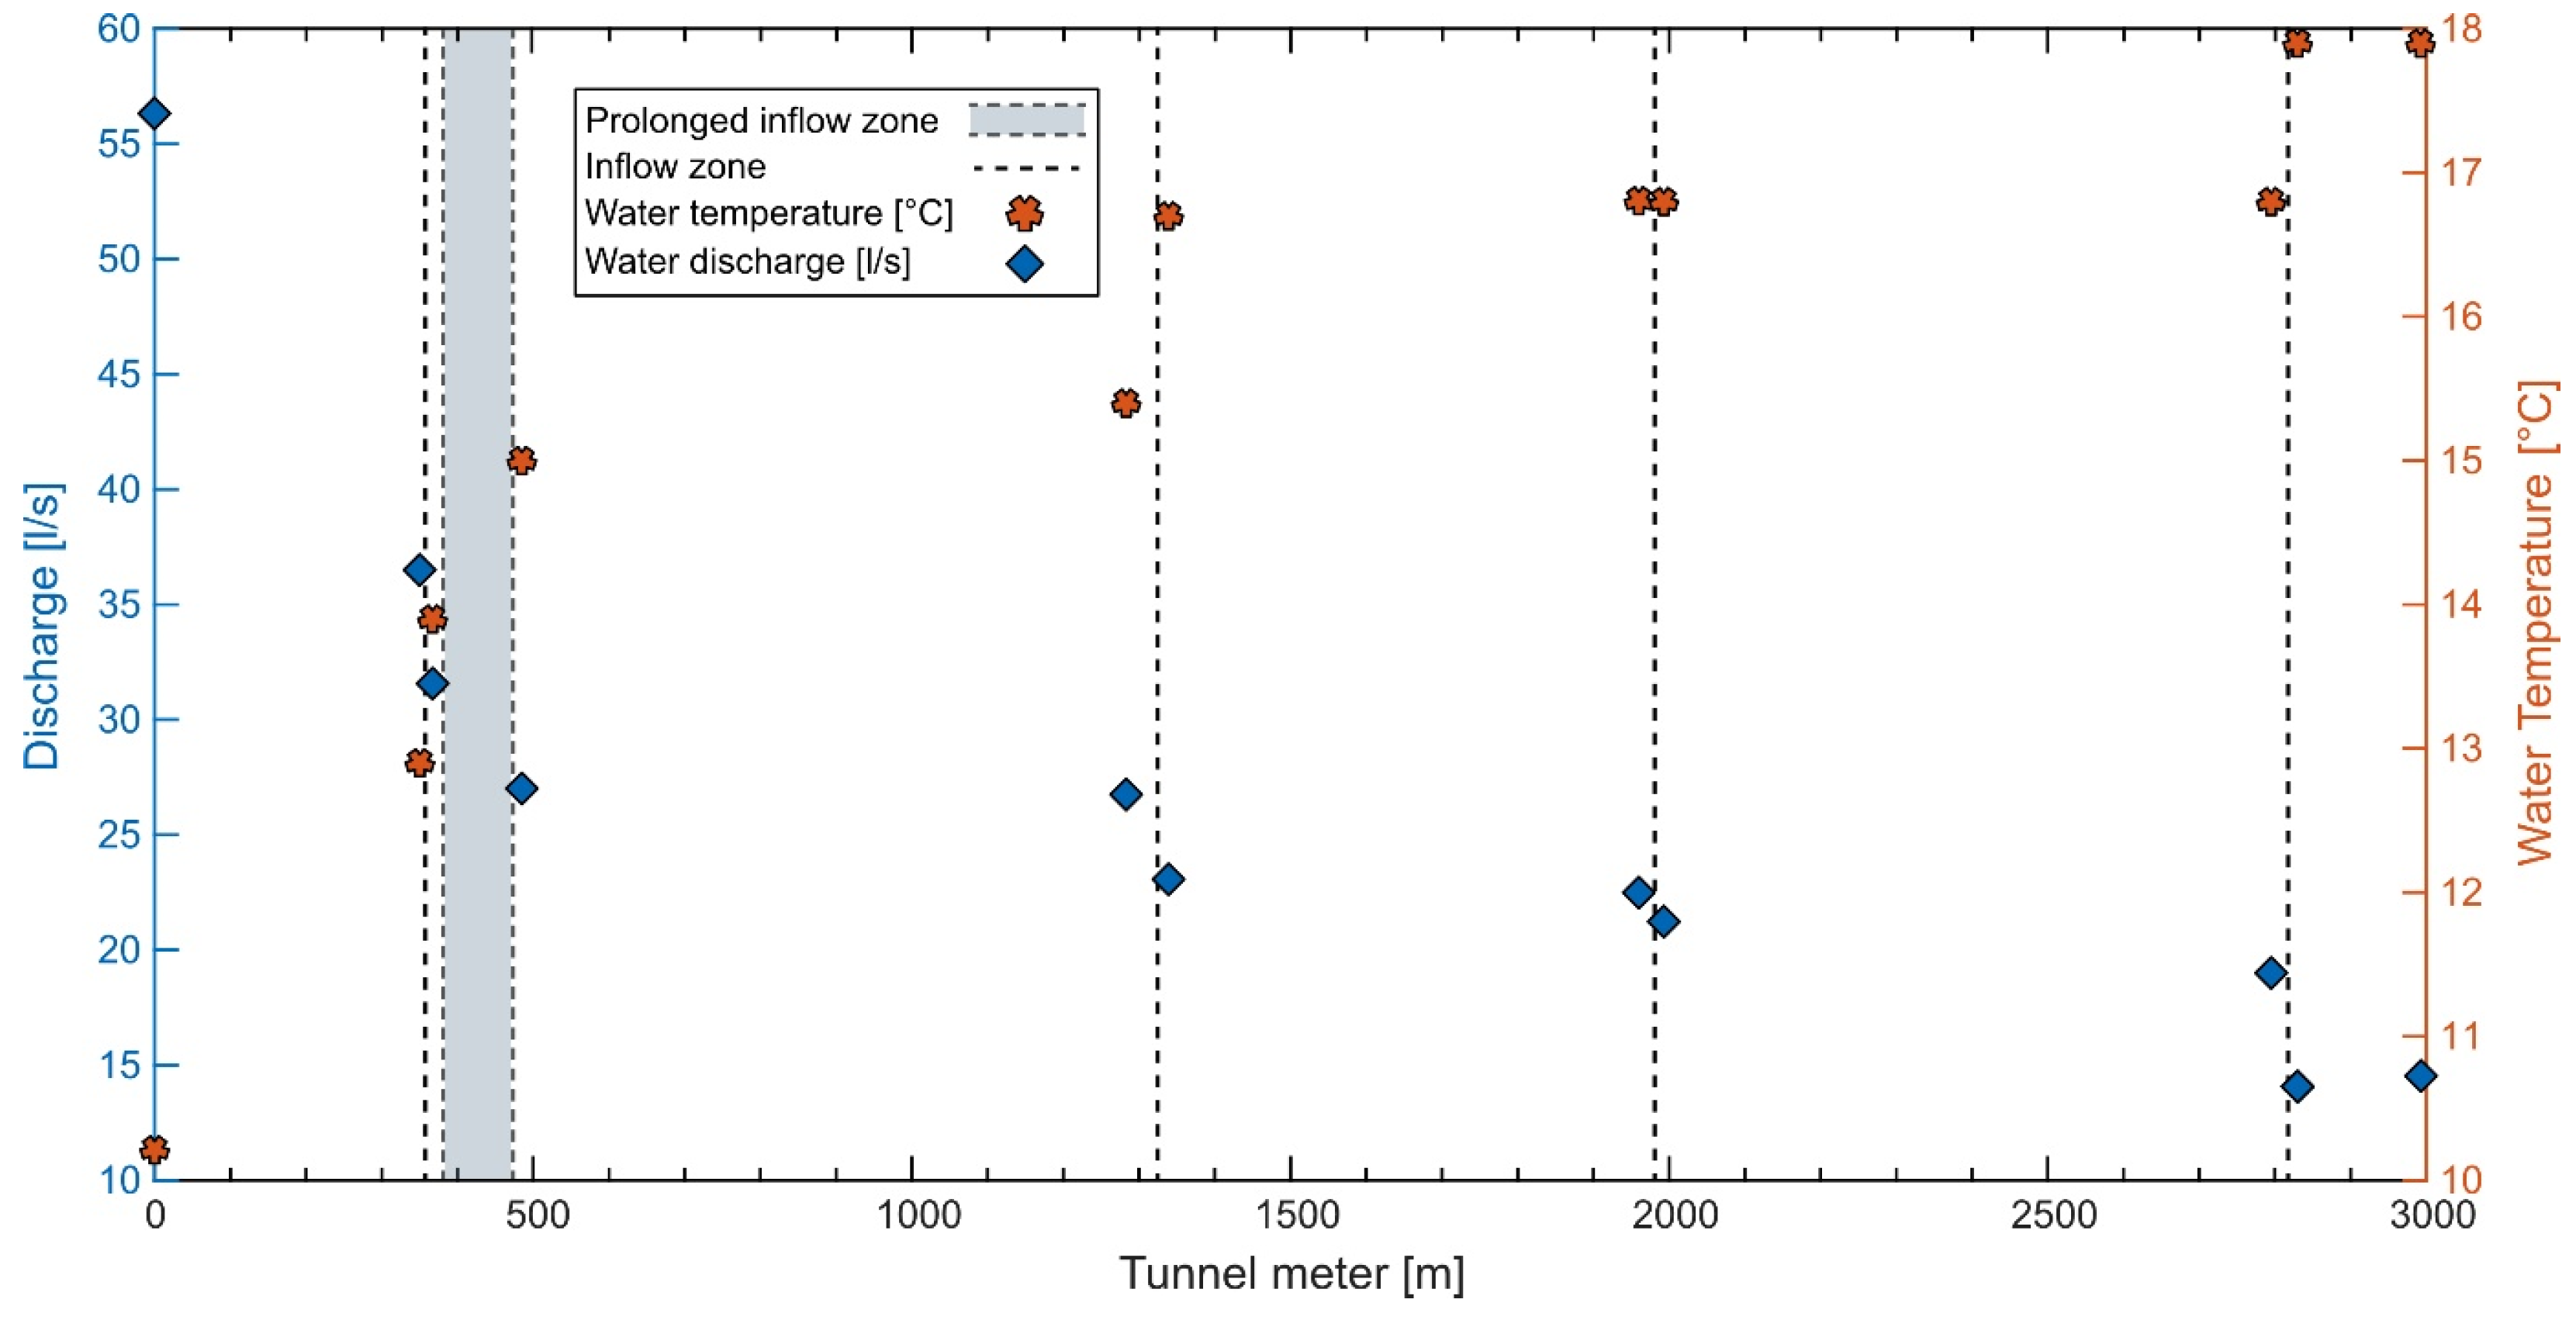
34]) and by measuring the dimensions of the corresponding sections of the channel. However, due to the channel’s irregular shape and the spatially varying flow velocities, the measurements using the current meter proved to be imprecise and were consequently disregarded. Flow measurements using an electrical conductivity meter were conducted immediately before and after major inflow zones, with the exception of TM 485 and TM 2993, where no inflow zones were present, to determine the discharge from specific flow zones. These measurements are presented in
Figure 5. At the southern end of the tunnel, a discharge of 56.3 L per second at a temperature of 10.2 °C was recorded. Towards TM 3000, the discharge decreased to 14.5 L per second, while the temperature increased to 17.9 °C. As an important aspect of future work, we plan to conduct long-term monitoring of water temperature. This will support the feasibility study by accounting for seasonal variations or any trends in water temperature changes over the long term. Currently, these measurements were all conducted on the same day, meaning that seasonal variations in temperature and discharge are not accounted for.
3. Methodology
To simulate heat extraction from the tunnel medium—i.e., from air, water, and rock—we used COMSOL Multiphysics, a numerical solver that models coupled physical processes via the finite element method (FEM), solving partial differential equations across various physics domains [
35]. For different models the default solver was utilized, using either the direct solver option, which directly solves the system of equations to obtain solutions, or the segregated approach, which enhances efficiency by sequentially solving subsets of equations [
35]. For the cost analysis, we considered two scenarios and performed the calculations using Microsoft Office Excel [
36]. In the first scenario, we used interest rates for bank loans, while in the second scenario, we applied the net present value methodology, as will be presented later.
3.1. Numerical Modeling of Heat Transfer and Fluid Flow
The governing equations of the heat transfer and fluid flow used in the numerical model, including the governing equation for fluid flow and heat transfer in the pipes, are presented below. Moreover,
Section 4 provides detailed information on the parameters employed in the numerical model.
The governing equation for heat conservation, which describes the transient heat transfer, is presented in Equation (1) [
35,
37]:
On the left-hand side of Equation (1),
ρCp(∂T/∂t) represents the rate of change of temperature with respect to time
t, where
ρ is the density of the material,
Cp is the specific heat capacity, and
T denotes temperature [
35,
37]. The term
ρCp × u × ∇
T accounts for the convective heat transfer, where
u is the velocity vector field of the fluid [
35,
37]. Moving to the right-hand side, ∇
q represents the divergence of the heat flux vector, indicating heat diffusion within the material (see Equation (2)) [
35,
37]. Finally, the terms
Qvol and
QPipe represent any volumetric heat sources and heat exchange from the pipes, respectively, contributing to the overall thermal energy balance [
35,
37]. The heat flux vector
q is computed as in Equation (2) [
35,
37]:
Here,
k denotes the thermal conductivity of the material, and ∇
T represents the temperature gradient, indicating how temperature changes spatially within the material [
35,
37].
The fluid flow, encompassing both air flow in the tunnel and water flow in the water channel within the tunnel, is modeled using turbulent flow modeling. This approach is necessitated by the high Reynolds number in both mediums, significantly exceeding the threshold of 2300, indicating the predominance of turbulence in the flow regimes [
38]. The turbulent flow of air (assumed to be weakly compressible) and water (assumed to be incompressible) is governed by the Reynolds-averaged Navier–Stokes (RANS) equations for the conservation of momentum. The transport equation for the turbulent kinetic energy dissipation rate (
ε) is given by Equation (3) [
35,
39]:
where
ε is the turbulent kinetic energy dissipation rate,
μ is the molecular dynamic viscosity,
μT is the turbulent viscosity,
σε is the turbulent Prandtl number,
Cε1 and
Cε2 are model constants,
TKE is the turbulent kinetic energy, and
PTKE is the production term of turbulent kinetic energy [
35,
39]. In Equation (3), the first term on the left-hand side,
ρ(∂ε/∂t), represents the unsteady change in the dissipation. The second term,
ρu × ∇ε, represents the convective transport of the dissipation rate by the mean flow. On the right-hand side of Equation (3), the first term,
∇ × ((μ + μT/σε)∇ε)), corresponds to the diffusion of the dissipation rate, accounting for both for molecular diffusion (
μ) and for turbulent diffusion (
μT/
σε) [
35,
39]. The second term,
Cε1(ε/TKE)PTKE, represents the production of
ε, which is linked to the production of turbulent kinetic energy (
PTKE). The last term on the right-hand side accounts for the destruction (or dissipation) of
ε. To prevent no-flow conditions at the boundaries, the slip wall condition was activated.
Additional equations characterize the flow of air and water in the numerical model originating from the fundamental principle of mass conservation [
39]. Equation (4) asserts incompressibility for water [
35,
39]:
In the case of air flow, Equation (5) represents the conservation of mass, accounting for compressibility [
35,
39]:
Equation (6) represents viscous dissipation in a fluid, in the context of nonisothermal heat transfer in the air and water [
35,
39]:
where
Qvd represents the viscous dissipation per unit volume, corresponding to the rate at which mechanical energy is converted into thermal energy due to viscous forces in the fluid. It is calculated by the double dot product of the viscous stress tensor
τ and the velocity gradient tensor
∇u [
39].
To implement heat extraction, a pipe, in which a heat carrier fluid (in this case water mixed with antifreeze) is added to the model. The time-dependent distribution of heat within the fluid is implemented using Equation (7) [
35,
40]. It is important to note that in COMSOL Multiphysics, pipes are assumed as lines with zero radius within the model mesh and the pipe radius is mathematically implemented in the model [
41]. This assumption significantly reduces computational time by requiring fewer mesh elements [
41].
The first term on the left-hand side of Equation (7) represents the rate of change of internal energy per unit volume over time, with
A as the cross-sectional area of the pipe, while the second term accounts for the advection of heat by the fluid flow, with
et as the temporal unit vector and
∇tT the gradient of temperature [
35,
40]. On the right-hand side of Equation (7), the first term corresponds to the conductive heat transfer within the fluid, while the second term quantifies the energy dissipation due to fluid friction within the pipe, where
fD represents the Darcy friction factor and
dh the hydraulic diameter of the pipe. Additionally,
Qvol represents any volumetric heat sources within the fluid, and
Qwall accounts for the heat exchange from the surroundings into the pipes, connecting with Equation (1) via
QPipe [
35].
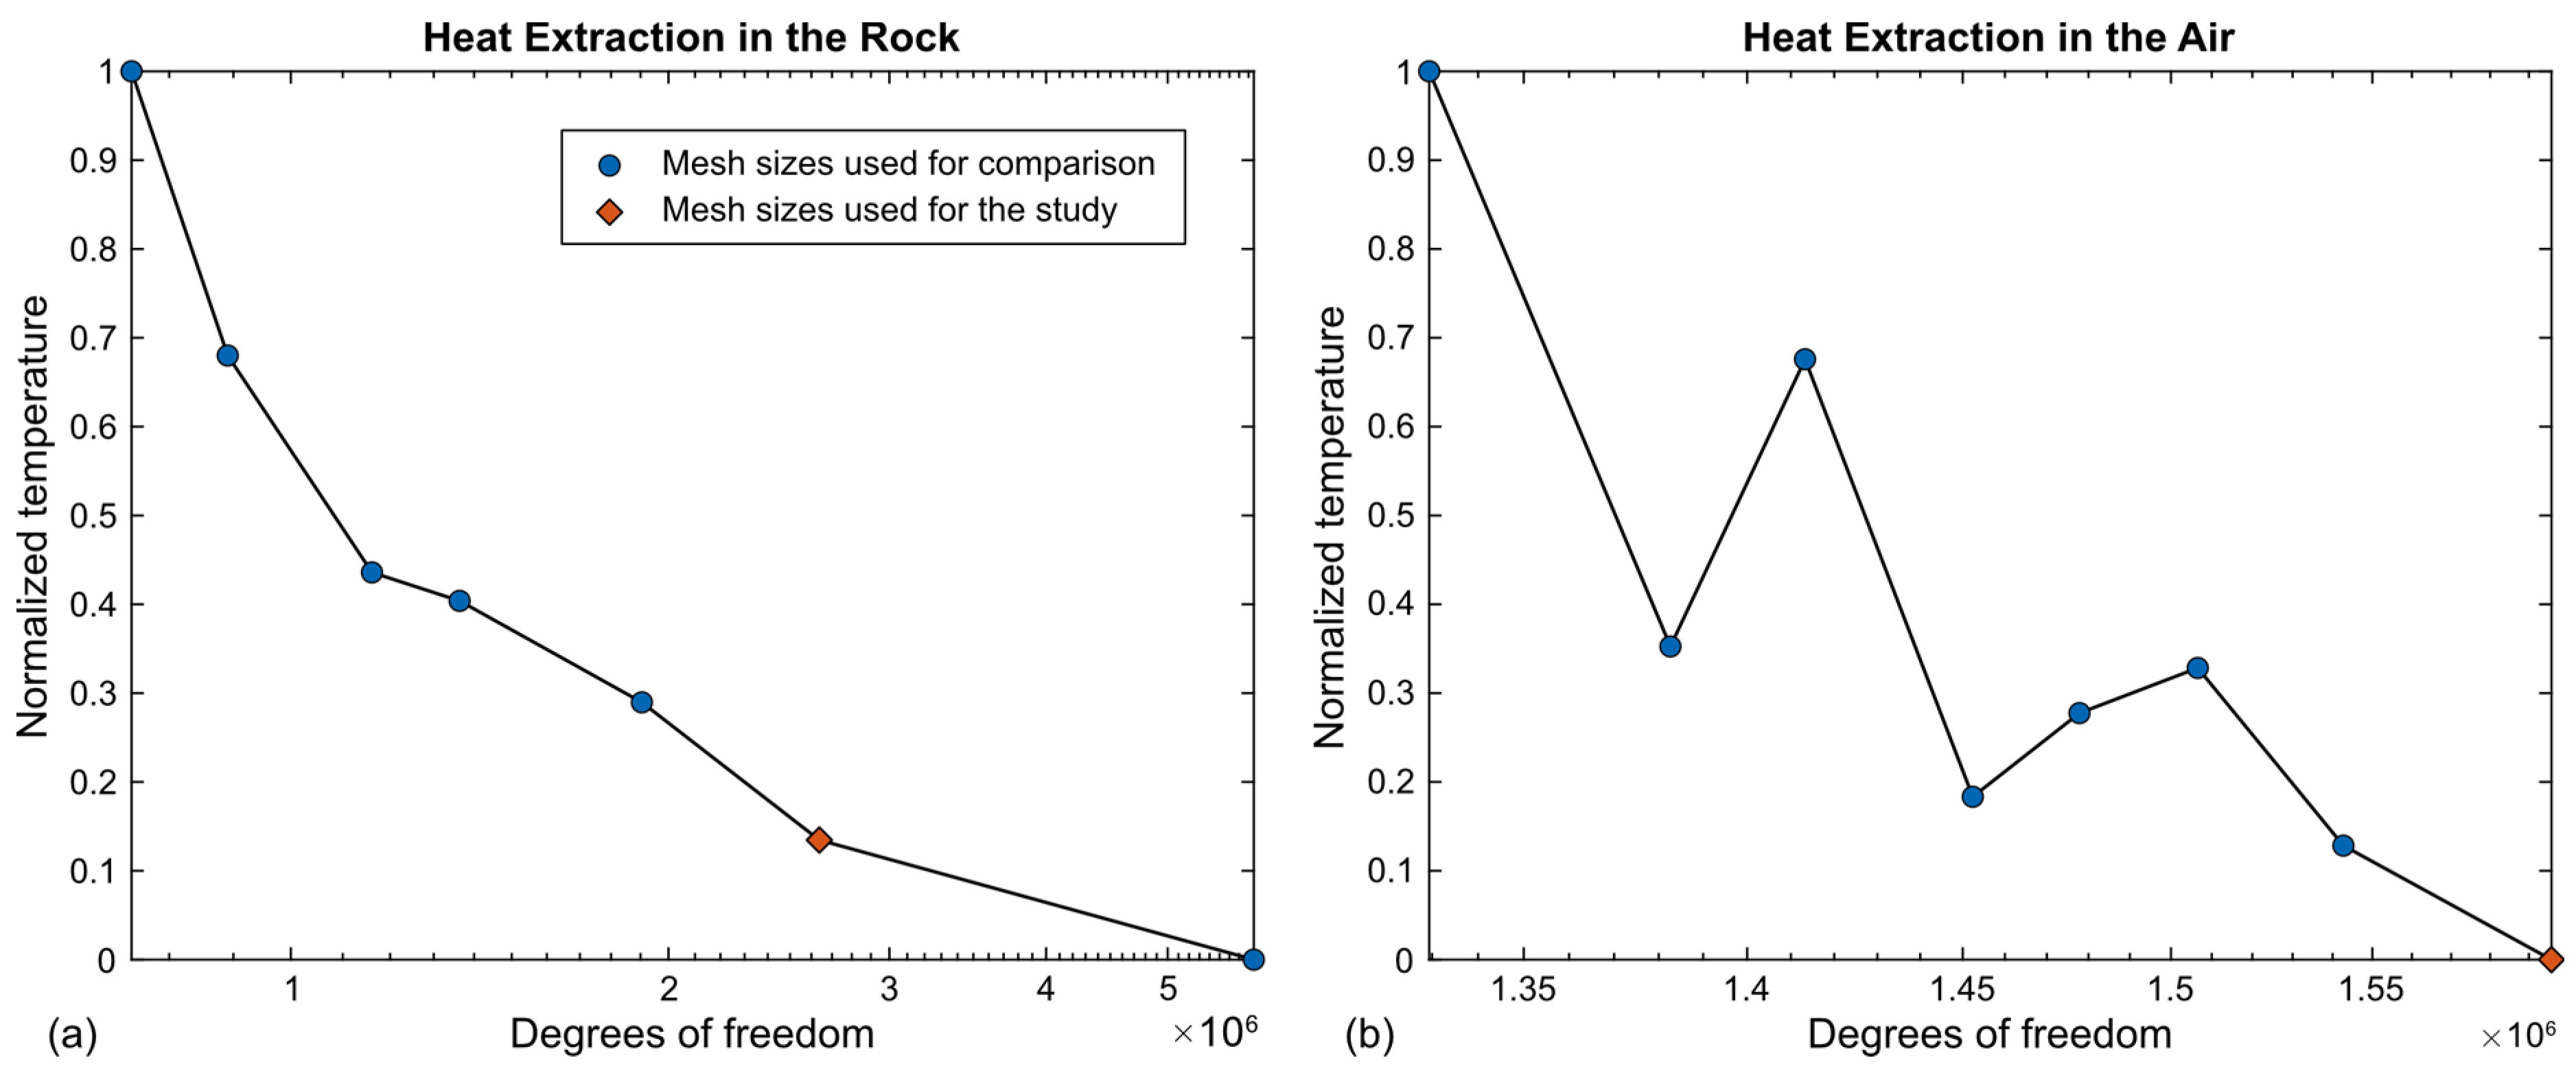
3.2. Sensitivity Analysis for Optimal Mesh Size and Relative Error
The mesh size in the numerical model is a crucial factor that affects the number of degrees of freedom as well as the accuracy of the results, particularly the temperature of the fluid within the heat exchanger. A finer mesh size generally increases the solution accuracy but also leads to longer computation times. To find the optimal balance between mesh size and accuracy and resolution, a sensitivity analysis was performed. This analysis involved refining the mesh size around the heat exchanger as well as in the areas of interest for the three heat extraction cases: from the tunnel rock wall, the air, and the water. Additionally, a sensitivity analysis was also performed regarding the number of nodes on the heat exchanger pipes to ensure the accuracy and reliability of the temperature predictions. The temperature of the circulating fluid was measured after 10 days at 3.86 m from the inlet within the heat exchanger, a location identified as having a rapid temperature increase. Additionally, the sensitivity of the model to the maximum allowed relative error approximation (relative tolerance) was evaluated [
42]. This parameter determines the level of accuracy the solver aims to achieve in the numerical solution. Lower relative tolerance values result in more precise simulations but increase computational demands. The sensitivity analysis helps ensure that the model achieves accurate results without unnecessary computational expense.
3.3. Calculation of the Thermal Energy in Water
The energy extractable from a specific quantity of water can be calculated using Equation (8) [
19]:
where
CP is the specific heat capacity of water (J/kg/K),
Q the mass flow rate (kg/s), and Δ
T the temperature difference before and after going through the heat exchange process (K).
This equation is used in this study to determine the thermal energy that is gained by the water when passing though the heat exchangers or when decreased to a certain temperature when passing through a heat pump.
3.4. Energy Transport
In this study, the village of Bedretto is assumed to be the end user of the energy extracted from the Bedretto tunnel. To facilitate the transfer of this energy, the generated heat can be either transferred to another fluid via heat exchangers or directly transported through buried pipes.
Section 5.2 indicates that water is the most effective medium for heat extraction. Therefore, the water is transported to the village through buried pipes, as detailed in
Section 6.1. The most suitable location for sourcing the tunnel water is determined based on the investment costs associated with transporting the heat carrier. Additionally, the potential for power generation is explored. It is essential to calculate the heat loss of the tunnel water as it circulates through the buried pipes from its extraction point to its destination. For this study, the pipe selected is the double-wall pipe JANSEN bianco, sourced from the company Jansen [
43], consisting of an inner layer of polyethylene surrounded by a layer of polyurethane (PU) foam insulation (λ = 0.03 W/(m·K) [
43]), which is itself encased in an outer polyethylene pipe. The dimensions of the pipe are determined based on the volume of fluid to be transported and the energy requirements. The heat loss resulting from the transport of the water can be obtained with Equation (9) [
44]:
where
Te(L) is the temperature (K) of the fluid inside the pipe at a distance
L (m),
Tt is the outside temperature (K),
Te0 is the initial temperature of the fluid (K),
K is the heat transfer coefficient of the pipe (W/(m·K)),
L is the length of the pipe (m),
Q is the mass discharge rate (kg/s), and
Cp is the heat capacity at constant pressure of the water (J/(kg·K)).
The heat transfer coefficient of the pipe (K) is calculated as in Equation (10) [
44]:
where
λPU-Foam is the thermal conductivity of the polyurethane foam insulation (W/(m·K)),
d is the pipe diameter (m), and
s is the insulation thickness (m).
The temperatures outside the pipes (
Tt) referenced in Equation (9) correspond to the measurements by the optical fibers installed in the tunnel for the part within the tunnel and the temperature is −2 °C for the external environment, reflecting the average temperature in between November and March in Bedretto [
45].
3.5. Cost Analysis
If the inhabitants of Bedretto harnessed the heat energy from the tunnel water, various economic scenarios could be considered to offset the initial investment costs, assuming the entire village utilizes the water for heating purposes. For this analysis, we assume financial contributions from the Swiss Federal Office of Energy, which promotes the development of new technologies, solutions, and concepts related to the use of sustainable energies [
46]. This support is aligned with the Energy Strategy 2050, aimed at sustaining high energy demand while reducing environmental pollution [
47]. It is common for the state to financially support such projects, which leads us to explore two specific scenarios:
Scenario 1: The municipality receives a financial contribution from the state and secures a bank loan with a fixed interest rate to cover the remaining investment.
Scenario 2: The municipality funds the investment partly with its own resources and partly with assistance from the state.
In Switzerland, municipalities often rely on state contributions and bank loans to finance large infrastructure projects. This practice is reflected in scenario 1, where the municipality receives a financial contribution from the state and secures a bank loan with a fixed interest rate to cover the remaining investment. Scenario 2 reflects the Swiss practice of municipalities leveraging local resources while seeking additional funding from national programs designed to support sustainable and innovative projects. Although the village may not have the private funds for the investment, this scenario is still considered to account for the possibility that it might secure the necessary funds. It also serves as an example for larger towns that would have the necessary funds and could apply this scenario.
In both cases, tunnel water is being brought directly to the individual heat pumps of each house and inhabitants pay a one-time connection fee based on their heat pump’s capacity, an annual subscription fee for access to the piping network, and a usage fee based on the volume of tunnel water consumed. These revenues contribute to offsetting the municipality’s investment and generate annual income to cover investment costs. This financial model and the costs of the installation draw inspiration from a similar heating system in Obergoms, where water from the Furka tunnel is used for heating purposes [
48].
Connection fees, yearly subscriptions, and tunnel water usage rates are determined for payback periods of 20, 30, and 40 years, aligning with the expected lifespan of the district system rather than with the longevity of heat pumps, which could be replaced over the selected periods. The parameters used for the calculation are displayed in
Table 2.
In scenario 1, a fixed interest rate of 4% is utilized for the bank loan. In scenario 2, the net present value (NPV) method is employed, which involves discounting future cash flows to their present value, as presented in Equation (11) [
51,
52]:
where
IC0 represents the initial investment (CHF) and
CFn the discounted cash flows over
n years (CHF).
Calculating the discounted cash flows over several years is achieved with Equation (12) as follows [
53]:
where
CF1 is the cash flow after year 1 (CHF),
i is the discount rate, and
n the number of years in the period under consideration (a).
The profitability for inhabitants investing in heat pumps and paying yearly fees to the municipality is evaluated by comparing their annual costs to those of a heating system using heating oil with information retrieved from the company Vaillant Sàrl, active in Switzerland [
54]. The rate of electricity price increase for heat pump consumption is determined using a linear regression based on prices in CHF (Swiss franc) per kWh
e (“e” stands for electric) from 2011 to 2024 and is estimated at a 1.42% increase per year [
49].
The discount rate is chosen based on various factors such as the time value of money, inflation rate, and investment risk [
52]. For low-risk investments like the presented geothermal project, the discount rate is set equal to the inflation rate, which averages 1% annually in Switzerland since 2018 [
50].
The yearly consumption in thermal energy of a house matching Switzerland’s standards is assumed to be 10 MWh
th. Based on aerial images, the number of inhabited houses in the village of Bedretto was estimated to 30 [
55], which translates to a yearly annual thermal energy consumption of 300 MWh
th (
Table 2).
4. Model Setup
The developed numerical model simulates heat extraction using heat exchangers in the tunnel environment involving three interacting mediums: rock, air, and water. Initially, the model runs over a 42-year period, representing the approximate time duration of tunnel excavation, without any heat extraction. This phase ensures a realistic representation of the current state of the mediums, accounting for temperature propagation effects post-excavation. To prevent thermal effects from reaching the model boundaries during this simulation, the thermal penetration depth is calculated to ensure containment within the model boundaries after 42 years. With the 42-year simulation period and by setting the boundary conditions at the tunnel air and water inlet locations, the results after 42 years accurately represented the tunnel’s current state, showing a maximum of 1 °C difference from the measurements taken from the tunnel wall, air, and water around TM 2000. Following this 42-year period, the heat extraction phase begins to assess the energy extraction potential from the three mediums. This phase includes a 10-day simulation for sensitivity analysis (for obtaining optimal mesh size and other numerical input parameters) and a 30-day simulation for a comprehensive comparison of heat extraction potential from the three mediums. The thermal penetration depth is calculated according to Equation (13) [
56]:
where
α is the thermal diffusivity in the granite (m²/s),
t is the time considered (s), and
Ls is the model side length (m). In this equation,
η is the similarity variable. In this study, the penetration depth is defined as the depth at which the temperature is less than 1% different from the initial value. This assumption corresponds to
η ≈ 1.82 [
56]. Given that the first part of our numerical model for model initialization runs for 42 years and considering the thermal diffusivity of 1.2 × 10
−6 m
2/s for the granite [
57], the side length of the model (
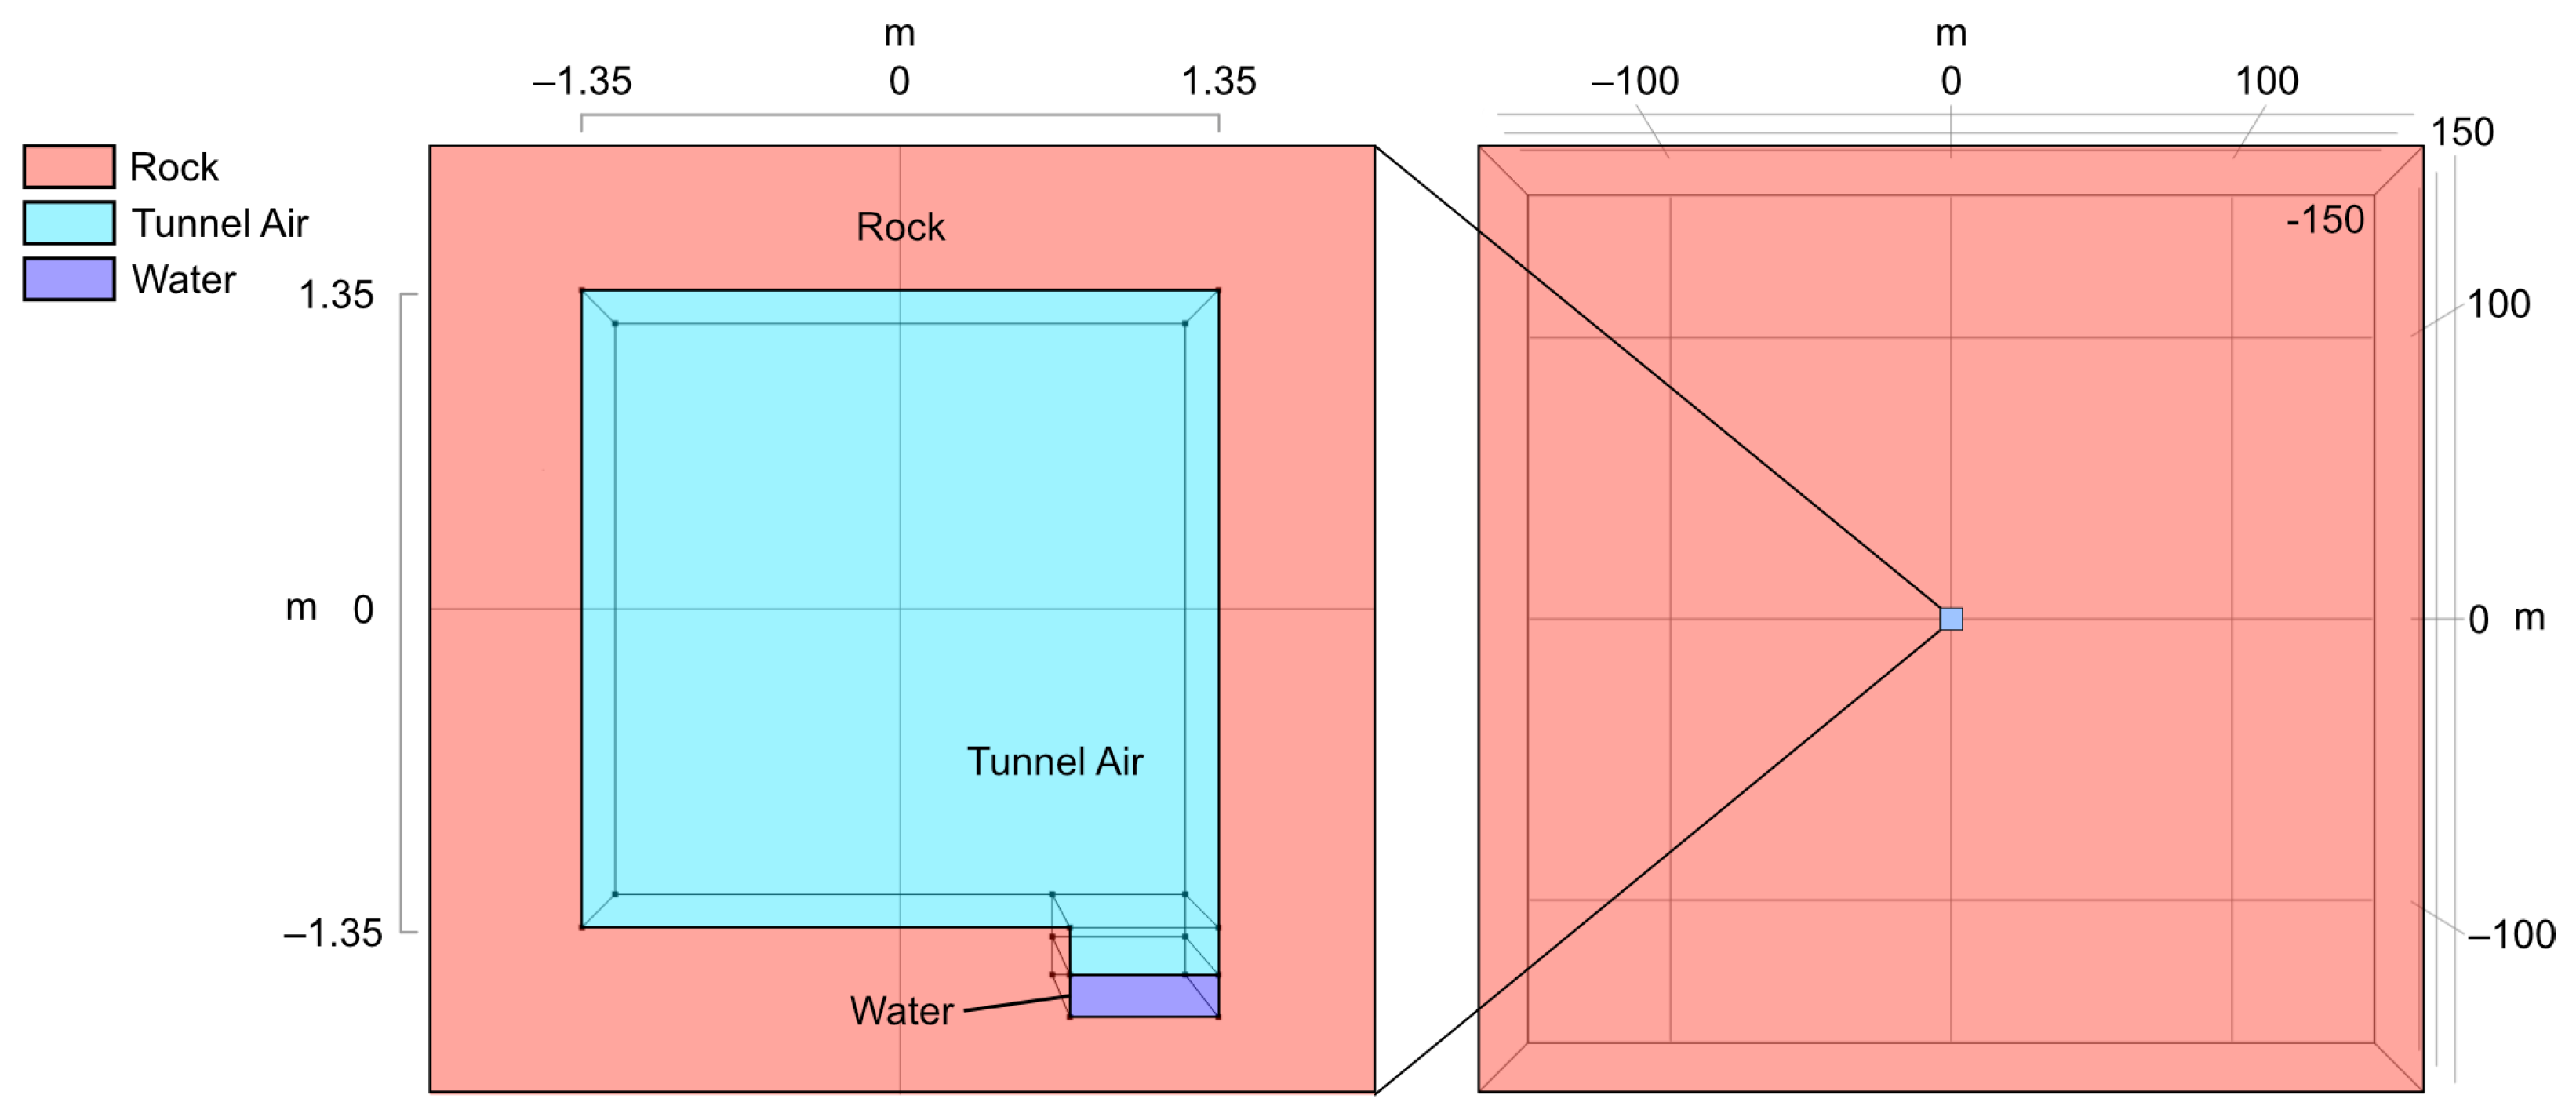
Ls) can be calculated. After performing the calculation, a side length of approximately 150 m is obtained to ensure that thermal effects do not influence the model boundaries. Therefore, the model size is set to 150 m in each direction (300 m side length) to ensure that the model acts as semi-infinite in numerical modeling.
The utilized tunnel model shown in
Figure 6 is made by a 2.7 × 2.7 m excavation (resembling the Bedretto tunnel cross-section) with a length of 300 m embedded in a 300 × 300 × 300 m solid domain corresponding to the Rotondo granite (
Figure 6). The water channel is also implemented in the model, represented by a 0.63 × 0.38 × 300 m rectangular prism (
Figure 6), with a measured water depth of 0.18 m.
The initial temperature of the rock at the beginning of the heat extraction period approaches the 21.4 °C measured at half of the height of the tunnel (z = 0) and a geothermal gradient of 0.028 °C/m is applied to the rest of the domain based on the known value and obtained with the optical fiber data from the adjacent boreholes. Additionally, a constant upward heat flux of 70 mW/m
2 is applied to the bottom boundary, which corresponds to the average heat flux of the Gotthard massif [
58]. A boundary temperature is also set to the top of the model, in accordance with the geothermal gradient. The heat transfer in the granite is considered to occur only by conduction, given the ultra-low permeability of the intact rock of 4.19 × 10
−18 m
2 [
59]. For modeling purposes, the granite is assumed as a non-porous medium based on its very low total porosity (<2%) [
59], indicating that the influence of water on its thermal properties is not considered. The physical parameters assumed for the Rotondo granite are displayed in
Table 3. It should be noted that these values are fixed, and therefore, remain constant regardless of temperature variations.
The air temperature at the beginning of the heat extraction period approaches the 19.8 °C recorded, with a constant flow of 0.1 m/s, corresponding to the mean value of the velocities recorded in
Figure 4. A boundary temperature of 19.8 °C was set on the side of the flow source. The initial water temperature in the channel was set to 16.8 °C and the flow velocity to 0.18 m/s, with a boundary temperature of 16.8 °C set at the flow inlet. The physical parameters used for the tunnel air and channel water are displayed in
Table 3 and are all pressure-independent. It is important to note that we assumed constant entrance velocities for both air and water throughout the duration of the simulation.
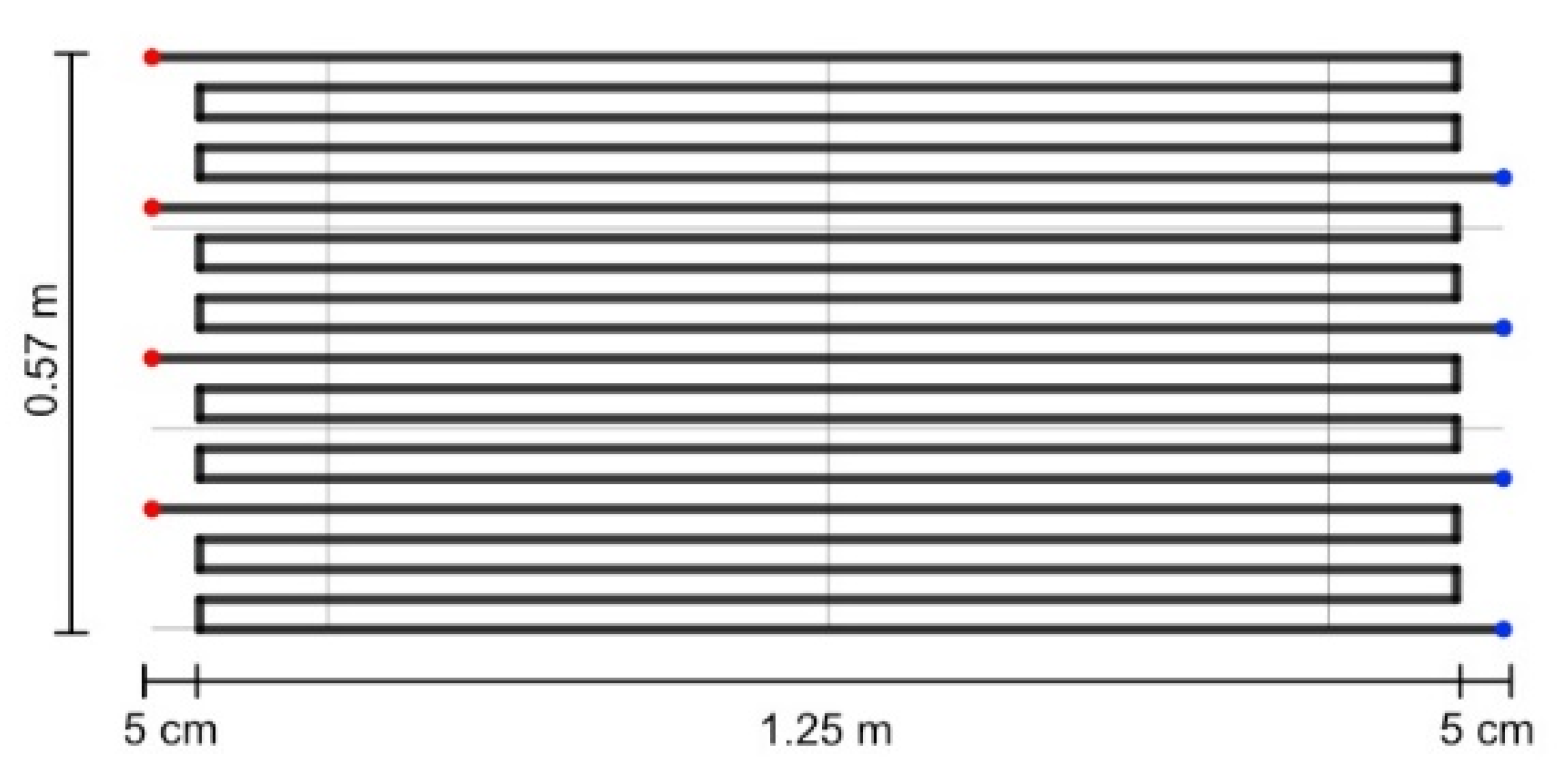
The heat transfer with the heat carrier fluid in the heat exchanger takes place in four sets of aluminum alloy pipes of 6.47 m in length, as shown in
Figure 7, in which a mix of antifreeze (propylene glycol) and water is injected at 0.65 m/s at a temperature of 2 °C. The design of the heat exchanger is based on a product available in the market from the company Enerdrape [
65]. The pipes are rectangular, having an inner height of 1.6 mm, an inner width of 12 mm, and an inter-pipe distance of 15 mm. For simplicity of numerical modeling, the heat exchanger design was simplified from the original product, consisting of one inlet and one outlet, with the pipe being divided into four sections in between. The four sets of pipes modelled and shown in
Figure 7, however, represent one heat exchanger. Details about the properties of the material can be found in
Table 3. The choice of water mixed with antifreeze instead of pure water was motivated by the specific requirements of the heat exchanger design and functionality [
65].
Three different models were built to determine the optimal medium to extract heat from, including the heat exchanger being placed (a) in the water channel; (b) in the air, 0.25 m from the western wall (left in
Figure 6) and parallel to it; and (c) in the granite, 0.25 m inside the tunnel wall on the west side and parallel to it. It was assumed that the panel placed in the granite was cemented in the wall with material of the same properties as the rock.
The mesh size and the relative tolerance were chosen based on the results of the sensitivity analysis to select the best option between accuracy and computational effort. To ensure our model accurately represented the tunnel’s boundary conditions for heat extraction, we initially ran the model without heat extraction, using the specified initial conditions. This preliminary simulation spanned 42 years, as a representative age of the tunnel. Our findings revealed minimal temperature changes after this period, indicating that an almost steady state was reached by the end of simulation. By utilizing these equilibrated conditions as the initial condition for our heat extraction phase, we could more precisely define the boundary conditions. We assumed constant water and air temperatures, allowing only the rock to interact with the other mediums and the heat exchanger. Despite the actual slight daily fluctuations in air temperature, our assumption provided a reasonable estimation for the model. It is noteworthy that the rock temperature may have evolved since the tunnel’s excavation, and current measurements might not perfectly reflect temperatures from 42 years ago. Nevertheless, this approach enabled us to focus on heat extraction dynamics under conditions closely resembling long-term thermal equilibrium within the tunnel environment. Subsequently, the second part of the model, involving heat extraction through heat exchangers, was carried out for 30 days to assess the sustainability of energy production at the heat exchanger outlet and to monitor the system’s temperature evolution.
6. Discussion
In the context of energy extraction, a notable distinction exists between railway tunnels such as those in London or Glasgow and the Bedretto tunnel. While the Bedretto tunnel benefits from the geothermal gradient, its heat recharge occurs solely through the heat flux of the Gotthard massif, approximately at 70 mW/m
2 [
58]. Conversely, heat in the London and Glasgow tunnels is continually replenished by the frictional heat generated during train braking, allowing for the exploitation of both air and ground as heat sources [
9].
The forthcoming discussions address crucial aspects involved in the implementation of a heating system utilizing tunnel water in Bedretto. These aspects encompass cost comparisons, risk assessments, and potential mitigation strategies. Additionally, alternative applications for the extracted energy are suggested.
6.1. Heat Supply to Bedretto
The village of Obergoms, situated at the western entrance of the Furka tunnel, has implemented a district heating system utilizing mountain water flowing at a rate of 60 L per second and a temperature of 16 °C [
67]. This system, operational since 1993, supplies up to 1.17 MW
th, producing 2.96 GWh
th annually, with room for expansion and system connections [
16,
68]. Instead of a centralized heat pump supplying hot water to the entire village, Obergoms opted for a solution of pipes delivering tunnel water directly to individual heat pumps [
48]. This approach is also recommended for Bedretto for several reasons:
Individual heat pumps offer flexibility in managing individual needs and including new houses, unlike a single centralized heat pump.
A centralized system experiences greater heat losses when circulating water through the village and requires additional pipes for a closed circuit.
Estimating the size of a central heat pump is complex and may lead to a reduction in the COP, while individual heat pumps can be installed with open circuits using a single pipe. The tunnel water can then be treated like rainwater.
Residents investing in individual heat pumps reduce the municipality’s risk. The investment required is also relatively low.
To mitigate potential damage due to the flowing particles in the tunnel water, Obergoms installed a desander at the tunnel entrance to facilitate sedimentation of heavy particles and remove suspended particles [
69]. A similar approach can be adopted for the Bedretto tunnel, installing a desander before channeling water to the village. Additionally, like Obergoms, Bedretto could utilize the elevation difference between the tunnel portal and the village, eliminating the need for pumping. Additionally, like Obergoms, Bedretto could utilize the elevation difference between the tunnel portal and the village, eliminating the need for pumping. The head loss due to friction, estimated using the Hazen–Williams equation, is smaller than the pressure head provided by the 90 m elevation difference [
70,
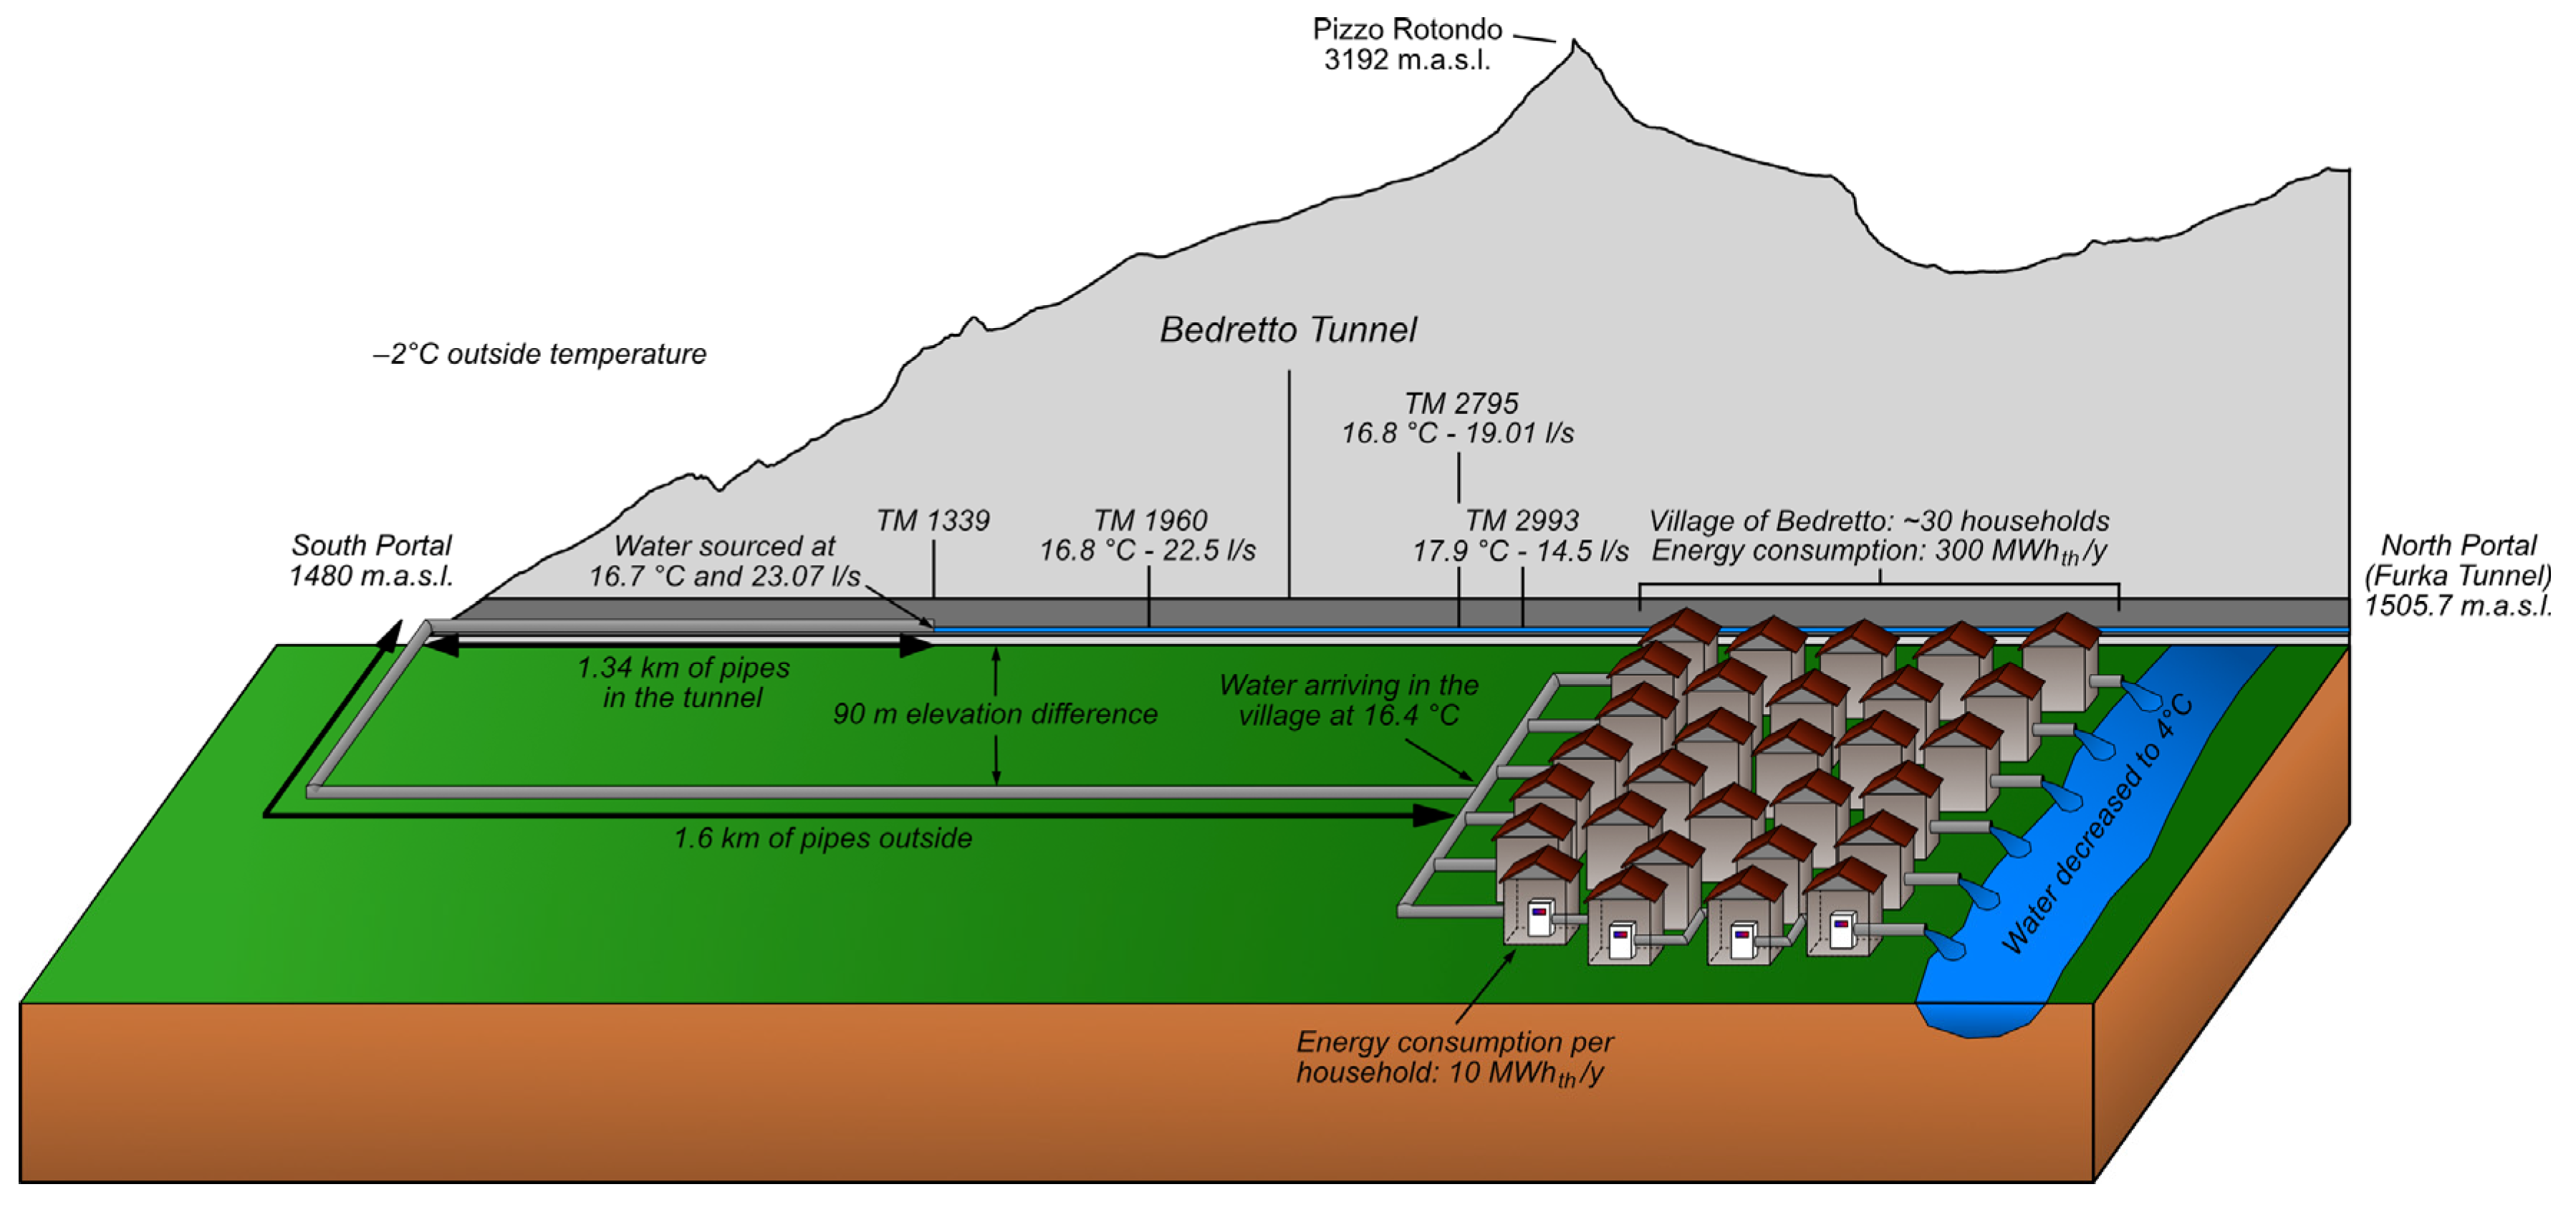
71]. Therefore, even if all the water in the channel at TM 1339 were transported to the village, the natural gravitational force would be sufficient to drive the water flow through the pipe without the need for additional pumping. At Bedretto, the insulated pipes could be buried along the road connecting the tunnel portal to the village, covering about 1.6 km of mainly downhill terrain, with a total descent of 90 m in elevation. The pipes considered for circulating the water can withstand pressures of 16 bar [
43], which would be enough in this case. Upon reaching the heat pumps, tunnel water should pass through plate or frame-type heat exchangers, easily cleanable if necessary, and constructed from materials resistant to aggressive liquids, such as stainless steel.
A schematic model of the pipes transporting the water to the district heating system of the village of Bedretto can be seen in
Figure 13 along with the main parameters used in the study and the overburden profile above the tunnel.
6.2. Investment Justification and Cost Comparison
When planning for the implementation of such a heating system, three critical factors must be considered to evaluate its profitability and mitigate investment costs: the suitability of the heat source, the heat demand of the market, and the length of the piping network [
72]. The 1.2 MW
th to be extracted from the heat source makes it suitable for the size of the village. Additionally, the village of Bedretto comprises about 30 houses clustered around the main street, thus providing an ideal setup for an overall short length of pipes. However, the main parameter to make this system profitable is the interest of the residents in taking part in this heating system. As highlighted in
Section 5.4, residents investing in heat pumps can expect profitability within 14 to 20 years in comparison with a conventional fuel oil heating system, with a typical lifespan of more than twenty years [
54]. In comparison, installations of solar panels generally have lifetimes of 25 to 30 years minimum and are generally paid back after 16 years for an installation of 6 kW
p (“p” stands for peak power production) [
73]. The amortization period decreases with the increase in peak power capacity of the panels, to 12.5 years for 9 kW
p and 9 years for 12 kW
p installations [
73]. However, the financial attractiveness of solar energy investments can vary based on the financial contribution of the state, as discussed in
Section 6.3.
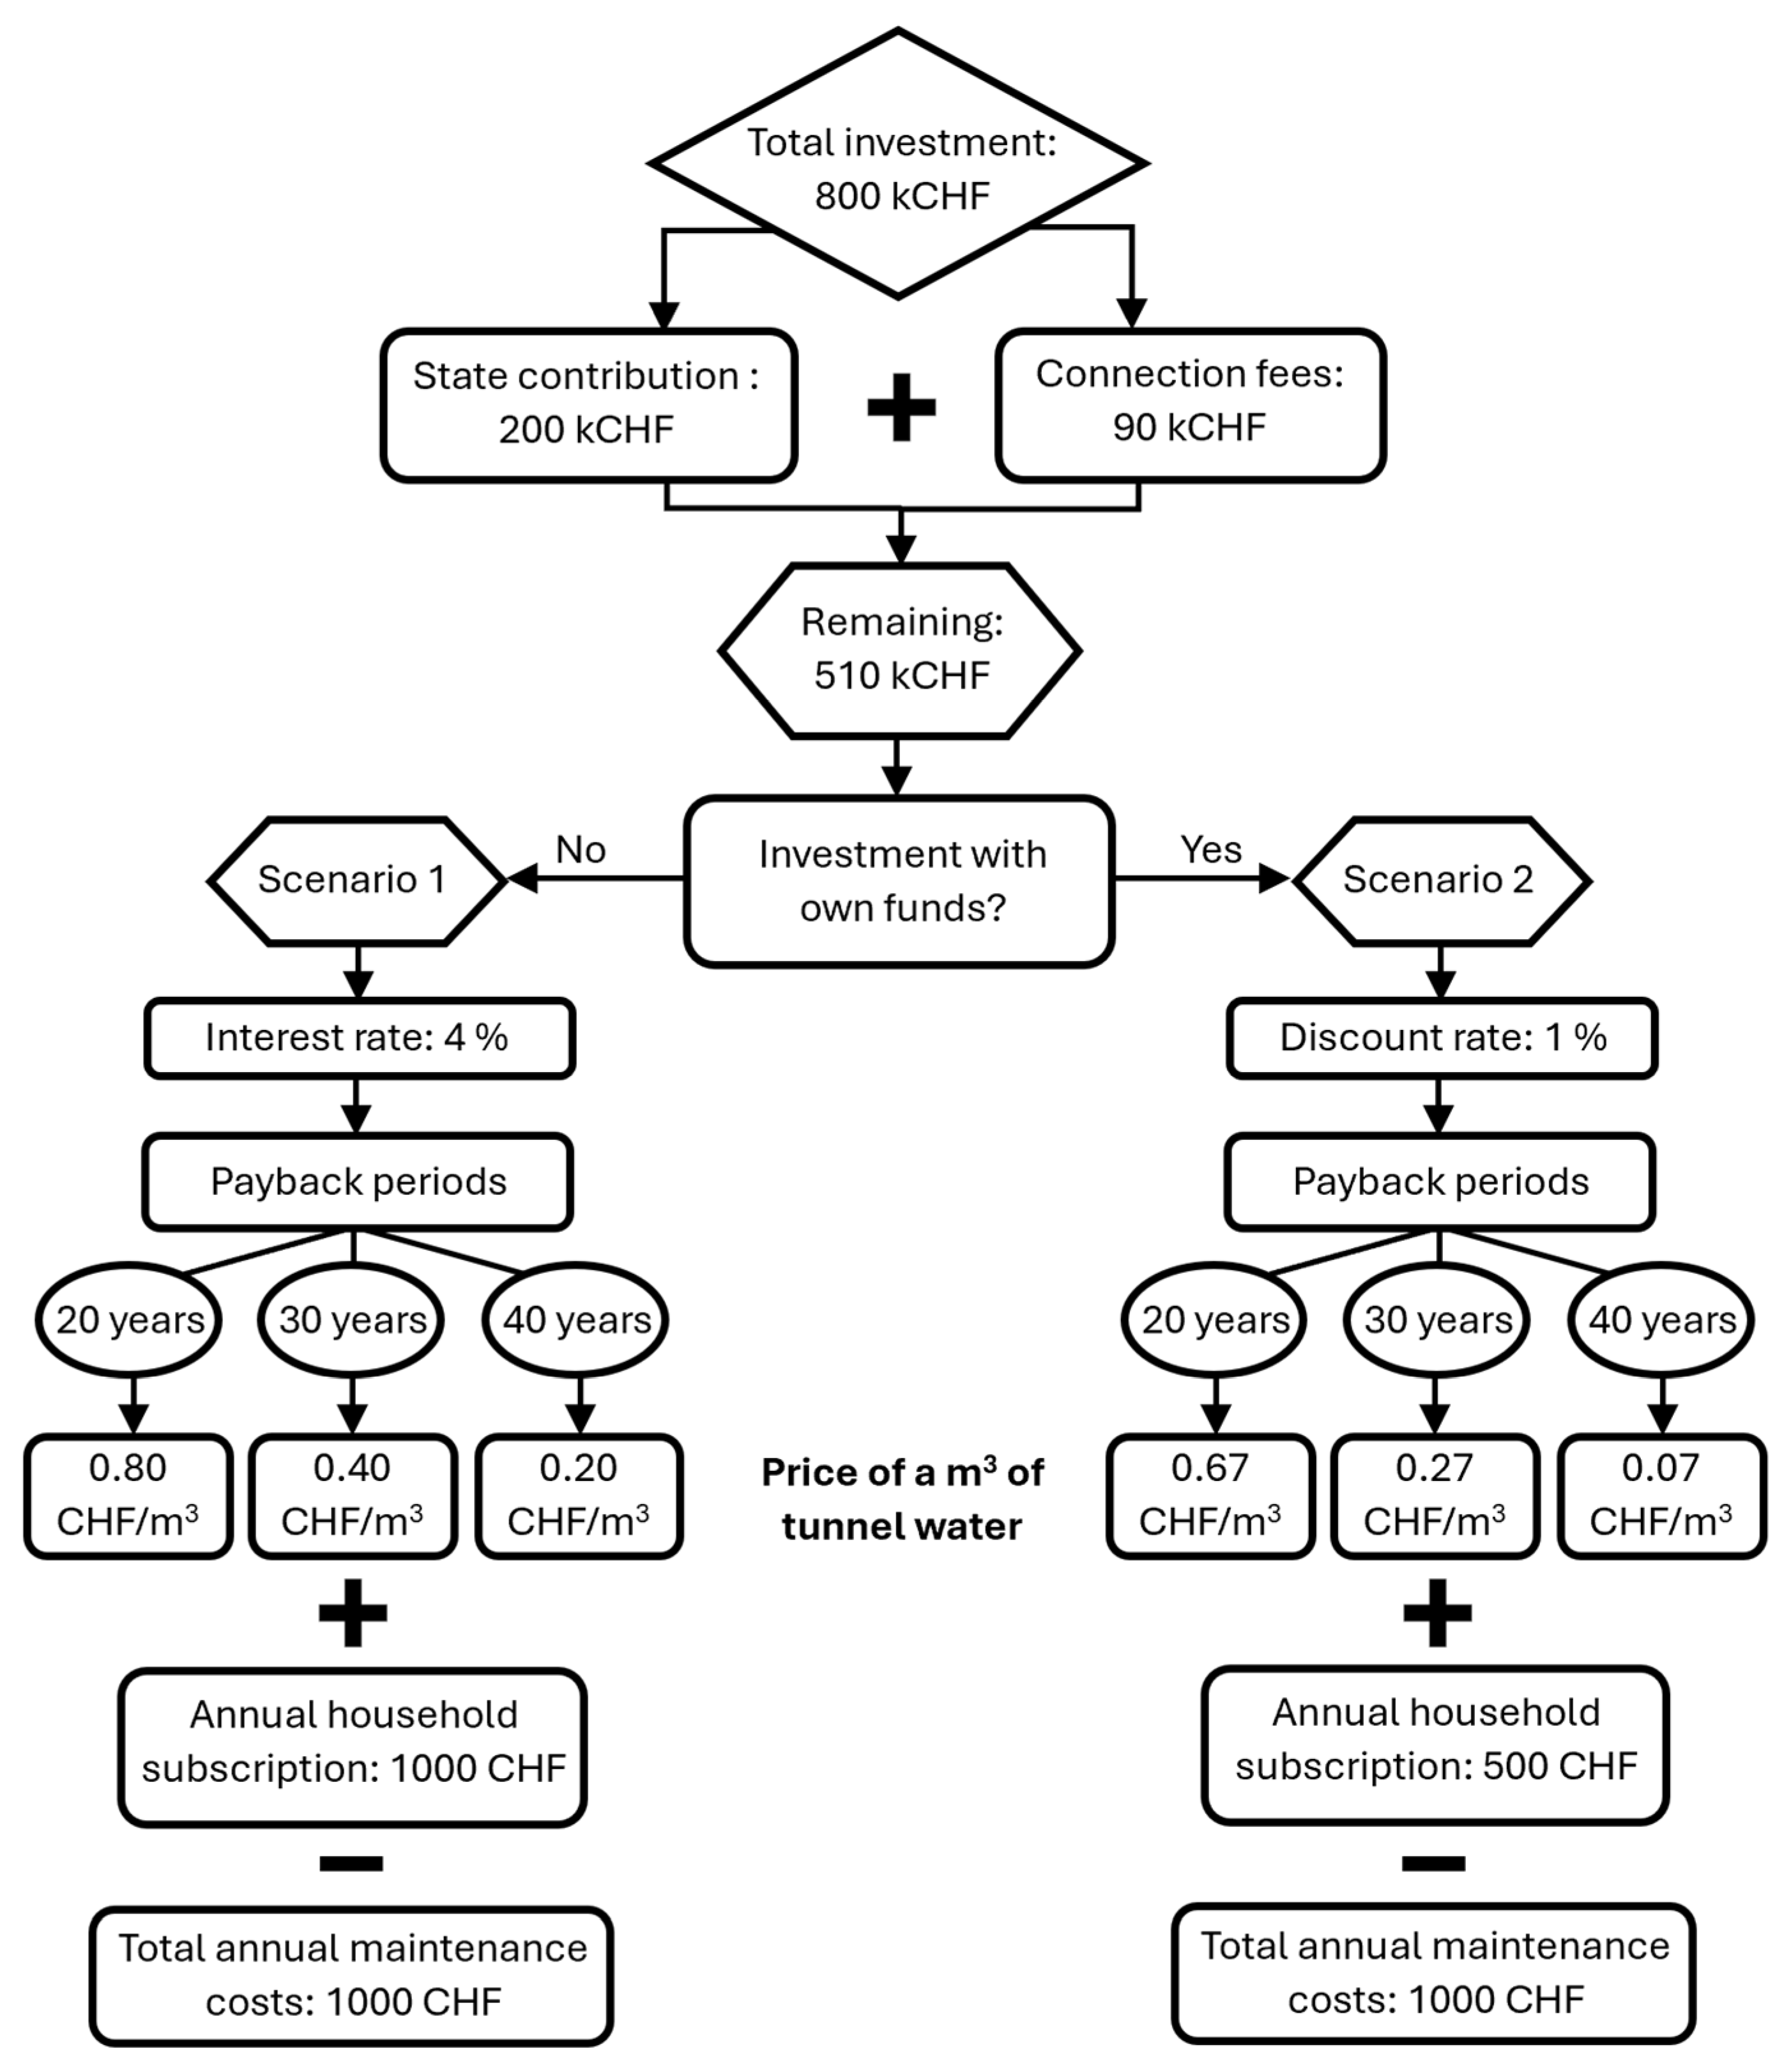
To determine the subscription fees and the price of tunnel water per cubic meter, a payback period for the investment should be determined, selected as 20, 30, and 40 years in this study. While choosing a longer payback period allows for reduced costs for the residents, it also represents a higher risk for the municipality, as discussed in
Section 6.3.
As mentioned in
Section 1, there are currently six infrastructures harnessing the heat from tunnel water in Switzerland. Although the thermal energy potential of tunnel water is substantial and has the capacity to supply hot water to numerous apartments and houses, as demonstrated in the village of Obergoms at the southern end of the Furka tunnel, a common limitation lies in ensuring the presence of an adequate number of end-users at the tunnel portals to ensure the project’s cost effectiveness [
48]. In general, the presence of a sufficiently inhabited town in the vicinity of a tunnel would justify such an investment. Indeed, for an identical investment of kCHF 800 and a contribution of the state of kCHF 200, it would take 200 homes to cover the costs with the fees of connection to the system alone, assuming CHF 500 per kW
th of compressor capacity and a total capacity of 6 kW
th. Without any state contribution, the number of homes required to cover the investment costs is about 267. For a village twice the size of Bedretto, with 60 connections, the payback period would be 10 years, assuming the same connection fees and annual subscriptions of 1000 CHF/year and a bank loan with an interest rate of 4%. Consequently, for a village three times the size of Bedretto, with 90 connections, the payback reduces to 4.5 years, also without selling the tunnel water.
6.3. Investment Risk Assessment
The cost analysis results indicate that the current number of households in Bedretto is near the minimum needed for both village and resident investments to be amortized over 20 years. Consequently, it is essential to address the investment risks.
First, remote alpine villages like Bedretto often face population decline, creating uncertainties about sustained payback capacity over decades. Bedretto’s population peaked at 388 in 1850, dropped to 50 in 1990, and rose to 101 by the end of 2023 [
74]. Most inhabitants are retired or nearing retirement, with only three people aged 0–19 [
75]. This demographic trend poses challenges for population growth.
The fluctuating prices of electricity, gas, or heating fuel may serve as a compelling reason to consider transitioning to heating systems with reduced reliance on such energy sources. The primary cost factor for the Bedretto heating system—and thus, the investment payback time—is financial support from the state or other entities. If the investment costs were fully covered, the payback period would drop to 12 years, making it competitive with, or even better than, a solar panel installation.
Additionally, the long-term stability of the water discharge and its temperature from the tunnel is crucial for system efficiency and should therefore be monitored. However, measurements at the western portal of the Furka railway tunnel in Obergoms have shown stable water temperatures since 1996 [
48,
76] with relatively constant discharge across seasons [
48]. The proximity of the Furka and Bedretto tunnels suggests that similar stability could be expected for the water in the Bedretto tunnel.
6.4. Greenhouse Heating
As previously mentioned, the limited number of end users makes it challenging to fully utilize the thermal energy potential of the tunnel water. Therefore, an alternative use of this untapped energy would be greenhouse farming. As for the household heating system, a heat pump could extract heat from the tunnel water to warm a greenhouse, enabling the cultivation of plants that otherwise could not thrive in such cold environments [
77,
78].
Using geothermal energy for greenhouse heating is a well-established practice, providing a sustainable solution for agricultural needs in various climates [
77,
78]. Geothermal systems are often employed to create controlled environments where temperature-sensitive plants can grow year-round, increasing productivity and enabling the cultivation of exotic or out-of-season crops [
79]. The world’s average energy consumption for greenhouse heating per year and per hectare is estimated at 5.56 GWh
th [
78]; it could therefore fully exploit the thermal energy potential of the tunnel water.
A comparable system exists in the village of Frutigen, in the Bernese Alps, where water emerging from the Lötschberg tunnel at 19 °C is transported to a tropical greenhouse [
79]. There, a heat pump extracts the energy from the water to heat the greenhouse, creating a warm environment suitable for tropical plants [
79]. By integrating this alternative with the proposed district heating system, the energy potential of the tunnel water could be fully exploited.
6.5. Thermal Storage in Crystalline Rocks
In addition to the transport of tunnel water to the village of Bedretto, the excess heat of the tunnel water could be extracted with a heat pump in the tunnel using the energy produced by solar panels installed for this purpose outside of the tunnel during the summer period. The water would then be stored in the fracture network of the Rotondo granite for later use. Once retrieved, the water could then be transported towards Bedretto during the winter. Indeed, sensible heat storage of water is highly beneficial for managing energy production surplus. With its high specific heat capacity, water can store approximately 41.8 kJth for every 10 °C temperature increase, making it an excellent thermal storage medium. However, challenges remain in underground storage of thermal energy over extended periods.
In the domain of functional aquifer thermal energy storage (ATES) systems, the Netherlands emerges as the global leader, hosting the majority of such systems worldwide [
80]. Notably, the ATES systems in the Netherlands specialize in storing low-temperature water (<30 °C) [
81]. Contrastingly, few examples of high-temperature ATES systems exist worldwide, but the German Parliament has showcased an example of a highly efficient high-temperature ATES system. This system operates with injection temperatures of 70 °C and achieves a heat retrieval efficiency of 77% [
82]. Numerical simulations have explored water storage at higher temperatures (90 °C and more), achieving temperature recoveries of approximately 67%, with efficiency improvements observed even after a decade [
81,
83,
84,
85,
86].
With the previous restriction on heating the subsurface by more than 3 °C lifted in Switzerland as of 2023 [
87], the potential for developing this technology is vast. Given that a large part of Switzerland’s underground consists of fractured crystalline rocks, there is now an opportunity to explore thermal energy storage in fractured media. To the author’s knowledge, this technology has never been implemented before. This development could significantly contribute to Switzerland’s goal of achieving net-zero greenhouse gas emissions by 2050 [
47].
The Bedretto Underground Laboratory for Geosciences and Geoenergies (BULGG) is an ideal location to begin such experiments. The BULGG possesses several boreholes, two of which (ST1 and ST2) are used for stimulation and injection (ST1 is equipped with multi-packer systems) [
21,
88,
89]. These two boreholes cross multiple fault zones with well-characterized geometries and hydrogeological properties, some of which could be used for thermal energy storage. For example, one of the major fault zones intersected by borehole ST1 at a depth of ca. 190 m has a transmissivity of 1.1 × 10
−6 m
2/s with an estimated thickness of ca. 1 m and is surrounded by a low-permeability granite (3.63 × 10
−18 m
2) [
59,
90,
91]. While ST1 would be used for the injection of the hot water, ST2 could be used as a production borehole, for circulation or energy extraction. Overall, the Bedretto fault networks show potential for achieving high heat retrieval ratios thanks to the adequate geological conditions and to the warm temperature, of above 20 °C, of the surrounding rock.
7. Conclusions
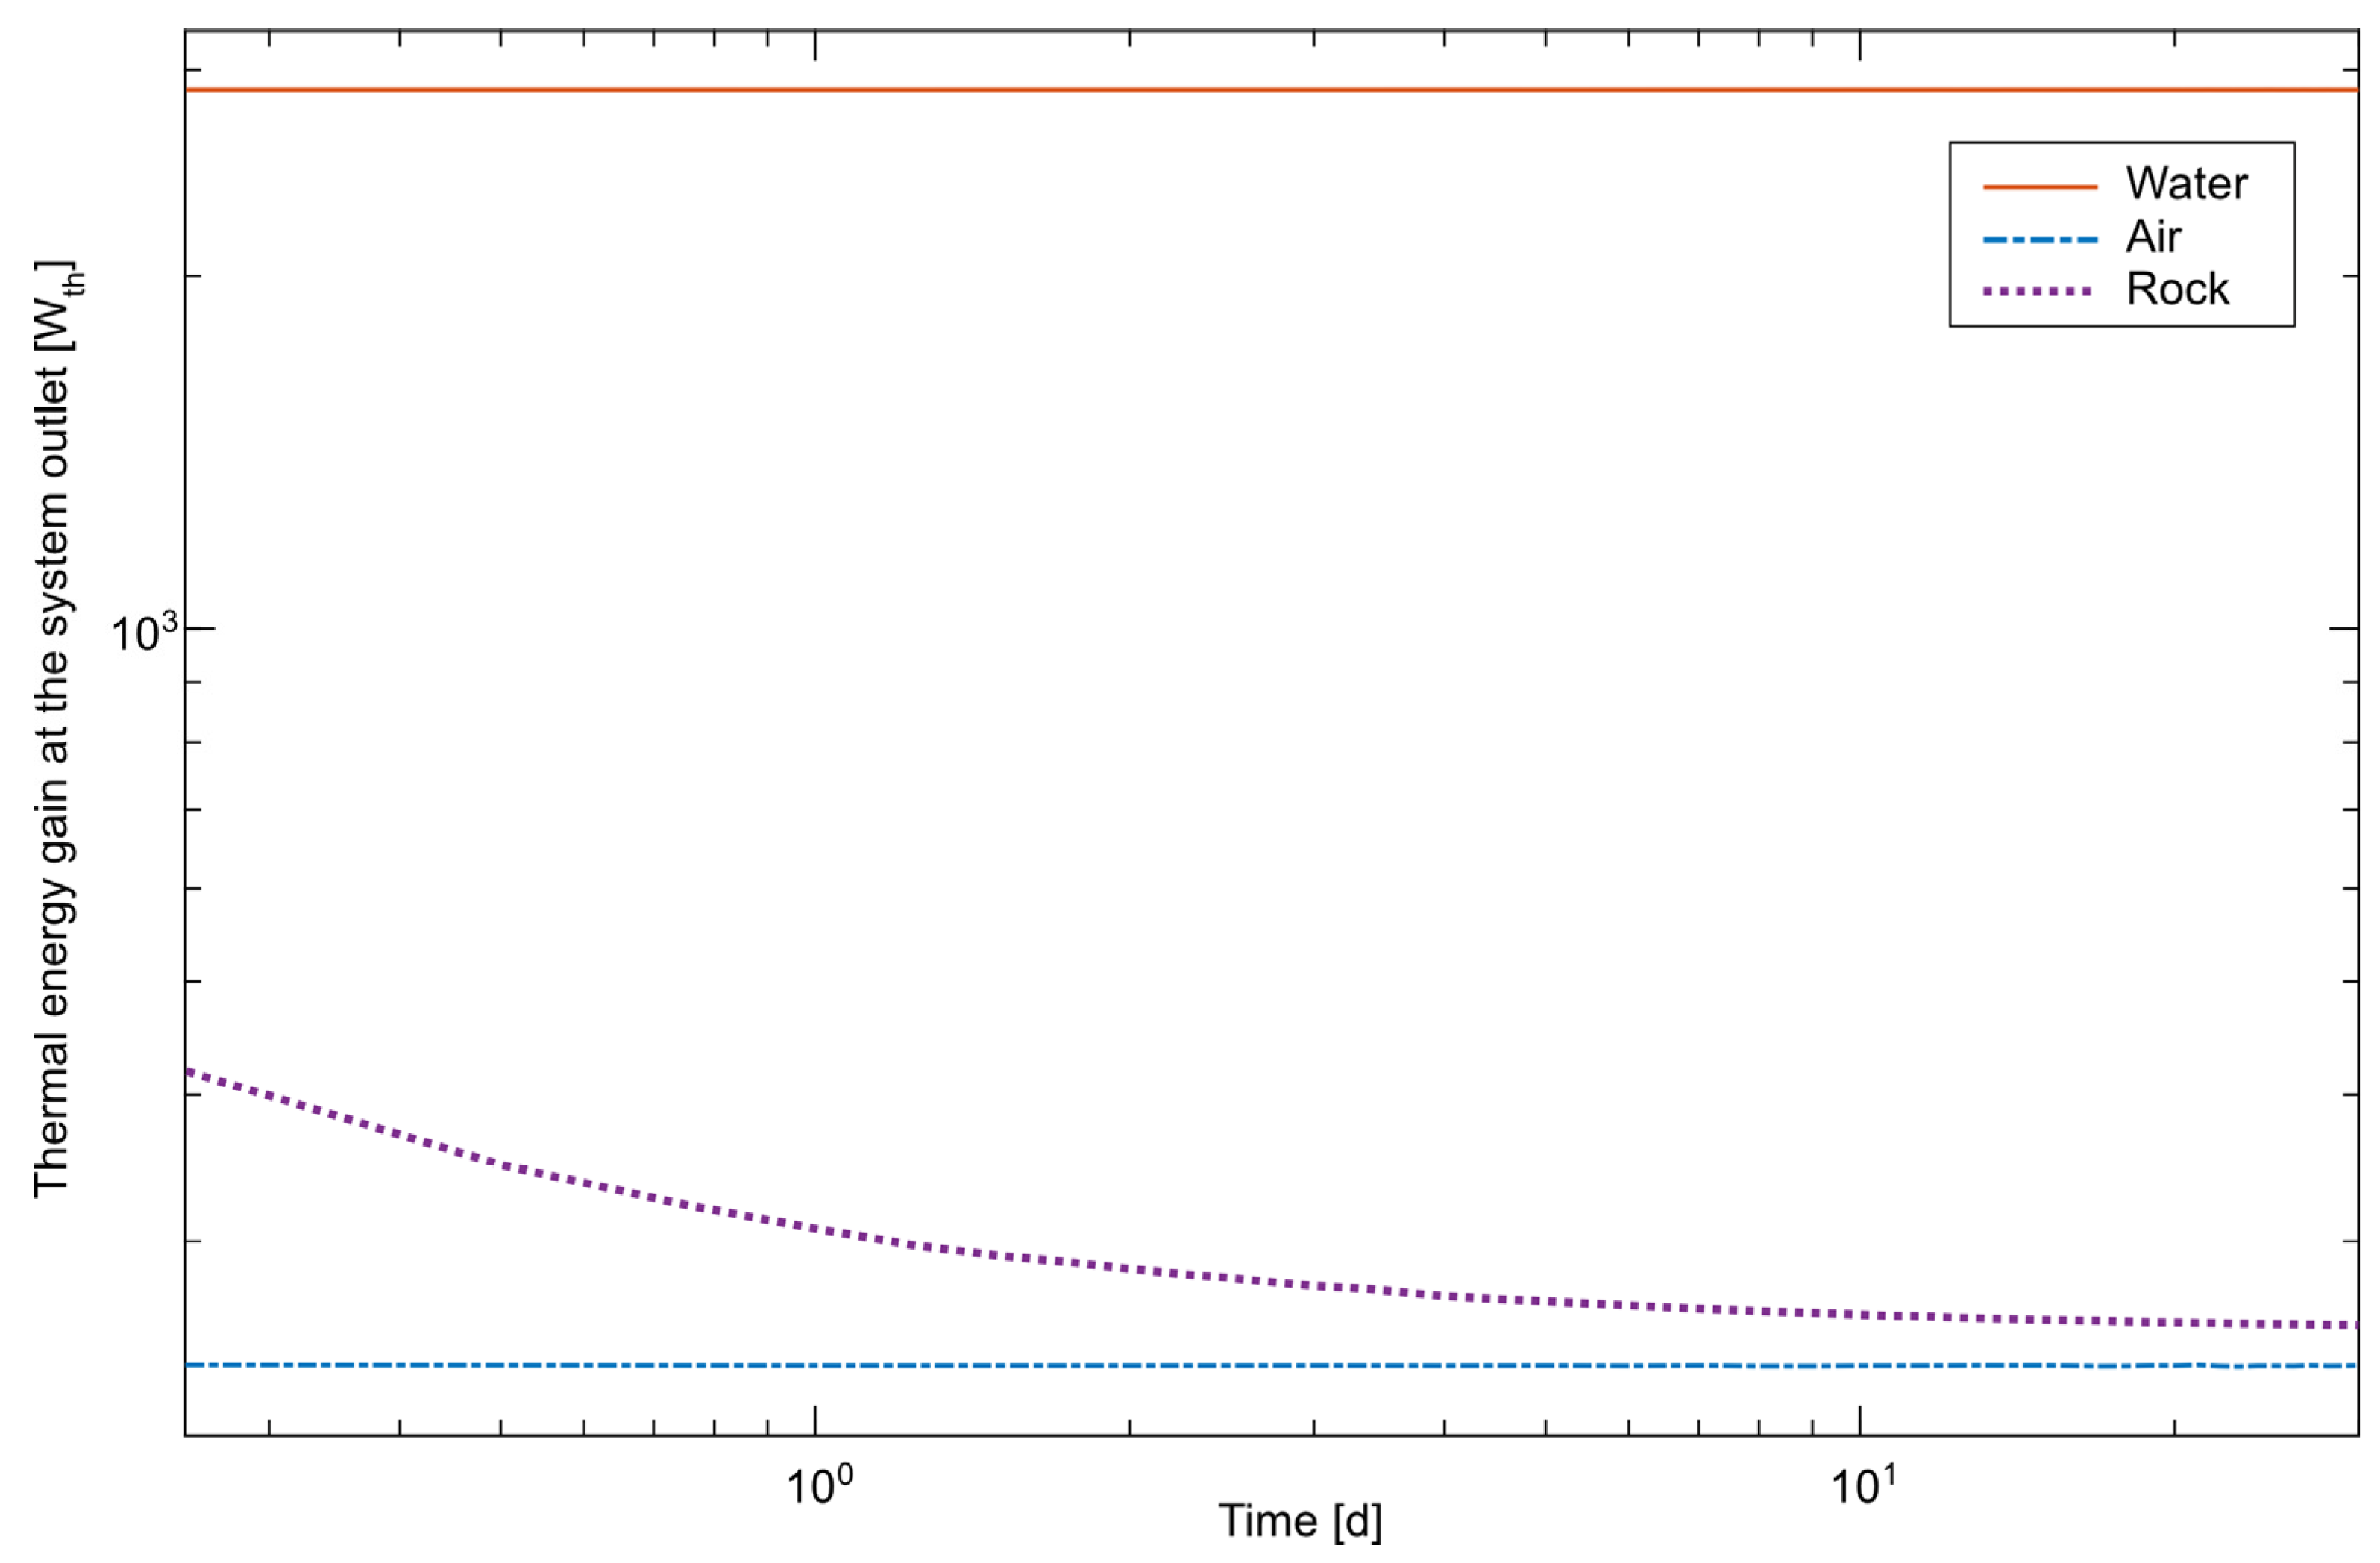
This feasibility study assessed the heat extraction potential across various mediums within the Bedretto tunnel and proposed potential applications for the extracted heat. Utilizing a numerical model built with the COMSOL Multiphysics numerical solver, we determined the heat extraction capabilities of a typical heat exchanger plate unit constructed from aluminum alloy pipes when embedded within the rock, or placed in the air or in the water. The results indicate that for the same heat exchanger plate specifications, the extracted power amounts to 0.26 kWth for rock, 0.24 kWth for air, and 2.88 kWth for water. Additionally, tunnel water offers a more constant energy supply over time due to its large flow rate at relatively stable temperature within the channel.
This study envisioned two primary applications for harnessing the energy of the tunnel water: supplying heat to the nearest village and heat storage within crystalline rock formations. The former was explored extensively, including cost and implementation analyses, starting with water transport towards the village of Bedretto.
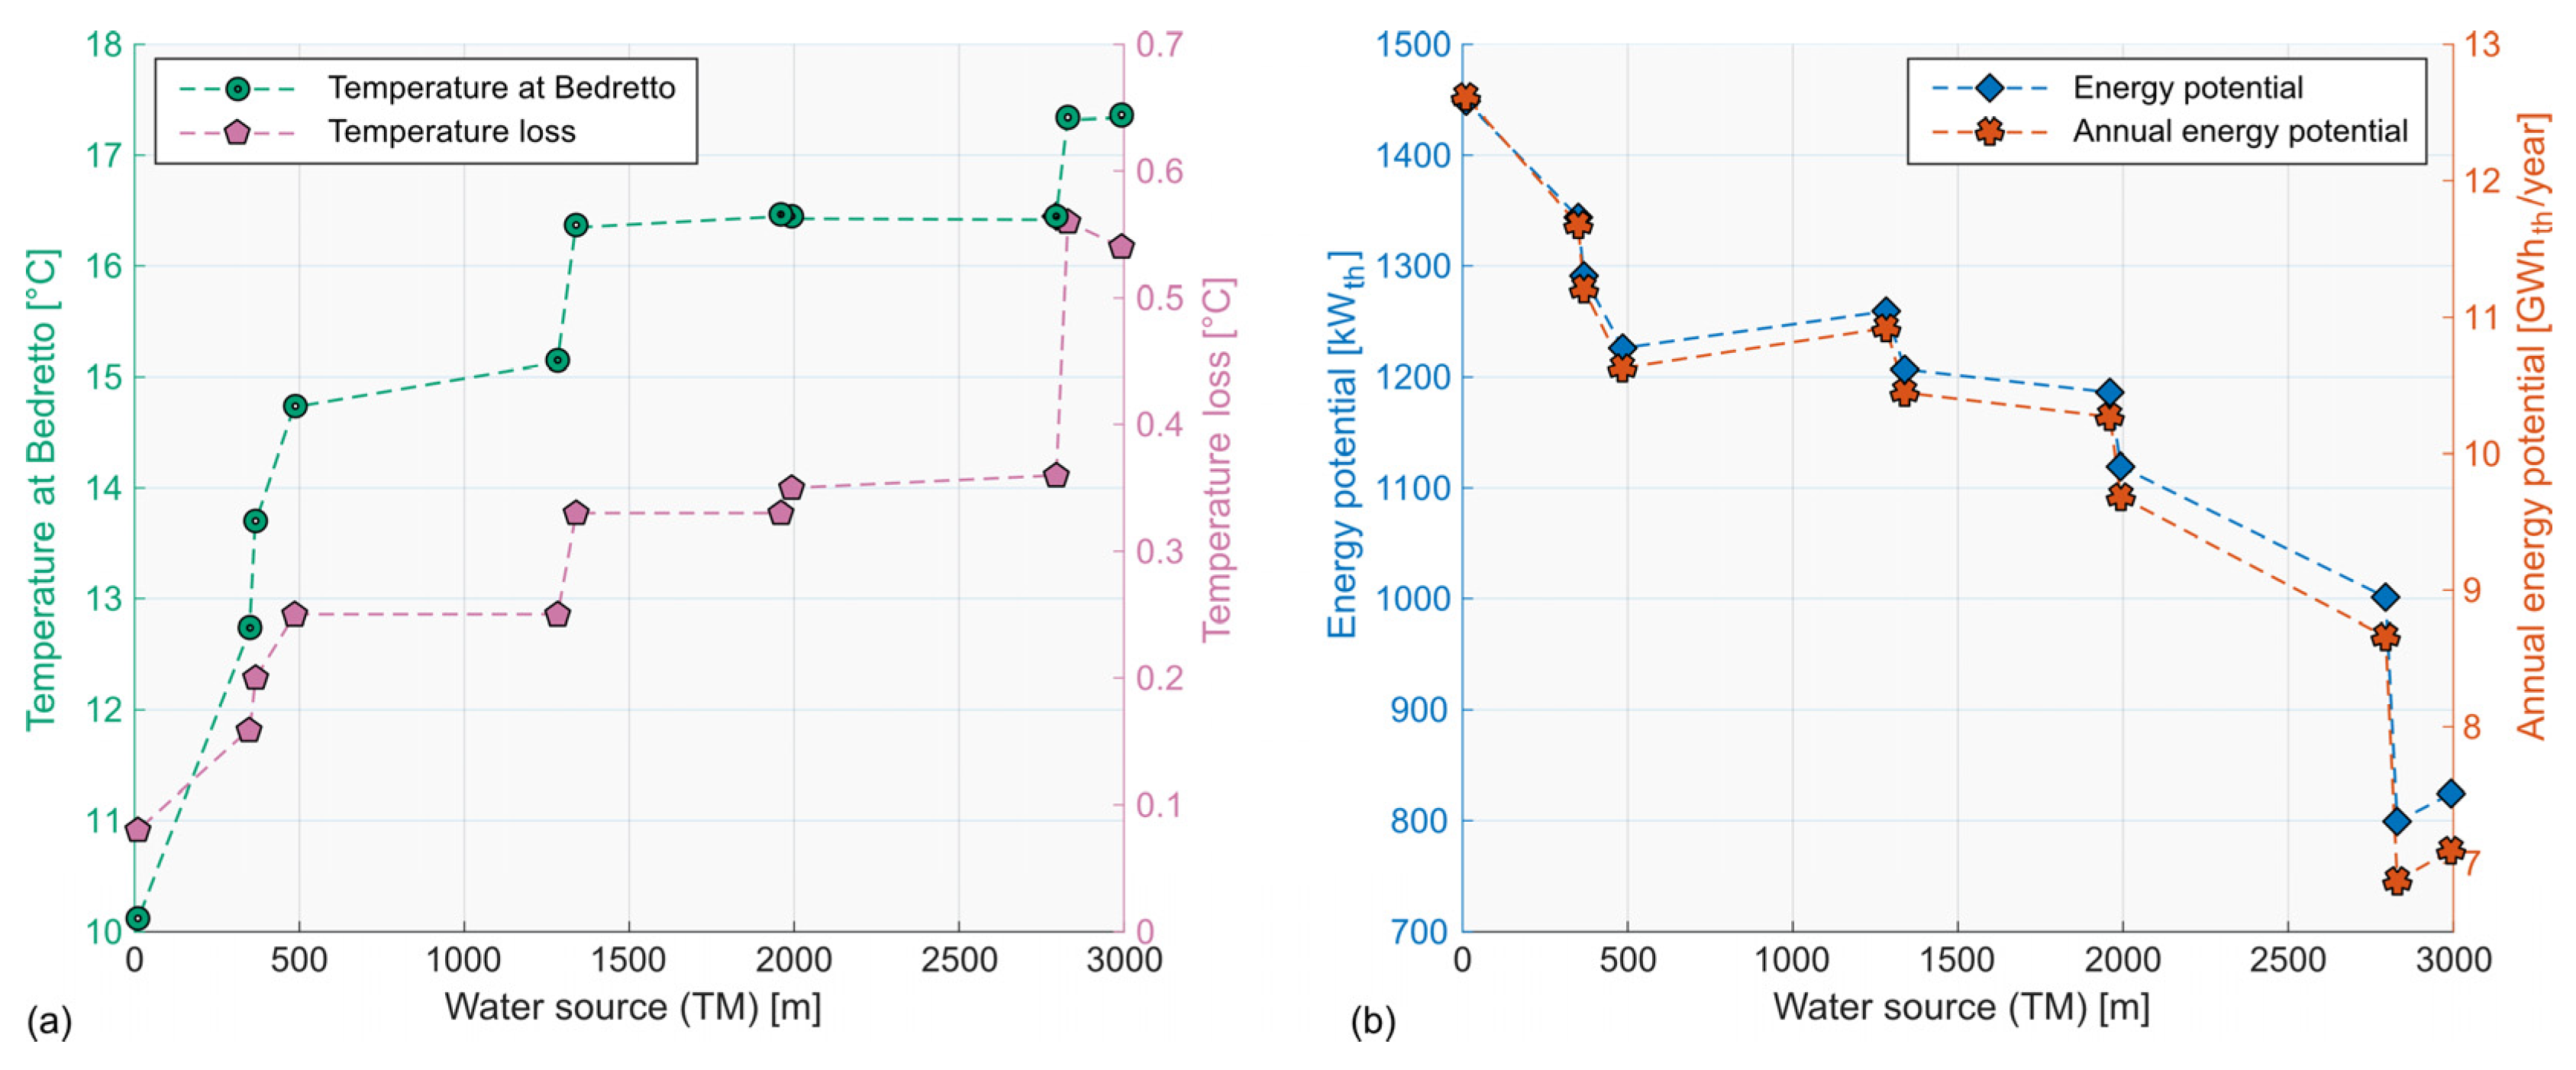
During water transport in polyurethane-insulated pipes to Bedretto village under winter conditions, the decrease in water temperature ranged from 0.08 °C to 0.56 °C, corresponding to thermal losses of 19.52 kWth to 33.09 kWth, respectively. Additionally, the energy extractable from the water via heat pumps, after decreasing its temperature to 4 °C, was found to range between 817.50 kWth and 1459.59 kWth. With an estimated annual energy production capacity ranging from 6.87 GWhth to 12.62 GWhth, this heat source vastly exceeds the village’s heat demand, estimated at 0.3 GWhth per year.
Considering the initial investment amount and heat pump efficiency, sourcing water from TM 1339 appeared to be the most advantageous solution. At this location, adjacent to a colder inflow zone, water flows at a rate of 23.07 L/s with a temperature of 16.7 °C. Achieving an additional degree would necessitate extending pipes up to TM 2830, adding approximately 1491 m in pipe length and incurring an extra cost of around kCHF 125.
Since 1993, the village of Obergoms, situated at the Furka tunnel exit, has utilized tunnel water for heating purposes. The water is directed to individual heat pumps, cooling it to 4 °C before discharging it into the river [
48]. The cost and implementation analyses of this feasibility study were based on this existing facility of Obergoms, incorporating initial investment estimates, economic plans, and technical considerations [
48]. Additionally, this study assessed the economic viability of such an investment from the consumer’s perspective, as well as the risks assumed by the municipality. With an initial investment of kCHF 800, supplemented by a kCHF 200 contribution from the state and kCHF 90 of fees from inhabitants connecting to the system, the municipality would be left with a remaining cost of kCHF 510. Depending on payback periods of 20, 30, or 40 years, the municipality could recover costs by selling tunnel water and instituting a yearly subscription while residents could amortize heat pump purchases and installations within 14 to 20 years. It should, however, be noted that the suggestions provided in the text regarding the support from the municipality are based on our internal analysis and modeling. No consultation or confirmation has been sought from the municipality regarding the feasibility or implementation of these suggestions.
External financial support could facilitate investment amortization across various payback periods while ensuring profitability for residents. However, it is crucial to emphasize that the success of this scenario hinges on nearly the entire village being connected to the system. Additionally, the investment and energy consumption figures presented in this study are estimations and may vary. Nonetheless, the environmental advantages of such a sustainable heating system could strongly justify the investment.
In general, although the initial investment would vary greatly between each case study depending on the village geometry and distance to the tunnel, amortization of such a district heating system can be achieved with a minimum of about 30 connections if the right economical plan is chosen. The payback time for both the town and the inhabitants would decrease to only 4.5 years with 90 connections and the investment could even be covered directly by the connection fees of 200 homes. The findings of this study suggest promising outcomes that may be applicable to other contexts. For instance, the development of similar district heating systems could be explored for the Mappo–Morettina road tunnel in Switzerland, located near the city of Locarno, which has sufficient potential end users in its proximity [
2]. Additional alpine locations such as the city of Innsbruck at the portal of the Brenner tunnel in Austria and the agglomerations at the portals of the Lyon–Turin tunnel between France and Italy should also be explored. The proximity to extensive tunnels traversing the Alps and the potential for numerous connections at these portals indicate a significant potential for swift amortization of the heating systems.
As an alternative to household heating, and to address the issue of the limited number of end users at the portals of base tunnels, the heat from the tunnel water could be extracted via heat pumps to heat greenhouses for farming. A similar system is already in place in the village of Frutigen in the Bernese Alps, where water from the Lötschberg tunnel emerges at 19 °C and is transported to a tropical greenhouse. There, a heat pump uses the heat to warm the greenhouse [
79].
In addition, at Bedretto, we benefit from infrastructure enabling the storage of excess heat when not immediately needed, making geothermal storage an even more viable option for utilizing thermal energy, which could be further explored within the underground laboratory.
In conclusion, this study demonstrates the significant potential of using tunnel water as a sustainable energy source. The proposed applications, whether for direct heating or for heat storage, highlight a viable path towards achieving long-term energy sustainability. The successful implementation of such systems in other regions with similar geological conditions could further enhance efforts to reduce greenhouse gas emissions and promote renewable energy solutions.
