Abstract
During the normal laying and operation of a three-core umbilical cable, AC current can easily lead to AC electrochemical corrosion on the outer surface of the steel tube. To explore the electrochemical corrosion mechanism and the factors affecting the three-core umbilical cable, this paper optimizes the internal induced potential calculation method for three-core umbilical cables. It analyzes the changes in the characteristics of the induced potential and explores the variations in the density of induced current under different conditions. The research results show that by optimizing the calculation method for the induction potential of the umbilical cable’s steel pipe, for the electromagnetic significance of the smallest repeating unit, the induction potential on the steel pipe’s surface exhibited a cyclic change. The peak part of the induction potential is most likely to experience electrochemical corrosion. Additionally, reducing the radius of the outer insulation aperture of the steel pipe and improving the conductivity of seawater will increase the density of the induced current in the insulation aperture, thereby increasing the risk of electrochemical corrosion. As the cable pitch and AC frequency increase, the current density in the steel pipe pores will also rise.
1. Introduction
As an important component of offshore power transmission, information transfer, and chemical agent transmission, cross-linked polyethylene umbilical cables are widely used in offshore oil and gas development, offshore wind power transmission, and other fields. Because they can connect onshore control platforms with underwater control systems, they are known as the “nerve center and lifeline” of underwater control systems [1,2,3,4,5].
The internal structure of an umbilical cable is relatively complex. The transmission units mainly consist of power units, fiber optic units, oil transmission steel pipes, and chemical transmission steel pipes (hereinafter referred to as “steel pipes”), which enable energy transmission and remote onshore control. The protective structures include fillers and polymer jackets, ensuring the stability of the umbilical cable under stress conditions [6]. There is an electromagnetic induction phenomenon between the power units and the steel pipes of the umbilical cable, resulting in an induced voltage to ground (seawater) on the surface of the steel pipes. Under long-term seawater erosion conditions, the steel pipes are at risk of corrosion by alternating current, leading to perforation of the metal structure, which poses a significant threat to the stability of offshore power energy transmission systems [7,8]. Recent reports and research on steel pipe leakage failures both domestically and internationally indicate that AC electrochemical corrosion of the steel pipes inside an umbilical cable has become a major factor in umbilical cable failures. Figure 1 shows a schematic diagram of the holes produced in the steel pipes due to AC electrochemical corrosion [9,10,11,12].
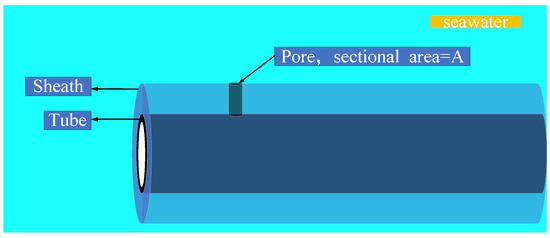
Figure 1.
Schematic diagram of electrochemical corrosion of steel pipe.
For metals to undergo AC electrochemical corrosion, an external electric field is required. The cycle period of the power frequency AC is only 0.02 s, making the alternating process extremely rapid. Compared with natural corrosion, the intensity of AC electrochemical corrosion is significant. Natural corrosion usually results in uniform corrosion on the metal surface, with localized pitting corrosion being rare. However, under AC electrochemical corrosion, defects on the steel pipe surface can lead to localized pitting or even perforation, significantly impacting the safe and stable operation of umbilical cables. Bjørn et al. conducted AC electrochemical corrosion calculations on three types of power cables to determine the AC current density on the steel pipe walls and predict the time to perforation [13]. Ouadah et al. suggested using non-corrosive coatings on the surface of buried pipelines to reduce their surface potential and protect them from corrosion. Existing researchers have performed calculations and analyses on the AC electrochemical corrosion behavior of umbilical cables and buried pipelines and have proposed protective measures [14]. However, there are few reports on the calculation method of AC electrochemical corrosion-induced voltage for the double reverse-twisted steel pipes and conductor cores inside umbilical cables. Based on the current research status, this paper proposes a calculation method for AC electrochemical corrosion with double reverse twisting and provides a detailed explanation and analysis of its mechanism and influencing factors [15,16,17].
To explore the electrochemical corrosion process of umbilical cables under alternating current during normal operation, this paper establishes an AC corrosion control model for umbilical cables. Using a three-core umbilical cable as the research subject, a three-dimensional finite element simulation model was constructed to obtain the maximum induced potential under the influence of power frequency three-phase alternating current. Combined with a double-layer interface polarization equivalent model, the current density in the pores on the surface of the umbilical cable steel pipe under different seawater conductivity conditions was analyzed. This assessment evaluates the risk of AC electrochemical corrosion when the steel pipe comes into contact with seawater and analyzes the relationship between the current density inside the pores and the pore radius of the steel pipe.
2. Materials and Methods
To determine the induced potential on the surface of the steel pipe in a three-core umbilical cable under alternating current and to analyze the possibility of AC electrochemical corrosion, this section first describes the mechanism of induced potential generation on the steel pipe surface. Additionally, to enhance the accuracy of subsequent simulation calculations, the concept of “micro-elements” is introduced to analyze the variation of induced potential in the internal steel pipe of the umbilical cable under different spatial distributions and to select an appropriate model.
2.1. Mechanism of Induced Potential Generation in Steel Tube of Power Umbilical Cable
In AC umbilical cables, there are three main types of AC interference from AC transmission lines to metal pipes, as shown in Figure 2. (1) Capacitive coupling interference occurs when the medium between the conductor and the steel pipe forms a coupling capacitor between the AC transmission line and the pipeline. This type of coupling can be ignored when the cable shielding layer and the steel pipe are well grounded. (2) Resistive coupling interference is an accidental type of interference and not common. It only occurs when there is a fault in the AC transmission line, causing the current from the grounding electrode material to flow into the steel pipe and form an interfering ground electric field. (3) Finally, regarding inductive coupling interference, according to Faraday’s law of electromagnetic induction, an induced voltage and induced current will be generated in the conductor structure surrounding the alternating magnetic field. This type of interference, known as inductive coupling interference, is the main form of AC interference affecting umbilical cable steel pipes. The imbalance of the three-phase current in the transmission line and the relative position between the steel pipe and the transmission line are key factors influencing the induced voltage [18].
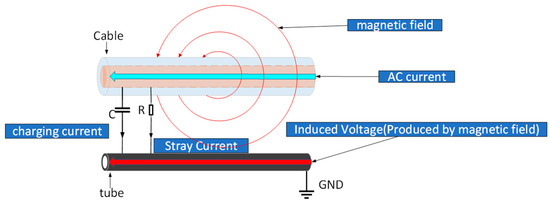
Figure 2.
Three forms of AC coupling within the umbilical cable.
AC electrochemical corrosion is a type of interference corrosion. The magnitude and direction of the AC current change instantaneously, as it is much smaller than natural corrosion. It requires external electric field conditions, and an increase in the amplitude of the induced voltage and frequency can accelerate the reaction rate, easily leading to perforation corrosion. The main basis for the induced potential generated by the conductor core on the umbilical cable steel pipe is the Maxwell equations, which are expressed as follows:
where B is the magnetic induction (in T); E is the electric field strength (in V/m); J is the current density (in A/m2); H is the magnetic field strength (in A/m); and D is the potential shift vector (in C/m2).
In Maxwell’s system of equations, Equation (1) is Ampere’s loop law, which shows that an electric current and a time-varying electric field can produce a magnetic field; Equation (2) is the principle of flux continuity, which means that the magnetic lines of force in space have no beginning and no end; Equation (3) is Faraday’s law of electromagnetic induction, which shows that a time-varying magnetic field can produce an electric field; and Equation (4) is Gauss’s theorem, which shows that an electric field is a field with a flux source.
For calculating the induced potential in the internal steel pipe of the umbilical cable, the concept of “infinitesimals” in calculus can be used to make an assumption: The internal steel pipe of the umbilical cable is composed of numerous metal wires with geometric cross-sectional dimensions approaching zero. The induced potential on each metal wire is related to its distance from the conductor core, and thus the induced potential generated by the steel pipe varies at different positions. The schematic diagram of the metal wire assumption is shown in Figure 3. Under this assumption, the induced potential on each metal wire can be calculated using Ampère’s circuital law combined with the basic principle of mutual inductance [19].

Figure 3.
Schematic diagram of the wire hypothesis.
We set the cable through the wire with a core diameter of d, which passed through the rms value of I for the current, the geometric center of the core, and the wire distance S. The wire-induced potential formula was derived as follows. First of all, according to the Ampere loop theorem, we calculated the through-wire core distance from the center of the cable distance of r at the magnetic field strength:
The magnetic flux per unit length of wire chained to the core of an energized wire is expressed by
We brought in the vacuum permeability to find
From the basic principle of mutual inductance, we have
The value of the wire-induced potential per unit length resulting from the mutual inductance between the core and the wire is
2.2. Effect of Spatial Distribution on Induced Potentials
When neither the conductor core nor the steel tube is twisted, the induced voltages in the steel tube cannot be completely canceled out due to the unequal distances between the steel tube and the three conductor cores. (If the distances are equal, then the induced voltages generated by the currents with a phase difference of 120° add up to 0). Also, the positions of the conductor cores and the steel tube under the condition of not being twisted are shown in the schematic diagram in Figure 4. In this case, there is a phenomenon of residual induced voltage accumulating with the length:
where l is the length of the cable conductor and the steel pipe (in m); I1, I2, and I3 are the three-phase current values (in A); S1, S2, and S3 are the distances between the three-core conductor cores and the steel pipe (in m); and Upipe is the value of the induced potential (in V).
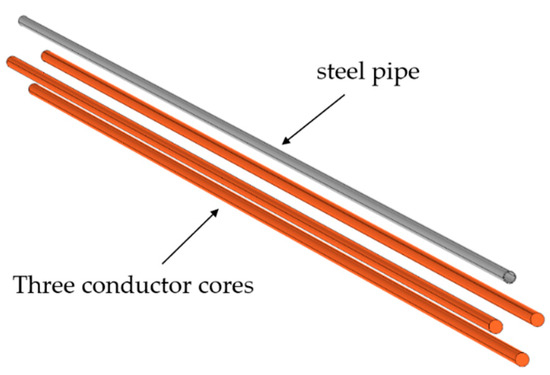
Figure 4.
Schematic diagram of conductor core and steel tube (not twisted) positions.
As shown in Figure 5, if the steel pipe periodically rotates around the three-core conductor with a fixed pitch distance of 500 mm, then the induced voltage on the steel pipe will go through a cycle of rising and falling as the pipe completes one pitch of rotation, eventually returning to the initial voltage value. If the initial position is grounded, then the induced voltage inside the steel pipe will return to zero after completing one pitch of rotation [20].
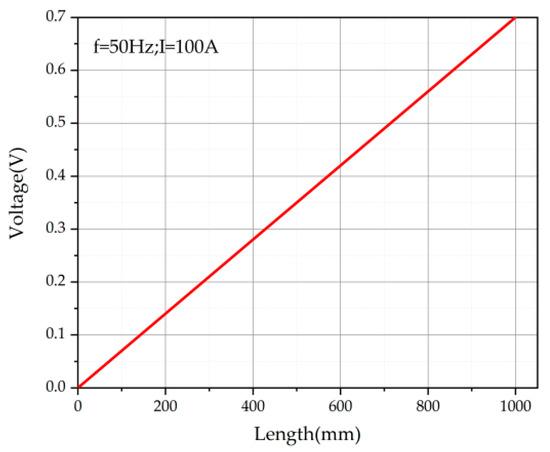
Figure 5.
Axial distribution curve of induced potential on the surface of the non-twisted steel pipe.
As shown in Figure 6, if the steel tube is periodically rotated around the power conductor core at a 500 mm fixed pitch distance, the induced voltage in the steel tube will go through a cyclic process of rising and falling when the tube completes one pitch cycle rotation and finally return to the initial position’s voltage value. If the initial position is grounded, then the induced voltage in the steel tube will return to zero after completing one pitch rotation:
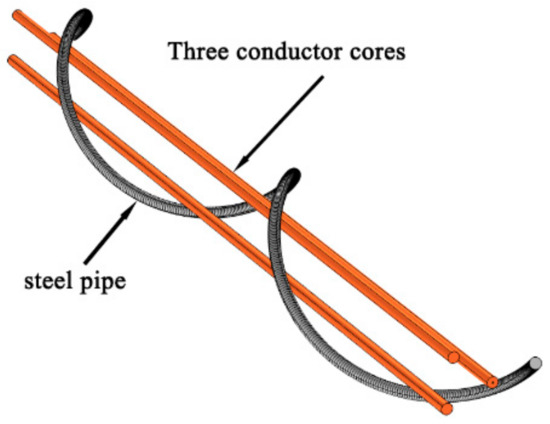
Figure 6.
Schematic diagram of conductor core (not twisted) and steel tube (twisted) positions.
Figure 7 shows the relationship curve of the residual induced voltage on the surface of the steel tube along the axial direction of the cable when only the steel tube was twisted. It was found that when the steel tube was twisted, the residual induced voltage on its surface varied in a sinusoidal trend, which produced a periodic offset. In Figure 6, the peak induced voltage of 0.35 V existed on the surface of the steel tube at the positions 300 mm and 900 mm in the axial direction of the cable, while the induced voltage at positions of 0 mm, 600 mm, and 1200 mm on the steel tube had a value of 0 V. The above analysis could be used to determine that the length of 1200 mm was the stranded pitch of the steel tube, and the highest induced voltage value was found on the surface of the steel tube at positions of 300 mm and 900 mm under the length of the stranded pitch and the highest induced voltage value was at the positions of 0 mm, 600 mm, and 1200 mm, while at 0 mm, 600 mm, and 1200 mm, the induced voltage was completely canceled. This means that the residual induced voltage on the surface of the steel tube would be canceled out along the axial direction of the cable by the pitch cycle, and there would be no accumulation of induced voltage.
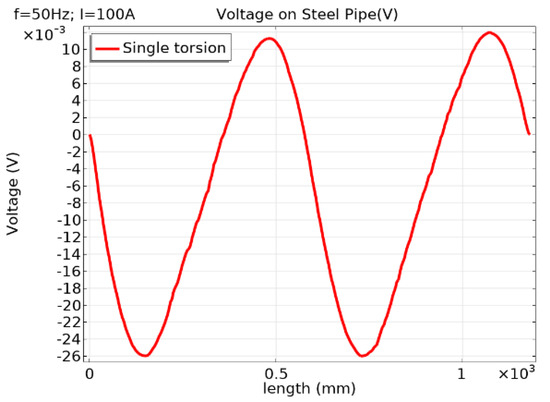
Figure 7.
Axial distribution curve of surface induced potential during torsion of steel pipe.
When the power conductor core was also twisted at a pitch of 333 mm, the length of the induced voltage to return to 0 no longer depended entirely on the spacing between the steel tube and the power conductor core, but it also depended on the pitch of the power conductor core. The conductor core and the steel tube were twisted under the conditions of the position schematic shown in Figure 8. In this case, the length cycle of the change in the induced potential occurring in the steel tube could be obtained only by considering the pitch length of the steel tube and the power conductor core at the same time. The induced potential change length cycle is also called the electromagnetic sense of the smallest repeat unit, and it can be understood as a high-voltage power unit and the steel tube from the initial relative position along the axial length of extension’ length to the initial relative position of the resumption of completion of a relative cycle of the stranded length of the unit. At this time, this is the voltage induced inside the steel tube to complete a cyclic change process.
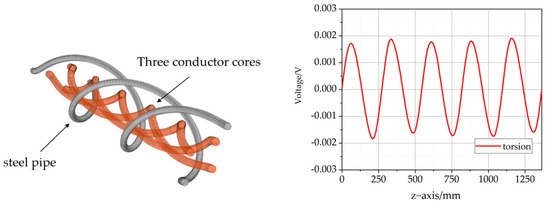
Figure 8.
Schematic diagram of conductor core and steel tube in twisted position.
When the power conductor core was twisted with the steel tube, the induced voltage distribution on the steel tube was as shown in Figure 8. Compared with Figure 7, within the same axial length of 1200 mm, the steel tube produced five cycles of induced voltage variation in the axial direction (i.e., the length of the electromagnetic minimum repetition unit), and all induced voltages produced by the power cables in the steel tube were cancelled out to 0. For the power umbilical cables with an internal stranded structure, the electromagnetic minimum repetition unit is the main factor influencing the variation in induced voltages in the steel tube along the length of the axial cycle:
where: L is the minimum repeating unit length (in m); L1 is the stranded intercept of the high-voltage power unit (in m); and L2 is the stranded intercept of the steel tube (in m).
If the conductor core and steel tube twist in opposite directions, then this minimum repeat unit is expressed by
where L is the minimum repeat unit length (in m); L1 is the stranded pitch of the high-voltage power unit (in m); and L2 is the stranded pitch of the steel tube (in m).
In this section, a series of studies were conducted on the accumulation of residual induced voltage inside the steel pipe under different conditions: when neither the steel pipe nor the conductor cores were twisted, when the steel pipe was twisted but the conductor cores were not, and when both the steel pipe and the conductor cores were twisted. Based on the above analysis, considering the periodic twisting of the conductor cores and the steel pipe within the umbilical cable at different pitches, the induced potential inside the steel pipe would experience periodic fluctuations. The length of this periodic change in induced potential was the smallest repeating unit in an electromagnetic sense. Additionally, the effect of different twisting directions on the length of the smallest repeating unit was considered, which could improve the accuracy of calculating the induced potential in the three-core umbilical cable and provide a theoretical basis for further in-depth research on the electrochemical corrosion process of umbilical cables.
3. Results
Based on the above research foundation, this chapter obtains the internal magnetic field distribution of the umbilical cable and the induced potential distribution on the surface of the steel pipe by performing finite element simulation calculations on a three-dimensional model of a three-core umbilical cable so as to obtain the maximum induced potential on the surface of the steel pipe.
3.1. Finite Element Simulation Design of Power Umbilical Cable
In this study, a three-core umbilical cable provided by Zhongtian Marine Cable Co., Ltd. was used as the research object. The 3D model of the three-core umbilical cable was constructed using Comsol Multiphysics finite element simulation software. Comsol Multiphysics, primarily based on the finite element method, is software which solves systems of partial differential equations to calculate coupled multiphysics phenomena. The version of Comsol Multiphysics finite element simulation software used in this study was Comsol 6.2. Due to the complex structure of the umbilical cable, this study mainly investigated the induced potential generated along the axial direction inside the steel pipe of the umbilical cable. Considering that the magnetic permeability of non-metallic structures is rather low, and some metallic structures inside the cable are less prone to AC electrochemical corrosion, non-metallic structures and certain metallic components, such as extruded GSW steel wire rope (1.8/3 kV power units), as well as optical fiber units could be appropriately omitted during the modeling process to save computational space and improve simulation efficiency and accuracy. The simplified 3D finite element simulation model constructed according to the above size requirements and model simplification is shown in Figure 9.
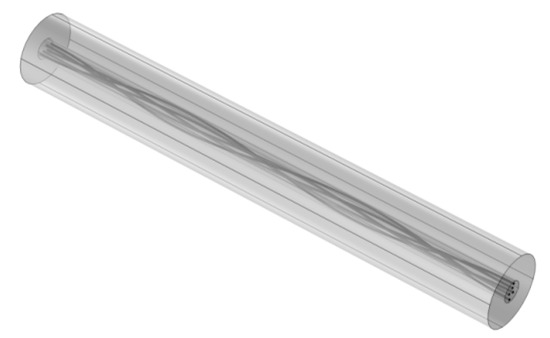
Figure 9.
Simplified model for 3D finite element simulation.
The internal metal structure of the three-core umbilical cable is twisted with a certain axial pitch. When the metal structure completes a full pitch, the induced voltage will undergo a process of rising and falling and then return to the initial value. If the initial position is grounded, then the induced voltage in the metal structure will return to zero after completing a full pitch. This is known as the twist cancellation effect.
The electromagnetic environment of the three-core umbilical cable varied periodically along the axial direction. However, due to the twist cancellation effect of the potentials in the three-phase conductors, the induced voltages generated between the conductors could not accumulate effectively along the axial direction, resulting in only small fluctuations in each cycle. In the field of insulation protection, this small induced voltage is usually insufficient to cause any faults and is therefore typically ignored. However, when considering AC electrochemical corrosion, even small currents generated by these potentials can threaten the normal operation of the steel tube, leading to pitting corrosion or even perforation and posing a risk of oil and chemical leaks. Therefore, the axial distribution of induced voltages along the steel tube should not be overlooked. Table 1 shows the internal structure and property parameters of the 36/66 kV power unit and the steel tube.

Table 1.
Power cable and steel tube structure and parameters.
3.2. Study of Induced Potential in Steel Tubes of Power Umbilical Cables
3.2.1. Calculation of the Magnetic Field Distribution of a Power Umbilical Cable
The AC electrochemical corrosion behavior of the metal structures inside the umbilical cable is significantly influenced by the induced potential generated by the alternating electric field. Experimental methods cannot provide detailed information on the axial macroscopic induced potential. Therefore, finite element simulation was used to calculate the induced potentials along the axis of the metal structures inside the umbilical cable. The AC voltage has a sinusoidal periodic waveform. The steel tube primarily experiences electromagnetic induction effects from the alternating electric field of the conductor cores, resulting in induced potentials. Finite element simulation enabled determination of the maximum induced potential values on the steel tube’s surface and their occurrence regions. This analysis helps assess the likelihood of AC electrochemical corrosion occurring in these areas. The magnetic field distribution generated by the conductor cores is illustrated in Figure 10.
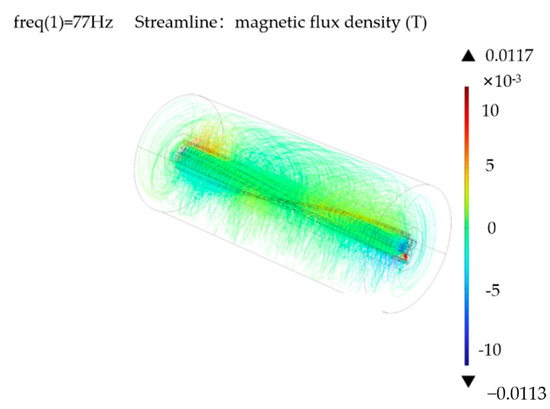
Figure 10.
Conductor core magnetic field distribution.
In Figure 9, it can be observed that the magnetic field strength of both the conductor core and the steel pipe was influenced by the torsional cancellation effect, resulting in a sinusoidal periodic variation in magnetic field strength. The peak magnetic flux density occurred near the surface layer of the conductor core, measuring 1.17 × 10⁻⁵ T. As the magnetic field spread outward, the magnetic flux density gradually decreased, reaching a maximum value near the steel pipe of 1.13 × 10⁻⁶ T. This decrease was more pronounced compared with the conductor core. However, it still induced corresponding periodic induced potentials in the external steel pipe.
3.2.2. Calculation of Induced Potential Distribution for Steel Tubes of Power Umbilical Cables
Based on the existing magnetic field distribution of the conductor cores, it was observed that the magnetic field exhibited a sinusoidal periodic distribution. Similarly, the induced potentials at the steel pipe exhibited the same characteristics. Through three-dimensional finite element simulation of the three-core umbilical cable, the induced potential distribution generated by the conductor cores in the steel pipe under the condition of the minimum repeating unit is shown in Figure 11, and the potential distribution curve along the axis of the steel pipe is depicted in Figure 12.
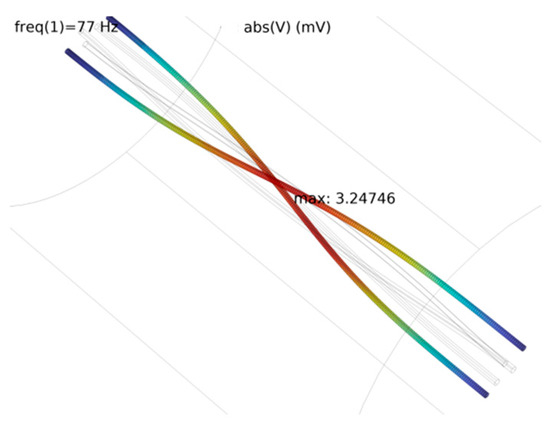
Figure 11.
Cloud diagram of electric potential distribution of steel tube.
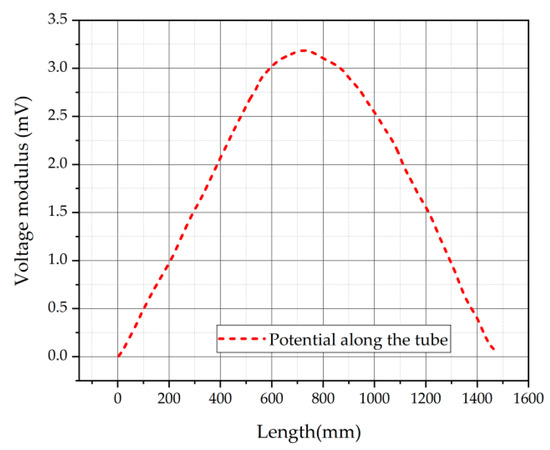
Figure 12.
Potential distribution curve of steel tube.
When analyzing Figure 11 and Figure 12 together, it can be seen that at the midpoint of the steel pipe’s twisting cycle, the induced potential reached its maximum value of 3.24 mV. From this maximum point, the induced potential symmetrically decreased along the axis in both directions; at a distance of 300 mm from the maximum point, the induced potential dropped to 2.53 mV, and at 500 mm from the maximum point, it further decreased to 1.12 mV. The induced potential continued to decrease until it reached 0 mV at both the beginning and end of the twisting cycle.
Upon analysis, during the normal operation of the umbilical cable, the conductor cores carrying AC currents generated an induced magnetic field. This magnetic field induced periodic variations in the induced potential on the metal structures (specifically on the surface of the steel pipe), which under the influence of seawater, induced currents which led to electrochemical corrosion. The simulation results confirm that the region with the maximum induced potential on the surface of the steel pipe at the midpoint of its twisting cycle is more susceptible to electrochemical corrosion. In contrast, the beginning and end segments of the twisting cycle are less prone to electrochemical corrosion.
4. Discussion
4.1. AC Electrochemical Corrosion Mechanism
During operation of the umbilical cable, if electrical breakdown or stress failure occurs within the insulation, then the outer insulation sheath of the steel pipe can develop varying sizes of pores. The exposed metal parts of the steel pipe in seawater generate induced voltages, causing alternating current to flow in the seawater and leading to situations of AC electrochemical corrosion. Corrosion can be classified into general corrosion and localized corrosion. General corrosion typically occurs naturally on the surface of the steel pipe, progressing from the outside inward with a larger corrosion area and slower corrosion rate. Localized corrosion, on the other hand, involves the holes in the outer insulation sheath of the steel pipe, creating small contact areas between the steel pipe and seawater. This localized contact area experiences electrochemical corrosion within the hole’s confines, resulting in a smaller corrosion area and lower current density required for corrosion, which can more easily lead to damage to the cable structure. Localized corrosion phenomena are also more common. Therefore, analysis of localized AC electrochemical corrosion on the surface of an umbilical cable’s steel pipe is the focal point of this study [21,22].
Seawater is mostly neutral or alkaline. The AC electrochemical corrosion process for the umbilical cable’s steel pipe surface is shown below. In the positive half-cycle of the AC current, iron atoms quickly lose electrons and oxidize. The role of dissolved oxygen is to form a passivation film. The negative half-cycle of the water reduction reaction occurs, resulting in hydrogen ions and hydroxide ions. In the role of hydrogen, the passivation film gradually transforms into a porous rust layer [23,24,25]. The formulae are as follows.
- Positive half-cycle:
- Negative half-cycle:
In Figure 13, RΩ consists of two parts: the liquid equivalent resistance Rchannel in the pore and the liquid equivalent resistance Rspread outside the void, as shown in Equation (18):
In Equation (18), Rchannel is the equivalent resistance of the liquid in the pore, Rspread is the equivalent resistance of the liquid outside the pore, t is the insulation thickness of the steel tube, σ is the seawater conductivity, and A is the pore area.
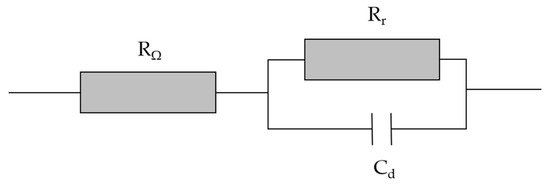
Figure 13.
Equivalent circuit diagram for polarization of double layer interface.
The equivalent impedance consisting of Rr and Cd is used to describe the polarization process at the reaction interface, and the presence of the polarization equivalent impedance is considered to reduce the current density flowing through the pores to some extent. Thus, it was usually ignored during the relatively conservative calculations in this paper. If the current density calculated when the polarization equivalent impedance was neglected was not sufficient to cause AC electrochemical corrosion, then it was considered that taking the polarization equivalent impedance into account was also not sufficient to cause AC electrochemical corrosion.
It was assumed that the induced potential of the largest part of the steel tube insulation appeared as a pore, where the pore radius was r, and at the same time, according to the derivation of Equation (18) to obtain Equation (19), the current density size inside the pore was calculated. Equation (19) is shown below:
In Equation (19), J is the current density inside the pore (in A/mm2); I is the current size inside the pore (in A); and U is the value of the induced voltage of the oil-filled steel pipe (in V).
4.2. Factors Affecting Power Umbilical Cable Steel Tube Current Density
Due to the three-core umbilical cable studied in this paper being mainly deployed in the East China Sea, where the seawater conductivity is approximately 2.5 S/m, according to this conductivity parameter, and when assuming a steel tube insulation pore radius of 1 × 10⁻⁴ mm (approximately the size of water trees or electrical tree branches), the current density inside the pores was only 0.3 A/m2.
To obtain comprehensive results on the AC electrochemical corrosion behavior of the three-core umbilical cable studied in this paper, Equations (18) and (19) were combined to calculate the internal current density (in J) within pore radii ranging from 1 × 10⁻⁴ mm to 5 mm and seawater conductivities ranging from 2.5 S/m to 5.5 S/m. The variation in pore current density with the pore radius under different seawater conductivities is depicted in Figure 14.
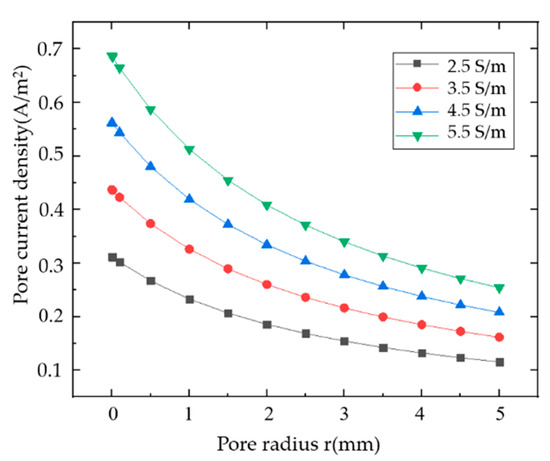
Figure 14.
Pore current density versus pore radius for different seawater conductivity radii.
Based on the analysis from Figure 14, combined with Equations (16) and (17), it is evident that under the same seawater conductivity conditions, a smaller radius for the insulation pores in the steel tube resulted in higher internal current densities within the insulation pores, thereby increasing the likelihood of AC electrochemical corrosion. This effect was particularly pronounced within the range of pore radii from 1 × 10⁻⁴ mm to 1 mm. As seawater conductivity increased, the internal current density within the steel tube’s insulation pores also increased. In this study, for the three-core umbilical cable, when the insulation pore radius was 1 × 10⁻⁴ mm and the seawater conductivity was 5.5 S/m, the maximum pore current density was 0.69 A/m2. This value, however, remains significantly below the threshold of 20 A/m2, beyond which AC electrochemical corrosion is likely to occur. This finding indicates that under the normal operating conditions studied in this paper, where the conductor cores carried 151 A of AC current, there was no occurrence of AC electrochemical corrosion on the steel tube’s surface.
4.3. Effect of Different Pitches and AC Frequencies on Current Density of Steel Tubes
The induced current density in the steel pipe of the umbilical cable correlates positively with the induced voltage. Changes in the twisting configuration of the internal metal structures of a cable can impact the induced voltage in the steel pipe. Additionally, as the AC frequency increases, the corrosion potential offset and amplitude of fluctuation decrease, resulting in a reduction in the magnitude of the voltage induced in the steel pipe of an umbilical cable. Therefore, in this section, while assuming seawater conductivity of 2.5 S/m and an insulation pore radius of 1 × 10⁻⁴ mm for the steel tube, a finite element simulation was employed to calculate the induced voltages at frequencies of 50 Hz and 60 Hz within the range of minimum repeat units from 0.72 m to 1.44 m. This approach helped to determine the effects of the twisting pitch and AC frequency variations on the current density of the steel pipe of the umbilical cable. The variation curves for the voltage induced in the steel pipe under different twisting pitches are shown in Figure 15.
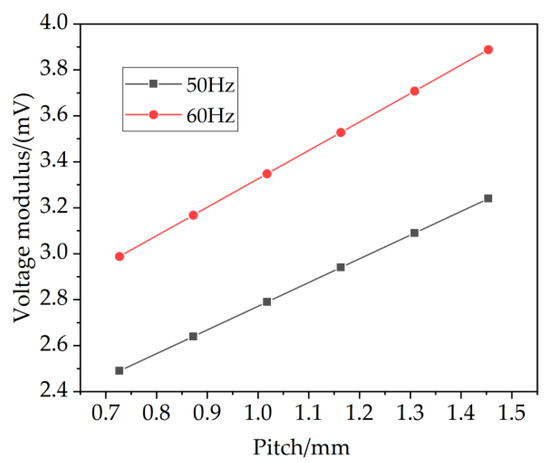
Figure 15.
Variation curve of maximum value of induced voltage of steel pipe with different pitches and AC frequencies.
Figure 15 shows that the maximum induced voltage in the steel pipe was positively correlated with the cable pitch (i.e., the minimum repeating unit). When the minimum repeating unit was 0.72 m, the maximum induced voltage in the steel pipe was only 2.49 mV. As the minimum repeating unit increased to 1.44 m, the maximum induced voltage in the steel pipe increased to 3.24 mV. When the AC frequency increased from 50 Hz to 60 Hz, the maximum induced voltage in the steel pipe increased by approximately 1.2 times, proportional to the increase in the AC frequency. Based on the induced voltage values in the steel pipe shown in Figure 12, combined with Equation (17), the curve of the pore current density in the steel pipe at different pitches was calculated, and it is shown in Figure 16.
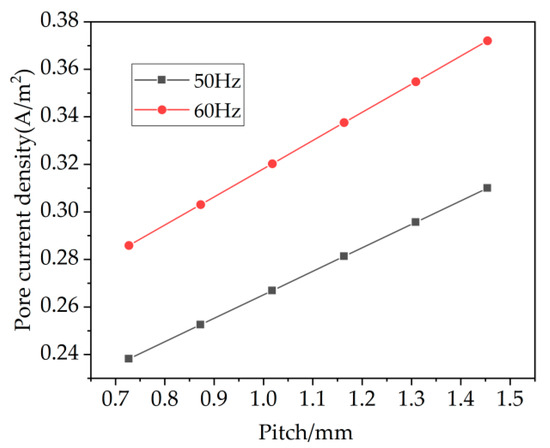
Figure 16.
Variation curve of maximum value of pore current density of steel pipe with different pitches.
Figure 16 shows that the maximum pore current density in the steel pipe was positively correlated with the cable pitch (i.e., the minimum repeating unit). When the minimum repeating unit was 0.72 m, the maximum pore current density in the steel pipe was 0.24 A/m2. As the minimum repeating unit increased to 1.44 m, the maximum pore current density in the steel pipe increased to 0.31 A/m2. When the AC frequency increased from 50 Hz to 60 Hz, the maximum pore current density in the steel pipe increased by approximately 1.2 times. Analysis indicates that the maximum pore current density in the steel pipe was positively correlated with both the cable pitch and the AC frequency. This is because as the cable pitch and AC frequency increased, the maximum periodic voltage in the conductor core increased, resulting in a higher induced voltage in the steel pipe and, consequently, an increase in the pore current density in the steel pipe.
5. Conclusions
In this article, based on the complex metal structure inside an umbilical cable, for determining the ease of leading to electrochemical corrosion of the surface of the steel pipe through the conductor core with AC current, the induced potential on the surface of the steel pipe was analyzed, the distribution of the induced potential on the surface of the steel pipe was obtained through finite element simulation, and the change in the current density inside the steel pipe’s insulation aperture with different pipe insulation aperture radii and different seawater conductivities was analyzed. The following conclusions were obtained:
(1) Influenced by the torsional offset effect between the conductor core and the steel pipe inside the umbilical cable, the induced voltage on the surface of the steel pipe had a periodic change, and at the same time, with the help of the microelement idea, the length of the period of change in the induced potential (i.e., the smallest repeating unit of the electromagnetic significance) of the conductor core and the steel pipe under different stranding methods was investigated, and the method of calculation of the induced potential for the steel pipe of the umbilical cable was optimized.
(2) At a frequency of 77 Hz, amplitude of 151 A, three-phase AC current load, and conductor core magnetic flux density maximum value of 1.17 × 10⁻⁵ T, the maximum value of the magnetic flux density of the steel pipe area was 1.13 × 10⁻⁶ T. At the same time, the steel pipe surface’s induced potential was in accordance with the electromagnetic significance of the smallest repeating unit length of the cyclic changes. The calculation of the induced potential of the maximum value of 3.24 mV could be carried out according to the induction potential. The maximum value of the induced potential can be determined according to the region of the induced potential to determine the most likely location of electrochemical corrosion inside an umbilical cable.
(3) In local electrochemical corrosion, the value of the current density inside the insulating pores is affected by the radius of the insulating pores and the conductivity of seawater, in which a decrease in the insulating pores’ radius and an increase in seawater conductivity will lead to an increase in the current density inside the pores, and at the same time, it is known that the power umbilical cable in this article will not occur under the operating conditions of an AC current with a frequency of 77 Hz and an amplitude of 151 A. At the same time, through finite element simulation calculations, it is known that with an increase in the cable pitch and AC frequency, the pore current density of the steel pipe increases.
Author Contributions
Conceptualization, J.Y. and P.S.; methodology, P.S.; software, H.L. and P.P.; validation, Q.S. and Z.L.; formal analysis, P.S.; investigation, Q.S.; resources, J.Y.; data curation, H.L.; writing—original draft preparation, Z.L.; writing—review and editing, Q.S. and Z.L.; visualization, J.Y.; supervision, H.L.; project administration, H.L.; funding acquisition, J.Y. All authors have read and agreed to the published version of the manuscript.
Funding
This research received no external funding.
Data Availability Statement
No new data were created.
Conflicts of Interest
Authors Pengjin Shao, Haijun Li and Pan Pan are employed by Zhongtian Technology Submarine Cables Co., Ltd. The remaining authors declare that the research was conducted in the absence of any commercial or financial relationships that could be construed as a potential conflict of interest.
References
- Guo, H.; Li, Y.; Zheng, L.J.; Yan, J.; Zhang, Q.; Xu, Q. Development of open umbilical structure integrated aided design analysis software platform. Shipbuild. China 2022, 63, 224–236. [Google Scholar]
- Cai, R.; Yang, S. Analysis and Calculation of Crosstalk for Twisted Communication Cables in Umbilical Cable. Energies 2022, 15, 3501. [Google Scholar] [CrossRef]
- Gao, H.; Guo, H.; Sun, K.F.; Qu, Y.; Guo, Y.; Li, B. Preliminary Physical Design of Subsea Umbilical Cable for Production System. Wire Cable 2011, 6, 12–16. [Google Scholar]
- Li, Y.J.; Han, Y.S.; Pang, J.J.; Jin, D.; Sun, Y.L.; Li, Z.H. Electric Field Assist on Enhancing the Electrical Breakdown Strength of Cross-Linked Polyethylene for Power Cable Insulation. Macromolecules 2024, 57, 5497–5506. [Google Scholar] [CrossRef]
- Li, Y.J.; Han, Y.S.; Sun, Y.L.; Li, Z.H. Characterization of Migration Behavior of Organic Electric-field Regulator in Polyethylene Composite Based On the Synchronous Spectra of Space Charge and Polarization Current. Compos. Sci. Technol. 2024, 247, 110437. [Google Scholar] [CrossRef]
- Dieumegard, C.; Fellows, P. Installation of metallic tube umbilicals in 3000 meters water. In Proceedings of the Offshore Technology Conference, Houston, TX, USA, 5–8 May 2003. [Google Scholar]
- Sara, G.; Lazzari, L.; Ormellese, M. AC corrosion. Part 2: Parameters influencing corrosion rate. Corros. Sci. 2010, 52, 916–922. [Google Scholar]
- Wang, X.H.; Song, X.T.; Chen, Y.C.; Wang, Z.Q.; Zhang, L.W. Corrosion Behavior of X70 and X80 tubeline Steels in Simulated Soil Solution. Int. J. Electrochem. Sci. 2018, 13, 6436–6450. [Google Scholar] [CrossRef]
- Qin, Q.Y.; Wei, B.X.; Bai, Y.L.; Qi, F.; Jin, X.; Cheng, S. Effect of alternating current frequency on corrosion behavior of X80 pipeline steel in coastal saline soil. Eng. Fail. Anal. 2021, 120, 105065. [Google Scholar] [CrossRef]
- Wang, H.R.; Du, C.W.; Liu, Z.Y.; Wang, L.T.; De, D. Effect of alternating current on the cathodic protection and interface structure of X80 steel. Materials 2017, 10, 851. [Google Scholar] [CrossRef]
- Guo, A.L.; Zheng, J.Z. Detection, Evaluation and Preventive Measures of Stray Current Interference of Product Oil tubelines in Hunan. Oil-Gas Field Surf. Eng. 2018, 37, 77–81. [Google Scholar]
- Moravcik, I.; Peighambardoust, N.S. Interstitial nitrogen enhances corrosion resistance of an equiatomic CoCrNi medium-entropy alloy in sulfuric acid solution. Mater. Charact. 2021, 172, 110869. [Google Scholar] [CrossRef]
- Bjørn, G.; Martin, H.; Marius, H.; Steinar, M. Voltages and AC Corrosion on Metallic Tubes in Umbilical Cables Caused by Magnetic Induction From Power Cable Charging Currents. IEEE Trans. Power Deliv. 2019, 34, 596–605. [Google Scholar]
- Ouadah, M.; Ziouche, A.; Omar, T.; Ibtiouen, R.; Bouyegsh, S.; Charif, D. AC Corrosion Induced by High Voltage Power Line on Cathodically Protected Pipeline. In International Conference on Control, Engineering & Information Technology; Research Gate: Sousse, Tunisia, 2014. [Google Scholar]
- Zanotto, F.; Grassi, V.; Balbo, A.; Monticelli, C.; Zucchi, F. Stress-Corrosion Cracking Behaviour of Lean-Duplex Stainless Steels in Chloride/Thiosulphate Environments. Metals 2018, 8, 237. [Google Scholar] [CrossRef]
- Muralidharan, S.; Kim, D.; Ha, T.; Bae, J.; Ha, Y.; Lee, H.; Scantlebury, J. Influence of alternating, direct and superimposed alternating and direct current on the corrosion of mild steel in marine environments. Desalination 2007, 216, 103–115. [Google Scholar] [CrossRef]
- Huang, X.Y.; Zhou, L.; Li, Y.K. The synergistic effect of temperature, H2S/CO2 partial pressure and stress toward corrosion of X80 pipeline steel. Eng. Fail. Anal. 2023, 146, 107079. [Google Scholar] [CrossRef]
- Liu, L.Y.; Wen, X.R.; Shi, R.C.; Li, P.; Wen, Y.M.; Han, T. High-efficiency magnetic field energy harvesting from a three-core cable. Sens. Actuators A Phys. 2023, 360, 114501. [Google Scholar] [CrossRef]
- Li, X.; Zhang, H.Z.; Zhang, X.; Liu, S.G.; Yao, S.J. Electromagnetic interference and corrosion on the buried metal oil and gas tubelines caused by the high voltage AC transmission lines and protection measures. J. Shandong Univ. Technol. 2017, 31, 65–70. [Google Scholar]
- Gao, J.G.; Yu, P.L.; Li, Z.Y.; Zhang, X.H.; Liu, T.; Liu, Z.H. Simulation Analysis of Induced Voltage on Metal Sheath of Power Cable Based on Finite Element Method. High Volt. Eng. 2014, 40, 714–720. [Google Scholar]
- Bremnes, J.J.; Evebset, G.; Stolan, R. Power loss and inductance of steel armoured multi-core cables: Comparison of IEC values with “2,5D” FEA results and measurements. In Cigre Session; CIGRE: London, UK, 2010. [Google Scholar]
- Wang, X.H.; Xu, C.; Chen, Y.C.; Tu, C.Y.; Wang, Z.Q.; Song, X.T. Effects of stray AC on corrosion of 3-layer polyethylene coated X70 tubeline steel and cathodic delamination of coating with defects in 3.5 wt% NaCl solution. Corros. Eng. Sci. Technol. 2018, 53, 214–225. [Google Scholar] [CrossRef]
- Zhang, S.X.; Li, Z.L.; Yang, C.; Gou, J.X. The AC corrosion mechanisms and models-A review. Corrosion 2019, 76, 188–201. [Google Scholar] [CrossRef]
- Zhu, M.; Du, C.W.; Li, X.G.; Liu, Z.Y.; Wu, X.G. Effect of AC on corrosion behavior of X80 tubeline steel in high pH solution. Mater. Corros. 2015, 66, 486–493. [Google Scholar] [CrossRef]
- Berkowitz, B.J.; Horowitz, H.H. The Role of in the Corrosion and Hydrogen Embrittlement of Steel. J. Electrochem. Soc. 1982, 129, 468–474. [Google Scholar] [CrossRef]
Disclaimer/Publisher’s Note: The statements, opinions and data contained in all publications are solely those of the individual author(s) and contributor(s) and not of MDPI and/or the editor(s). MDPI and/or the editor(s) disclaim responsibility for any injury to people or property resulting from any ideas, methods, instructions or products referred to in the content. |
© 2024 by the authors. Licensee MDPI, Basel, Switzerland. This article is an open access article distributed under the terms and conditions of the Creative Commons Attribution (CC BY) license (https://creativecommons.org/licenses/by/4.0/).