Abstract
Nowadays, almost all countries in the world are intensifying their search for locally available energy sources to become independent of external supplies. The production of alternative fuels from biomass and waste by thermal treatment or direct use in the combustion process is still the simplest method for fast and cheap heat production. However, the different characteristics of these fuels can cause problems in the operation of the plants, resulting in increased air pollution. Therefore, the analysis of the thermal treatment of solid fuels is still an important issue from a practical point of view. This work aimed to study biomass combustion in a small-scale reactor using the in-house Extended DEM (XDEM) method based on mixed Lagrangian–Eulerian approaches. This was provided by a novel, independently developed coupling computational interface. This interface allows for a seamless integration between CFD and DEM, improving computational efficiency and accuracy. In addition, significant advances have been made in the underlying physical models. Within the DEM framework, each particle undergoes the thermochemical processes, allowing for the prediction of its shape and structural changes during heating. Together, these changes contribute to a more robust and reliable simulation tool capable of providing detailed insights into complex multi-phase flows and granular material behavior. Numerical results were obtained for a non-typical geometry to check the influence of the walls on the distribution of the parameters in the reactor. The results show that XDEM is a very good tool for predicting the phenomena during the thermal treatment of solid fuels. In particular, it provides information about all the moving particles undergoing chemical reactions, which is very difficult to obtain from measurements.
1. Introduction
The current energy crisis in Europe, related to the war in Ukraine, has forced countries around the world to intensify the search for new energy sources that will make them independent of external supplies of fossil fuels. The use of local biomass and waste fuels in the combustion process is still the simplest method of quick and cheap heat production, as well as the best way to reduce emissions into the atmosphere, which is still of high importance in the context of environmental protection and climate policy. In Poland, as well as in other Central European countries, the permissible level of suspended dust is still exceeded, including the most dangerous PM 2.5, which contributes to an increase in the incidence of lung cancer and, consequently, is a source of premature death. Suspended dust is smog floating not only over large agglomerations but also in less populated areas where the only source of energy is the cheapest fossil fuel and other types of municipal waste, which should not be disposed of by domestic heating units. Especially during months with low air temperatures, increased dust concentrations in the atmosphere and unfavorable wind conditions significantly affect the quality of the air we breathe. The different physical and chemical properties of agriculture and municipal waste-type biomass, depending on their origin, may cause operational problems in units not adapted to the simultaneous combustion of different types of fuels. In the case of using a waste type of fuel as a heating source, the proper operational conditions of the units are very important to make the combustion process as efficient as it is possible with low particulate matter emissions at the same time.
Additionally, the small-scale gasification process may become a new branch of the distributed production of alternative fuels for personal use. The success condition, of course, is to obtain clean liquid, gaseous, or solid fuels but it is possible only under properly managed and strictly defined operational conditions of the reactors. Therefore, the analysis of the oxidation process of various types of solid fuels, especially biogenic types, is still an important issue, not only from a practical but also from a scientific point of view. The new alternative fuels and, above all, the mixing of different types as a source in the energy conversion units bring new technological challenges, related in particular to the life cycle of the equipment and improving the efficiency of the conversion of chemical energy into heat or electricity. Many aspects should be taken into account during the analysis of combustion processes in fixed and moving beds. The most important one is the influence of the process of operational conditions on the oxidation/gasification products, as well as the type of raw material and the granular particle sizes. In addition to experimental methods, which are among the most reliable in gaining knowledge and analyzing phenomena occurring during the thermal treatment of solid fuels, numerical simulations also play an important role. Computational fluid dynamics (CFD) supported by a numerical particle tracking method, which is properly validated, can replace tests on real units and provide knowledge of phenomena that are often impossible to measure or visualize. It is especially useful for the analysis of the combustion or gasification processes of biomass when different types of agricultural wastes are utilized for the production of heat and energy. The variety of physical properties depending on the source of origin influence the yields of the products; thus, the operation of the heating unit may be complex and difficult. Moreover, in the case of pulverized or fluidized combustion, the engineers are not able to measure the behavior of each combustible and carried phase particle; thus, such kind of software allows for gaining knowledge about some restricted areas, for example, re-circulation or particle agglomeration zones. An analysis of the flow can be used for the units’ geometry optimization to obtain more efficient and more environmentally friendly processes. Such analysis can be provided to both domestic small-scale facilities and industrial large-scale systems.
Many existing studies lack robust coupling between the different phases involved in combustion processes. While some studies use Eulerian–Lagrangian coupling, they often do not adequately capture the complex interactions between particles and the fluid phase, especially under varying thermal conditions. The physical models used to simulate particle behavior during combustion are often simplified. For example, the drag and collision models may not fully account for changes in particle properties such as size, shape, and material composition. When considering the use of waste or the thermal treatment of different types of biomass, it is important to properly model the chemical reactions that occur during combustion. This includes particle oxidation, formation of intermediate species, and heat release, which are critical for the accurate prediction of particle behavior and overall process dynamics. There is also a lack of comprehensive experimental data to validate simulation results. Many studies are based on limited or idealized experimental setups that do not capture the full range of conditions encountered in practical systems. Additionally, many simulations do not adequately consider all heat transfer mechanisms, such as conduction, convection, and radiation. Neglecting any one of these mechanisms can lead to inaccurate predictions of temperature distributions and, consequently, cause errors or inadequate solutions to particle behavior. In addition, the time-dependent behavior of particles during combustion, including changes in particle size due to defragmentation or oxidation, and their agglomeration, is often not fully captured. This dynamic behavior is critical for understanding the evolution of the oxidation process. Studies often use simplified boundary conditions and do not take into account the complex flow regimes that can occur in practical/industrial systems. These simplifications can lead to discrepancies between the simulated and the real behaviors of the granular media.
More sophisticated physical and chemical models need to be developed to fill these gaps. This requires the coupling of experimentally validated multiphase interactions. The innovative approach presented in this paper aims to overcome some of these challenges by using complex models to provide a more accurate and comprehensive understanding of biomass fuel-type particle behavior during heating.
2. Coupled CFD-DEM Computations
In the literature, there are many works related to the numerical modeling of particles’ motion in a surrounding fluid. These are methods based on coupled CFD-DEM computations, which are commonly used in all scientific topics regarding the two-phase solid-fuel flows.
The most popular commercial and non-commercial software takes into account two types of Eulerian–Lagrangian approaches to predict the movement of particles in a surrounding fluid. One is the Discrete Particle Model (DPM) [1] based on hard-sphere modeling where binary collisions with no particle overlap are taken into account. Such a situation takes place in dilute systems. The second one is the Discrete Element Method (DEM), which includes a soft-particle approach with multiple collisions and the possibility of particles overlapping [2,3]. Here, the dense granular media is considered. The DPM method is commonly used for the simulation of pulverized fuel or fluidized bed combustion [4,5] as well as the gasification processes [6]. For predicting the behavior of a group of particles in heating devices, the cold two-phase flow simulations can be used. Cold simulations help in understanding the fundamental hydrodynamic behavior of particles and fluid without the complexity introduced by thermal effects. This includes studying particle trajectories, fluid flow patterns, and interaction forces. It is very useful for predicting the particles’ movement and their accumulation zones in heating unit areas that result from the fluid–particle interaction in the flow. The authors of the work [7] studied the influence of the particle shape on the mixing phenomenon. They showed that in this case, the particle orientation parameter is extremely important for capturing particle mixing and segregation zones.
Recently, the software called Rocky has gained popularity in the area of numerical simulation. It runs with the well-known commercial software Ansys Fluent Solution Workspace 2023 R2 [8], for which the CFD (Fluent) and DEM (Rocky) solvers run on two separate nodes. Once the CFD and DEM are initialized, the CFD solver sends data on the physical properties of the fluid (e.g., pressure and velocity) to the DEM, which tracks particle positions based on flow parameters. Then, from the DEM, data on the positions and forces of the particle’s interaction with the fluid are passed to the CFD solver, and the solid phase information is updated. Zhou et al. [9] used Rocky software to predict the behavior of particles in the fluidization process, which is often involved in biomass combustion. To exchange the data between the CFD and DEM solver, authors used a message-passing interface (API). They took into account non-spherical particles (capsules) and spherical ones as pulverized biomass fuels with mean diameters varying from 2 to 5 mm. Numerical simulations of moving particles were verified with experiments with high-speed photography. The significant differences in the fluidization characteristics of different-shaped particles were shown. The authors did not take into account heat transfer between the gas of fluid flow, considering only cold flow. A similar method was used by Yu et al. [10]. By introducing a vertical seepage flow through the soil assembly, the authors simulated the suffusion process of gap-graded soils. The main assumptions were the same: the authors used the CFD tool (OpenFOAM) for cold flow and the DEM (LIGGGHTS) method for particle motion. The particles were spherical with diameters ranging from 0.5 to 2.5 mm. Cold flow but with much smaller particles was also analyzed by Raza et al. [11]. The authors studied the hydrodynamics of the gas–solid flow carried out using different designs of air distributor plates mounted in bubbling fluidized bed gasifiers to intensify the mixing processes. The average sand particles had an average diameter in the range of 250–850 μm. The bubbling fluidized bed was investigated by Zhou et al. [12]. The authors used the CFD-DEM numerical method for predicting the behavior of the cold gas–solid two-phase flow of coarse particles with diameters in the range of 2.5–3.5 mm. They validated the numerical results with high-speed photographic experiments and showed that the presented method could serve for the design of fluidized beds, especially for biomass or chemical looping combustion applications with coarse particles. Different particle shapes were considered during the simulation of the solid fuel particle movement by Ma et al. [13]. The authors studied the distribution of real-shape particles in a blast furnace. The DEM approaches using a multi-sphere model, polyhedral model, and super-ellipsoid model for particle shape were adopted. The numerical computations were compared with the experiments performed using non-spherical quartz sand particles in a lab-scale, bell-less top blast furnace. The authors showed that using advanced shape models gives a reasonable accuracy and efficiency of numerical solutions but has a higher level of computational power costs. Nevertheless, using cold two-phase flow simulations coupled with DEM can be a good tool for designing or reconstructing existing geometry for improving the thermal efficiency of devices, as was shown in the work of Li et al. [14]. Similar work was carried out by Gao et al. [15], where the presented analysis focused on studying the size characteristics and mechanical properties of the industrial-scale blast furnace raceway. Here, the authors considered the same size coke particles (with diameter of 40 mm) without accounting for thermal conditions.
Spherical particles undergoing chemical reactions were considered by Wang et al. [16]. The authors used coupled CFD-DEM modeling for the prediction of the pyrolysis process of different types of dry solid fuels in a fixed-bed reactor. They performed the simulations via open source code called MFix [17]. The particles with initial average diameters of 10 mm were losing mass during heating. It appeared that depending on the type of material, the final particle size was reduced by up to twice. No radiative heat transfer was taken into account in this research.
Ku et al. [18] simulated the biomass gasification process in a fluidized bed reactor. They also used coupled CFD-DEM methods including variable physical and thermochemical properties of the particles. Additionally, the authors took into account the hydrodynamics of dense gas–particle flow in fluidized beds, turbulence, collisions, heat and mass transfer, radiation, particle shrinkage, and homogeneous and heterogeneous chemical reactions occurring during the gasification of biomass with steam as an oxidizer. The considered particle diameter was 1.5 mm. Open source code OpenFOAM (CFD) for the fluid phase was used with implemented sources resulting from particle tracking (DEM) [19]. The authors emphasized that simulations can play an important role in the multi-scale modeling of biomass combustion or gasification in fluidized bed reactors.
Rosser et al. [20] used STAR-CCM+ software for CFD-DEM modeling to study the impact of ore pellet moisture, heating, and ice formation between pellets on the jamming event in a hopper above the furnace. This work was not directly connected to combustion processes, but the authors were using an additional energy equation for the solid particle for calculating particle temperature changes due to external conditions.
As it has been shown, the coupled CFD-DEM simulations can have an important impact on analyzing the solid fuel combustion process with the prediction of the trajectory of each particle during heating in a fixed or moving bed. Due to the two-way coupling in CFD-DEM, very valuable pieces of information concerning each particle’s shape and structural change as a result of thermochemical reactions can be obtained. Of course, the more information we need, the more complex the mathematical model that has to be taken into account, considering that they are connected to the computational requirements and time needed to have a converged and stable solution.
The goal of this work was to investigate the possibility of using the XDEM (eXtended Discrete Element Method) program to predict the behavior of biomass wood particles during the oxidation process in small-scale reactors. For this purpose, the original numerical method was used. The proposed software includes mixed Lagrangian–Eulerian approaches to predict the behavior of granular materials in an external fluid field. The CFD combined with DEM allows for predicting the movement of solid fuel particles in an external fluid field, and Extended DEM (XDEM) also allows for obtaining information about their thermal conversion including structural changes.
3. Thermal Conversion of Biomass
The typical thermochemical process of biomass in a fixed-bed gasifier starts with drying, where moisture is released from the fuel [21]. In the next step, called pyrolysis, the volatile components are released and char is produced. This stage takes place in the absence of oxygen when the internal energy of the fuel is increased by heat transfer from the surrounding hot gas. In the main gasification phase, the volatile gas mixture from the pyrolysis stage is mixed with air and combusted to and . In the reduction zone, the char reacts with and to form a combustible gas in the absence of oxygen. The most important factors determining the composition and quality of the synthesis gas are the process temperature and the amount of air/oxidant supplied [21,22]. In the case of combustion, an excess of air is supplied to the system to oxidize both the pyrolysis gases and the char formed. Knowledge and understanding of each of these phenomena allow for a better understanding of the whole process. This also allows for a better design, better operating parameters, and, ultimately, better efficiency of energy conversion in the reactors. Not all issues can be analyzed from an experimental point of view. In order to obtain all the necessary information on the conversion and movement of each particle in the reactor, it was decided to use numerical simulations, carried out by combining CFD with the DEM method.
4. XDEM Method
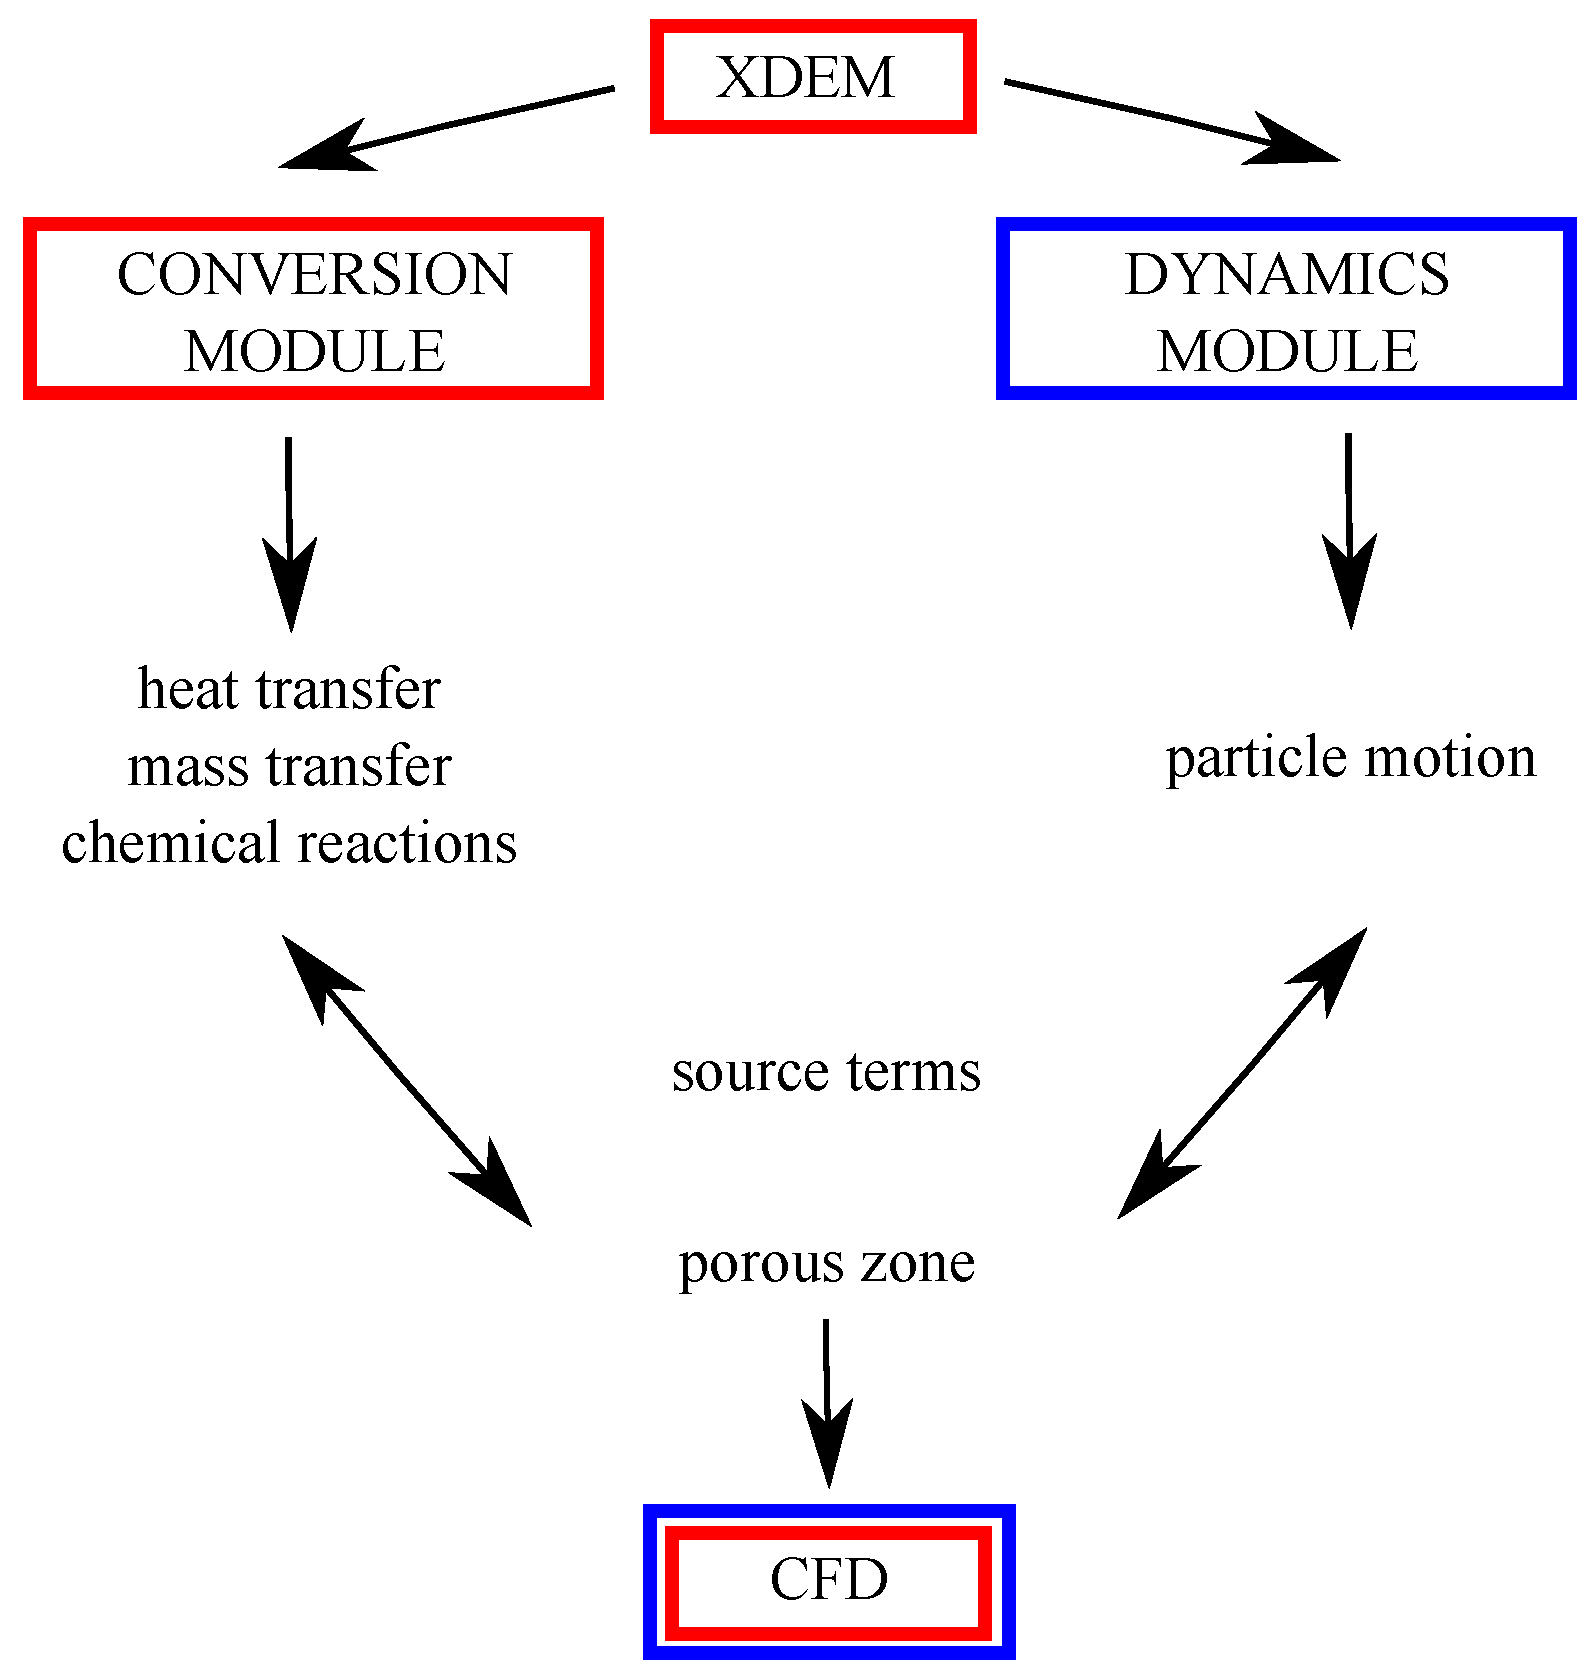
The XDEM method was developed by the team of Prof. Peters from Luxembourg University, and it aims at predicting the behavior of granular materials during various processes the particles undergo, e.g., oxidation, melting, mixing, or ash deposition [23,24,25,26,27,28,29,30,31,32]. The main assumption of numerical modeling is that each particle undergoes a sequence of thermodynamic processes described simultaneously by a set of one-dimensional and transient mass, momentum, and energy conservation equations using the Discrete Particle Method (DPM) to predict its motion [33,34]. XDEM is a numerical technique that practically extends the dynamics of particles described by the classical DEM and is used with commonly applied CFD for simulating flow through porous media (granular material as a group of particles). The main structure of the code is illustrated in Figure 1.
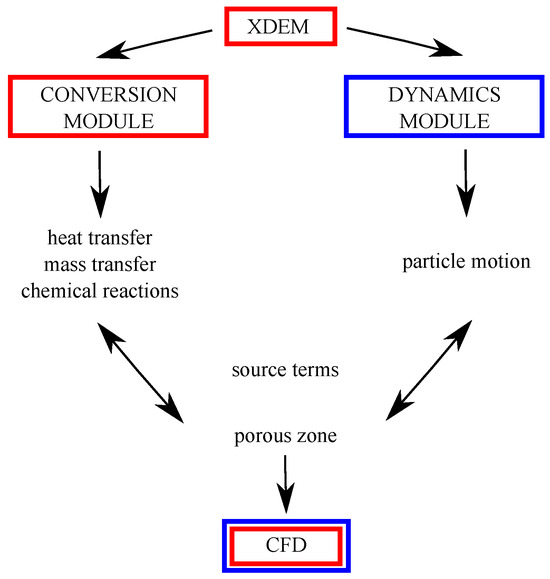
Figure 1.
Scheme of the XDEM coupling with CFD.
While the DEM predicts the position and orientation of each particle in space and time, the XDEM additionally estimates thermo-physical properties such as the internal temperature of the particle and its porosity and/or particle distribution or mechanical interaction with other bodies and shapes (walls, moving or stationary objects). The motion module of the DPM also includes some geometric shapes that are commonly used in a large range of engineering applications. This software can be used for analyzing the processes occurring in different areas of engineering applications, including furnaces for solid fuel combustion, and fluidized beds, with predictions of emissions from small- and large-scale reactors and heating units. The conversion module of the XDEM incorporates a physicochemical approach that describes temperature changes and the proceeding of chemical reaction for each particle in the system.
The coupling of XDEM and CFD is performed within the OpenFOAM source [35] and comes from the Lagrangian–Eulerian approach [34]. In Lagrangian modeling, the motion and transformation of particles are calculated based on one-dimensional and transient conservation equations that characterize the energy and mass transport within each particle. It is also assumed that each particle consists of different phases, i.e., liquid, solid, and gas. The last phase is transported by diffusion and convection within the particle pore space. All gaseous species are treated as ideal gases and the particles as isotropic materials whose properties can only vary along the radial direction. In addition, a local thermal equilibrium between the solid and gaseous species conditions is assumed within the particles. Heat transfer between neighboring particles can occur by conduction and radiation. Heat and mass transfer from the fluid to the particles is calculated by boundary conditions specified at the particle surface, with fluxes coming from both the surrounding gas and the heated particle. The required convective heat transfer coefficients are estimated from the semi-empirical correlation of the Nusselt number for monodispersed and naturally arranged packed beds [36]. Chemical reactions are modeled as equilibrium reactions for the species present. The motion module of XDEM predicts particle positions; thus, the reactor/furnace/boiler filling can also be calculated, taking into account natural gravity deposition.
Fluid flow is analyzed based on the Eulerian approach, which treats the fluid medium as a continuum. The particle bed is characterized as a type of porous media in which fluid flow is treated as an external flow. The fluid flow inside the free porous space is described by a three-dimensional Navier–Stokes, with energy equations for incompressible flow. Furthermore, Brinkmann or Forchheimer relations are used to model the drag. Heat and mass transfer from particle to fluid is performed via the source terms of the corresponding conservation equations.
4.1. Basic Equations for Dynamic Module
XDEM predicts both the dynamics and thermodynamics parameters of the discrete particle system. The position, velocity, and acceleration of each particle are calculated by the dynamics module of XDEM, while the temperature and other parameters describing the thermochemical processes (composition, mass, volume) are calculated by the conversion module of XDEM [37].
The dynamics module in the XDEM software uses DEM and is based on the soft sphere model, assuming that the particles are deformable and can overlap each other, where the amount of overlap is determined by the contact force obtained based on the force–displacement law. The hardness of the particle is expressed by Young’s modulus, while the energy dissipation of the particle is described by a damper and/or dashpot. The translational and rotational motions of individual particles are tracked using the equations of classical mechanics. For each particle transition motion, the following equation is used [31,37]:
where is a contact force, is the gravitational force, and the sum of all the external forces acting on the particle. The contact force of a particle is the sum of all normal and tangential collision forces generated while colliding with the neighboring bodies. All particular pieces of information may be found in [31]. The external forces are devoted in the case of porous media to the fluid surrounding the particle, and they are connected with buoyancy and drag. Buoyancy force in the surrounding fluid accounts for the pressure gradient around an individual particle, and it can be calculated from the following:
where is the fluid volume occupied by the particle. The drag force depends on the relative velocity of the solid particle () and fluid () along with the forces acting due to the presence of neighboring particles, and it is given as follows:
where is the interphase momentum exchange defined as a function of porosity and the physical properties of the fluid (dynamic viscosity , density ) and particle (its diameter ) [31,38]:
The drag coefficient in the above equation can be calculated from [31,38]
where the particle Reynolds number is related to the relative velocity and physical parameters of the fluid with particle diameter as a characteristic length scale:
Additionally, the rotational movement in the dynamic part of XDEM is considered, taking into account Newton’s Second Law for rotation, which describes the total torque on a particle as the particle’s moment of inertia about the rotation axis times its angular acceleration:
where is the particle moment of inertia, is the particle angular velocity, and are the torques [31,37,38].
4.2. Basic Equations for Conversion Module
In a conversion module of XDEM, each particle is treated as a 1D porous medium, where one privileged direction is dominant, and through which a gas mixture of different chemical compositions can flow. The mass conservation equation for gas flow within the porous medium can be written as follows:
where is the porosity of the particle, is the gas velocity in the privileged direction, and the source term denotes the mass transition from the solid to gas phase. The index n represents the particle geometry, which can have the form of an infinite plate (for ), infinite cylinder (for ), or a sphere (for ).
The transport of gaseous species within the particle’s pore space is considered to obey Darcy’s law:
where is pressure, is the dynamic viscosity, and is the permeability of the porous particle. Since each particle can go through thermochemical conversion, the mass balance of an individual i-th species within the pores of a given particle is considered:
where is the source term accounting for the consumption/production of species i from reaction k and is the molecular diffusion coefficient.
Assuming local equilibrium between the phases and taking into account that the particle can be considered as a 1D structure, where one privileged direction is dominant, the simplest form of energy conservation equation can be introduced:
Moreover, the negligible thermal mass of the gas phase compared to the liquid and solid phases results in simplification of the final form of the energy balance equation:
where is an effective thermal conductivity. The second term on the right-hand side is a source that represents the release or the consumption of heat resulting from the chemical reactions occurring in the reactive flow where is the enthalpy of reaction k.
To complete the mathematical model, initial and boundary conditions must be taken into account. Since considerable geometries of the particles are involved, a symmetric boundary condition is applied for the center of a particle:
and for the particle’s external surface, the following heat transfer and mass transfer of gaseous species are chosen:
where and are the heat and mass transfer coefficients, and and denote ambient gas temperature and gas partial density of species i in ambient gas, respectively. The term determines the exchange of species i-th with the ambient gas by advective transport past the particle’s surface. The heat fluxes on the right-hand side of Equation (15) account for radiative heat exchange with the surroundings:
where is the view factor between particle p and its neighbor j, and is Stefan–Boltzman constant. The conductive heat transport through physical contact with neighboring particles or walls can be expressed as follows:
where is the thermal conductivity of a material, for which subscript p denotes the actual particle, whereas subscript j refers to the neighboring particles or other connecting objects.
Transport coefficients, thermodynamic properties, and other properties are spatially resolved by accounting for their dependencies from temperature and pressure, and they are computed from an extensive database, including NASA polynomials for solid, liquid, and gaseous species [39].
5. Basic Equations for Fluid Flow
In the Eulerian approach, the conservation equation of mass is considered for a representative volume [40]:
where porosity refers to the gas void fraction and, according to the space occupied by the particles, can be obtained from the following formula:
in which represents the volume of a computational numerical cell, is the i-th particle volume in a numerical cell, and is the weight for the porosity calculation.
The momentum equation can be expressed as follows [41]:
where determines the source term introduced from the particle:
In the above equation, variables and are linear and angular accelerations, respectively, exerted by the particles on the considered control volume [40].
The energy balance equation for the fluid flow through the porous zone can be written as
where and are the average specific heat and thermal conductivity of the fluid mixture, respectively. These physical properties, together with the density, are calculated as volume-weighted averages of the phases present in the control volume considered. The term is the heat source introduced by the particle calculated by the XDEM module.
Due to the character of the solid fuel thermal decomposition, chemical reactions are also considered in the CFD solver. In a multicomponent gas mixture, the mass conservation equation for an i-th species can be written as follows:
To satisfy the total gas flow given by Equation (19), the following condition must be considered:
The XDEM thermodynamics module offers a variety of different reaction types that account for the chemical conversion of solid, liquid, and gaseous species taking place in a particle. The XDEM conversion module concerns different chemical reaction types [42]. In the analyzed case of the solid fuel particle oxidation, the finite rate and the irreversible n-molecule reaction type are taken into consideration.
Generally, the mathematical formula for the chemical reaction can be written as follows [43]:
where the summation to n concerns the reaction substrates R, whereas m corresponds to reaction products P, and represents the values of corresponding stoichiometric coefficients.
The reaction rate depends on species concentrations c:
but it may also be connected with temperature and available reaction surface.
Following a general heterogeneous reaction, the forward f and backward b reaction rates of a reversible reaction can be defined as follows:
Thus, if an irreversible reaction is considered (only in the forward direction), the reaction rate can be defined using the left-hand-side equation from the set of Equation (28). For this case, the Arrhenius law can be used to describe the reaction rate :
where is the so-called the frequency factor, is the activation energy, , is the universal gas constant, n is the temperature exponent, and is the activation temperature.
The coupling between the XDEM and CFD modules is organized by the source terms in the balance equations solved for the CFD module. The thermal interaction between particles (conduction, radiation) and between particles and their environment (conduction, convection) is solved by the DEM approach, while the continuous phases are solved by CFD. Thermal energy is transferred from fluid to particles and from particles to fluid and is specified by a heat source. The XDEM Conversion Module calculates the corresponding heat source value for each CFD cell depending on the properties of the particles within the specific cell. The gas phase is modeled in an Eulerian approach using Navier–Stokes equations considered for compressible fluid in porous media and implemented in the OpenFOAM open source code. The OpenFOAM solver used in this work is rhoPimpleFoam. This is a solver based on the flexible PIMPLE (PISO-SIMPLE) solution for time-resolved and pseudo-transient simulations using the under-relaxation equation, which ensures convergence of all equations at each time step.
In this study, the presented coupled CFD-DEM approach is used to simulate the thermochemical conversion of biomass solid fuel in the small-scale reactors with an emphasis on the analysis of the possibility of using such type of software to acquire the knowledge of each particular step of the described process.
6. Small-Scale Reactors
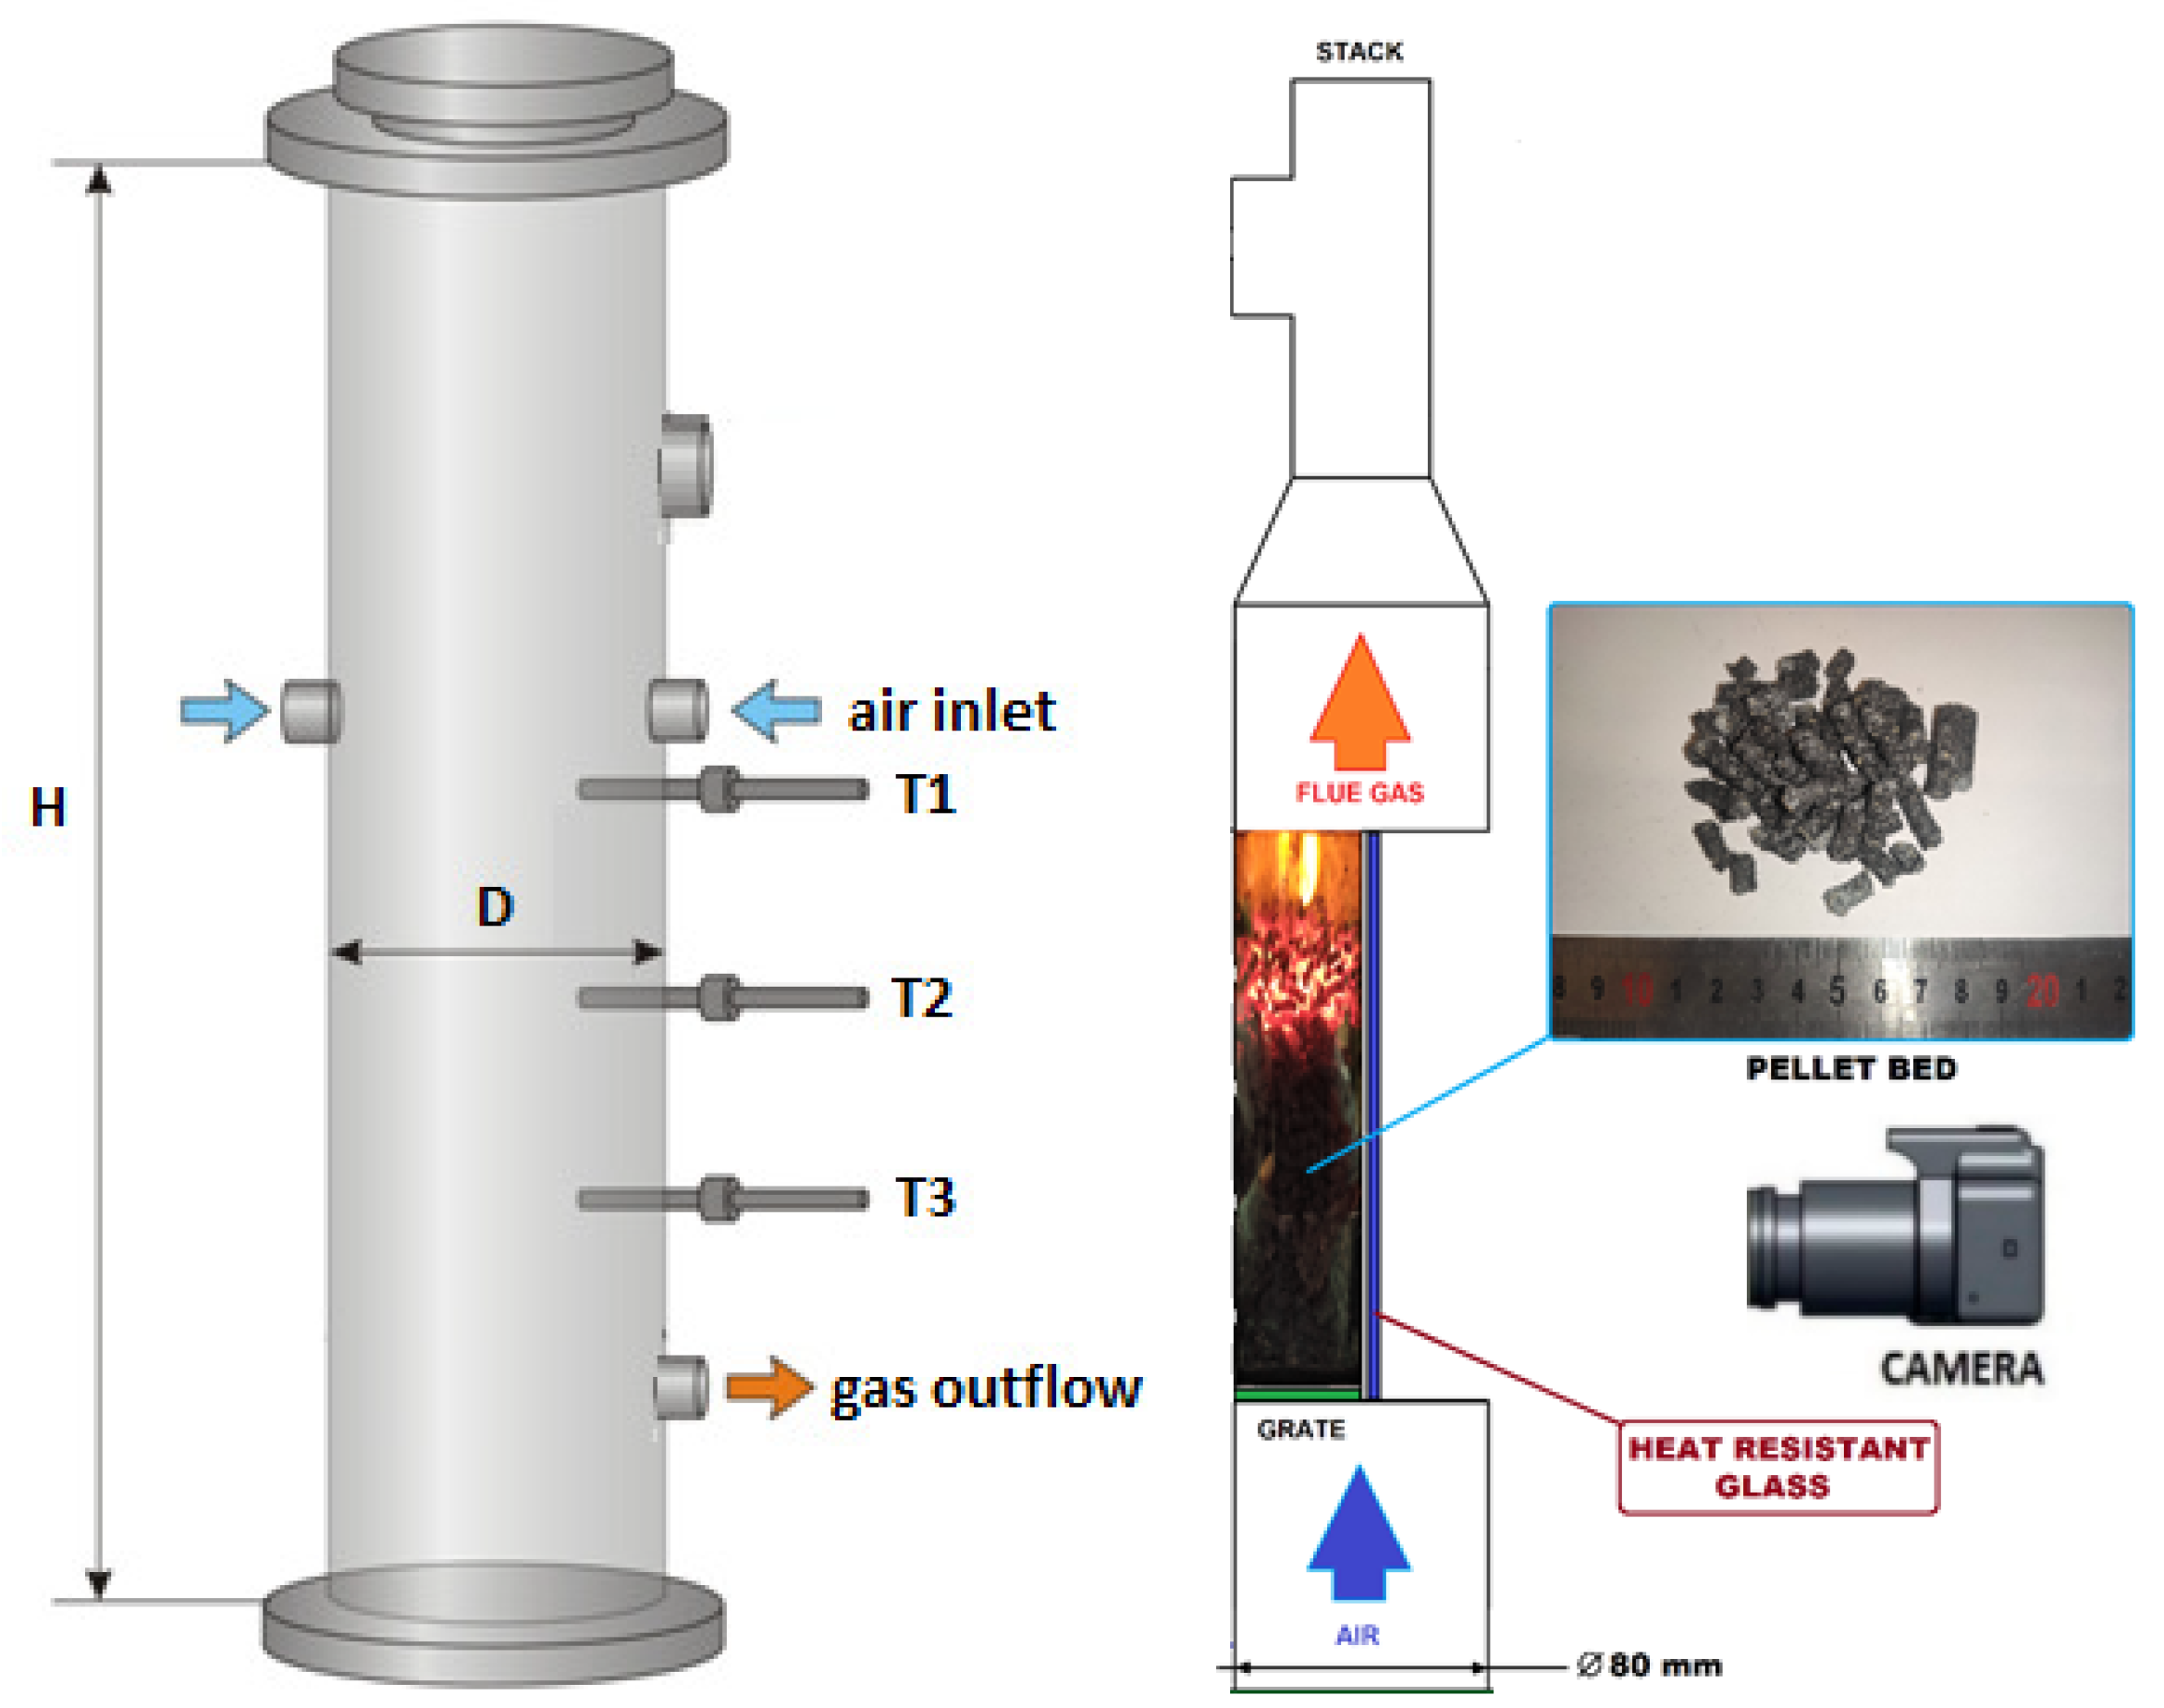
In this paper, small-scale reactors for biomass thermal conversion were taken into consideration while studying the process characteristics and analyzing the influence of the operational conditions on the products’ properties. In the IMP PAN laboratory, there were a few small-scale reactors for analyzing the pyrolysis and gasification processes. Most of them had a typical cylindrical shape (Figure 2—left scheme), but there was also one with a half-tube geometry (Figure 2—right scheme) [22,44,45]. The latter was taken into account in the numerical study for predicting the biomass behavior in a moving bed during heating, due to the possible influence of adjacent curvilinear and flat walls on the temperature profile propagation, as well as on the gas flow through the porous media in such a type of geometry. The reason for creating that untypical shape reactor was to have a visualization stand for reaction front propagation during the combustion of different types of biomass and waste fuels [46].
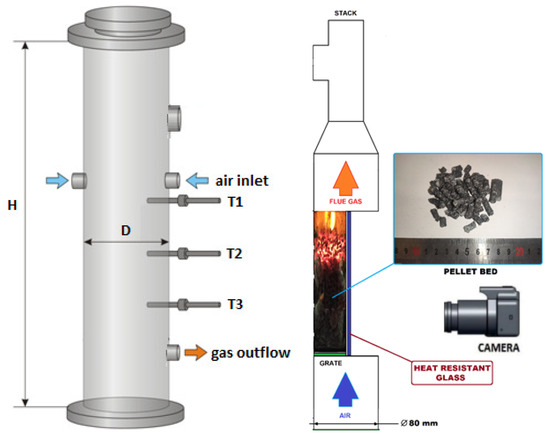
Figure 2.
The INKA gasifier (left): H = 850 mm, D = 206 mm and the VECTOR experimental setup scheme (right): H = 200 mm, D = 80 mm.
7. Numerical Simulations—XDEM
While using the XDEM method for the simulation of the thermal conversion of biomass fuel, different stages of the process should be taken into account. First of all, to determine the initial particle position in the reactor, the device should be filled by the particles. After that, all necessary physico-chemical processes need to be considered: particle heating, particle deformation including its shape change, oxidation of the volatiles and char, and analyzing force balances acting on each particle to find a new position of the pyrolyzed and shrunk particles.
7.1. Filling the Container
For filling the container with the particles, the dynamic part of the XDEM software was adopted.
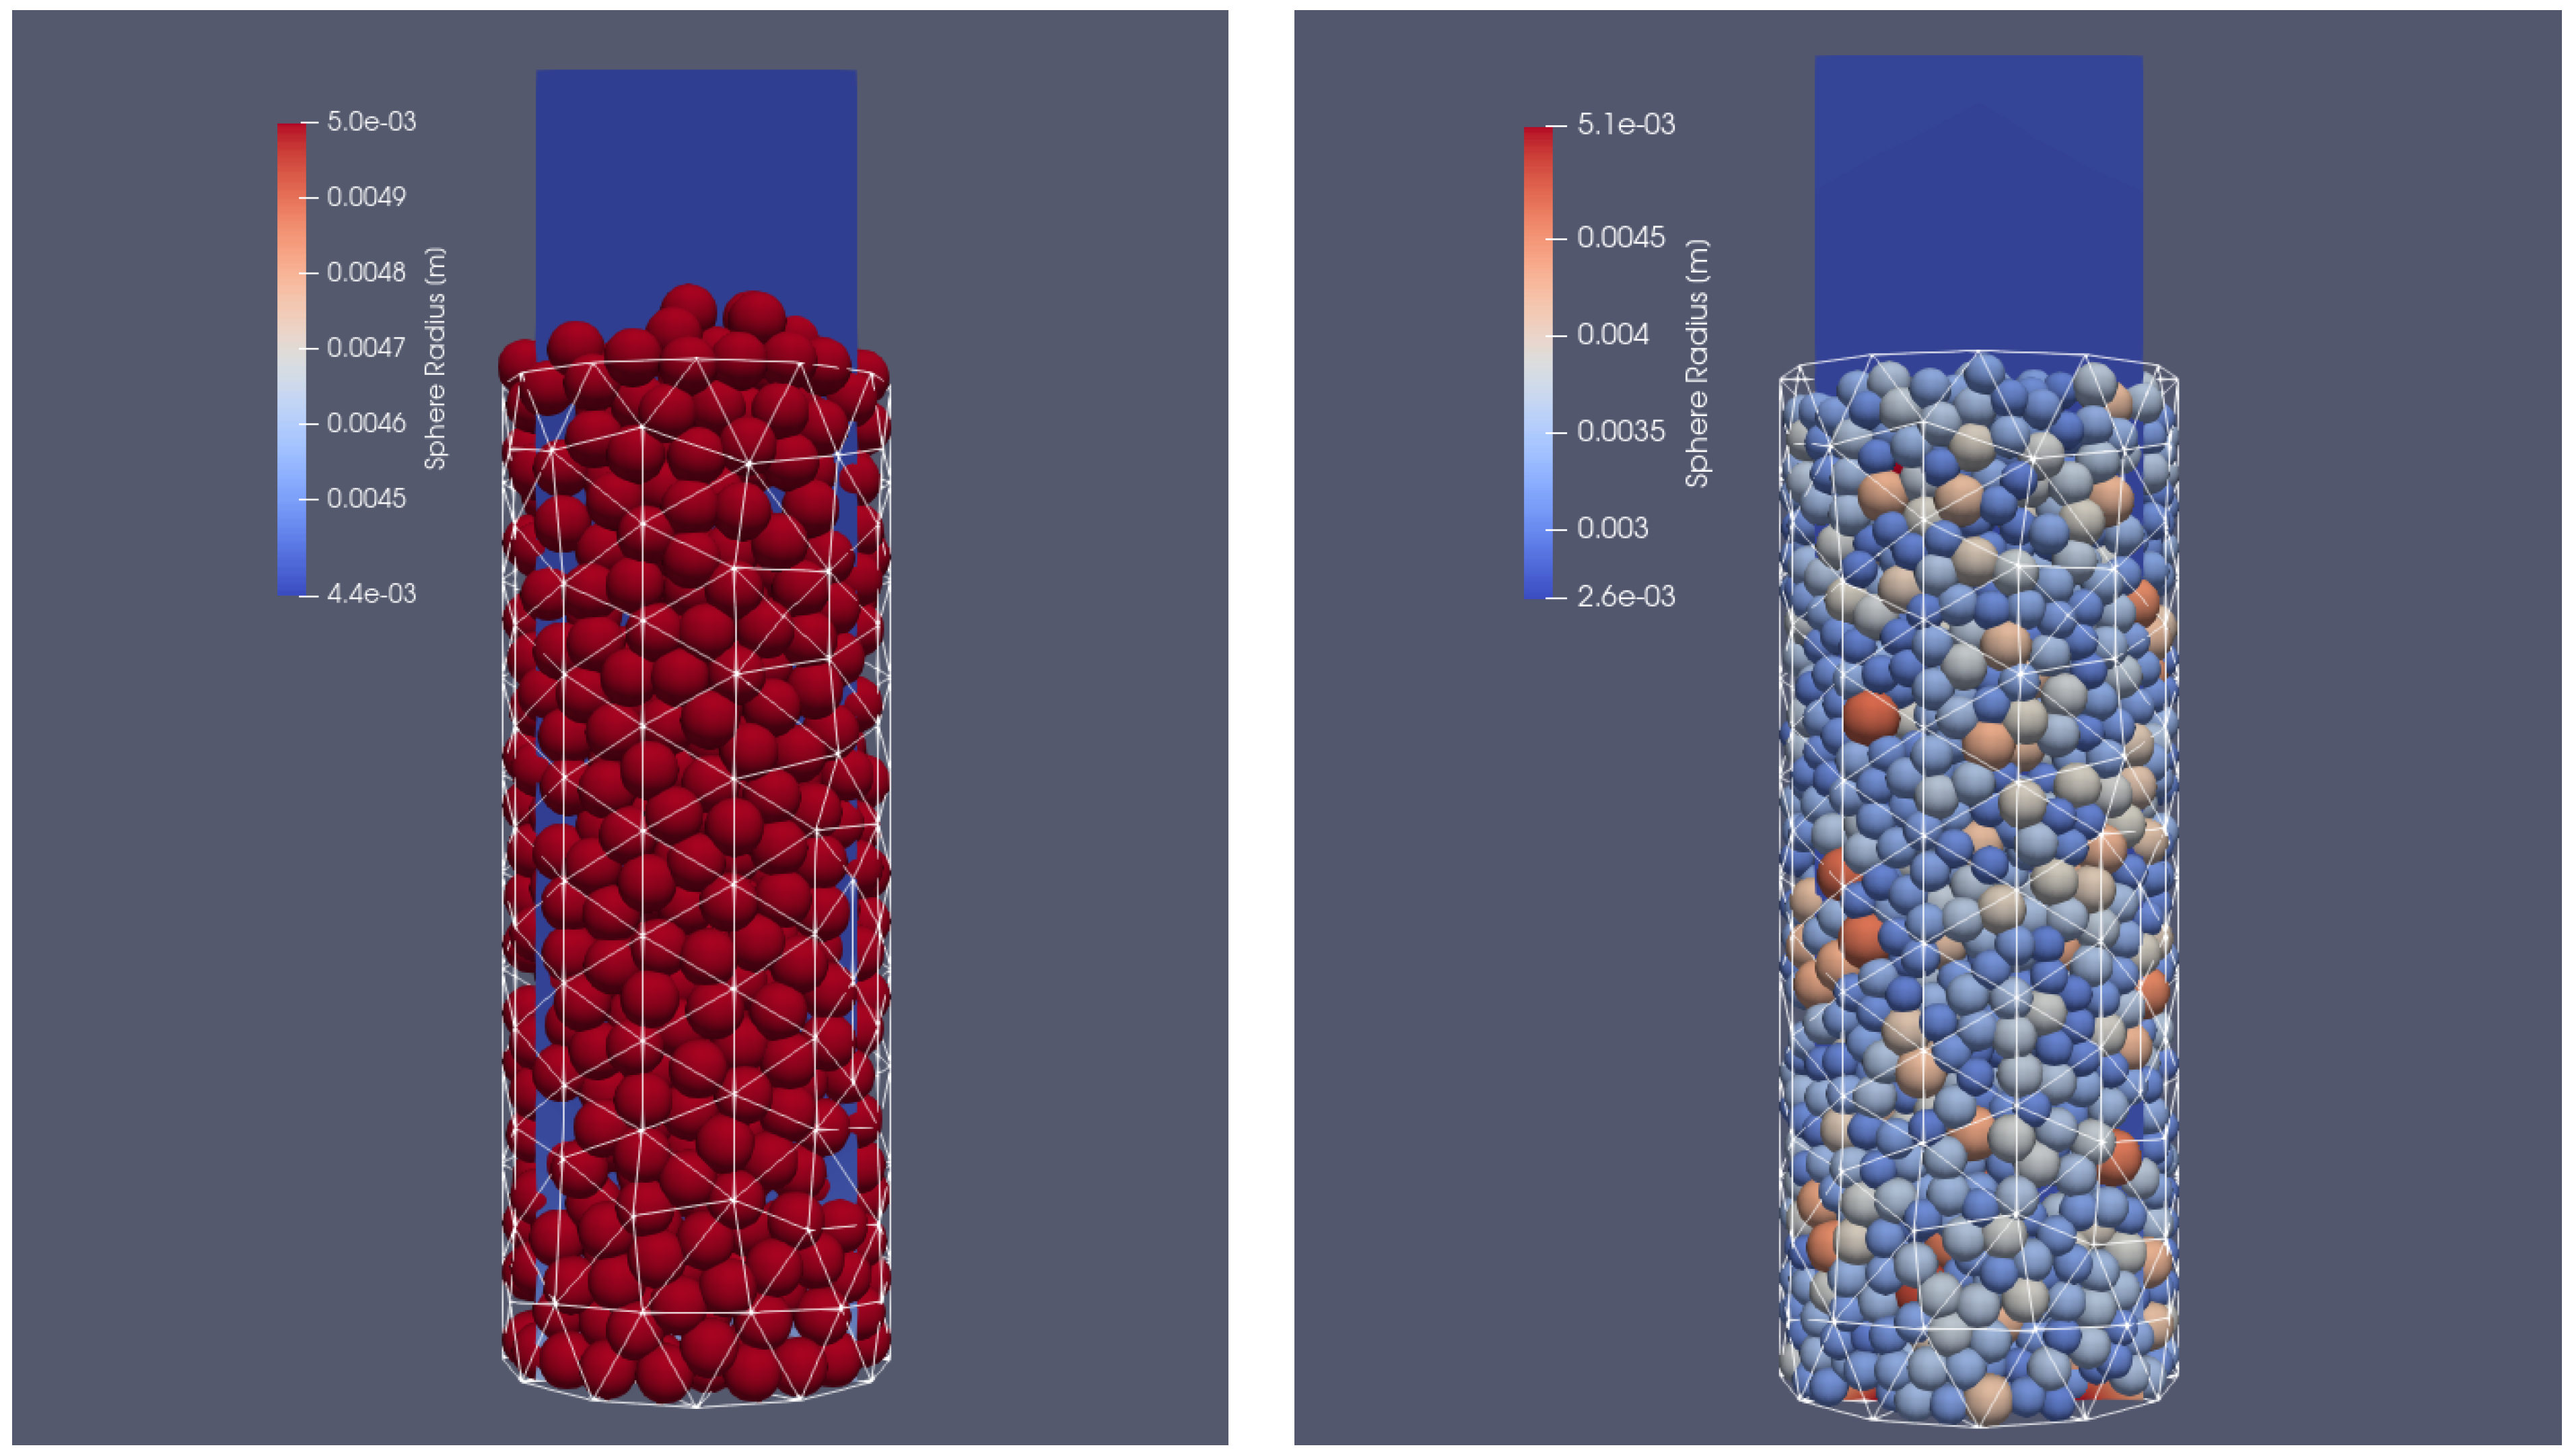
Two different cases were taken into account. In the first one, the container was filled with particles of the same diameter (), and in the other with particles of different sizes ranging from to . In each case, the particles were injected into the VECTOR reactor with a mass flow rate of 10 kg/s. The filling simulation time was set to 3 s and at the time of 1.3 s, the particle injection was stopped; following that, the particles were still moving due to the gravitational settling on the bottom side of the reactor. After reaching the end time of the simulations, the particles stopped sliding and their final position in the reactor could be defined. The cylinder was filled approximately with 510 biomass sphere particles in the case of a uniform size and with 1650 biomass particles of different sizes. This difference in the total number of grains can be seen in Figure 3. The results of calculations from the dynamic part of XDEM with the position of the particles were copied and served as an input file for coupled calculations with XDEM (conversion and dynamic module) and OpenFOAM. In the test case, it was decided to include the entire thermal processes taking place during particle thermal conversion, including heating, drying, devolatalization, and oxidation. The basic mathematical equations describing the mentioned stages are presented below.
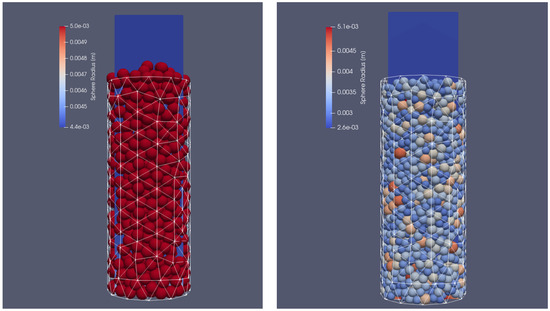
Figure 3.
Reactor filled with different particle sizes: initial positions of uniform particles (left) and particles of different sizes (right).
7.2. Vaporization Model
For moisture release from biomass particles, the following approach was applied. It is based on the balance between the energy available for evaporation and the amount of evaporated water. The heat available for evaporation is defined as a function of the difference between the local and saturation temperatures; thus, the source of evaporated water can be defined as follows [36]:
where , , , , , denote the local particle temperature, evaporation temperature, evaporation enthalpy, particle density, specific heat of the particle, and the time interval, respectively.
7.3. Biomass Pyrolysis Model
The kinetic scheme used to model the chemistry of devolatilization of wood particles is a two-step global model, which describes the biomass thermal destruction and the oxidation of its bio-char in two global reactions [42]:
where the gas mixture is given as follows:
The particulate stoichiometric coefficients are determined based on the pyrolytic products composition [42]:
The reaction rates are formulated in terms of the Arrhenius Equation (29). The main parameters are listed in Table 1.

Table 1.
Arrhenius parameters for pyrolysis and char oxidation reaction used in simulations [42].
7.4. Chemical Reactions in Gaseous Phase
In the CFD module (OpenFOAM), only the gas flow through porous media is considered. While it accounts for the pyrolysis/gasification/combustion process, the transport of the gas mixture should be accounted for, as well as the chemistry of oxidizing combustible species. In the analyzed case, the following irreversible chemical reactions are considered:
The needed Arrhenius constants are presented in Table 2.

Table 2.
Arrhenius parameters for gaseous reaction used in CFD module simulations.
7.5. Results for the Uniform Size of Particles
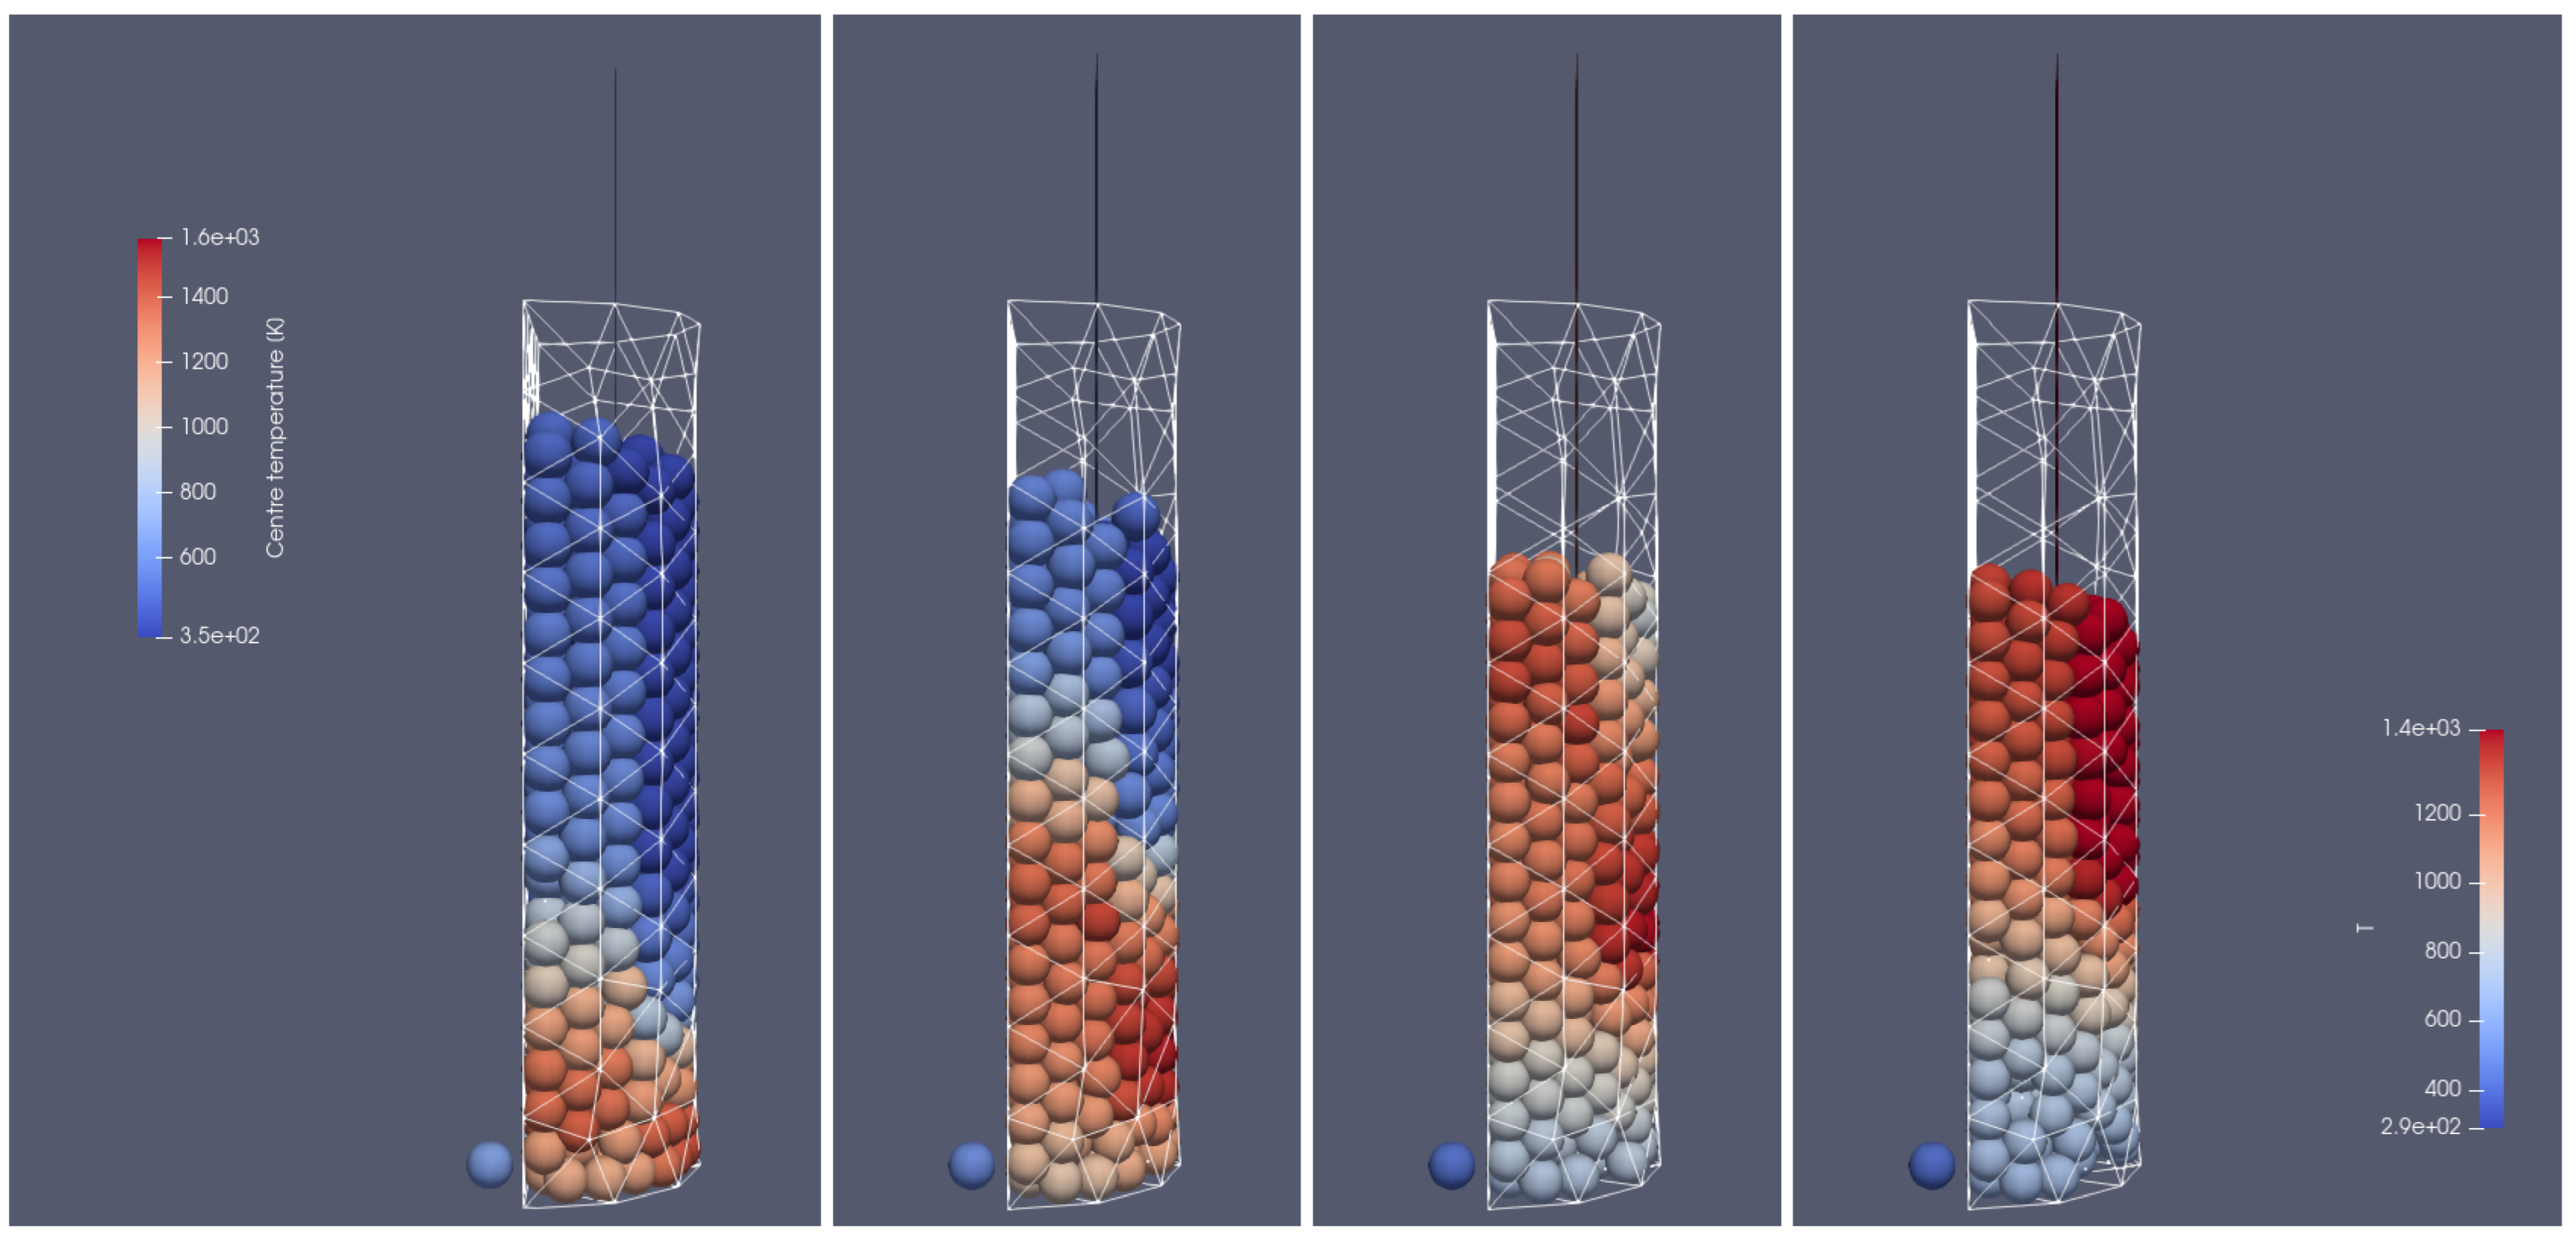
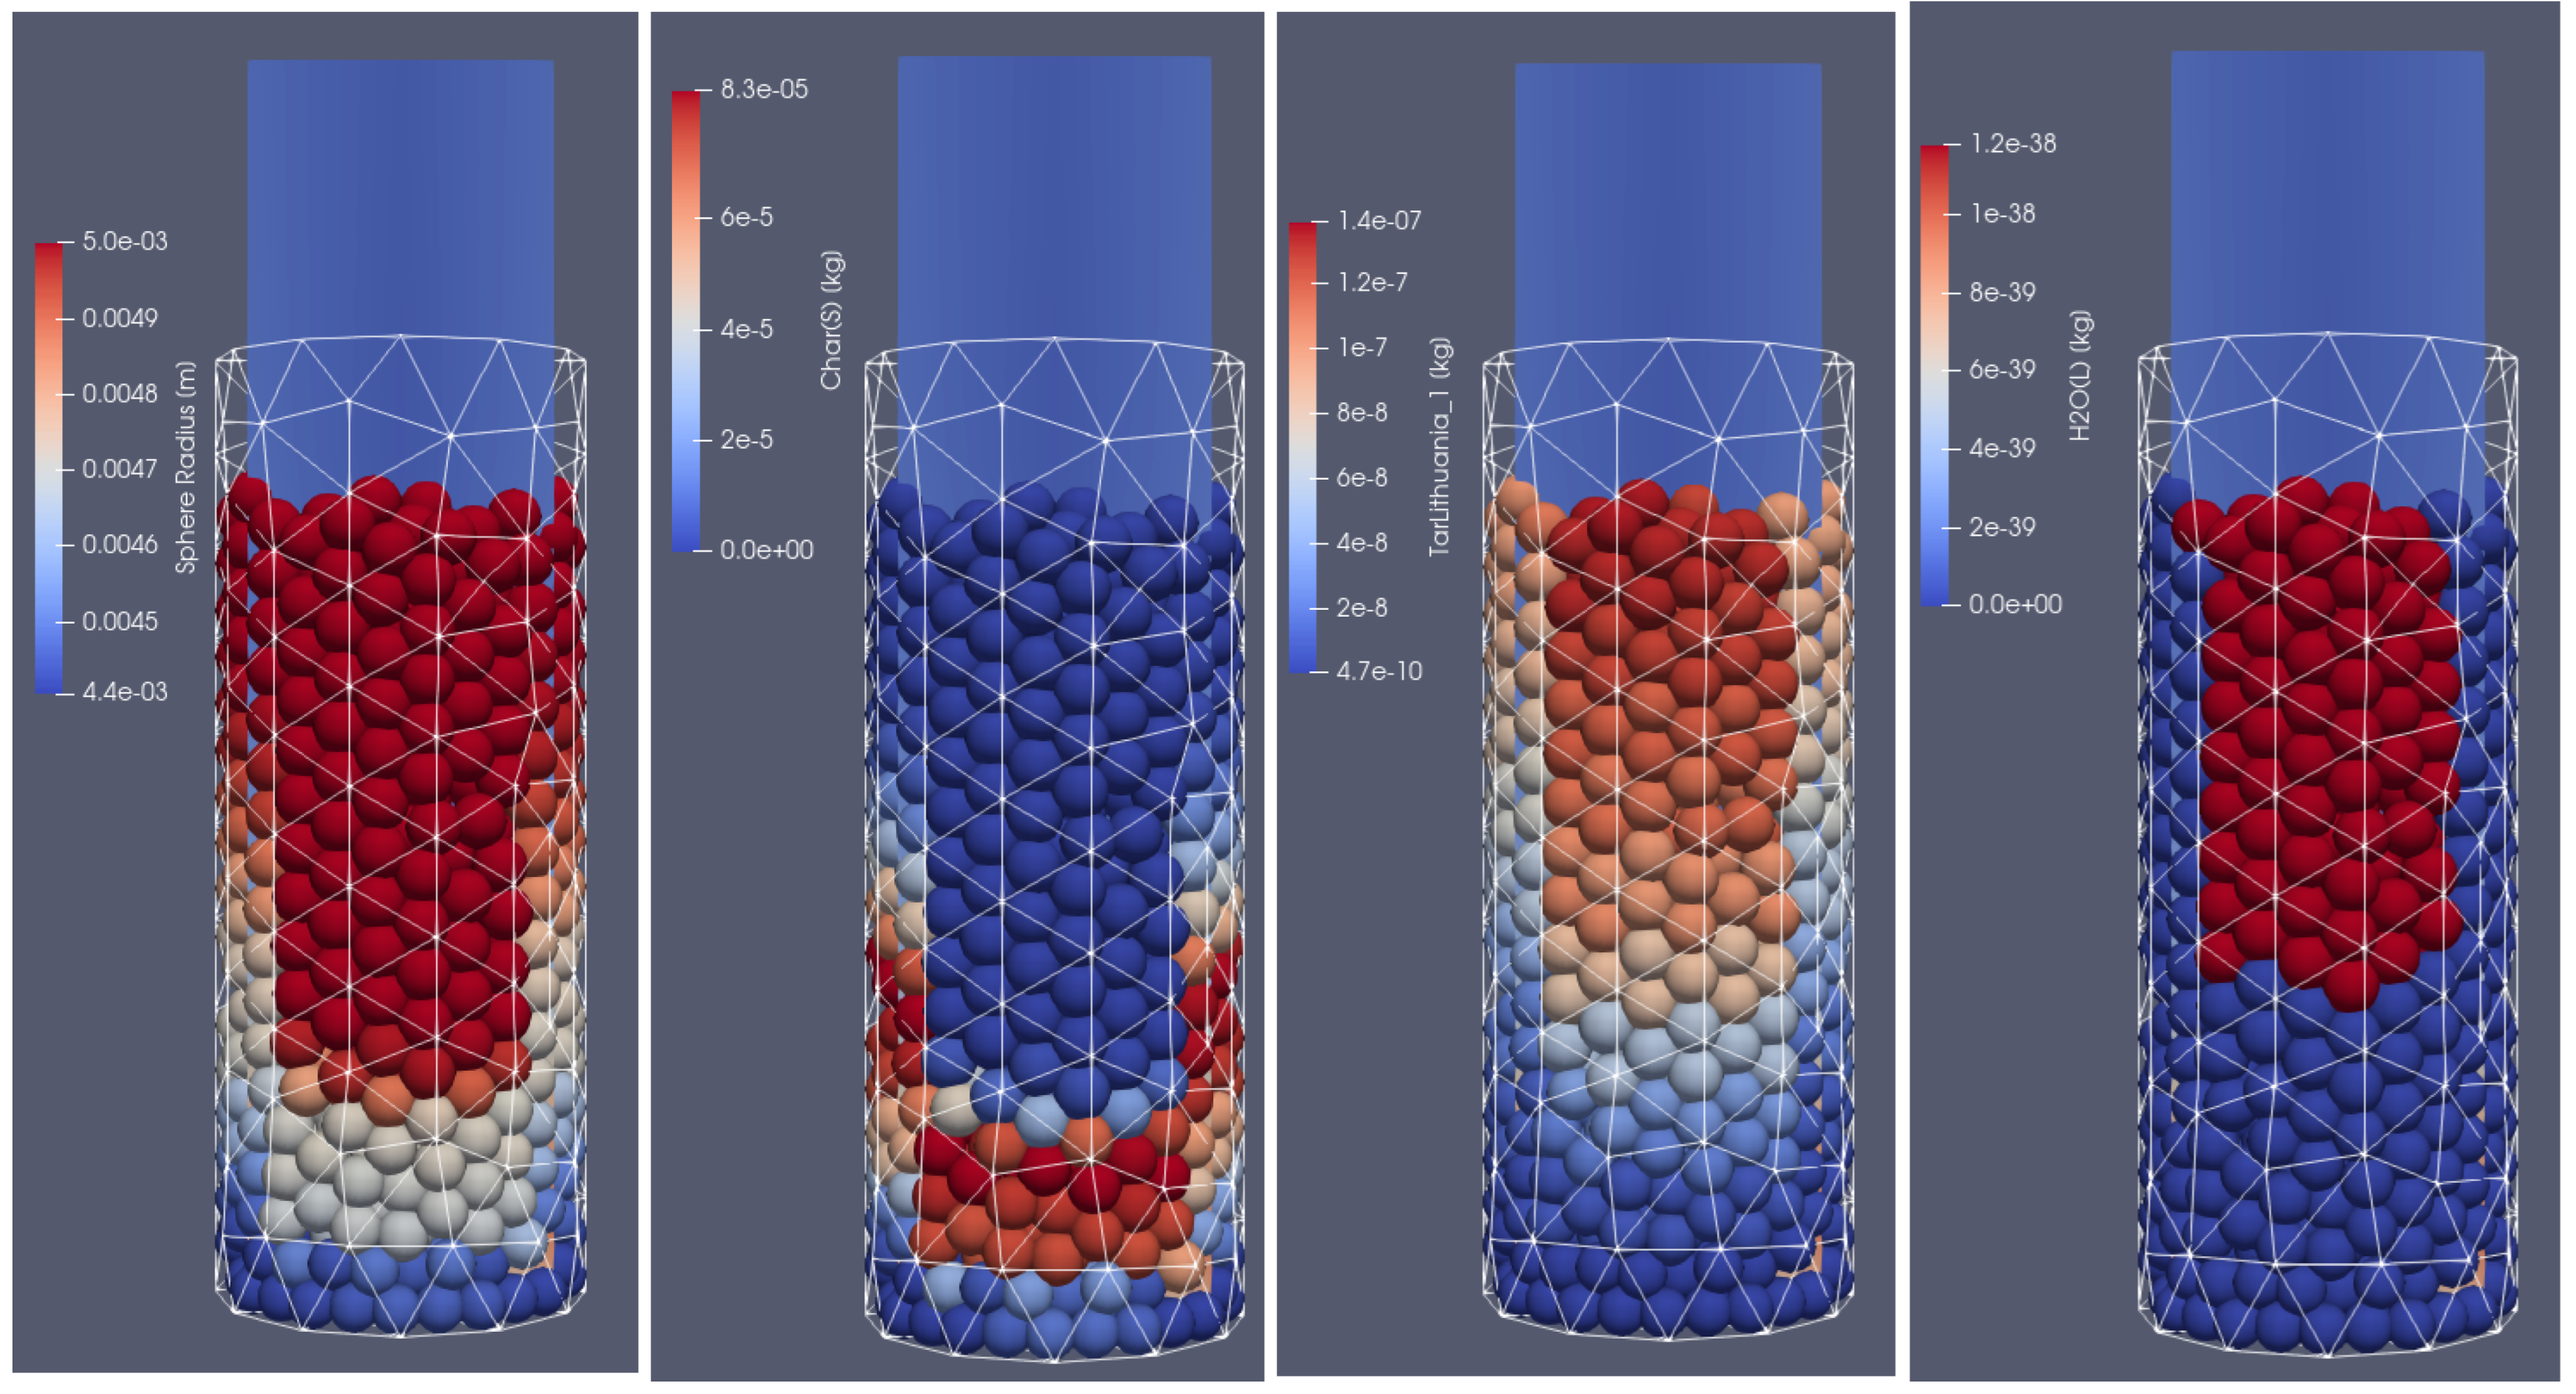
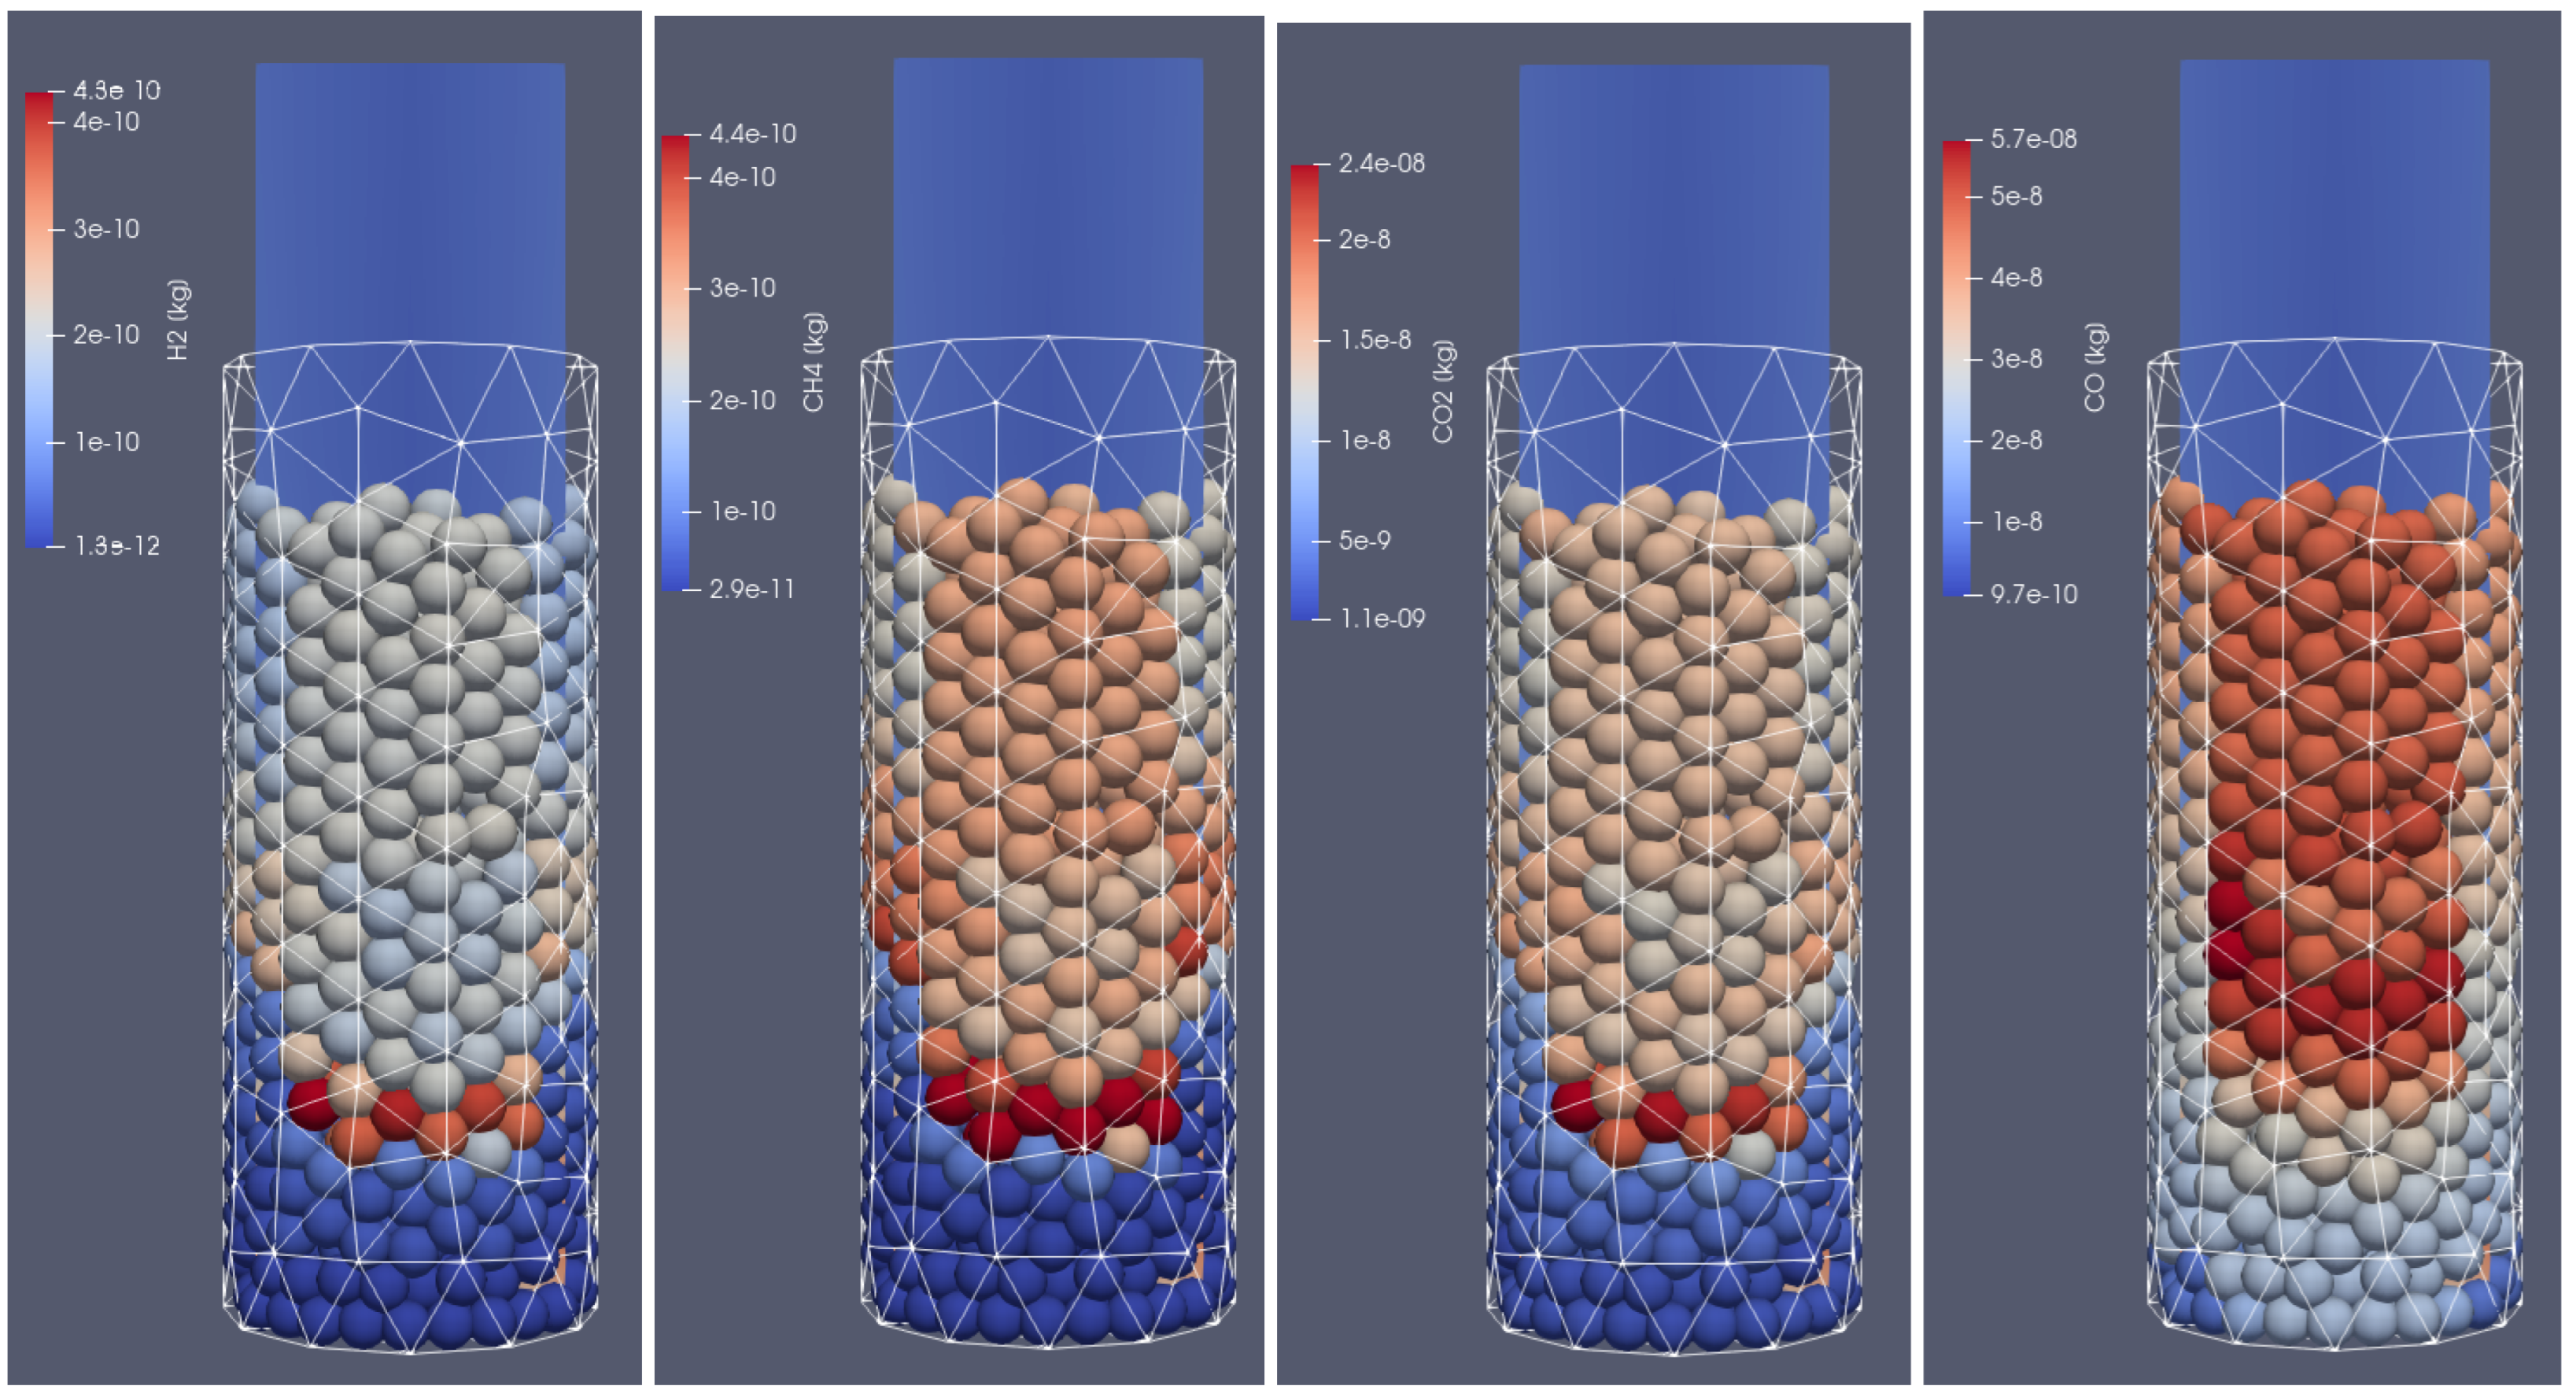
In Figure 4, Figure 5, Figure 6 and Figure 7, the coupled XDEM and CFD numerical simulations results are presented. The case includes equal-sized particles heated from the hot air stream injected into the half-tube-shaped reactor from the bottom wall. The temperature of hot air was set as 800 K and its initial velocity as 0.3 m/s, which gave the mass flow rate of the air at the level of 0.33 kg/s. The air was composed of and in a volume fraction of 21% and 79%, respectively. The component was treated as an inert gas. The basic properties of the beech wood fuel sample used in computations are listed in Table 3.
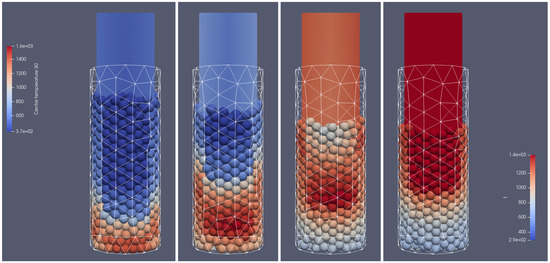
Figure 4.
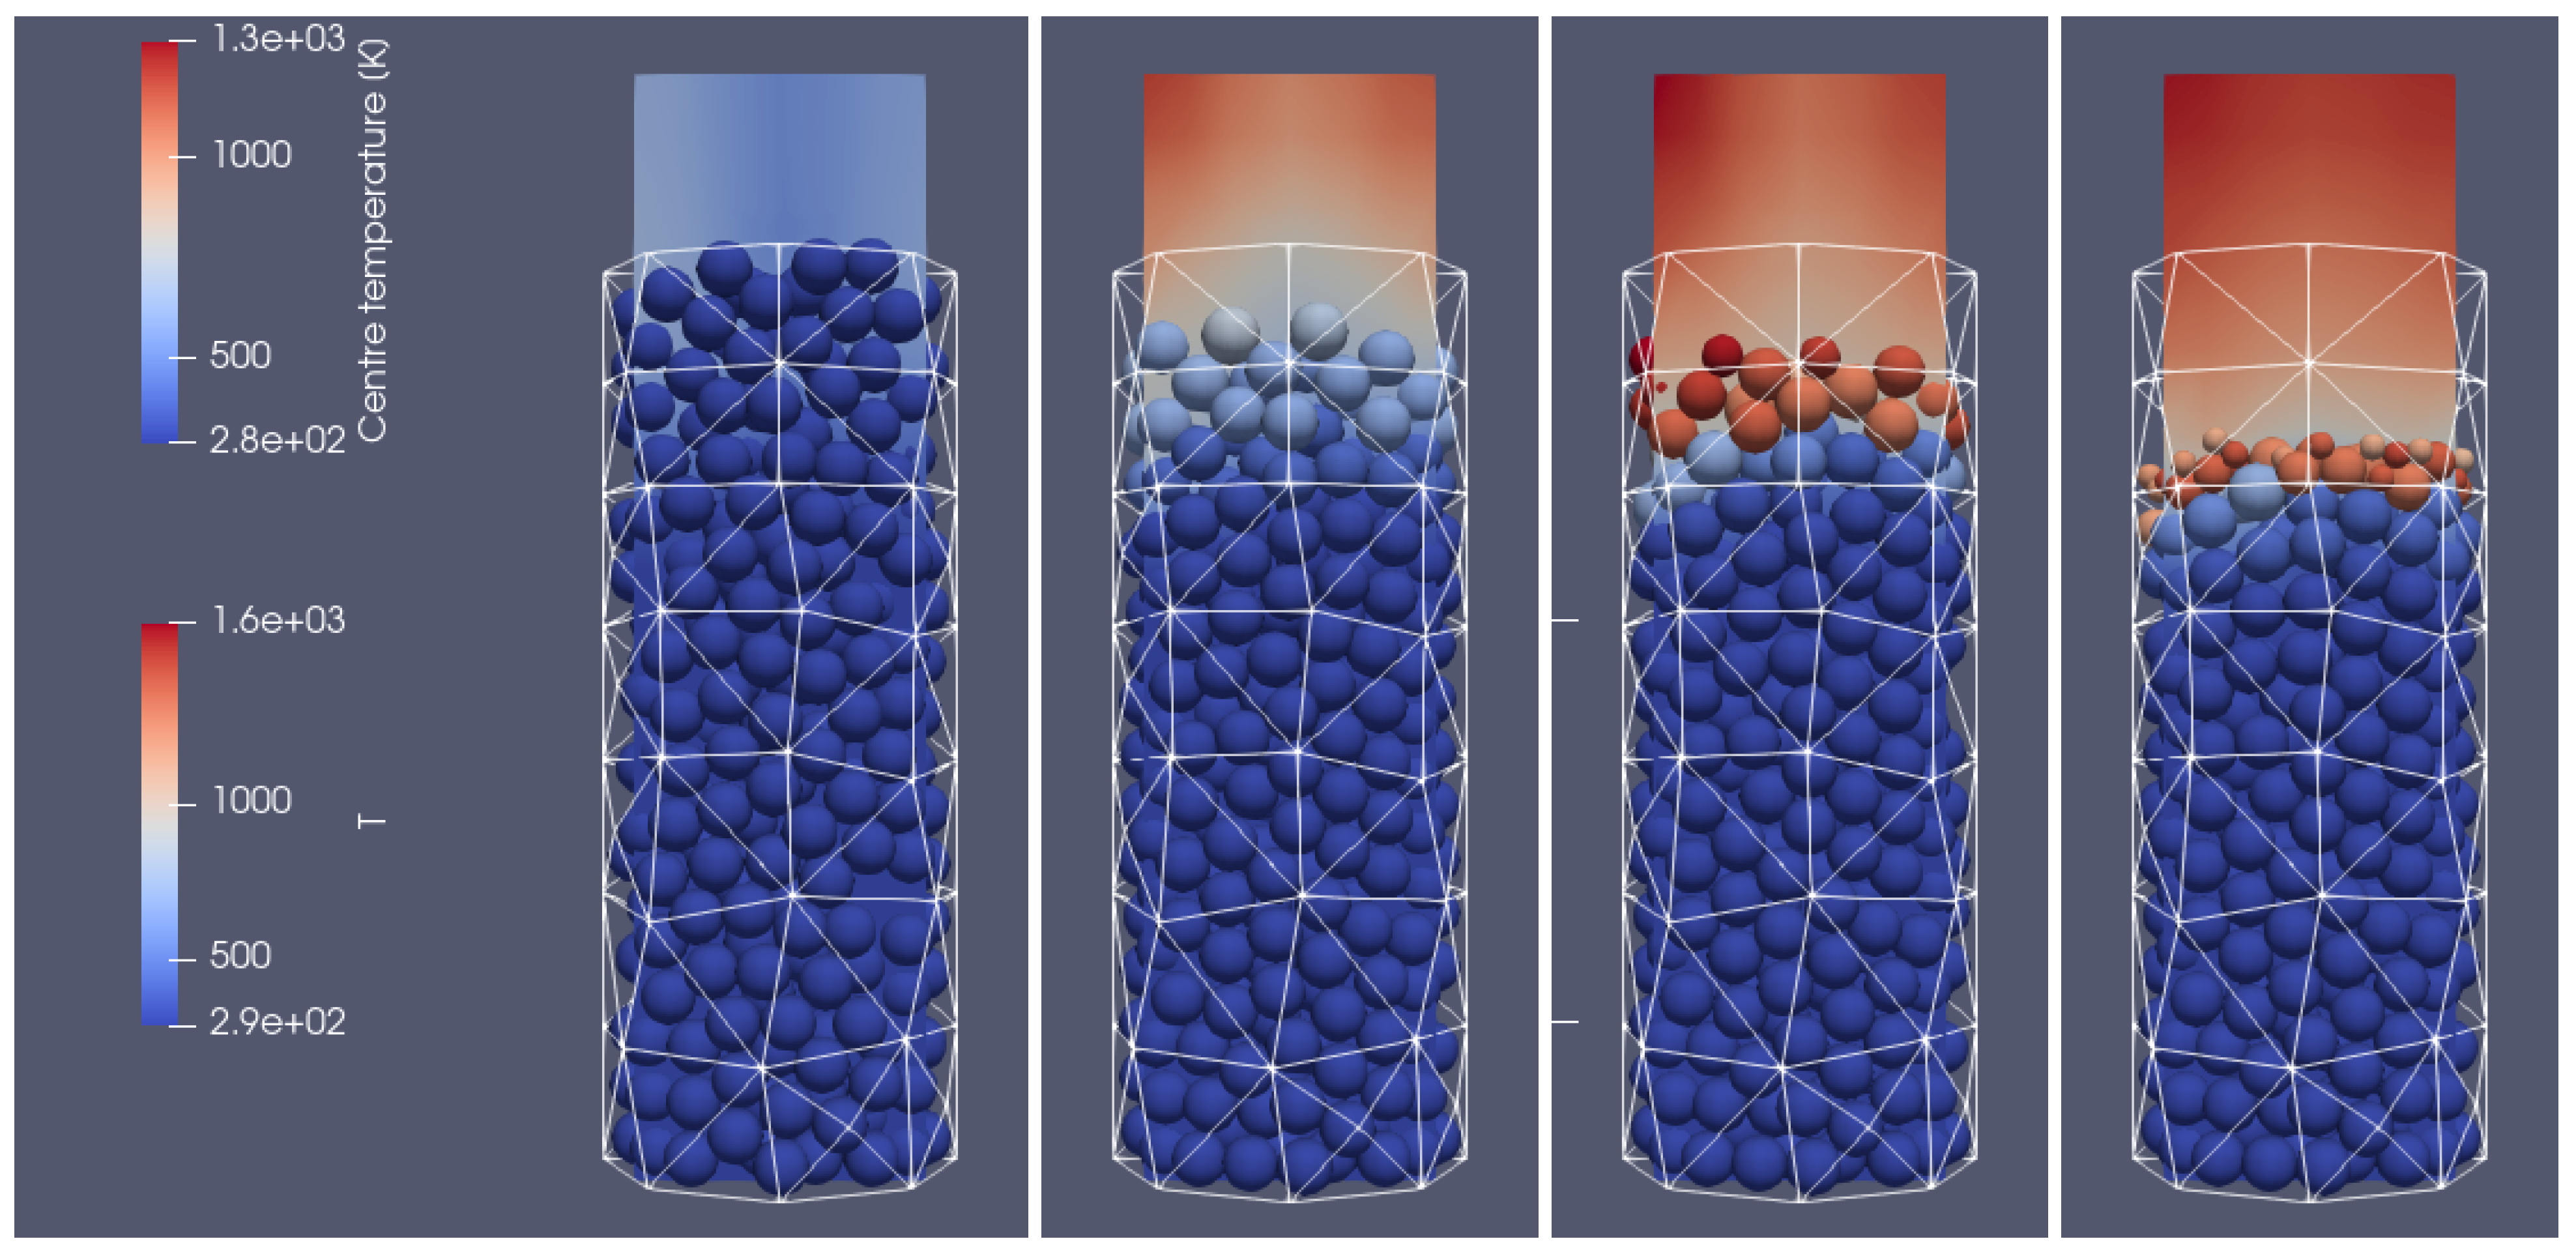
Heating of the biomass bed of particles with a size of 0.01 m diameter at different times of operation; from (left to right): 500 s, 700 s, 900 s, 1100 s, front side view.
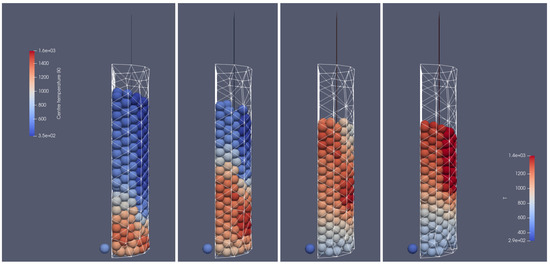
Figure 5.
Heating of the biomass bed of particle sizes of 0.01 m diameter at different times of operation; from (left to right): 500 s, 700 s, 900 s, 1100 s, right-hand-side view.
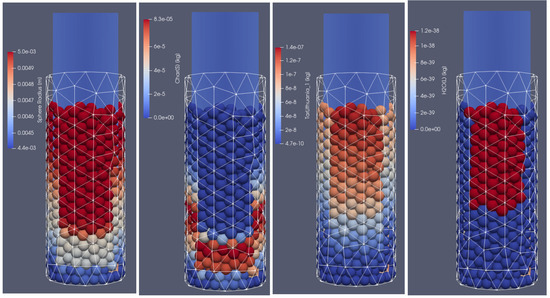
Figure 6.
Products of biomass thermal conversion process after 500 s of heating; from (left to right): particle diameter, char, tar, moisture content, front side view.
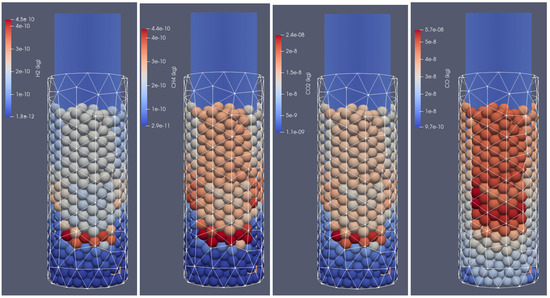
Figure 7.
Products of biomass thermal conversion process after 500 s of heating; from (left to right): , , , , front side view.

Table 3.
Physical parameters of the biomass fuel used in CFD module simulations.
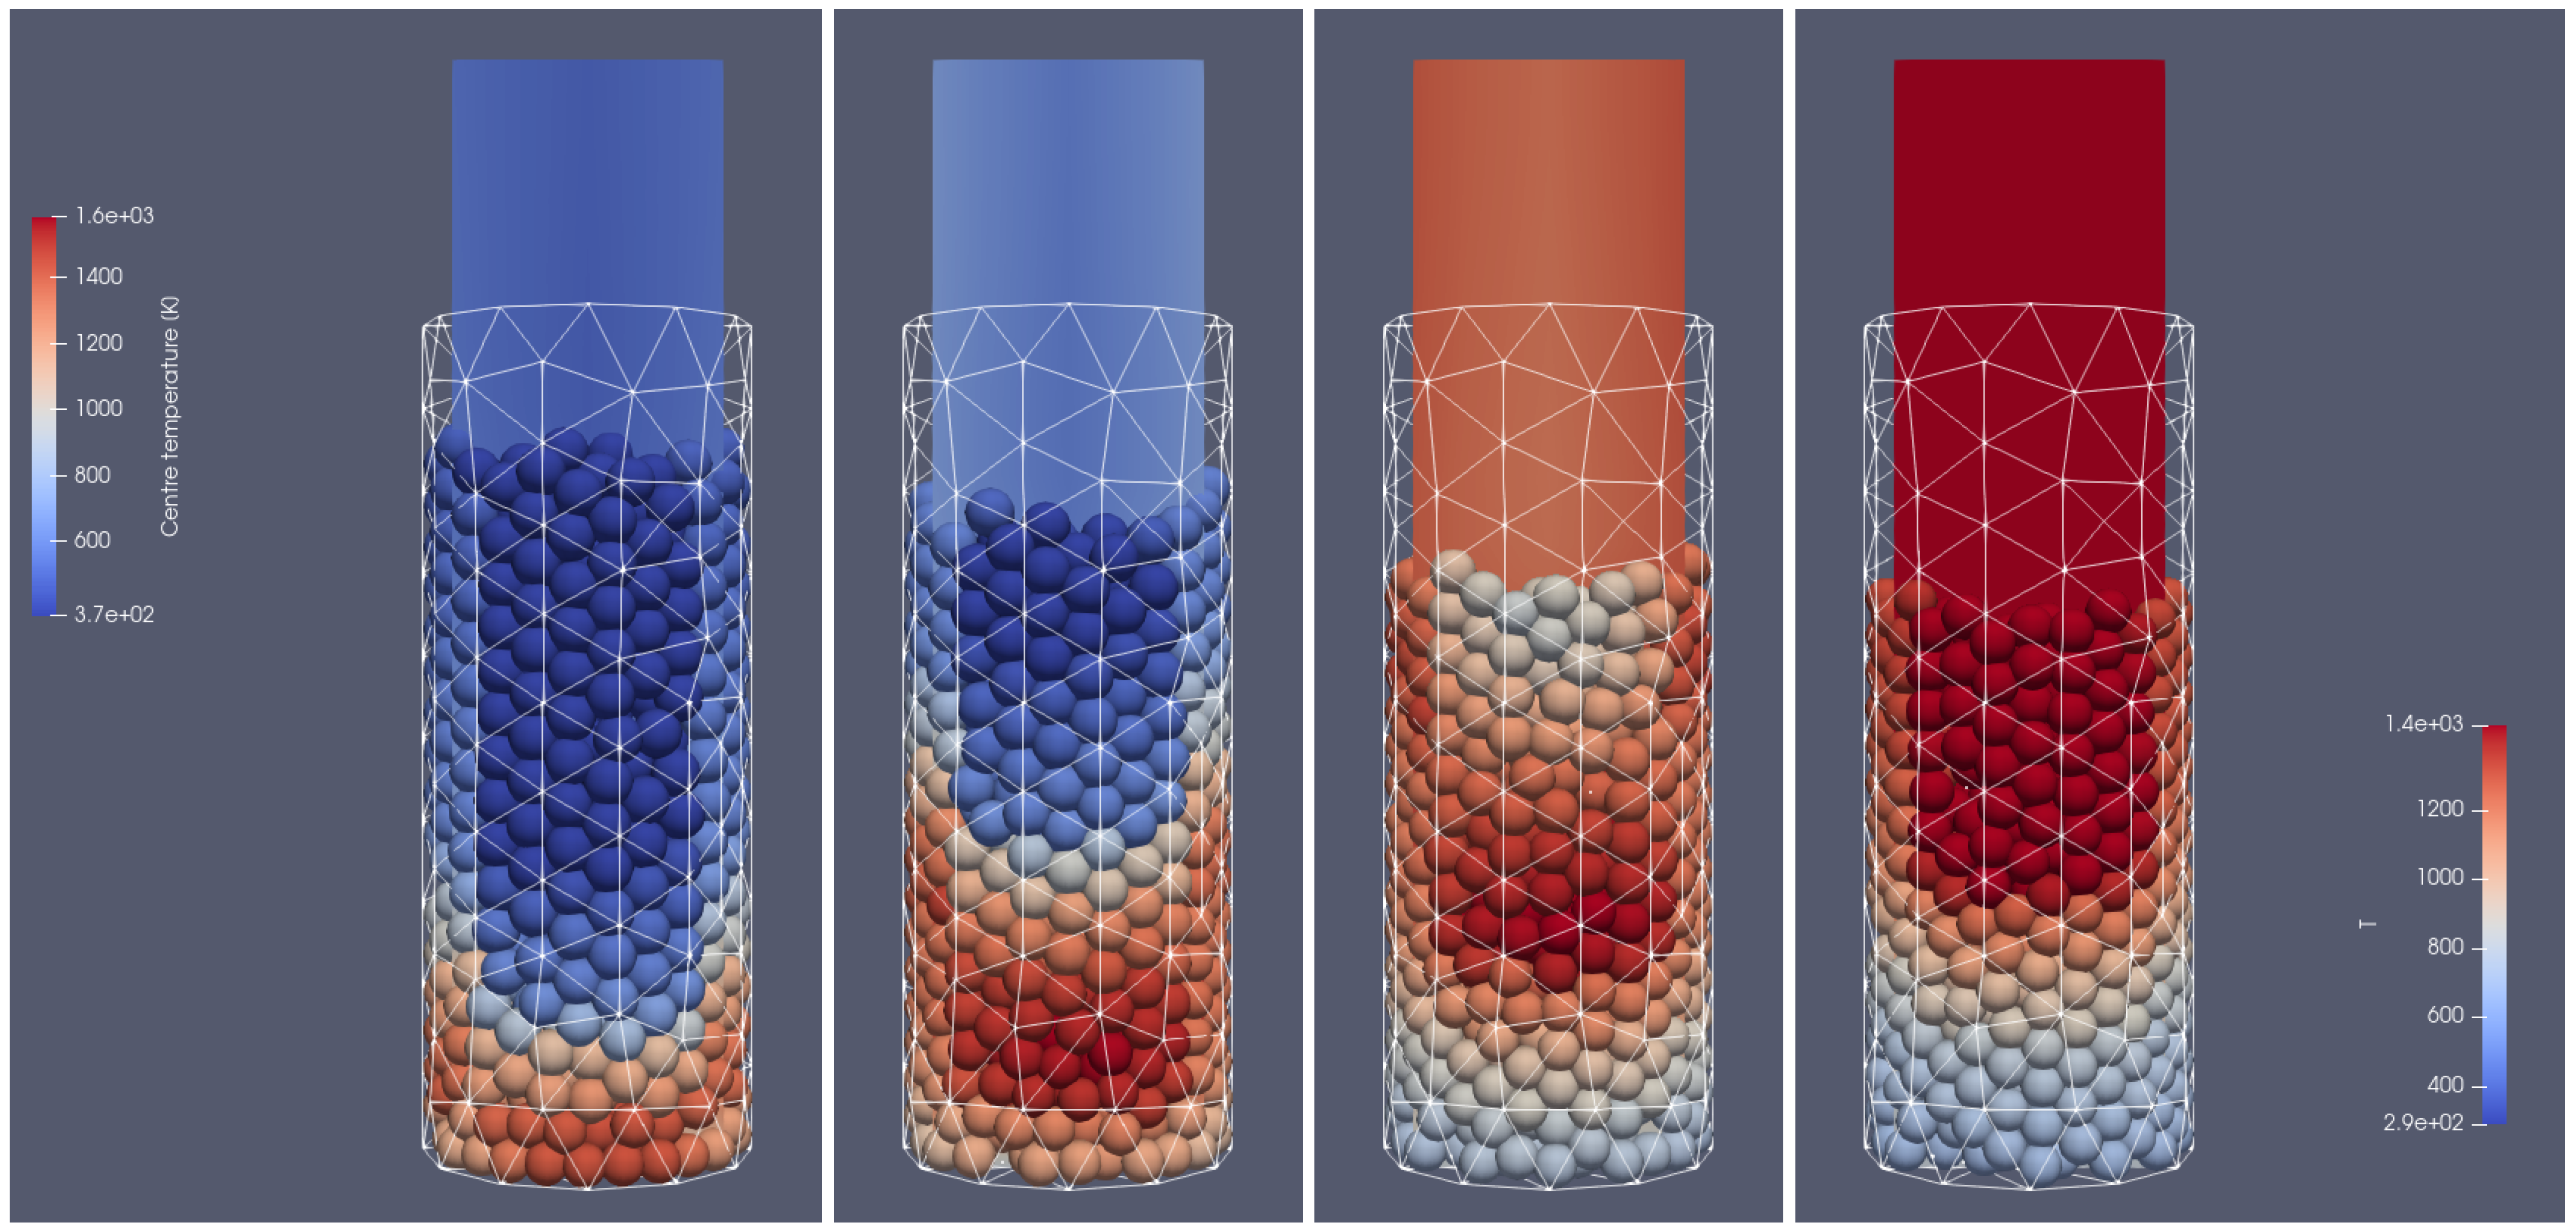
In Figure 4 and Figure 5, the propagation of the heating front in four different time steps and from two different views can be observed. As can be seen, the hot air flows into the reactor from the bottom, and due to the heat transfer from the hot air stream to the cold particle with an initial temperature of 298 K, the granular bed is heated from the bottom to the top according to the direction of airflow. Moreover, the temperature of flowing gas increases due to the oxidation reaction of the combustible pyrolysis gas and the oxidation of char. From those pictures, one can observe the additional effect indicating the influence of the reactor geometry on the gas flow. Namely, the walls affect the flow through the porous media, which for the irregular geometry of the half tube makes the hot gas flow accelerate near the back wall region at its corners (see Figure 4 and Figure 5 for 500 s and 700 s). The combustion front is also visible, in contrast to the hot gas flow and bed heating; the combustion front moves faster in the center part of the reactor (see Figure 4 and Figure 5 for 700 s, 900 s, and 1100 s).
In Figure 6, the distribution of products from the thermal conversion of biomass in the selected time step is presented. As can be seen, due to the thermal and chemical reactions, the particles shrink; after the temperature front passes, the moisture evaporates and the char is formed. Consequently, the particles lose mass and change their diameter. Additionally, the tar is formed in the lower temperature region. As a result of increasing the particles’ internal energy, the long chains of hydrocarbons are broken, and the shorter ones are produced. It is the so-called pyrolytic volatiles releasing [48], as can be observed in Figure 7, where the production of pyrolysis gas compounds in the particles is displayed.
The XDEM software gives not only the results in the form of maps with the distribution of the selected key parameters changing in time and space in the reactor geometry according to Eulerian approaches. There is also the possibility of tracking the position of the biomass particles owing to the use of the Lagrangian approach. Additionally, as mentioned, the behavior of each particle can also be analyzed by considering the Eulerian-type modeling inside the particle’s material.
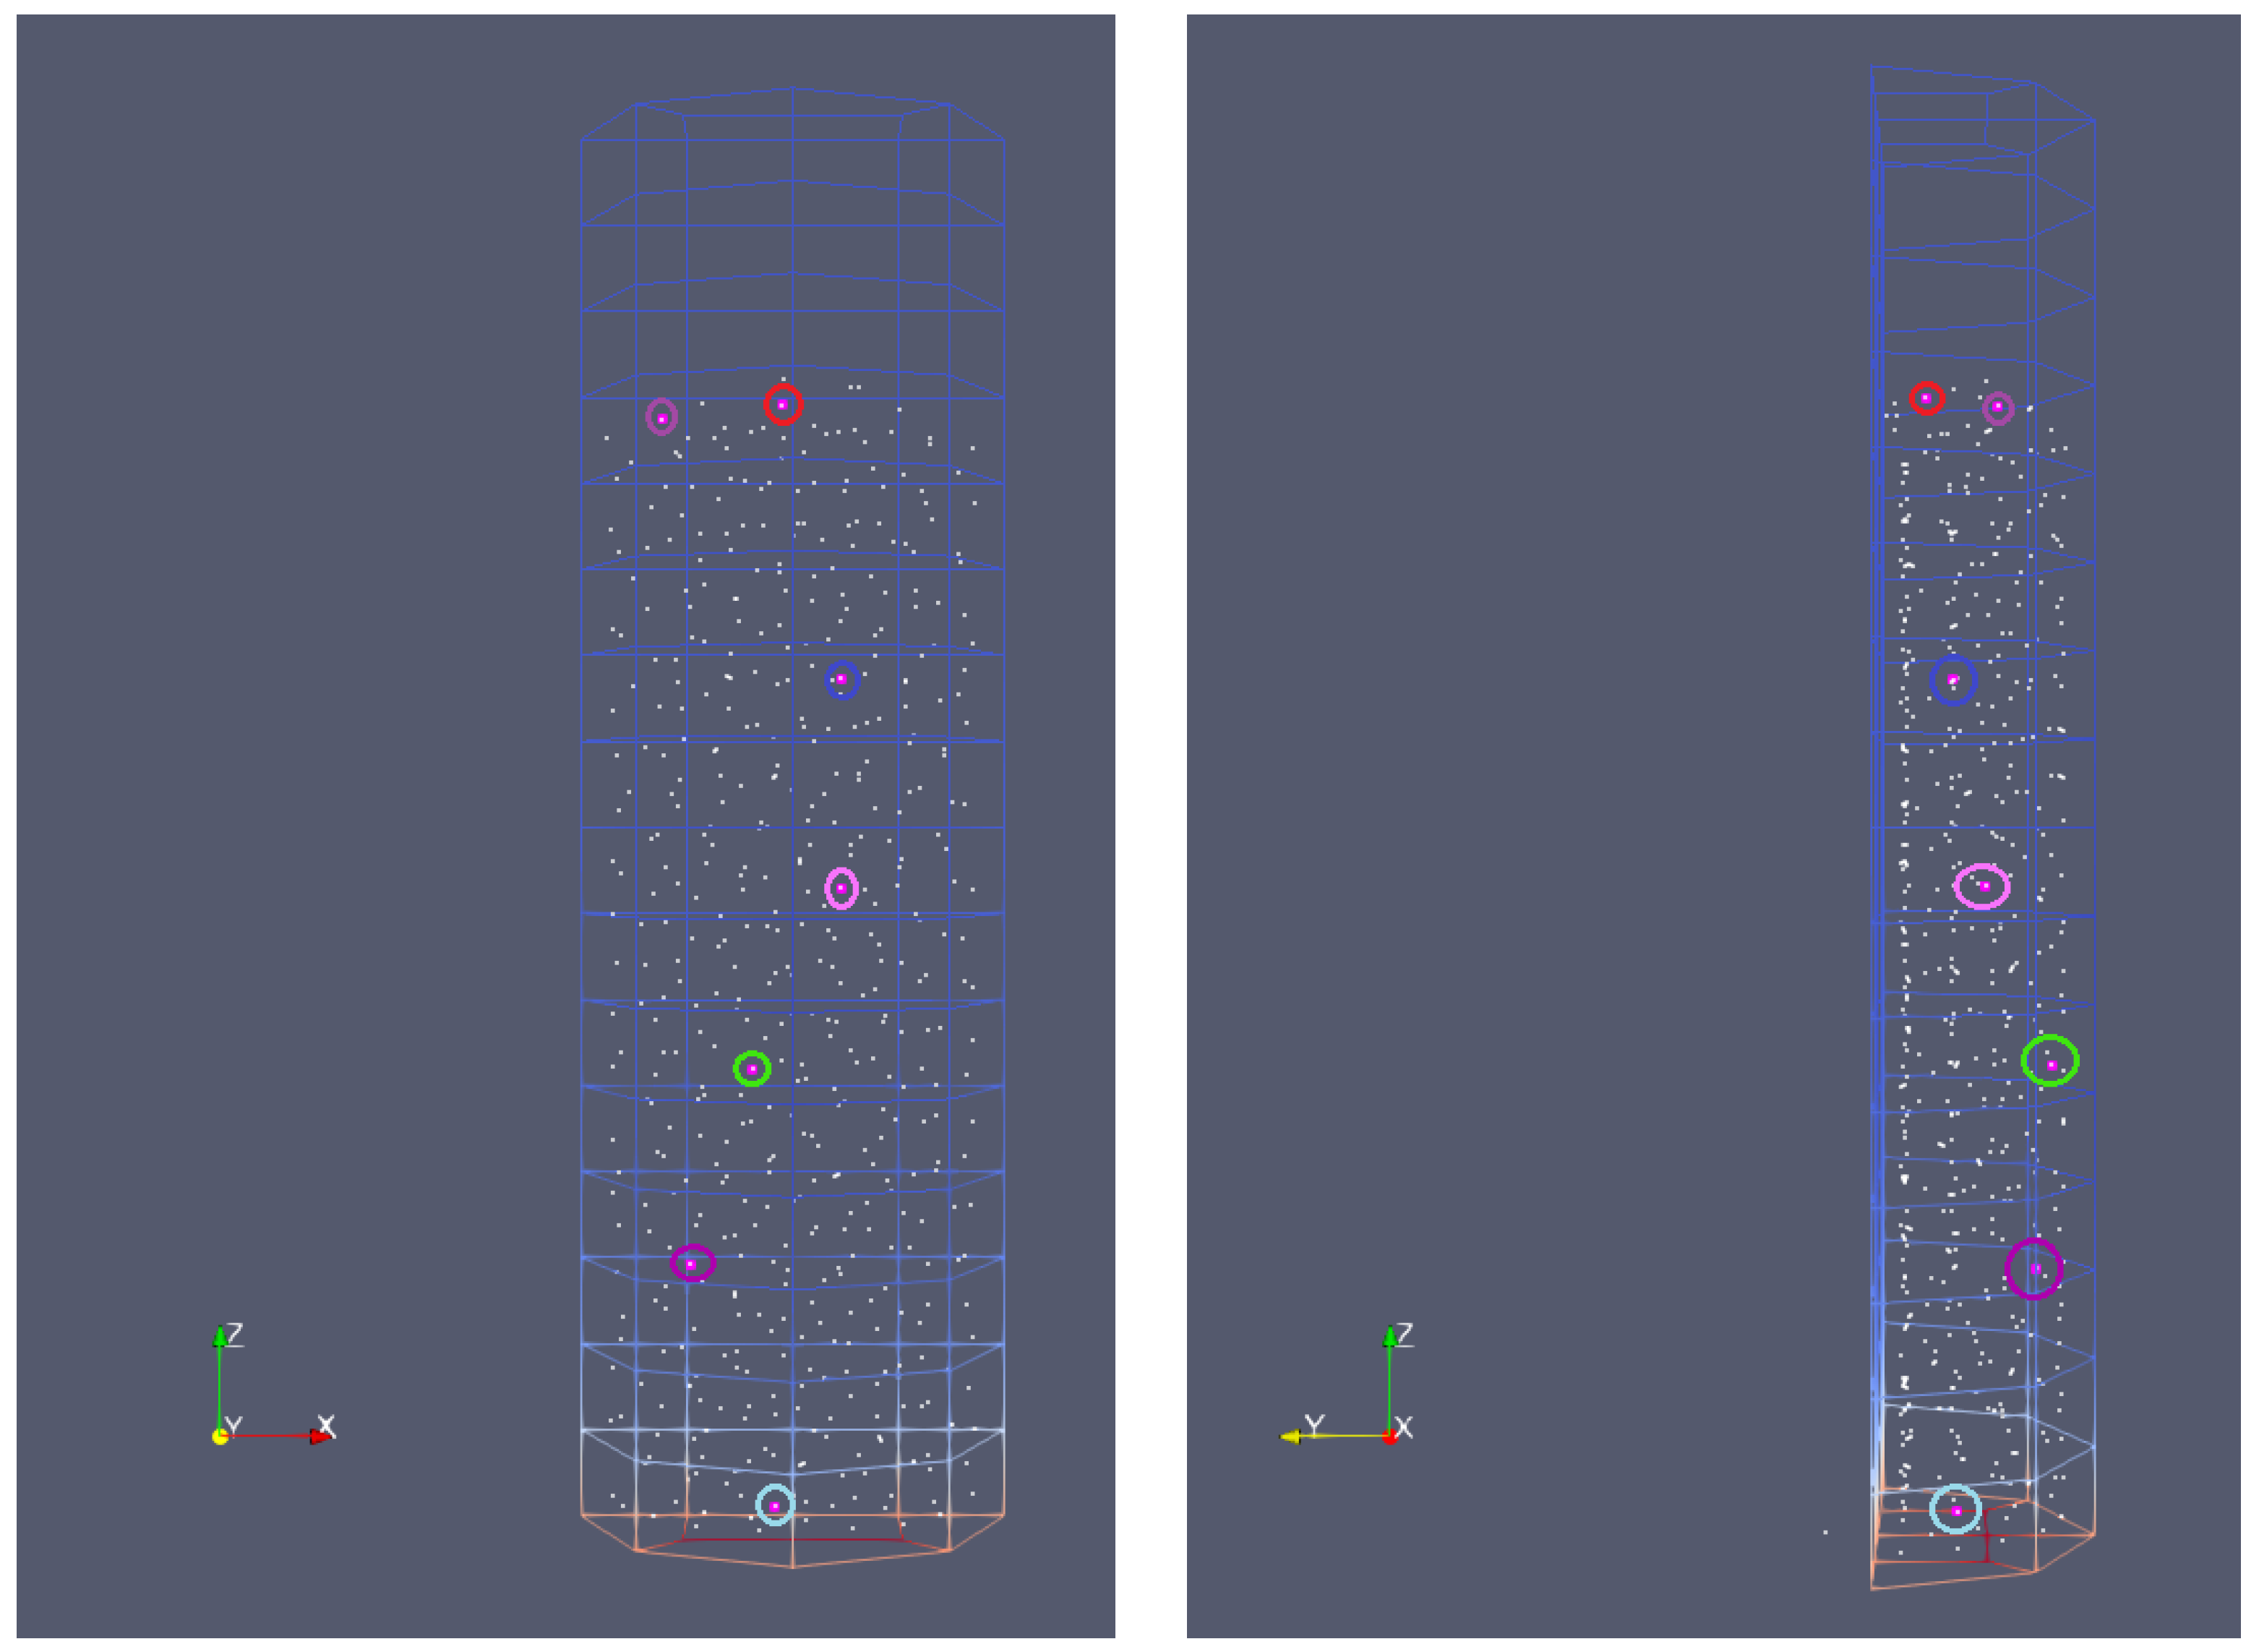
Figure 8 shows the initial position of the selected particles for which the analysis of the thermochemical process is made. To study the widest possible range of temperature effects on pyrolysis and gasification, the particles of different initial positions in the reactor were considered. As can be seen, the analysis covers the particles located in the reactor from the bottom to the top, as well as from the back to the front wall. The colored circles of the biomass grain graphically represented as a point correspond to the colors of the curves on the graphs of parameter variation, i.e., the color is assigned to the biomass particle to better visualize its parameters changing in time. The light blue color is marked for particle no. 1 (PID 1), violet for PID 100, green for PID 200, pink for PID 300, red for PID 400, and brown for PID 510.
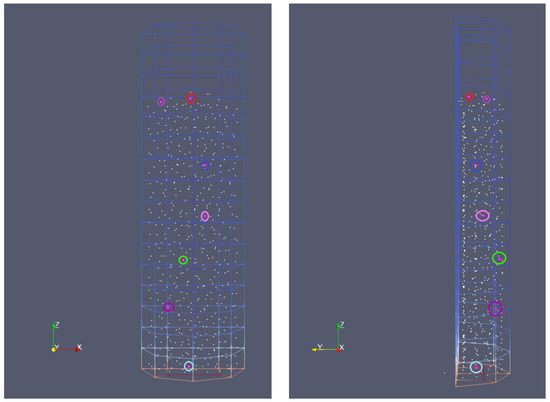
Figure 8.
Initial position of chosen particles.
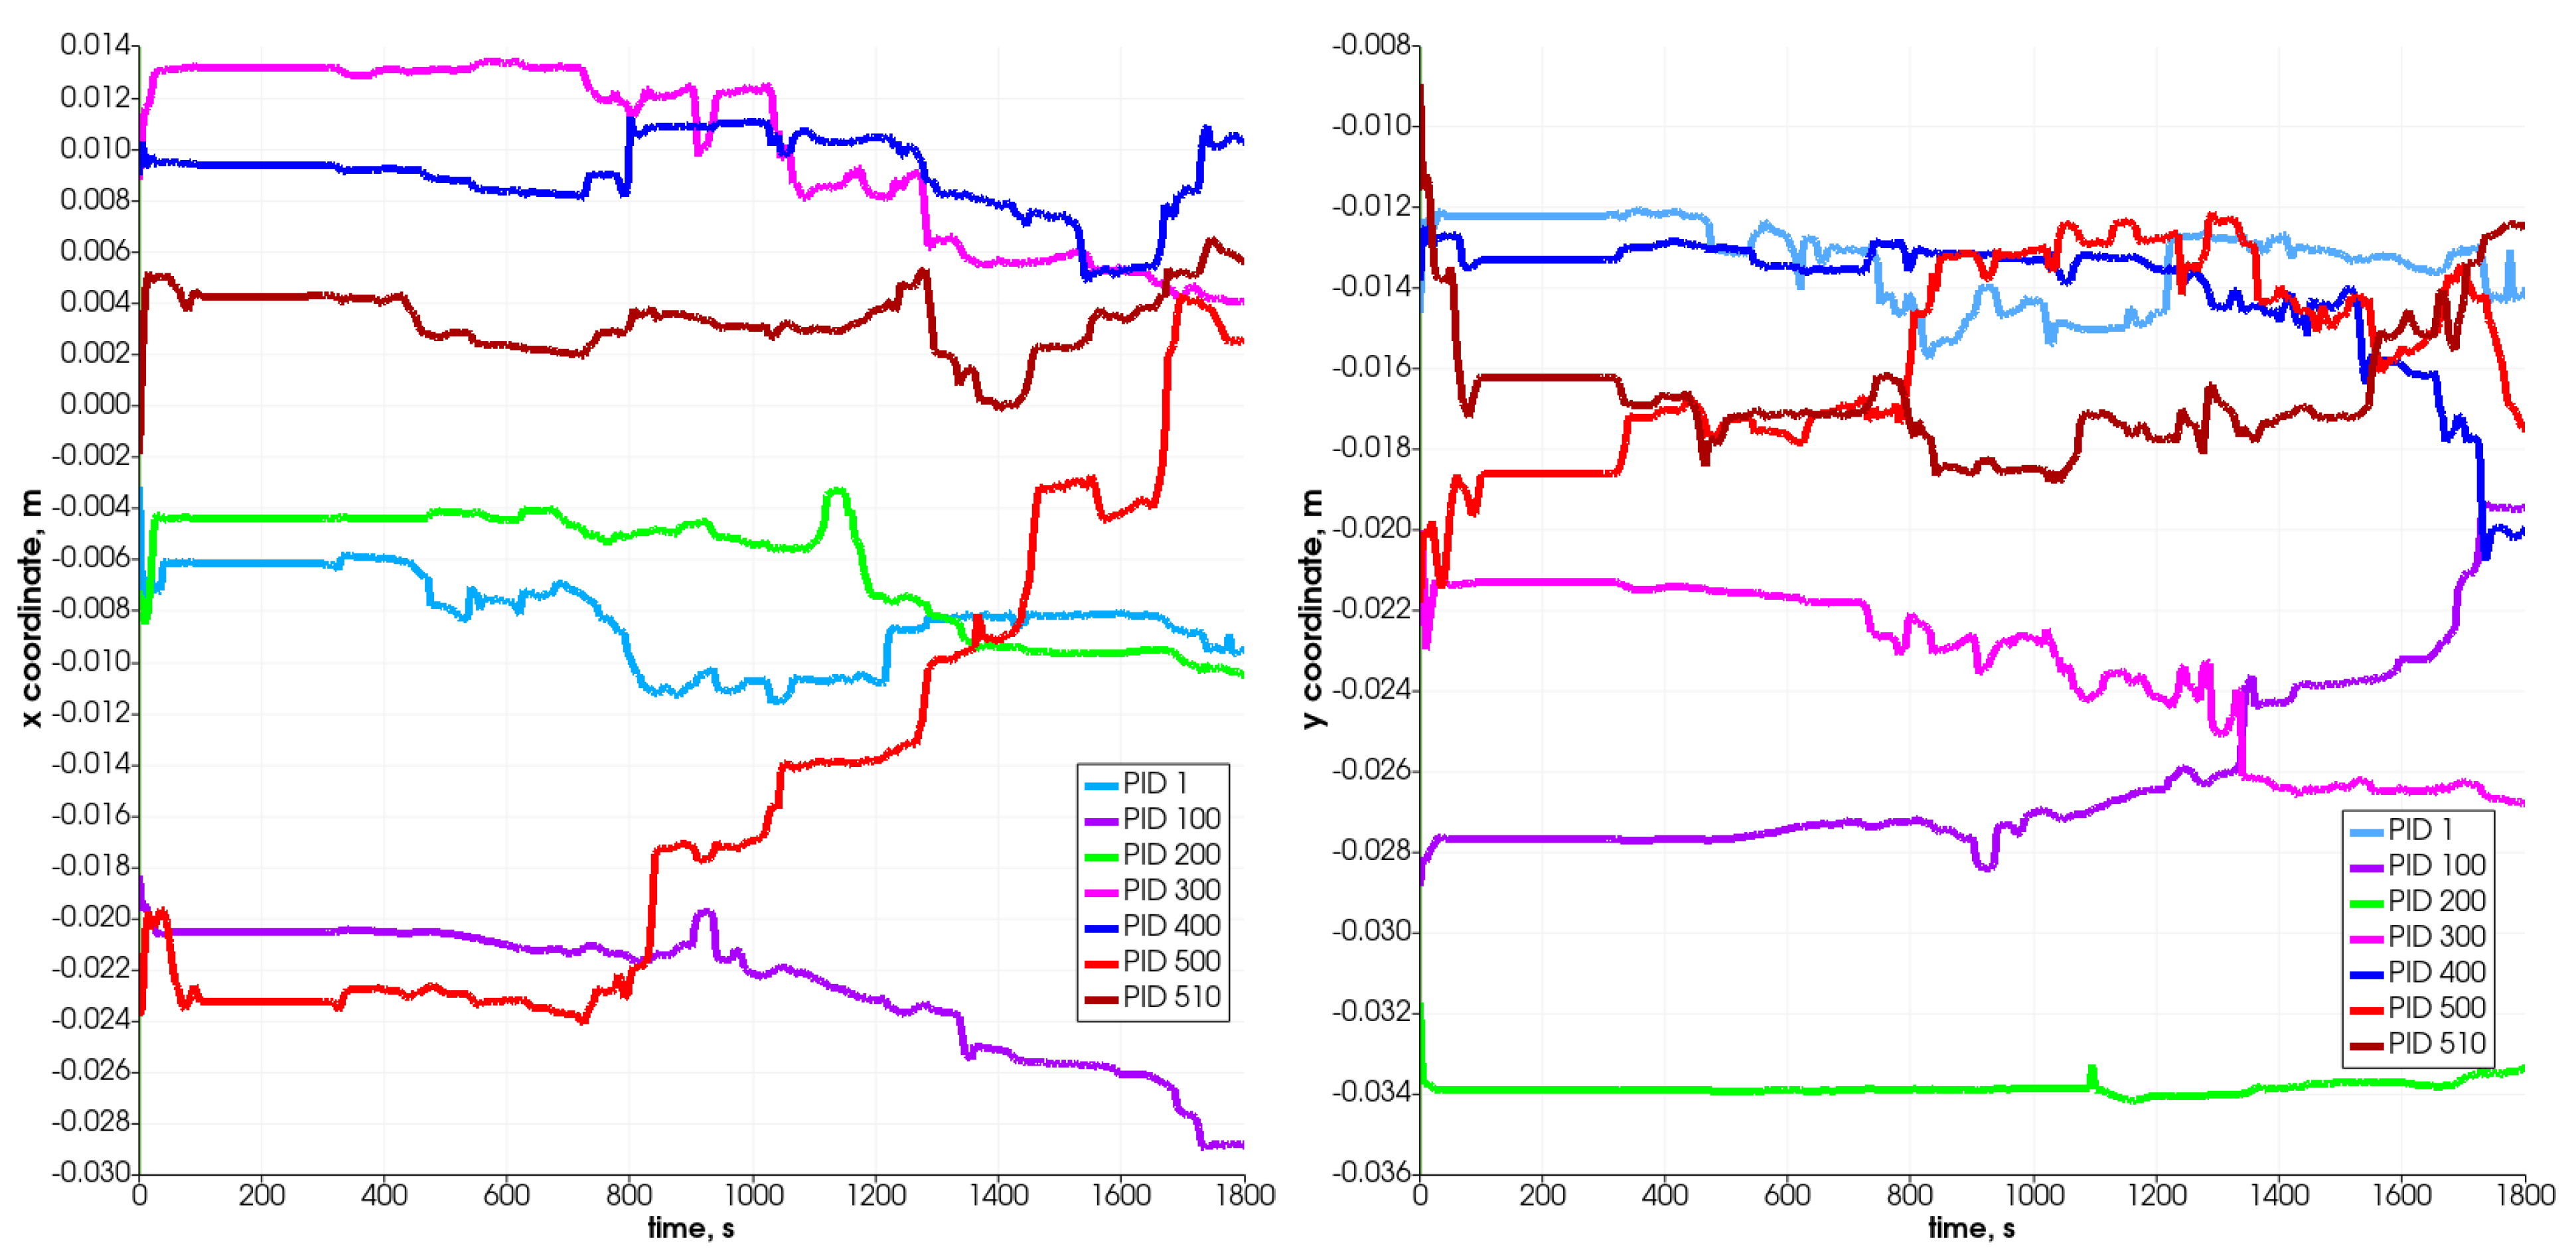
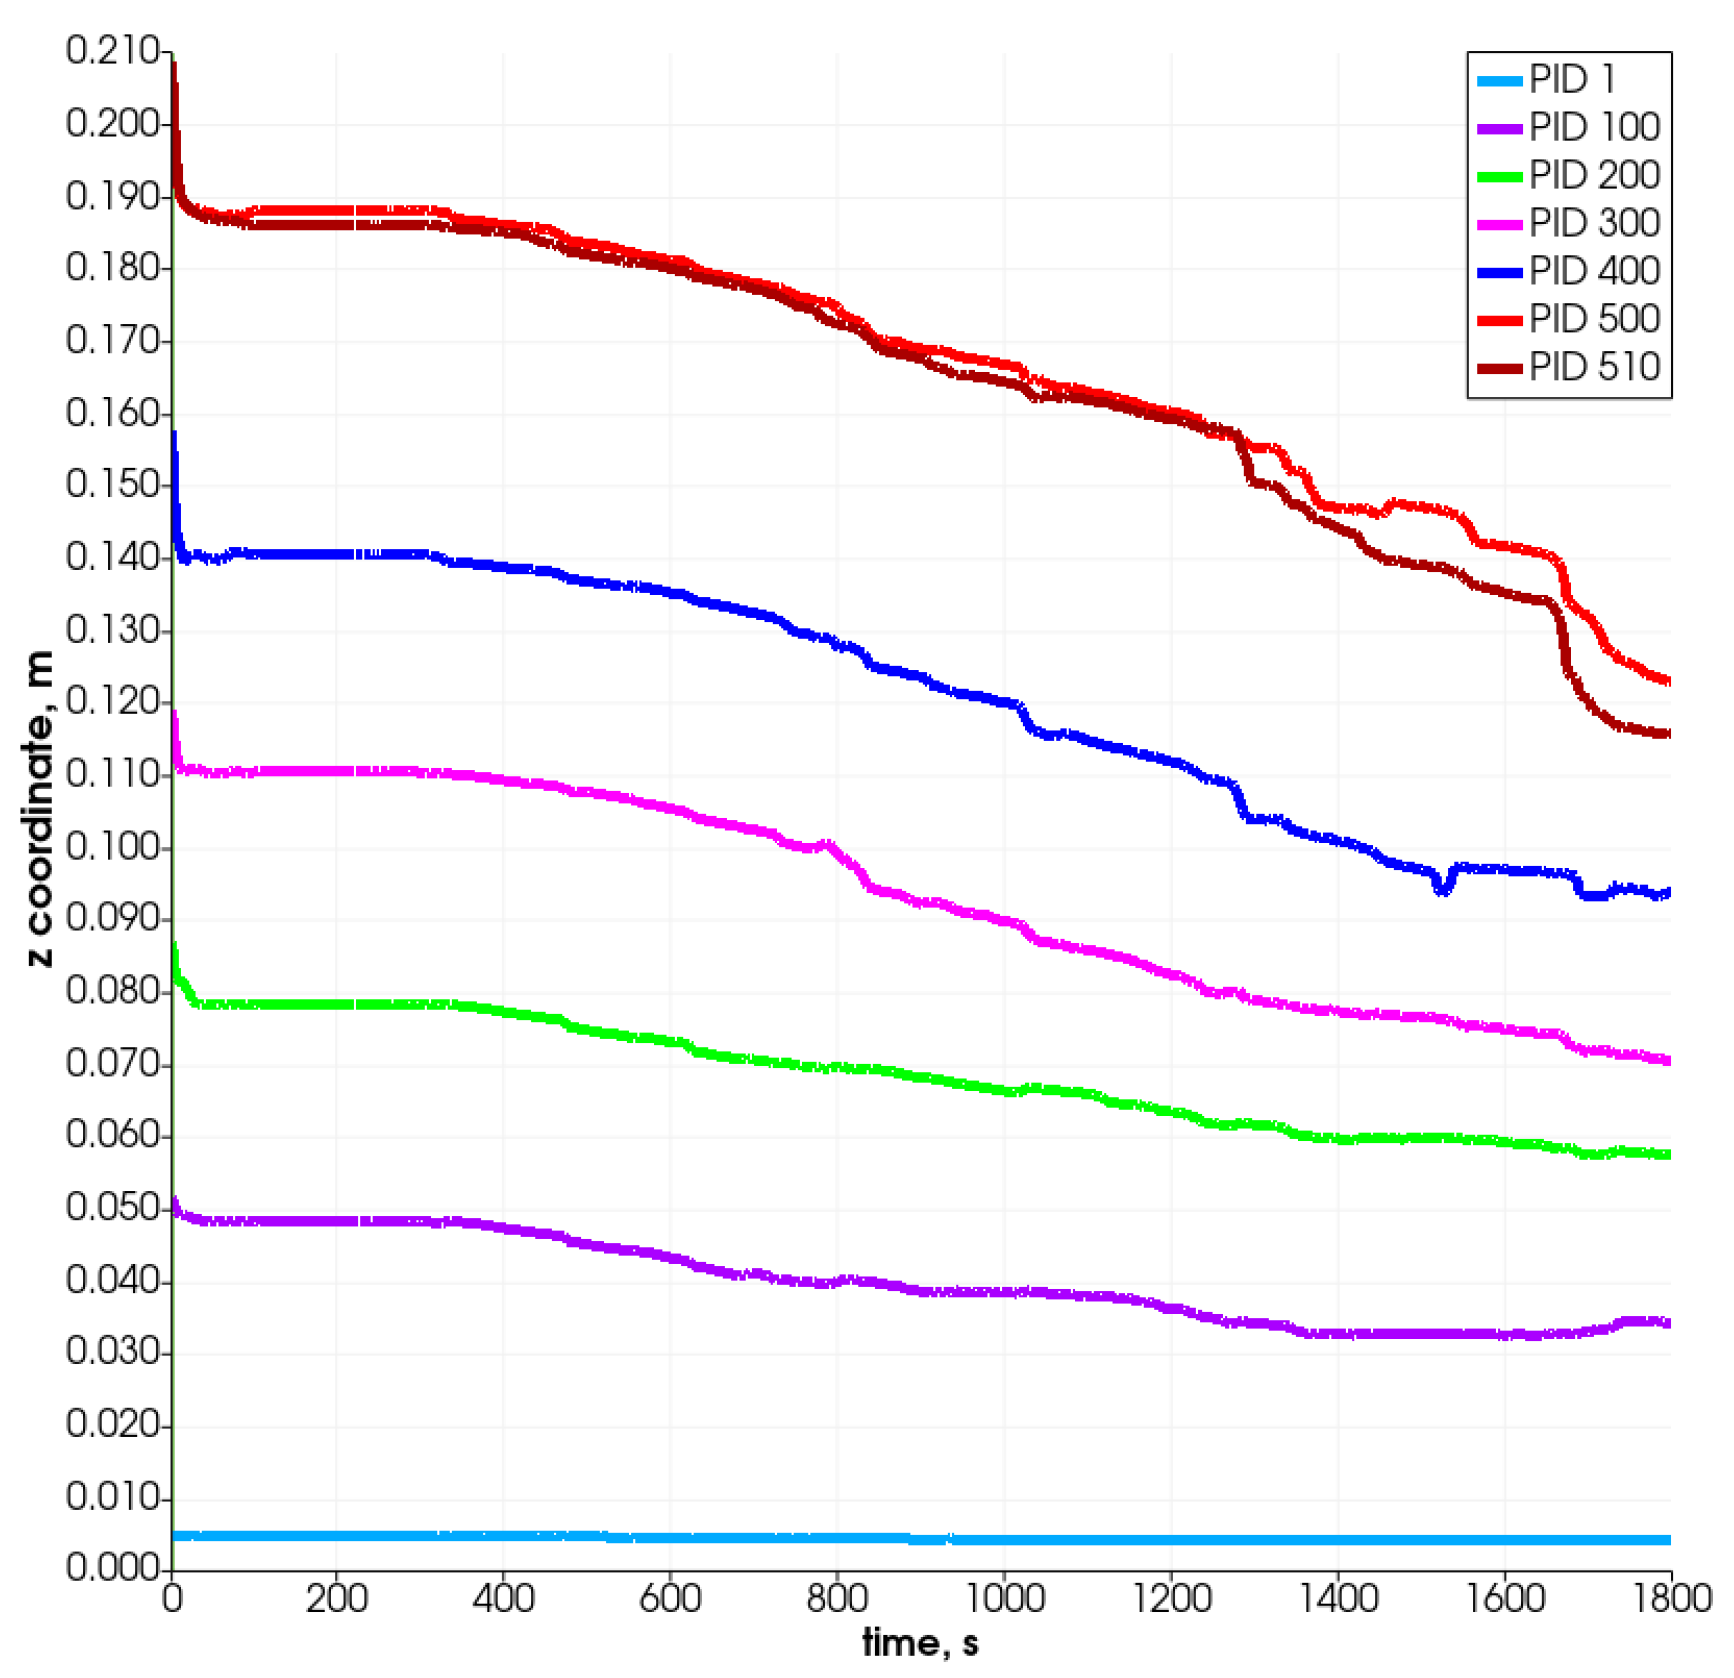
Figure 9 and Figure 10 present the changes in time in the position coordinates for selected particles. As can be seen, each of them moves down, resulting in the decrease in the value of the z-coordinate, which defines the height of the reactor. Some of them move in the plane, which is connected with the width of the reactor (i.e., from left to right according to the increase in the x-coordinate). Some change position also in the direction connected with the reactor’s depth (y-coordinate). The most visible change takes place after 800 s. The particle which is named PID 500 (red color) and located at the top of the bed moves in the Z-direction most intensely and likewise in the X-direction. It changes its position from left to right at about 28 mm (the radius of the reactor equals R = 40 mm), i.e., what stands for over 50% of the reactor’s radius. The particles that are located at the bottom do not change their position in the vertical direction visibly, and only slight horizontal movements are observed.
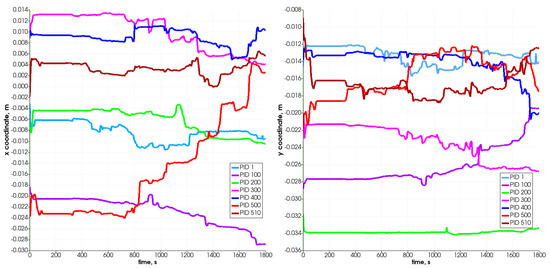
Figure 9.
Position of selected particles in X (left) and Y (right) direction.
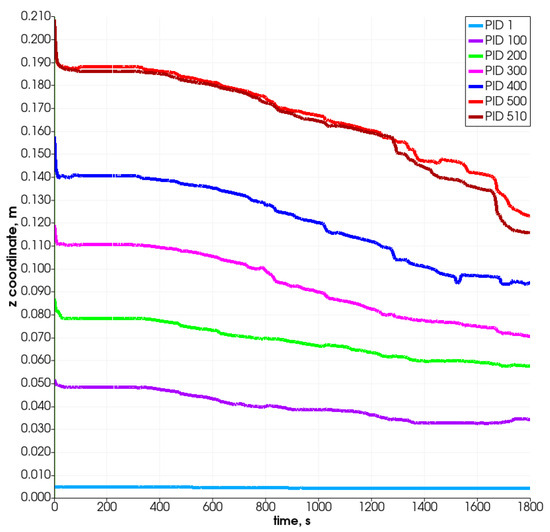
Figure 10.
Position of selected particles in Z direction.
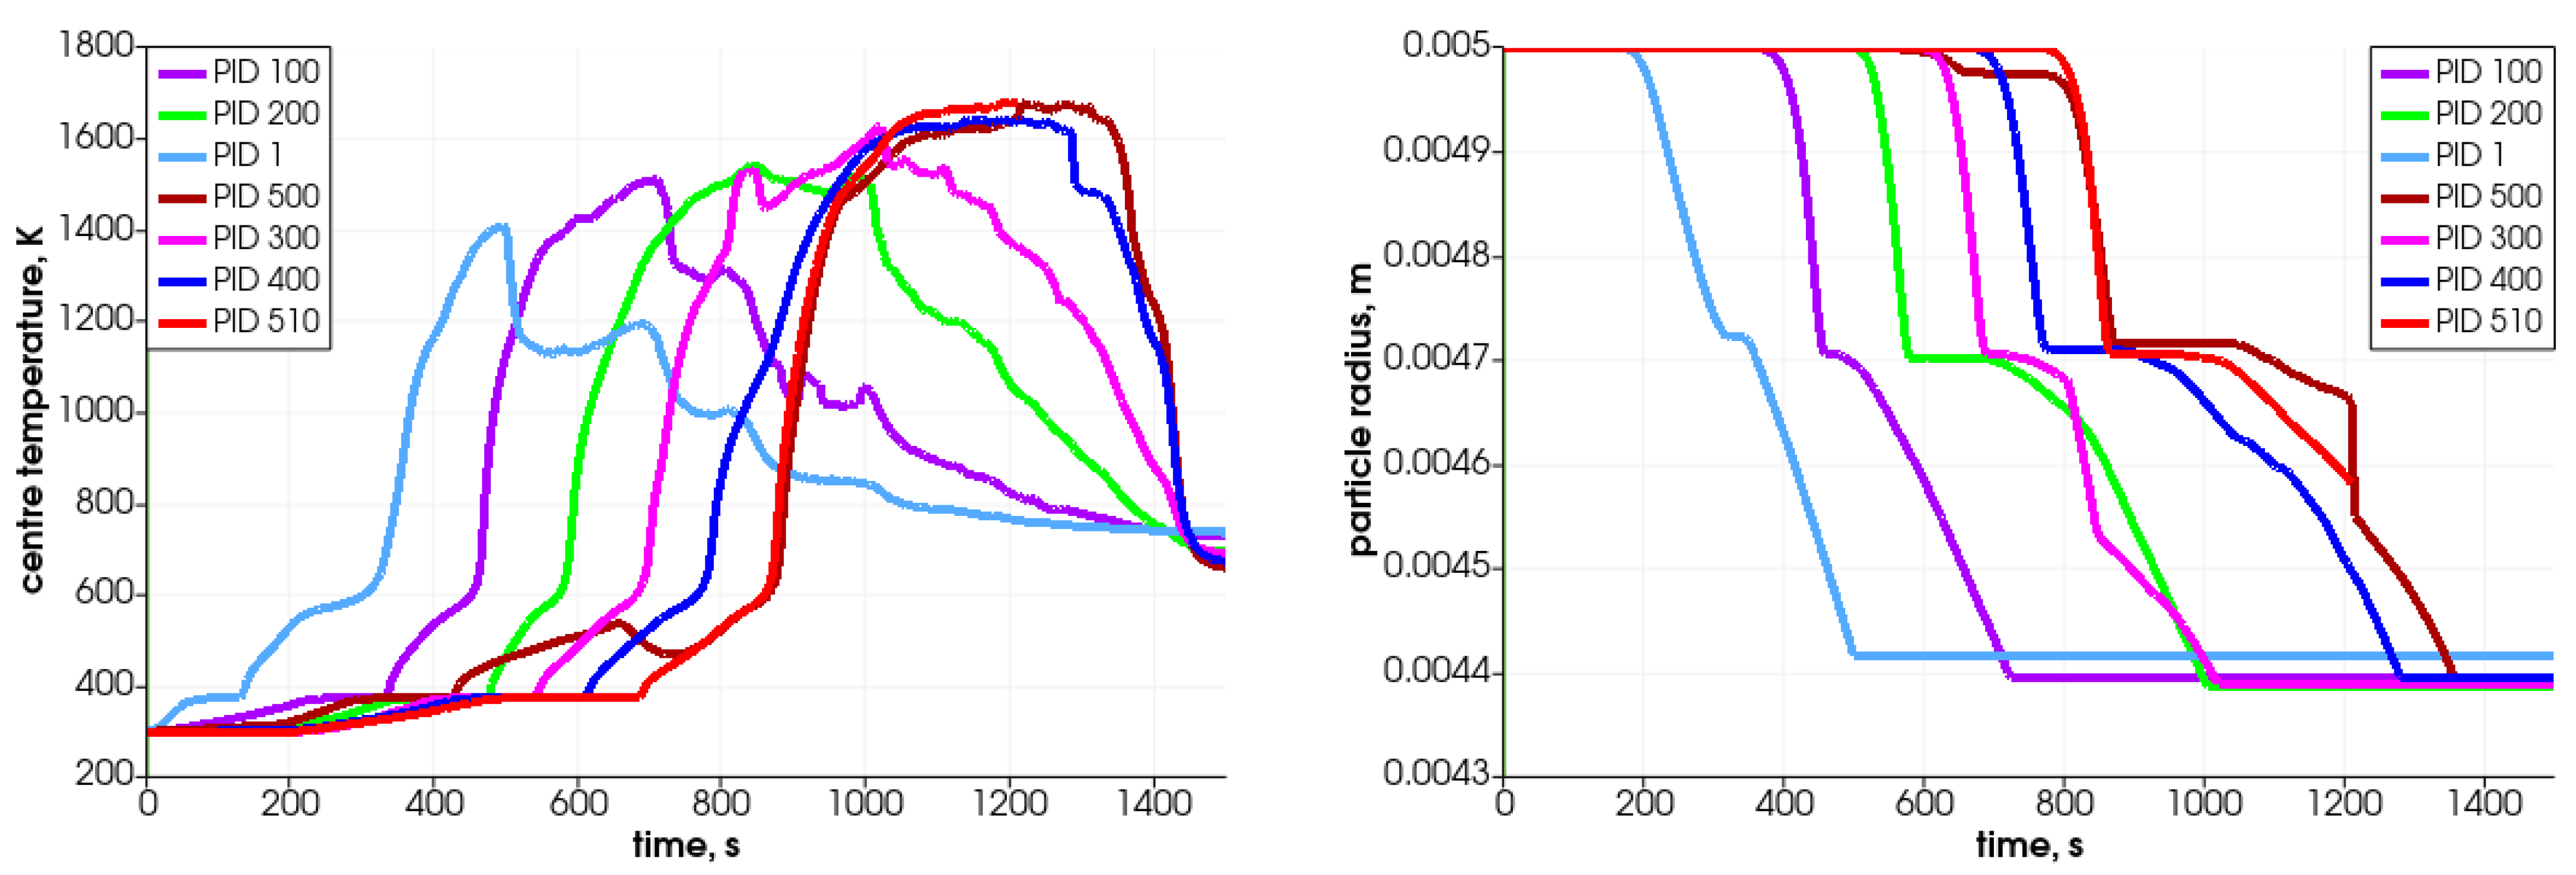
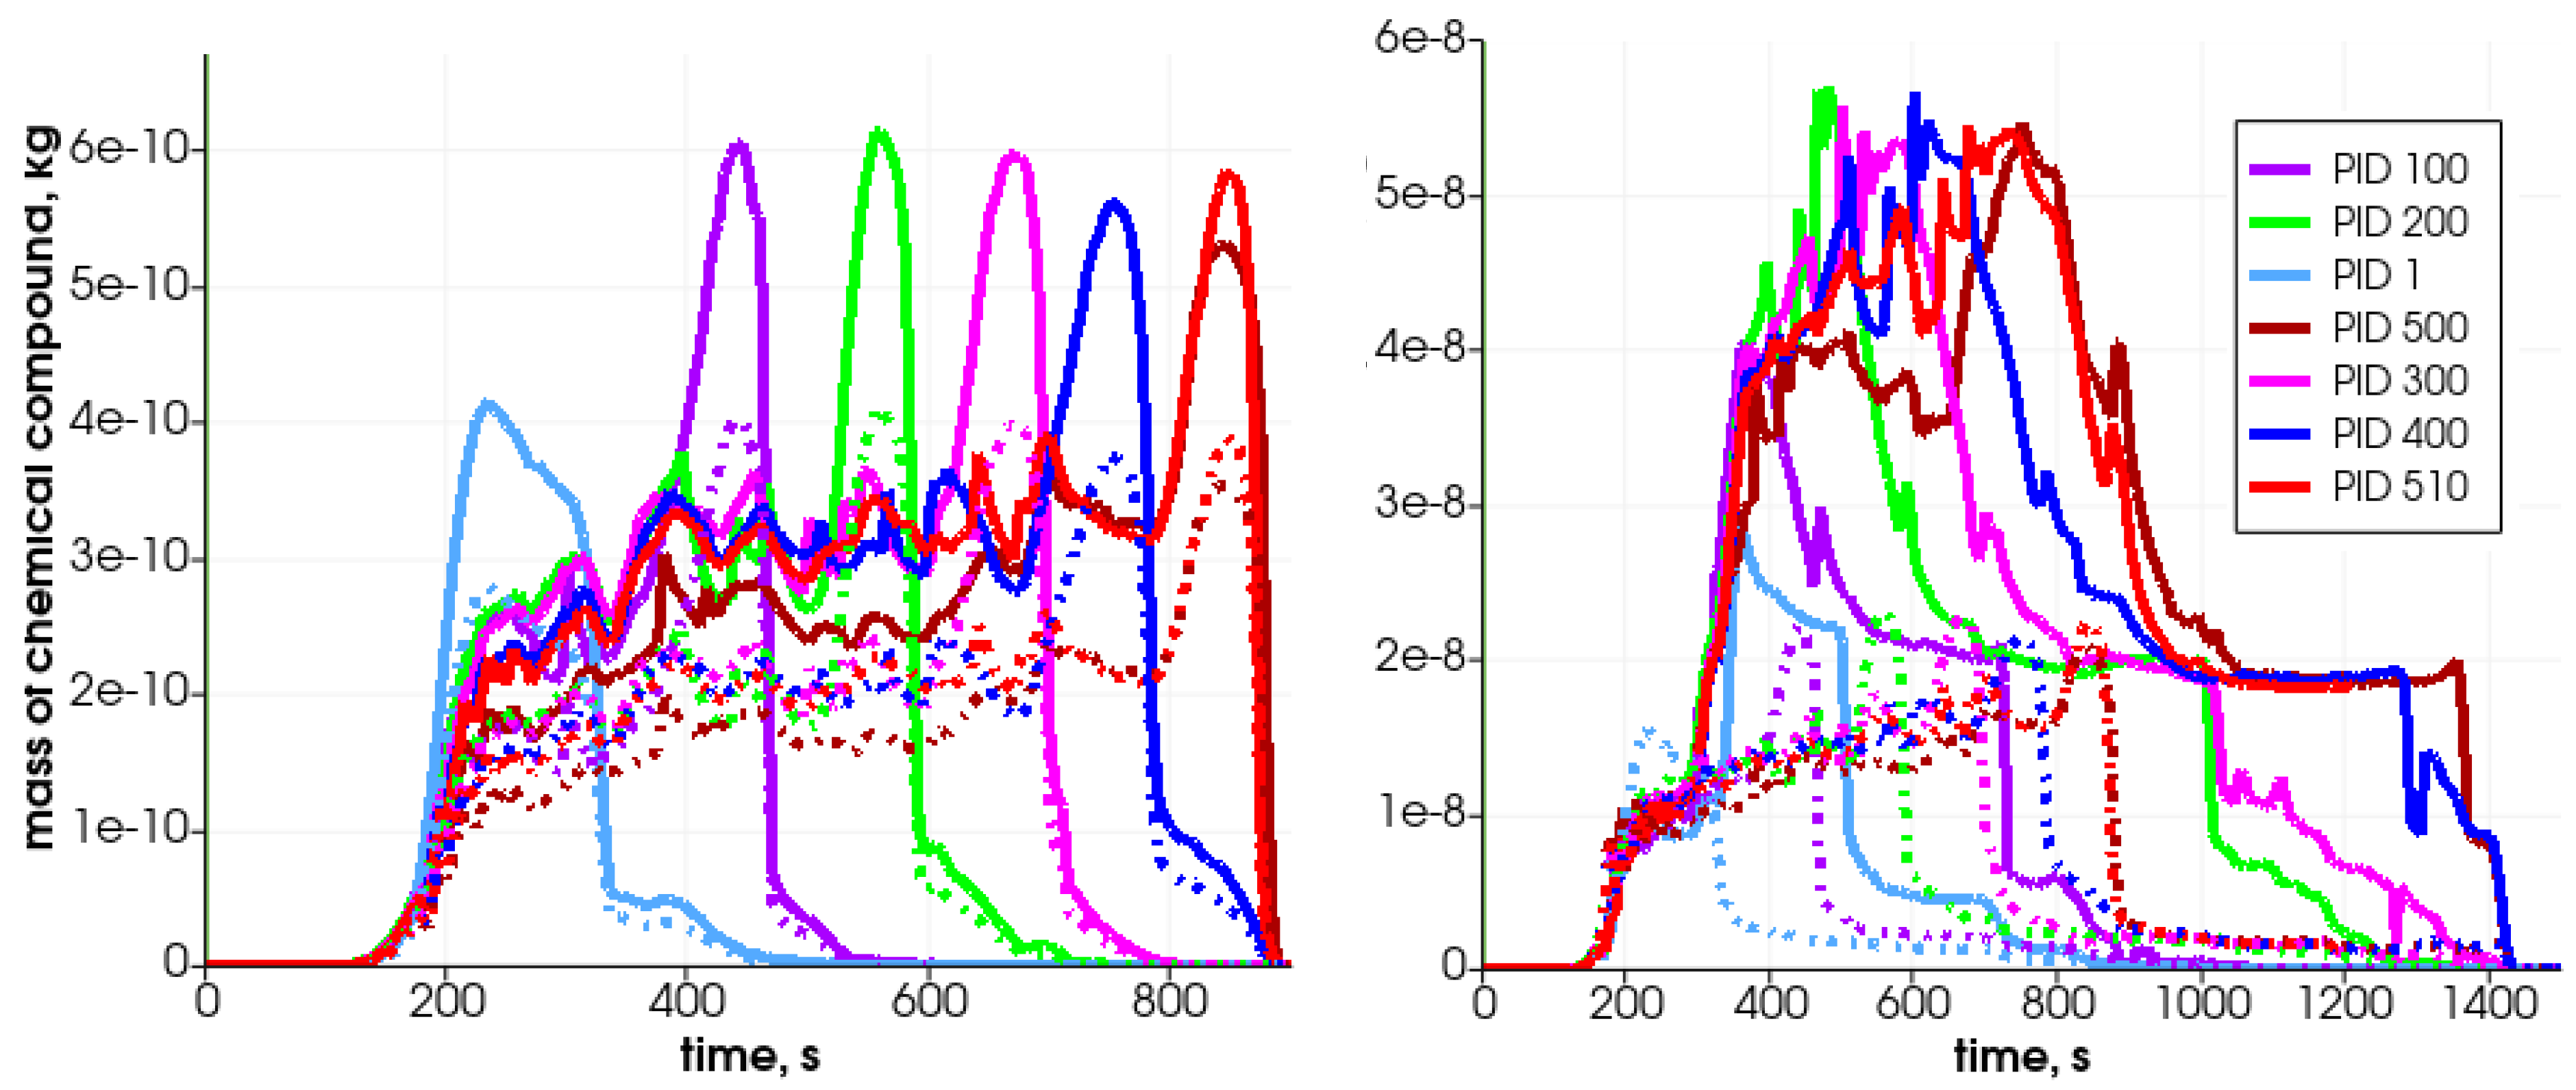
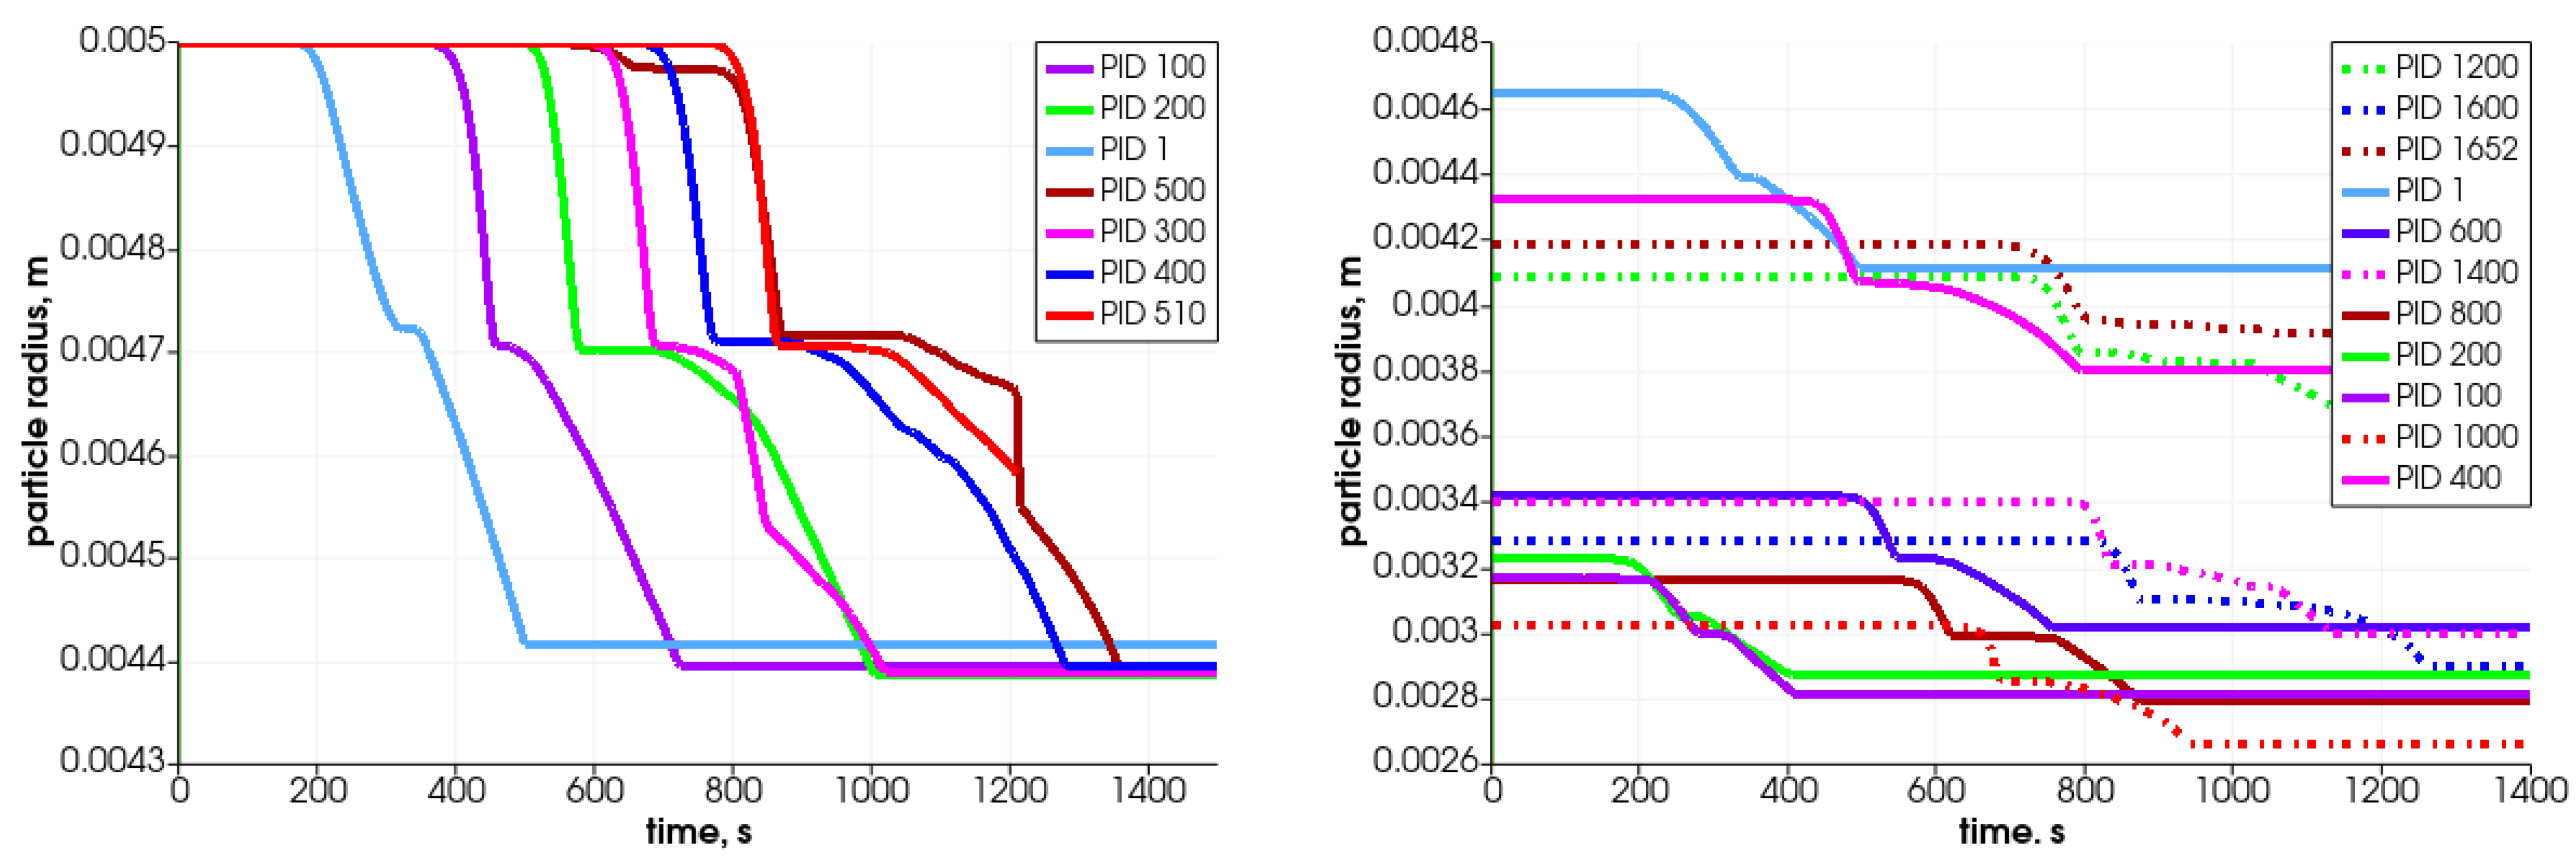
In Figure 11, the particle’s central temperature change distribution and particle radius variation in time for the specified particles are shown. Due to heat transfer from the surrounding hot air, the temperature increases, and after passing the front it decreases.As can be observed, the lowest-positioned particles are heated earlier (left graph); consequently, they change their diameter faster. The diameter decreases due to the moisture evaporation, devolatalization, and combustion of char. The duration of those processes can be defined based on the temperature and chemical compound distributions (Figure 12 and Figure 13). For a particle named PID 1, the heating takes around 25 s, and the moisture evaporates after 150 s (see Figure 13 with H2O(L) compound); the devolatilization characterized by the char production ends at 300 s and the char reduces at 500 s (see Figure 13 with Char(S) compound). The last stage is the gasification/combustion phase. The same can be determined for other particles; the obtained data are presented in Table 4. From these data, the duration times of each thermal stage taking place at each particle are calculated and collected in Table 5.
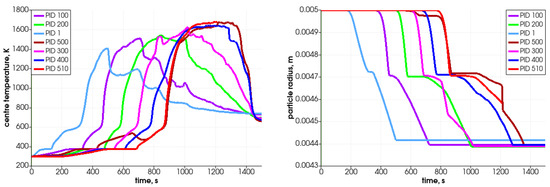
Figure 11.
Particle’s central temperature distribution (left) and particle radius variation in time (right) for selected particles.

Figure 12.
Porosity changes (left) and char, water content (right) in the selected particles during heating.
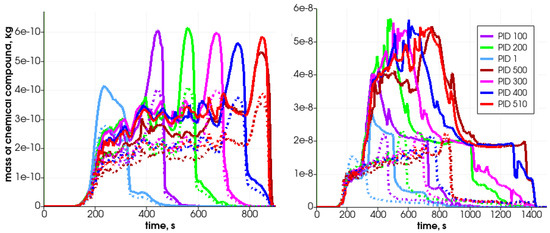
Figure 13.
Mass of chemical compound ((left)—solid lines), ((left)—dashed lines), ((right)—solid lines), and ((right)—dashed lines) in the generated gas mixture in selected particles during heating in the simplified analyzed reactor.

Table 4.
Timeline for different stages of the biomass thermal conversion.

Table 5.
Obtained duration times for different stages of the biomass thermal conversion.
Analyzing the tabulated data, it can be observed that the particles that are located lower decompose faster, which results from the propagation of the temperature front. Moreover, the particles behave similarly, as can be concluded from the attached graphs depicting the time-variation parameters. Each curve is shifted in time, which is associated with the propagation of the temperature in the bed in the direction from the bottom of the reactor toward the top. The PID 500 particle, located at the top of the bed in the initial stage, behaves a little differently from the other particles. In this case, its decomposition time is prolonged (almost twice compared to the other analyzed particles), which is caused by the movement of this particular particle. Namely, during bed settling, this particle falls into a lower temperature area, so its temperature decreases (see Figure 11, time 650 s); therefore, the decomposition process is slowed down. This is in accordance with the previous authors’ analysis concerning the heating of particles in a variable temperature field [48].
Due to solid fuel particle devolatilization and char production, the particle’s porosity increases (Figure 12 left graph). The dynamics of the pyrolysis gas generation is presented in Figure 13. It can be seen that the gases are released from the particle after water evaporation. , , and are produced in the first stage of the process, while is generated later.
7.6. Different Particle Sizes
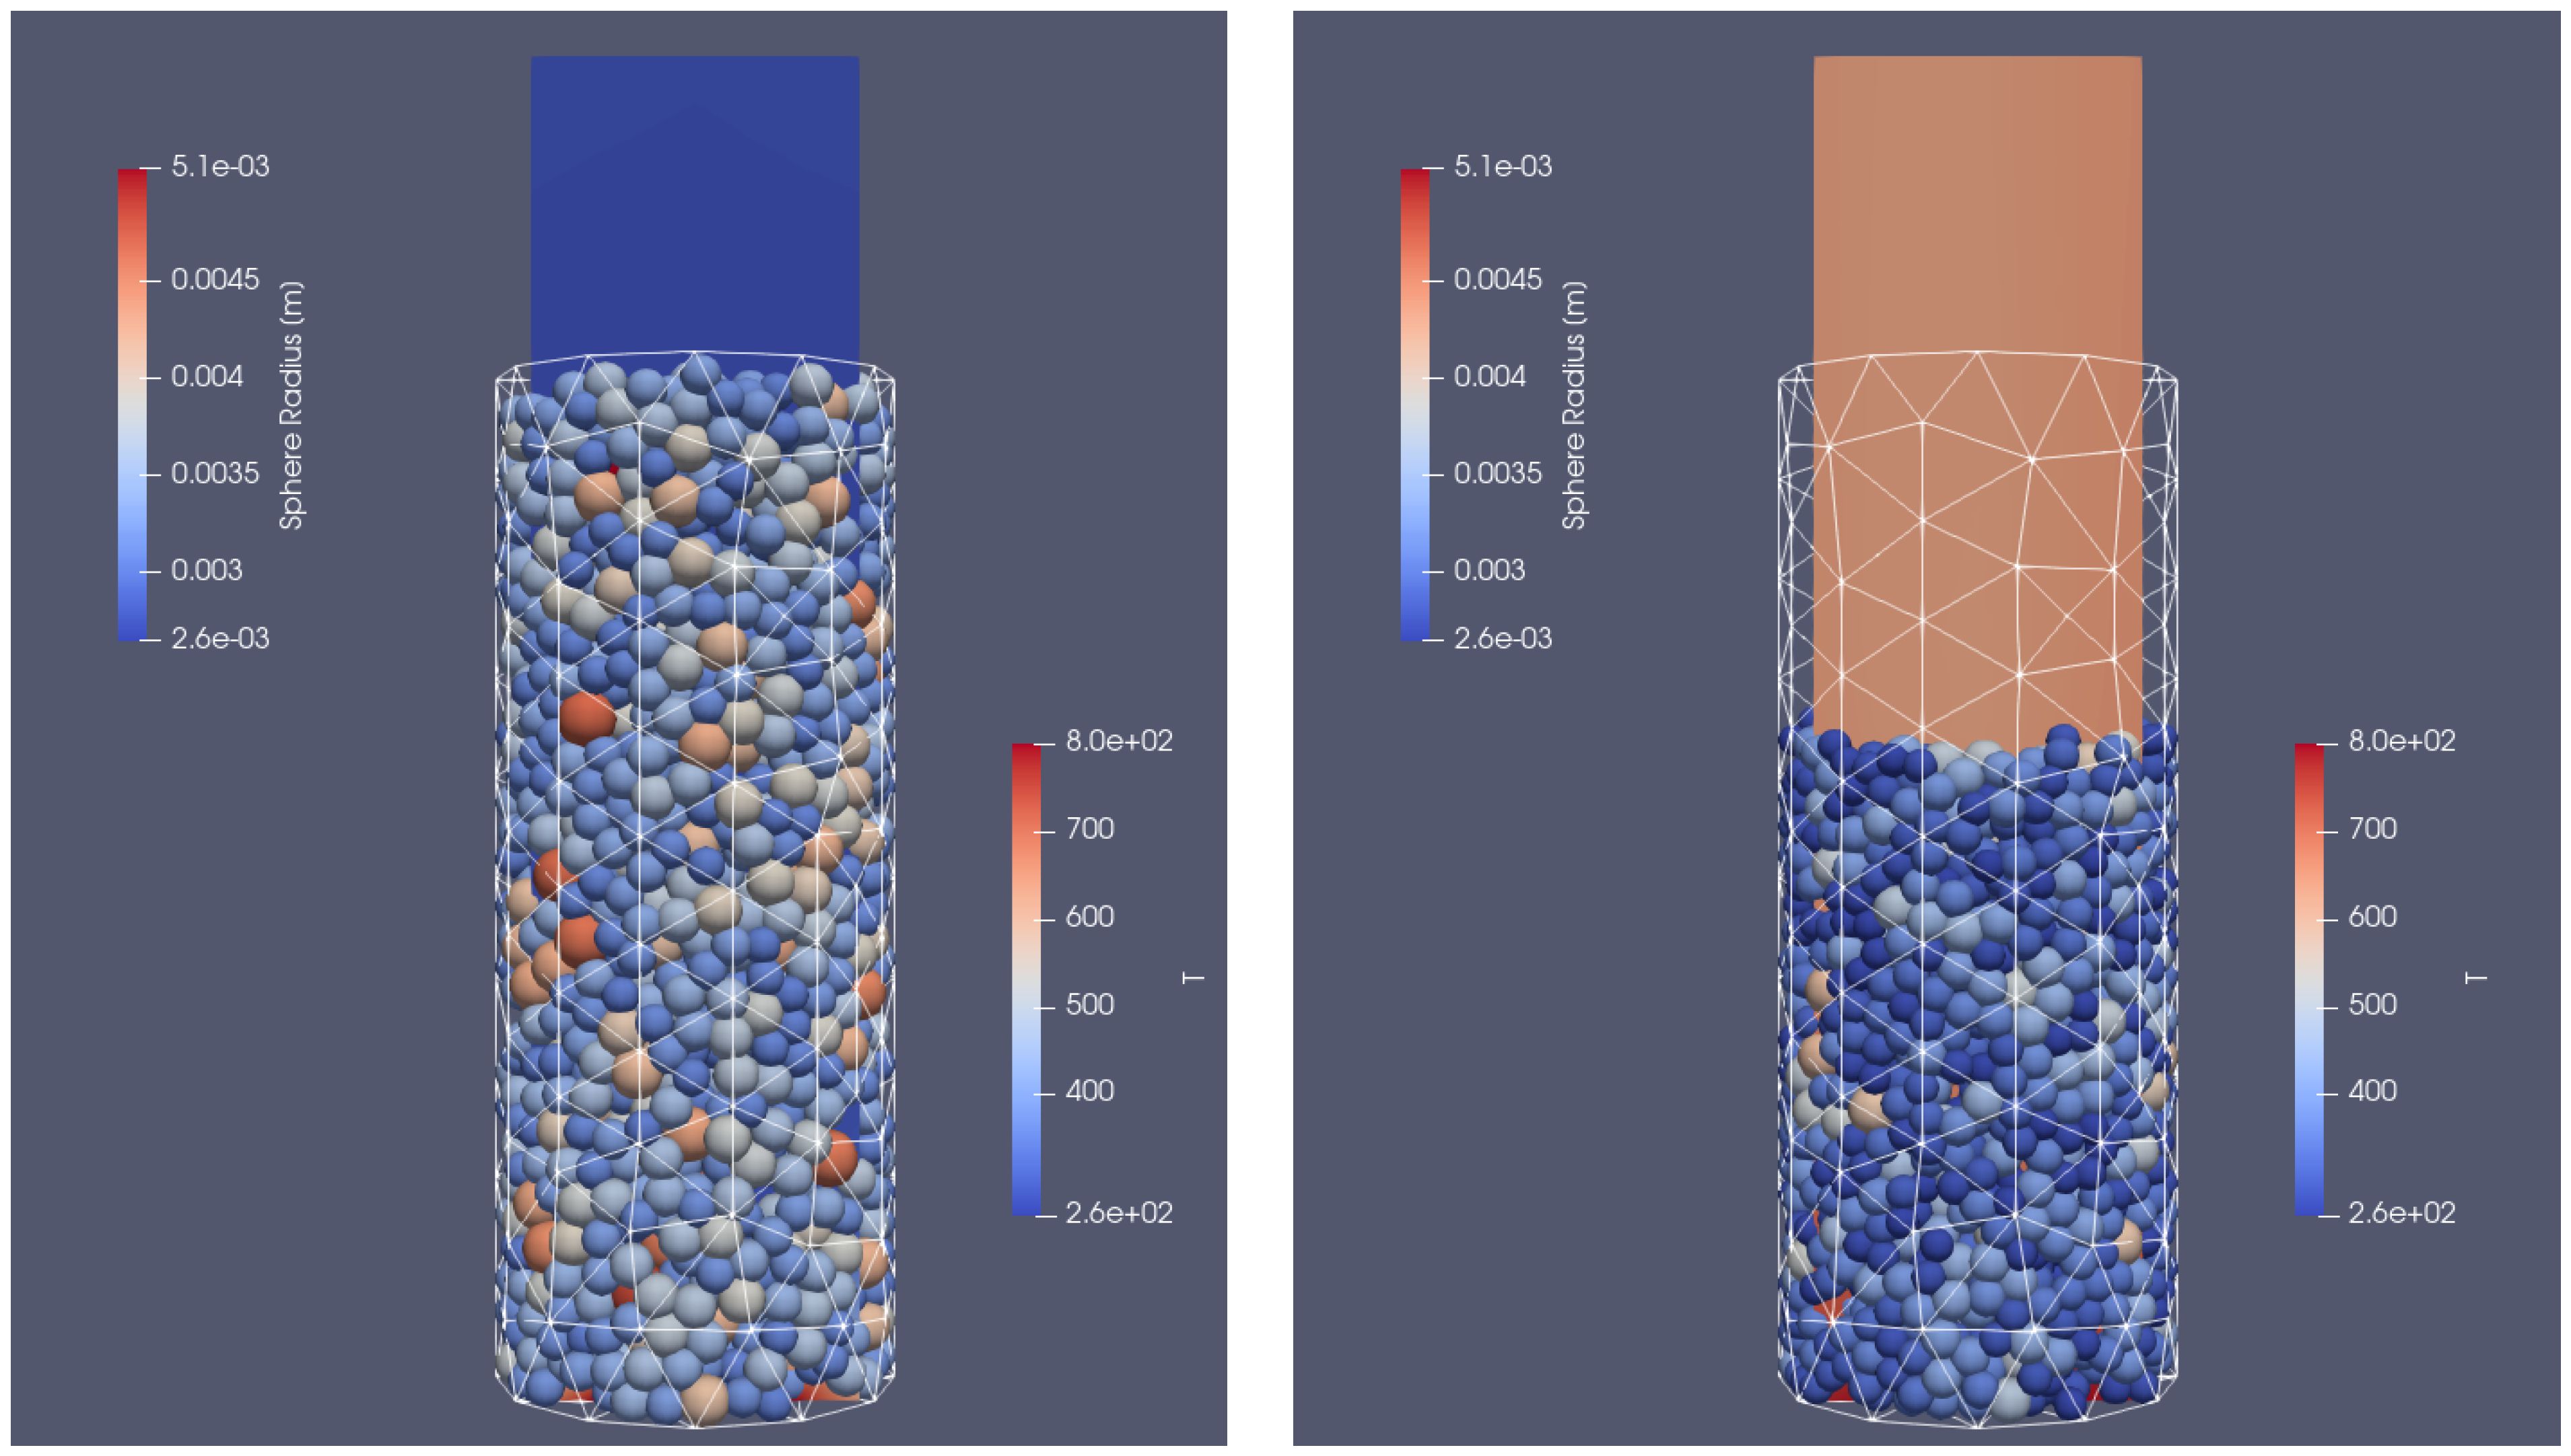
The next step was focused on the simulation of the bed of particles of different sizes. The geometry and the initial parameters for the computation were the same ( K, m/s). The random particle distribution was taken into account by varying the diameter of particles from 6 mm to almost 9.5 mm. This led to the filling of the reactor with 1652 biomass sphere particles. In Figure 14, the initial (left picture) and the final (right picture) position of particles in a fixed-bed reactor are shown. As can be observed, the height of the bed shrunk by 1/3 as a result of biomass particle mass and shape change.
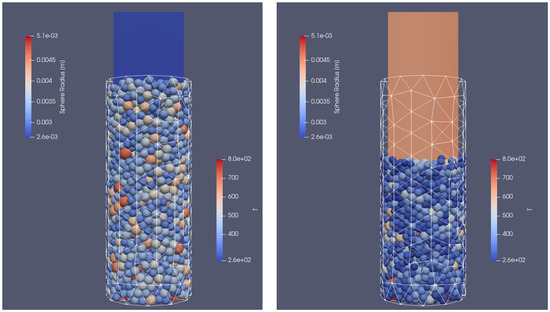
Figure 14.
Initial (left) and final (right) position of the particles.
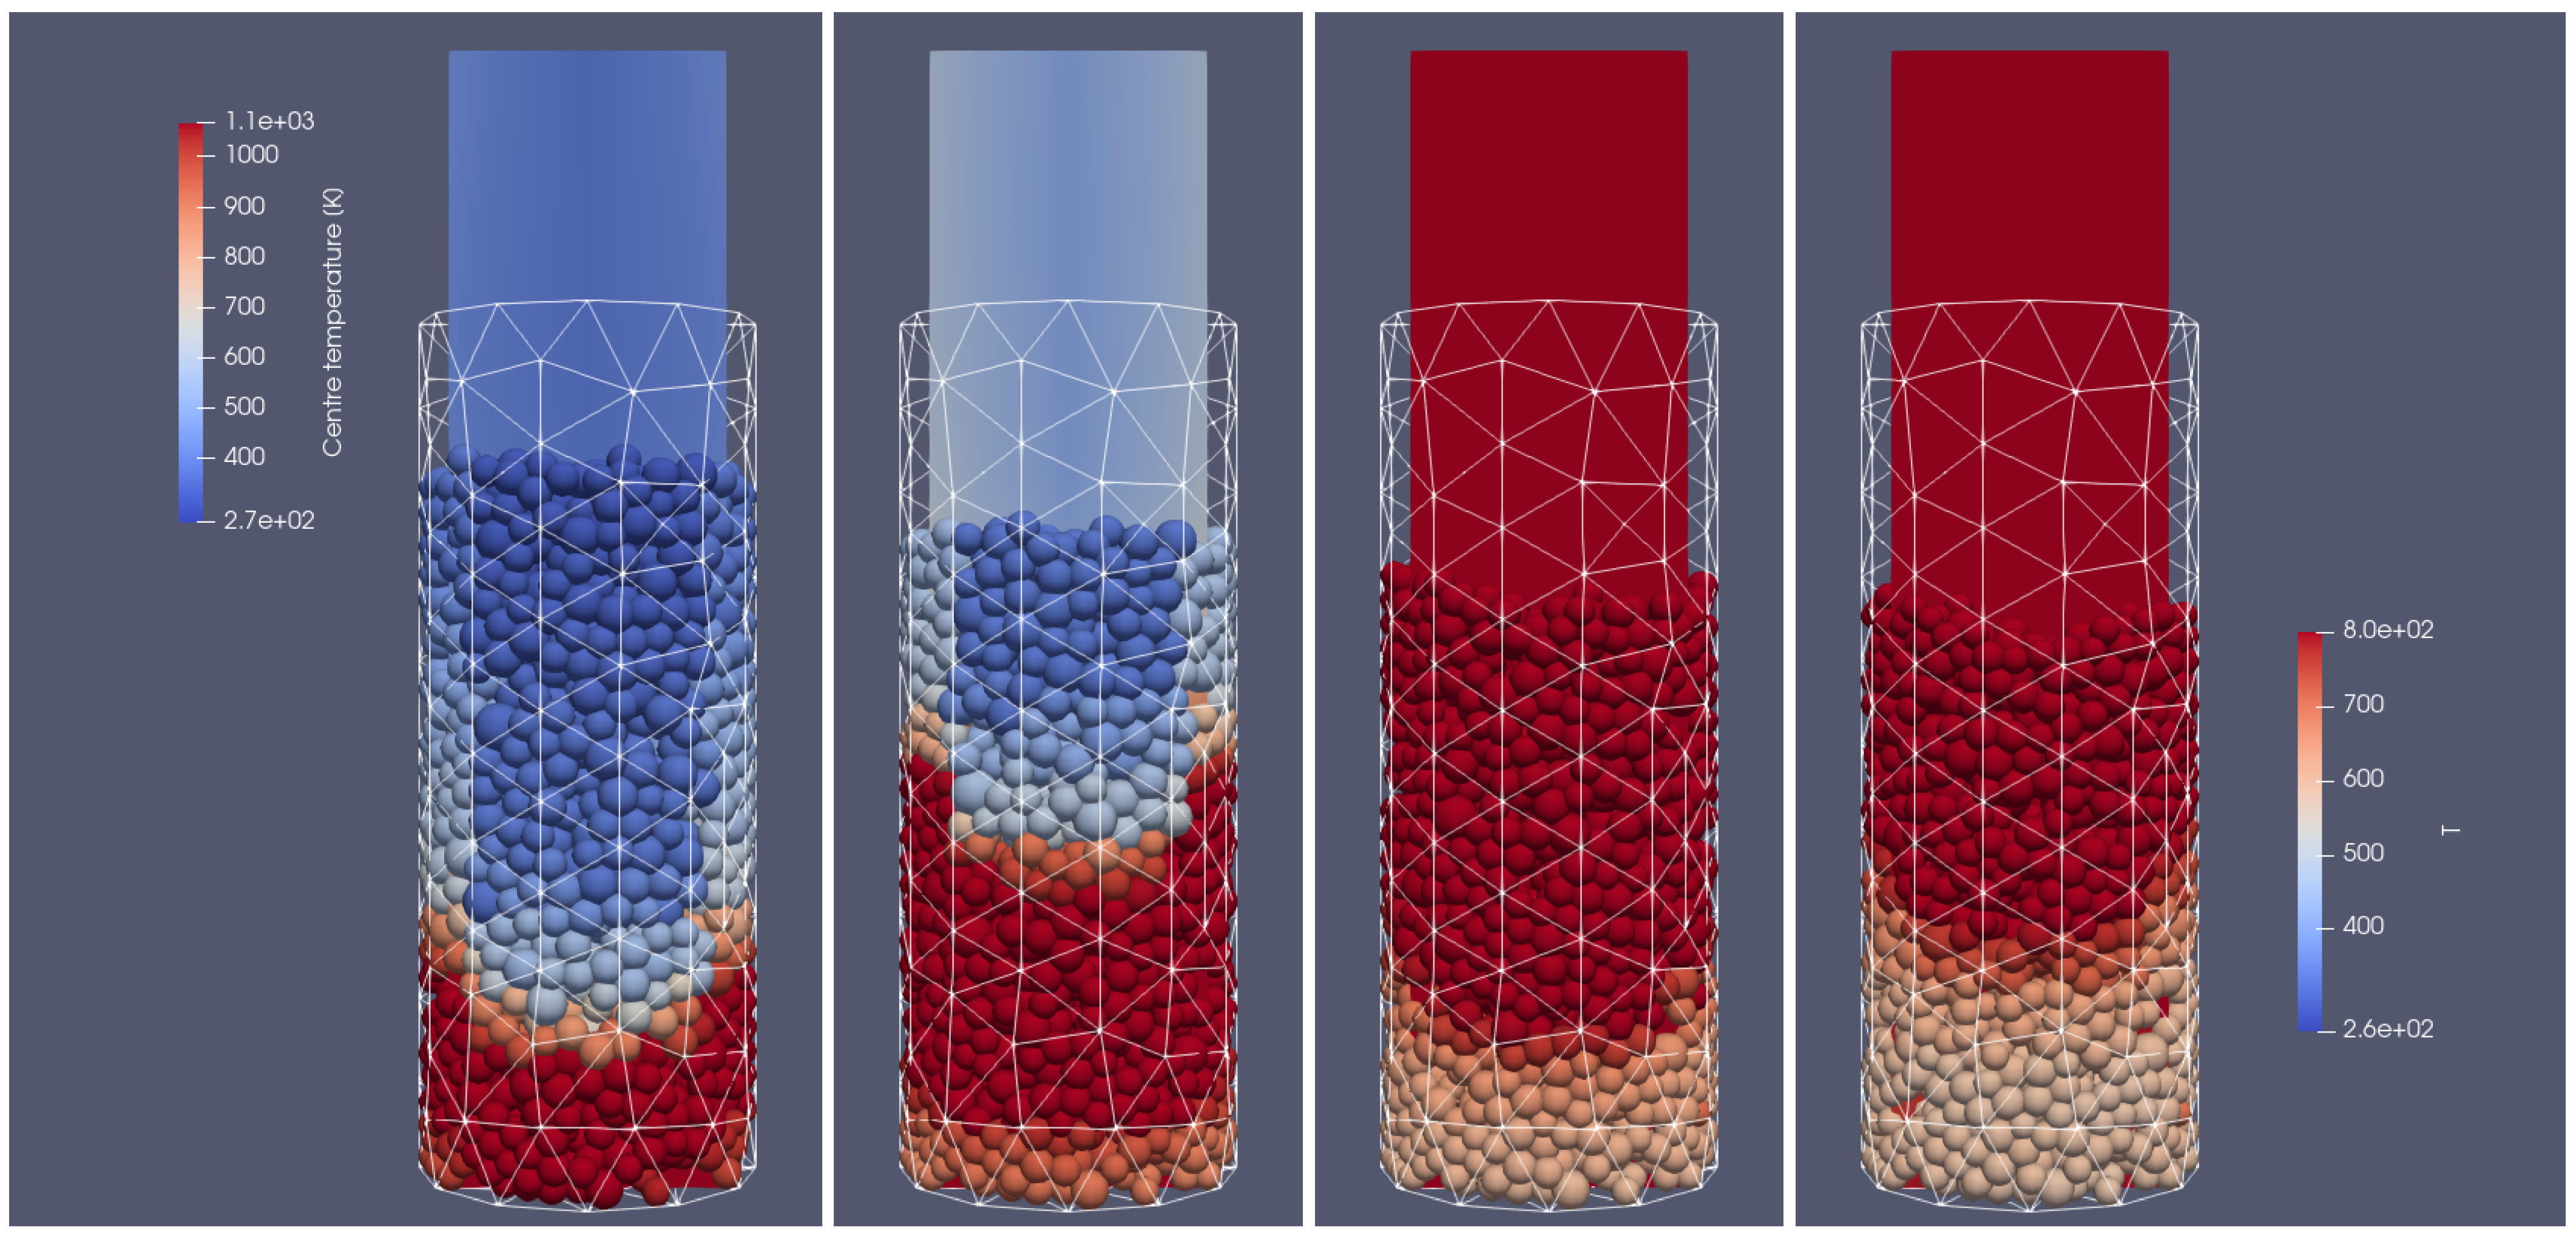
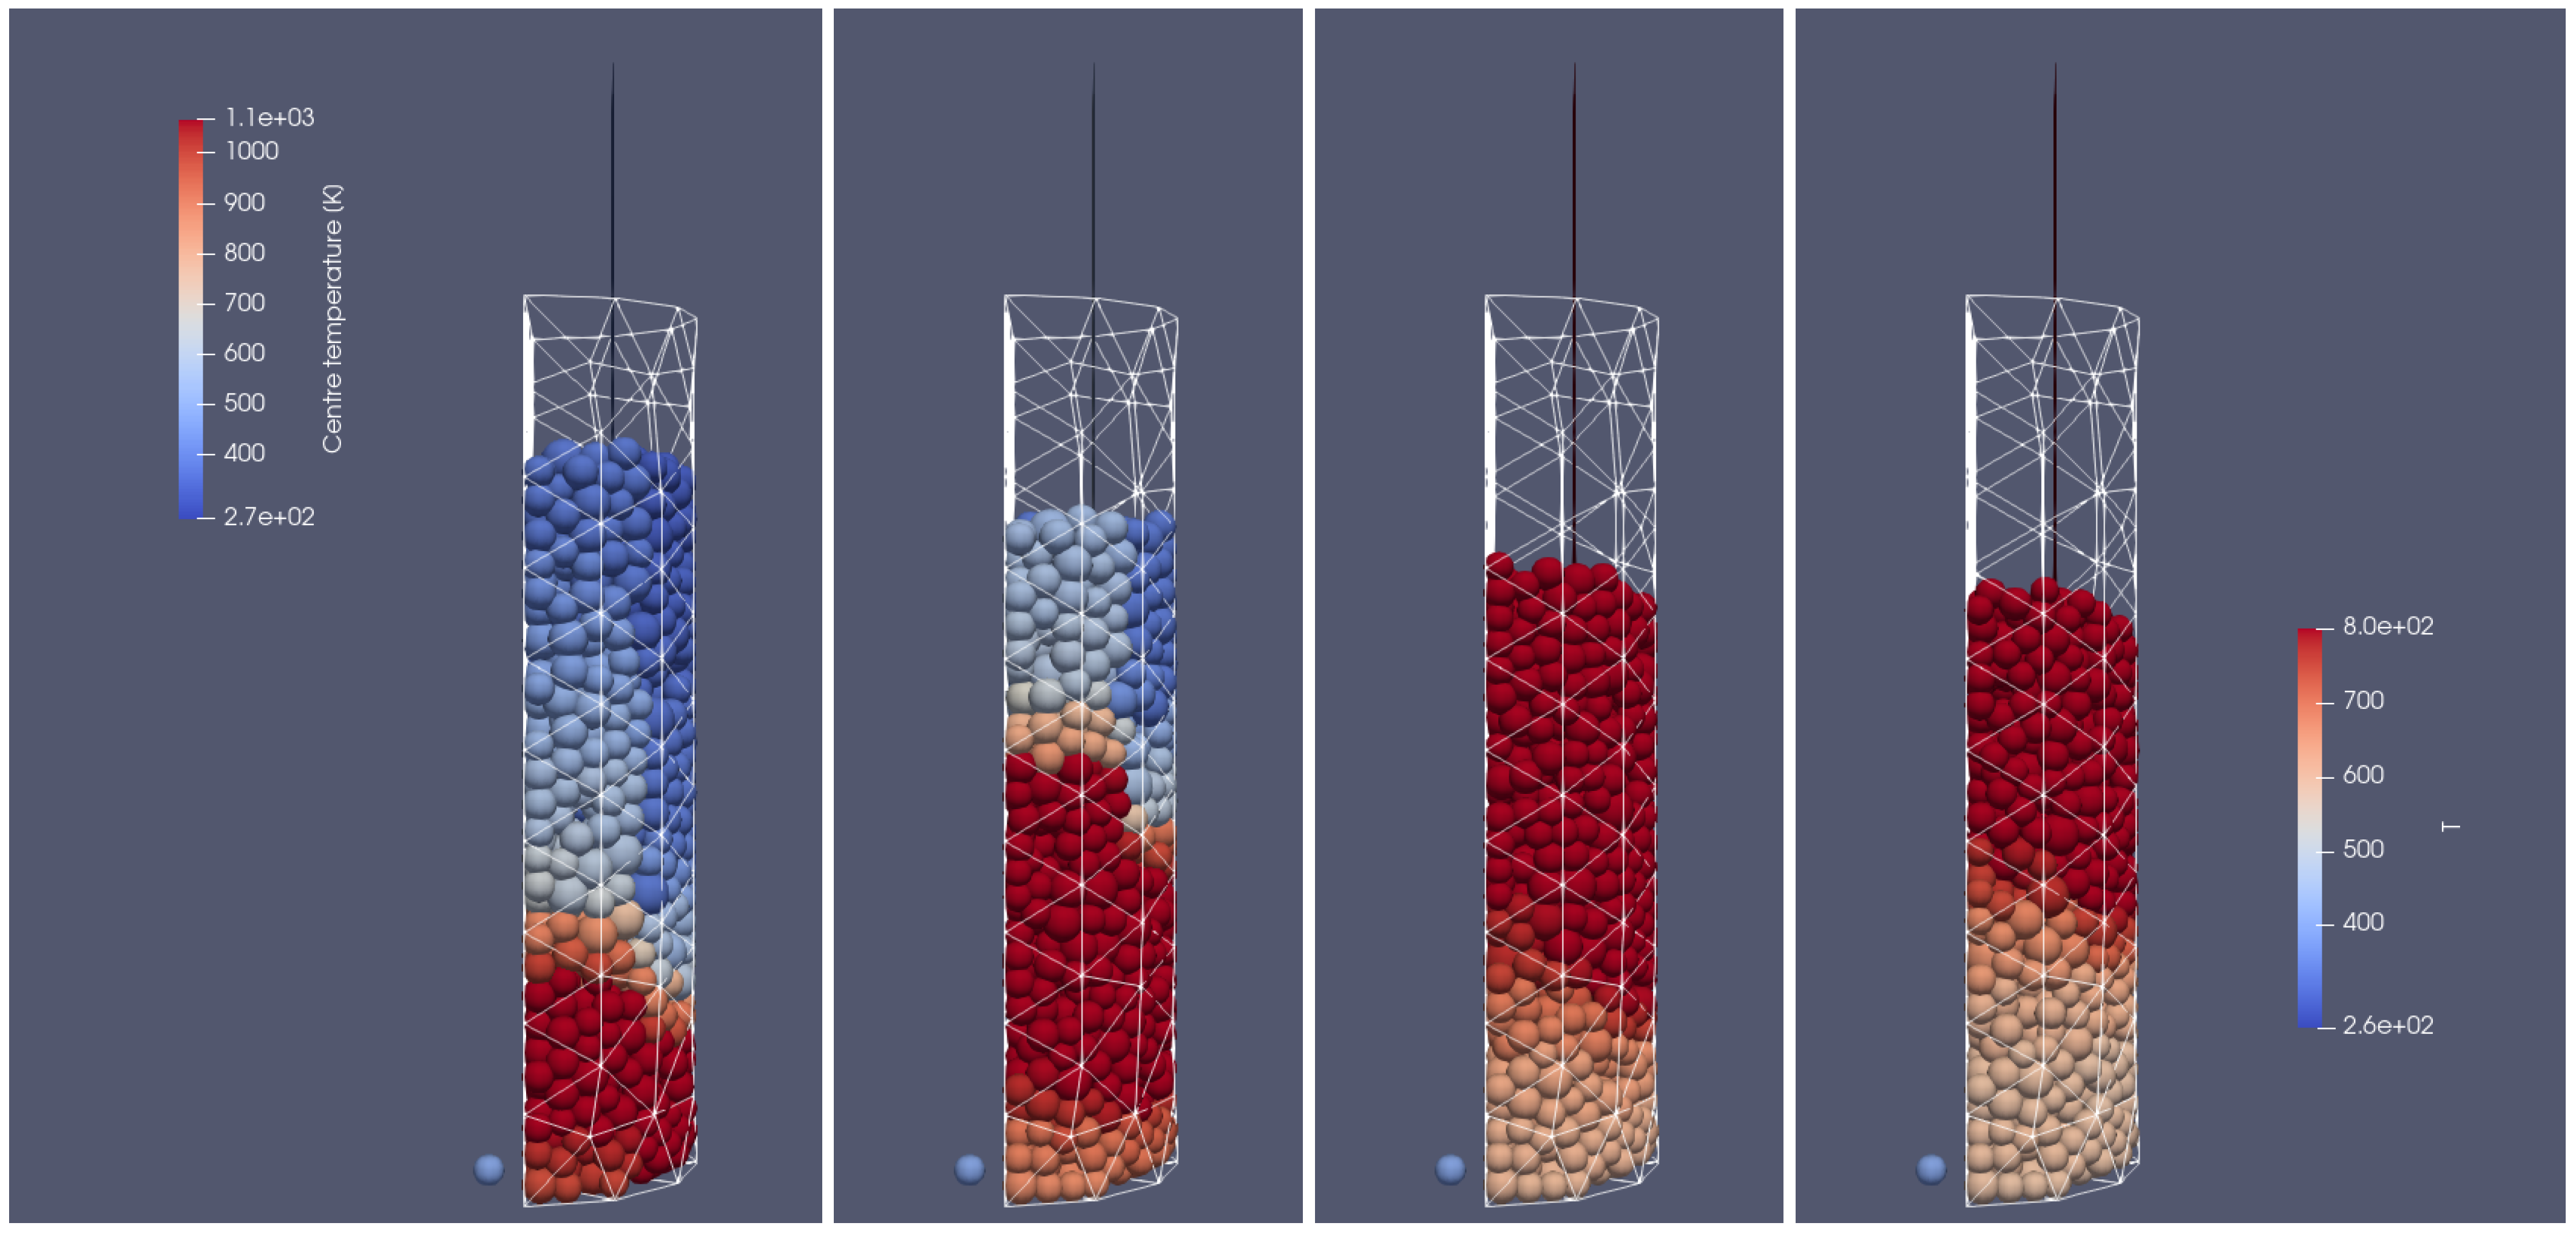
Figure 15 and Figure 16 illustrate the propagation of the heating front. The hot oxidizer flows into the reactor from the bottom heating the particle bed. Due to the oxidation reaction between the combustible gases, the temperature of exhaust gases increases. The visible change in the height of the bed can be observed as a result of the particles’ mass loss during their thermal conversion. Also, in this case, the influence of the reactor geometry on the heat and mass transfer is visible. The walls affect the flow through the porous media, i.e., the intensification of the heat transfer takes place in corners located near the back wall (see Figure 15 and Figure 16). The combustion front propagates to the top, and it is characterized by the parabolic shape function of distance from the reactor core.
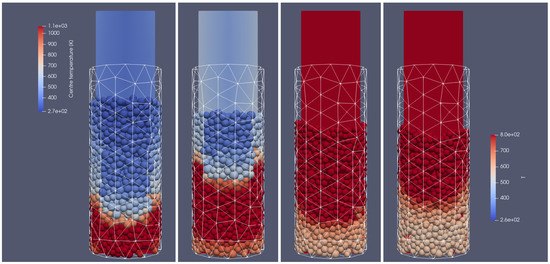
Figure 15.
Heating of the biomass bed of particle size of 0.01 m at different times of operation; from (left to right): 500 s, 700 s, 900 s, 1100 s, front side view.
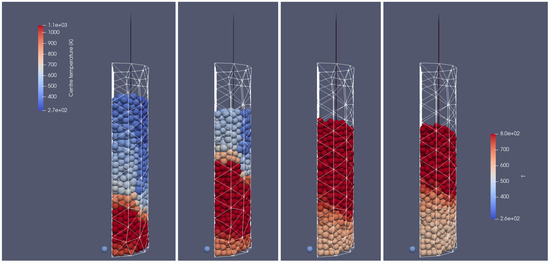
Figure 16.
Heating of the biomass bed of particle size of 0.01 m at different times of operation; from (left to right): 500 s, 700 s, 900 s, 1100 s, right-hand-side view.
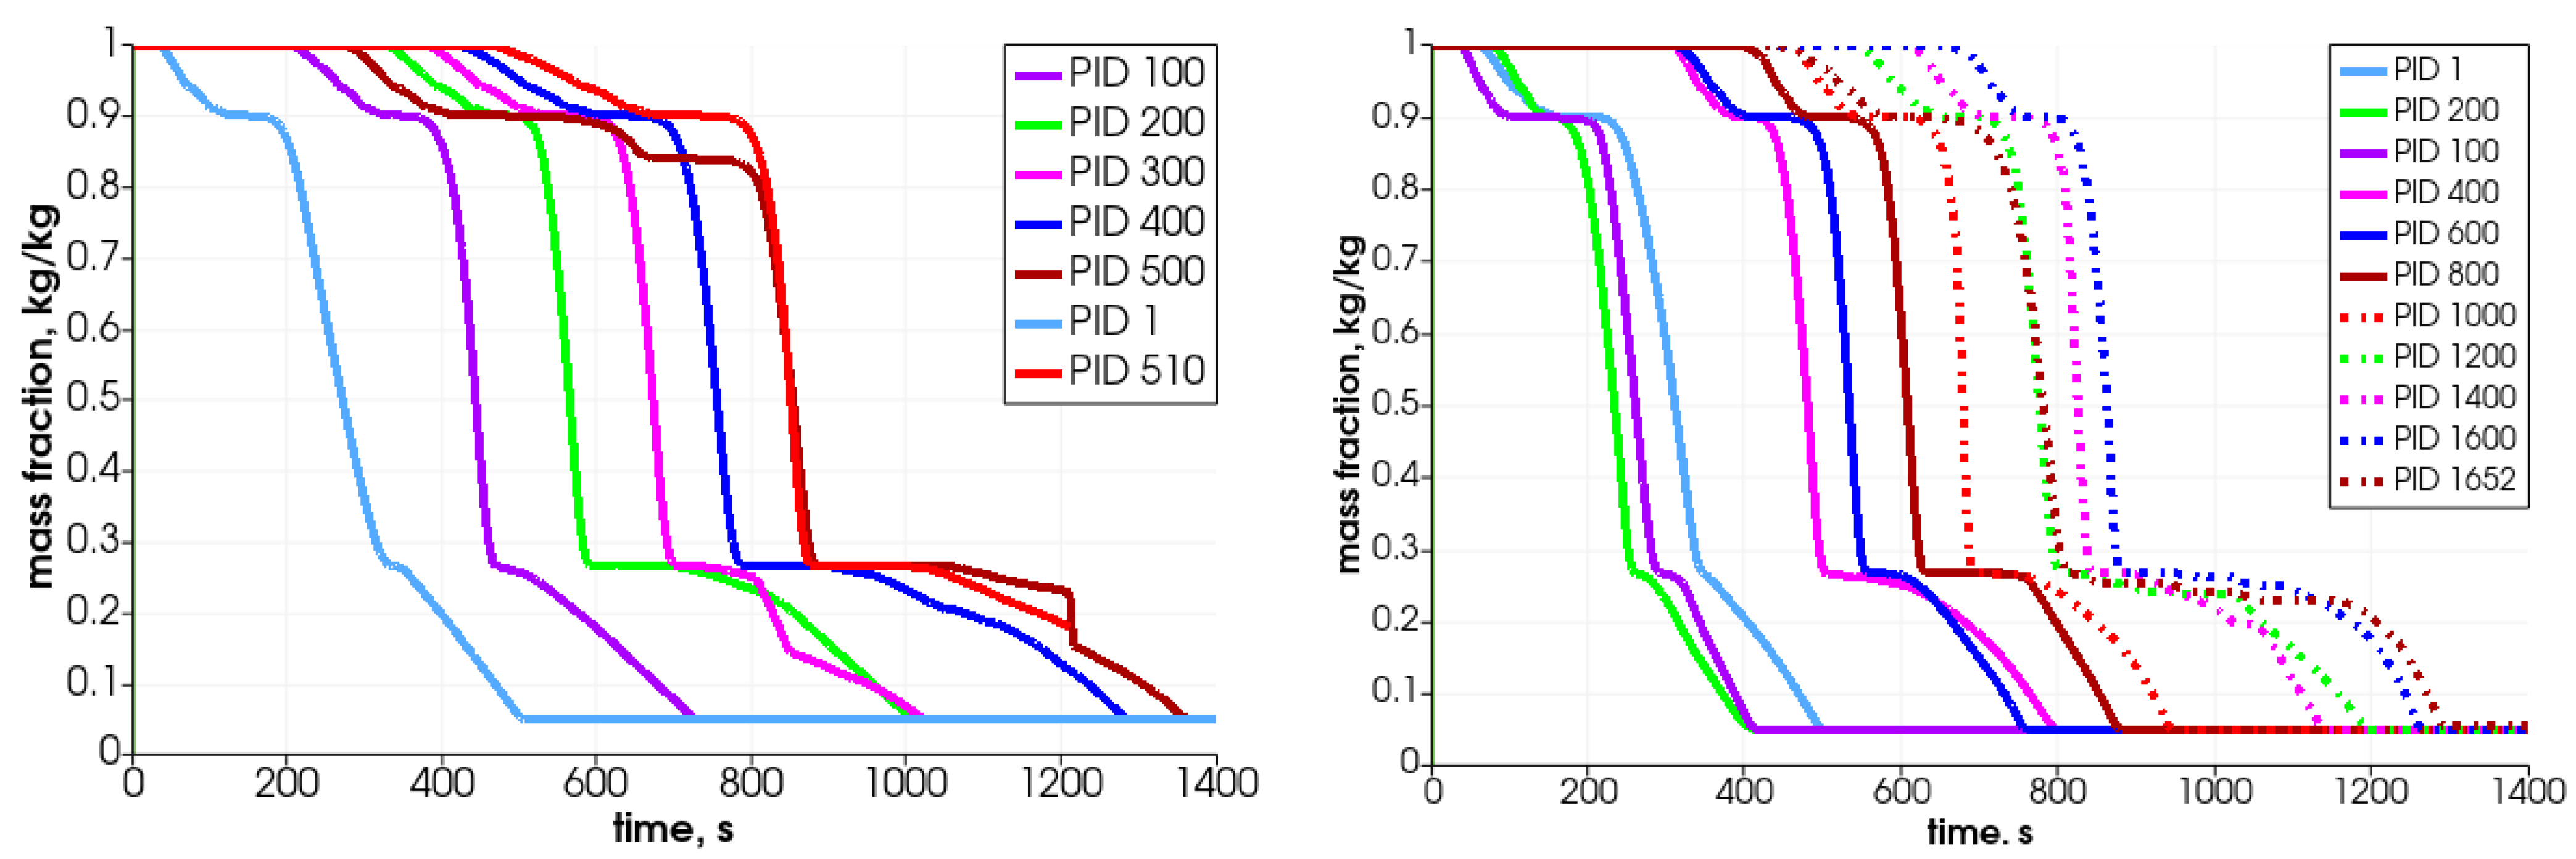
In Figure 17 and Figure 18, the particles’ mass loss in time are displayed. These graphs show the differences between two analyzed cases, i.e., the one with the uniform size of the particles (left graphs) and the second with the various particle sizes (right graphs). Analyzing the mass fraction parameter, it can be concluded that the bigger particles have to spend more time in the reactor for full conversion. Moreover, in the case of smaller particles (right-hand side), the operational conditions inside the reactor are much more unified, which makes the decomposition of particles more steady, i.e., the particles’ behavior is similar, and only the propagation of the heating front ensures that the initiation of their mass loss is shifted in time.
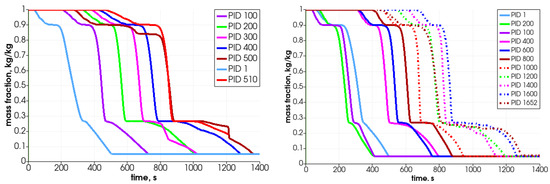
Figure 17.
Mass change for different particles filling the reactor.
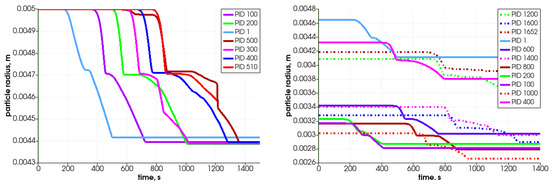
Figure 18.
Diameter change for different particles filling the reactor.
As can be observed in the case of same-size particles, the top particle (PID 510) is decomposed after 1400 s (see Figure 17—left graph), which for the whole bed gives the loss mass rate of 8.0 g/min. For the case with various sizes of particles, the top located particle (PID 1652) is transformed after the 1300 s (Figure 17—right graph) and it results in a whole bed loss mass rate at the value of 8.6 g/min. Those results are comparable with the experimental data obtained on the real test stand, which varied from 8.5 g/min to 15.8 g/min depending on the biomass type filling the reactor [44]. Thus, these primary numerical results are in good agreement with the lowest value as regards the total conversion time experimentally derived for the thermal treatment of biomass fuel in this particular reactor type. One should point out that if the combustion front propagates in the direction from the top to the bottom, i.e., the ignition takes place at the top part of the bed and it moves against the direction of airflow, the expected operational times needed to convert the biomass will, therefore, be extended [49].
In Figure 19, the primary results for the simulation of the combustion of biomass particles in the air, but considering the ignition of the bed from its top, are presented. There, the ignition is realized by injecting the additional stream of hot gases supplied at the top. The combustion front in that case propagates from the top to the bottom of the reactor, which can be a good starting point for analyzing the different scenarios to predict the gasifier/combustion gas composition.
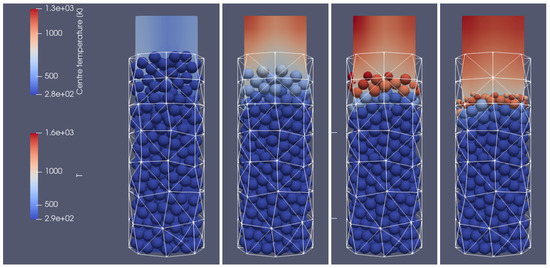
Figure 19.
Combustion of the biomass bed of a uniform particle size with a diameter of 0.012 m at different times of operation; from(left to right): initial stage, 200 s, 300 s, 500 s, right-hand-side view.
8. Conclusions
The main goal of this work was to investigate the possibility of using the coupled CFD-DEM approach to simulate the behavior of wood particles during the thermal conversion process. The non-typical geometry of the reactor was considered to observe the additional impact of the walls on the flow parameters and temperature propagation through the fixed bed. The in-house code with an extension of the thermodynamic laws acting on the particles was taken into consideration (XDEM software). This allowed for obtaining information about the influence of the surrounding fluid temperature on the particle’s behavior, including not only its movement but also its conversion parameters. Based on the applied numerical approach, the following conclusions can be made:
- The XDEM method can be used to simulate heat and mass transfer processes in the biomass-packed bed reactors;
- The coupled CFD-DEM approach gives more information about the behavior of the particles in the external fluid field in comparison to the classical Eulerian approach; additionally, the position of each particle is obtained. This hybrid approach allows for detailed and accurate simulations of multiphase systems where interactions between particles and fluids are critical;
- The Extended DEM - XDEM captures the complex interactions between individual particles, taking into account contact forces, collisions, and the resulting dynamic behavior, which are essential for understanding granular flows and processes such as mixing and segregation but also give information about the progress of each particle conversion including its temperature, porosity distributions inside, as well as the production of main syngas compounds and char in time, thus allowing for defining the characteristic gasification/combustion process stage. This versatility makes XDEM software applicable to a wide range of engineering problems, from chemical reactors to material processing;
- The propagation of the heat front depends not only on the particle size but also on the geometry of the reactor; in the case of non-typical geometries, the shape of the walls can affect the gas flow and the temperature distribution. Unlike cylindrical reactors, reactors with untypical shapes may cause non-symmetrical temperature propagation;
- The carried out detailed numerical analysis of the solid fuel conversion process allows for gaining knowledge about the required residence time of each particle in the reactor in order to obtain the maximum efficiency of the process with the required levels of preferred products (gas, solid, or liqiud). Thus, it enables determining the optimum reactor operating parameters (process duration, bed heating rate, operating pressure and temperature, oxidizer flows), which will take into account local variations in parameters related to the movement of particles in the bed.
The presented software is a promising tool for the analysis of the thermal conversion of solid fuels in various types of heating units. It can be implemented on high-performance computing platforms, making it possible to simulate large systems with millions of particles. This scalability is crucial for industrial applications where system sizes can be substantial. Thus, it is characterized by a high computational cost. Moreover, the accuracy of XDEM simulations depends on the used parameters, such as particle properties, contact models, and fluid–particle interaction coefficients. Determining these properties can be difficult, and differences between defined and real values can lead to discrepancies between simulation and experimental/industrial results.
To summarize, XDEM offers a powerful and flexible approach to simulating complex multiphase systems with detailed particle interactions. However, its computational demands, complexity, and the need for extensive validation data present significant challenges that must be addressed to fully realize its potential in practical applications. Nevertheless, it is a very useful tool that can be used at the designing stage on a small scale and laboratory stands development for thermal utilization and production of alternative fuels from different types of wastes.
Author Contributions
Conceptualization, D.K. and I.W.-Ś.; methodology, I.W.-Ś.; software, I.W.-Ś.; validation, D.K. and I.W.-Ś.; formal analysis, I.W.-Ś.; investigation, I.W.-Ś.; resources, I.W.-Ś.; data curation, I.W.-Ś.; writing—original draft preparation, I.W.-Ś.; writing—review and editing, D.K. and I.W.-Ś.; visualization, I.W.-Ś.; supervision, D.K.; project administration, I.W.-Ś.; funding acquisition, I.W.-Ś. All authors have read and agreed to the published version of the manuscript.
Funding
This research was partially funded by the National Research Centre Poland in the frame of the MINIATURA-5 framework no. 2021/05/X/ST8/00707.
Data Availability Statement
The original contributions presented in the study are included in the article, further inquiries can be directed to the corresponding author.
Acknowledgments
This research was supported by computer centre CI TASK (Centre of Informatics Tricity Academic Supercomputer & Network.
Conflicts of Interest
The authors declare no conflicts of interest.
Abbreviations
The following abbreviations are used in this manuscript:
| CFD | Computational Fluid Dynamics |
| DEM | Discrete Element Method |
| DPM | Discrete Particle Method |
| PID | Particle Identification Number |
| XDEM | Extended Discrete Element Method |
References
- Fatahian, H.; Fatahian, E.; Erfani, R. Square Cyclone Separator: Performance Analysis Optimization and Operating Condition Variations Using CFD-DPM and Taguchi Method. Powder Technol. 2023, 428, 118789. [Google Scholar] [CrossRef]
- Mezhericher, M.; Brosh, T.; Levy, A. Modeling of Particle Pneumatic Conveying Using DEM and DPM Methods. Part. Sci. Technol. Int. J. 2011, 29, 197–208. [Google Scholar] [CrossRef]
- Tan, Y.; Ni, J.; Xu, W.; Xie, Y.; Li, L.; Tan, D. Key technologies and development trends of the soft abrasive flow finishing method. JZUSA Appl. Phys. Eng. 2023, 24, 1043–1064. [Google Scholar] [CrossRef]
- Zarzycki, R.; Kobyłecki, R.; Bis, Z. Numerical Analysis of the Combustion of Gases Generated during Biomass Carbonization. Entropy 2020, 22, 181. [Google Scholar] [CrossRef] [PubMed]
- Karchniwy, E.; Klimanek, A.; Haugen, N.E.L. The effect of turbulence on mass transfer rates between inertial polydisperse particles and fluid. J. Fluid Mech. 2019, 874, 1147–1168. [Google Scholar] [CrossRef]
- Soon, G.; Zhang, H.; Wing-Keung Law, A.; Yang, C. Computational Modelling on Gasification Processes of Municipal Solid Wastes Including Molten Slag. Waste 2023, 1, 370–388. [Google Scholar] [CrossRef]
- Ates, C.; Arweiler, J.; Hadad, H.; Koch, R.; Bauer, H.-J. Secondary Motion of Non-Spherical Particles in Gas Solid Flows. Processes 2023, 11, 1369. [Google Scholar] [CrossRef]
- Ansys Rocky, Particle Dynamics Simulation Software. Available online: https://www.ansys.com/products/fluids/ansys-rocky (accessed on 4 December 2023).
- Zhou, L.; Wang, B.; Cao, Y.; Zhao, Z.; Agarwal, R. Fluidisation of spherocylindrical particles: Computational fluid dynamics–Discrete element method simulation and experimental investigation. Eng. Appl. Comput. Fluid Mech. 2024, 18, 2297537. [Google Scholar] [CrossRef]
- Yu, G.; Yu, C.; Fu, Z.; Jing, J.; Hu, Z.; Pan, K. Mechanical Consequences of Suffusion on Gap-Graded Soils with Stress Anisotropy: A CFD–DEM Perspective. Buildings 2024, 14, 122. [Google Scholar] [CrossRef]
- Raza, N.; Mehdi, R.; Ahsan, M.; Mehran, M.T.; Naqvi, S.R.; Uddin, E. Optimizing Design and Operational Parameters for Enhanced Mixing and Hydrodynamics in Bubbling Fluidized Bed Gasifiers: An Experimental and CFD-Based Approach. Appl. Sci. 2023, 13, 9317. [Google Scholar] [CrossRef]
- Zhou, L.; Lv, W.; Bai, L.; Han, Y.; Wanga, J.; Shi, W.; Huang, G. CFD–DEM study of gas–solid flow characteristics in a fluidized bed with different diameter of coarse particles. Energy Rep. 2022, 8, 2376–2388. [Google Scholar] [CrossRef]
- Ma, H.; Xia, X.; Zhou, L.; Xu, C.; Liu, Z.; Song, T.; Zou, G.; Liu, Y.; Huang, Z.; Liao, X.; et al. A Comparative Study of the Performance of Different Particle Models in Simulating Particle Charging and Burden Distribution in a Blast Furnace within the DEM Framework. Energies 2023, 16, 3890. [Google Scholar] [CrossRef]
- Li, H.; Qi, T.; Zhang, Y. Effect of Furnace Structure on Burden Distribution and Gas Flow in Sinter Vertical Cooling Furnace. Appl. Sci. 2023, 13, 11268. [Google Scholar] [CrossRef]
- Gao, Y.; Chan, C.K. CFD-DEM simulation of raceway size and mechanical characteristics of industrial scale blast furnace. Pol. J. Chem. Technol. 2023, 25, 71–78. [Google Scholar] [CrossRef]
- Wang, M.; Jia, T.; Song, X.; Yin, L.; Chen, D.; Qian, K. CFD–DEM Simulation of Heat Transfer and Reaction Characteristics of Pyrolysis Process of MSW Heated by High-Temperature Flue Gas. Processes 2024, 12, 390. [Google Scholar] [CrossRef]
- MFiX, Open Source Multiphase Flow Modeling for Real-World Applications. Available online: https://mfix.netl.doe.gov/products/mfix/ (accessed on 4 March 2024).
- Ku, X.; Li, T.; Løvås, T. CFD–DEM simulation of biomass gasification with steam in a fluidized bed reactor. Chem. Eng. Sci. 2015, 122, 270–283. [Google Scholar] [CrossRef]
- Ku, X.; Li, T.; Løvås, T. Influence of drag force correlations on periodic fluidization behavior in Eulerian-Lagrangian simulation of a bubbling fluidized bed. Chem. Eng. Sci. 2013, 95, 94–106. [Google Scholar] [CrossRef]
- Rosser, J.G.; Okosun, T.; Ugarte, O.J.; Zhou, C.Q. Investigation of Jamming Phenomenon in a Direct Reduction Furnace Pellet Feed System Using the Discrete Element Method. Dynamics 2023, 3, 711–736. [Google Scholar] [CrossRef]
- Basu, P. Biomass Gasification and Pyrolysis. Practical Design and Theory; Elsevier: Oxford, UK, 2010. [Google Scholar]
- Kluska, J.; Kazimierski, P.; Kardaś, D. Effect of biomass settling in the fixed bed gasification reactor. In Proceedings of the CYSENI, Kaunas, Lithuania, 26–27 May 2016, ISSN 1822-7554. [Google Scholar]
- Peters, B.; Besseron, X.; Estupinan, A.; Hoffmann, F.; Michael, M.; Mahmoudi, A. Enhanced Thermal Process Engineering by the Extended Discrete Element Method (XDEM). Univ. J. Eng. Sci. 2013, 1, 139–145. [Google Scholar] [CrossRef]
- Peters, B.; Smuła-Ostaszewska, J. A numerical approach to predict sulphur dioxide emissions during switchgrass combustion. Chem. Process. Eng. 2013, 34, 121–137. [Google Scholar] [CrossRef]
- Copertaro, E.; Chiariotti, P.; Estupinan Donoso, A.A.; Paone, N.; Peters, B.; Revel, G.M. A discrete-continuous approach to describe CaCO3 decarbonation in non-steady thermal conditions. Powder Technol. 2015, 275, 131–138. [Google Scholar] [CrossRef]
- Michael, M.; Vogel, F.; Peters, B. DEM–FEM coupling simulations of the interactions between a tire tread and granular terrain. Comput. Methods Appl. Mech. Eng. 2015, 289, 227–248. [Google Scholar] [CrossRef]
- Mahmoudi, A.H.; Markovic, M.; Peters, B.; Brem, G. An experimental and numerical study of wood combustion in a fixed bed using Euler–Lagrange approach (XDEM). Fuel 2015, 150, 573–582. [Google Scholar] [CrossRef]
- Estupinan Donoso, A.A.; Peters, B. Exploring a Multiphysics Resolution Approach for Additive Manufacturing. JOM 2018, 70, 1604–1610. [Google Scholar] [CrossRef]
- Pozzetti, G.; Peters, B. A numerical approach for the evaluation of particle-induced erosion in an abrasive waterjet focusing tube. Powder Technol. 2018, 333, 229–242. [Google Scholar] [CrossRef]
- Baniasadi, M.; Peters, B.; Pierret, J.-C.; Vanderheyden, B.; Ansseau, O. Experimental and numerical investigation into the softening behavior of a packed bed of iron ore pellets. Powder Technol. 2018, 339, 863–871. [Google Scholar] [CrossRef]
- Baniasadi, M.; Baniasadi, M.; Peters, B. Coupled CFD-DEM with heat and mass transfer to investigate the melting of a granular packed bed. Chem. Eng. Sci. 2018, 178, 36–45. [Google Scholar] [CrossRef]
- Mohseni, M.; Kolomijtschuk, A.; Peters, B.; Demoulling, M. Biomass drying in a vibrating fluidized bed dryer with a Lagrangian-Eulerian approach. Int. J. Therm. Sci. 2019, 138, 219–234. [Google Scholar] [CrossRef]
- Mahmoudi, A.H.; Hoffmann, F.; Peters, B. Semi-resolved modeling of heat-up, drying and pyrolysis of biomass solid particles as a new feature in XDEM. Appl. Therm. Eng. 2016, 93, 1091–1104. [Google Scholar] [CrossRef]
- Estupinan Donoso, A.A.; Peters, B. XDEM Used for Predicting Tungsten-Oxide Reduction. In Proceedings of the CAPE Forum 2015, Computer Aided Process Engineering, University of Paderborn, Paderborn, Germany, 27–29 April 2015. [Google Scholar]
- OpenFoam, OpenFoam Documentation. 2014. Available online: http://www.openfoam.com (accessed on 3 March 2017).
- Wakao, N.; Kaguei, S. Heat and Mass Transfer in Packed Beds; McGraw-Hill: New York, NY, USA, 1982. [Google Scholar]
- Peters, B.; Baniasadi, M.; Baniasadi, M.; Besseron, X.; Estupinan Donoso, A.; Mohseni, M.; Pozzetti, G. XDEM multi-physics and multi-scale simulation technology: Review of DEM–CFD coupling, methodology and engineering applications. Particuology 2019, 44, 176–193. [Google Scholar] [CrossRef]
- Wu, J.; Li, L.; Yin, Z.; Li, Z.; Wang, T.; Tan, Y.; Tan, D. Mass transfer mechanism of multiphase shear flows and interphase optimization solving method. Energy 2024, 292, 130475. [Google Scholar] [CrossRef]
- McBride, B.J.; Zehe, M.J.; Gordon, S. NASA Glenn Coefficients for Calculating Thermodynamic Properties of Individual Species; NASA/TP—2002-211556; National Aeronautics and Space Administration Glenn Research Center: Cleveland, OH, USA, 2002.
- Aminnia, N.; Esputanian Donoso, A.A.; Peters, B. A DEM-coupled OpenFoam solver for multiphysics simulation of additive manufacturing process: Development and validation. In Proceedings of the 8th European Congress on Computational Methods in Applied Sciences and Engineering ECCOMAS Congress, Oslo, Norway, 5–9 June 2022. [Google Scholar]
- Aminnia, N.; Adhav, P.; Darlik, F.; Mashhood, M.; Saraei, S.H.; Besseron, X.; Peters, B. Three-dimensional CFD-DEM simulation of raceway transport phenomena in a blast furnace. Fuel 2023, 334, 126574. [Google Scholar] [CrossRef]
- XDEM Tutorials. LuXDEM Research Team, University of Luxembourg, Campus Belval, Esch-sur-Alzette, Luxembourg. unpublished materials.
- Turns, S.R. Introduction to Combustion – Concepts and Applications; McGraw–Hill, Inc.: Singapore, 1996. [Google Scholar]
- Turzyński, T.; Kluska, J.; Ochnio, M.; Kardaś, D. Comparative Analysis of Pelletized and Unpelletized Sunflower Husks Combustion Process in a Batch-Type Reactor. Materials 2021, 14, 2484. [Google Scholar] [CrossRef] [PubMed]
- Turzyński, T.; Kluska, J.; Kardaś, D. Study on chicken manure combustion and heat production in terms of thermal self-sufficiency of a poultry farm. Renew. Energy 2022, 191, 84–91. [Google Scholar] [CrossRef]
- Polesek-Karczewska, S.; Turzyński, T.; Kardaś, D.; Heda, Ł. Front velocity in the combustion of blends of poultry litter with straw. Fuel Process. Technol. 2018, 176, 307–315. [Google Scholar] [CrossRef]
- Groppi, G.; Tronconi, E.; Forzatti, P.; Berg, M. Mathematical modelling of catalytic combustors fuelled by gasified biomasses. Catal. Today 2000, 59, 151–162. [Google Scholar] [CrossRef]
- Wardach-Świȩcicka, I. Modelling of Physicochemical Processes in a Solid Fuel Particle in a Stream of Hot Gases. Ph.D. Thesis, IMP PAN, Gdańsk, Poland, 2016. (In Polish). [Google Scholar]
- Wardach-Świȩcicka, I.; Kardaś, D. Modelling thermal behaviour of a single solid particle pyrolysing in a hot gas flow. Energy 2021, 221, 119802. [Google Scholar] [CrossRef]
Disclaimer/Publisher’s Note: The statements, opinions and data contained in all publications are solely those of the individual author(s) and contributor(s) and not of MDPI and/or the editor(s). MDPI and/or the editor(s) disclaim responsibility for any injury to people or property resulting from any ideas, methods, instructions or products referred to in the content. |
© 2024 by the authors. Licensee MDPI, Basel, Switzerland. This article is an open access article distributed under the terms and conditions of the Creative Commons Attribution (CC BY) license (https://creativecommons.org/licenses/by/4.0/).

