3.1. Nuclear Energy Production in the World
Nuclear energy is clean and environmentally friendly, but it can also be dangerous if accidents occur. Electricity is critical for delivering products and services to consumers and improving standards of living, education, and health. Electric power stations are transforming, and more and more electricity is derived from renewable energy sources and nuclear power stations than from fossil fuels. These changes are the effects of decarbonization. Nuclear energy plays an important role in the production of electricity because it reduces pollution, improves fuel diversification, and has a positive impact on the whole economy. Moreover, the development of this sector, which creates electricity from nuclear energy, creates new jobs [
70]. Each country in the world has its own conditions that have an impact on the use of nuclear energy for electricity generation [
71]. Nuclear energy is most popular in medium- to highly-developed countries with a high demand for electricity [
6].
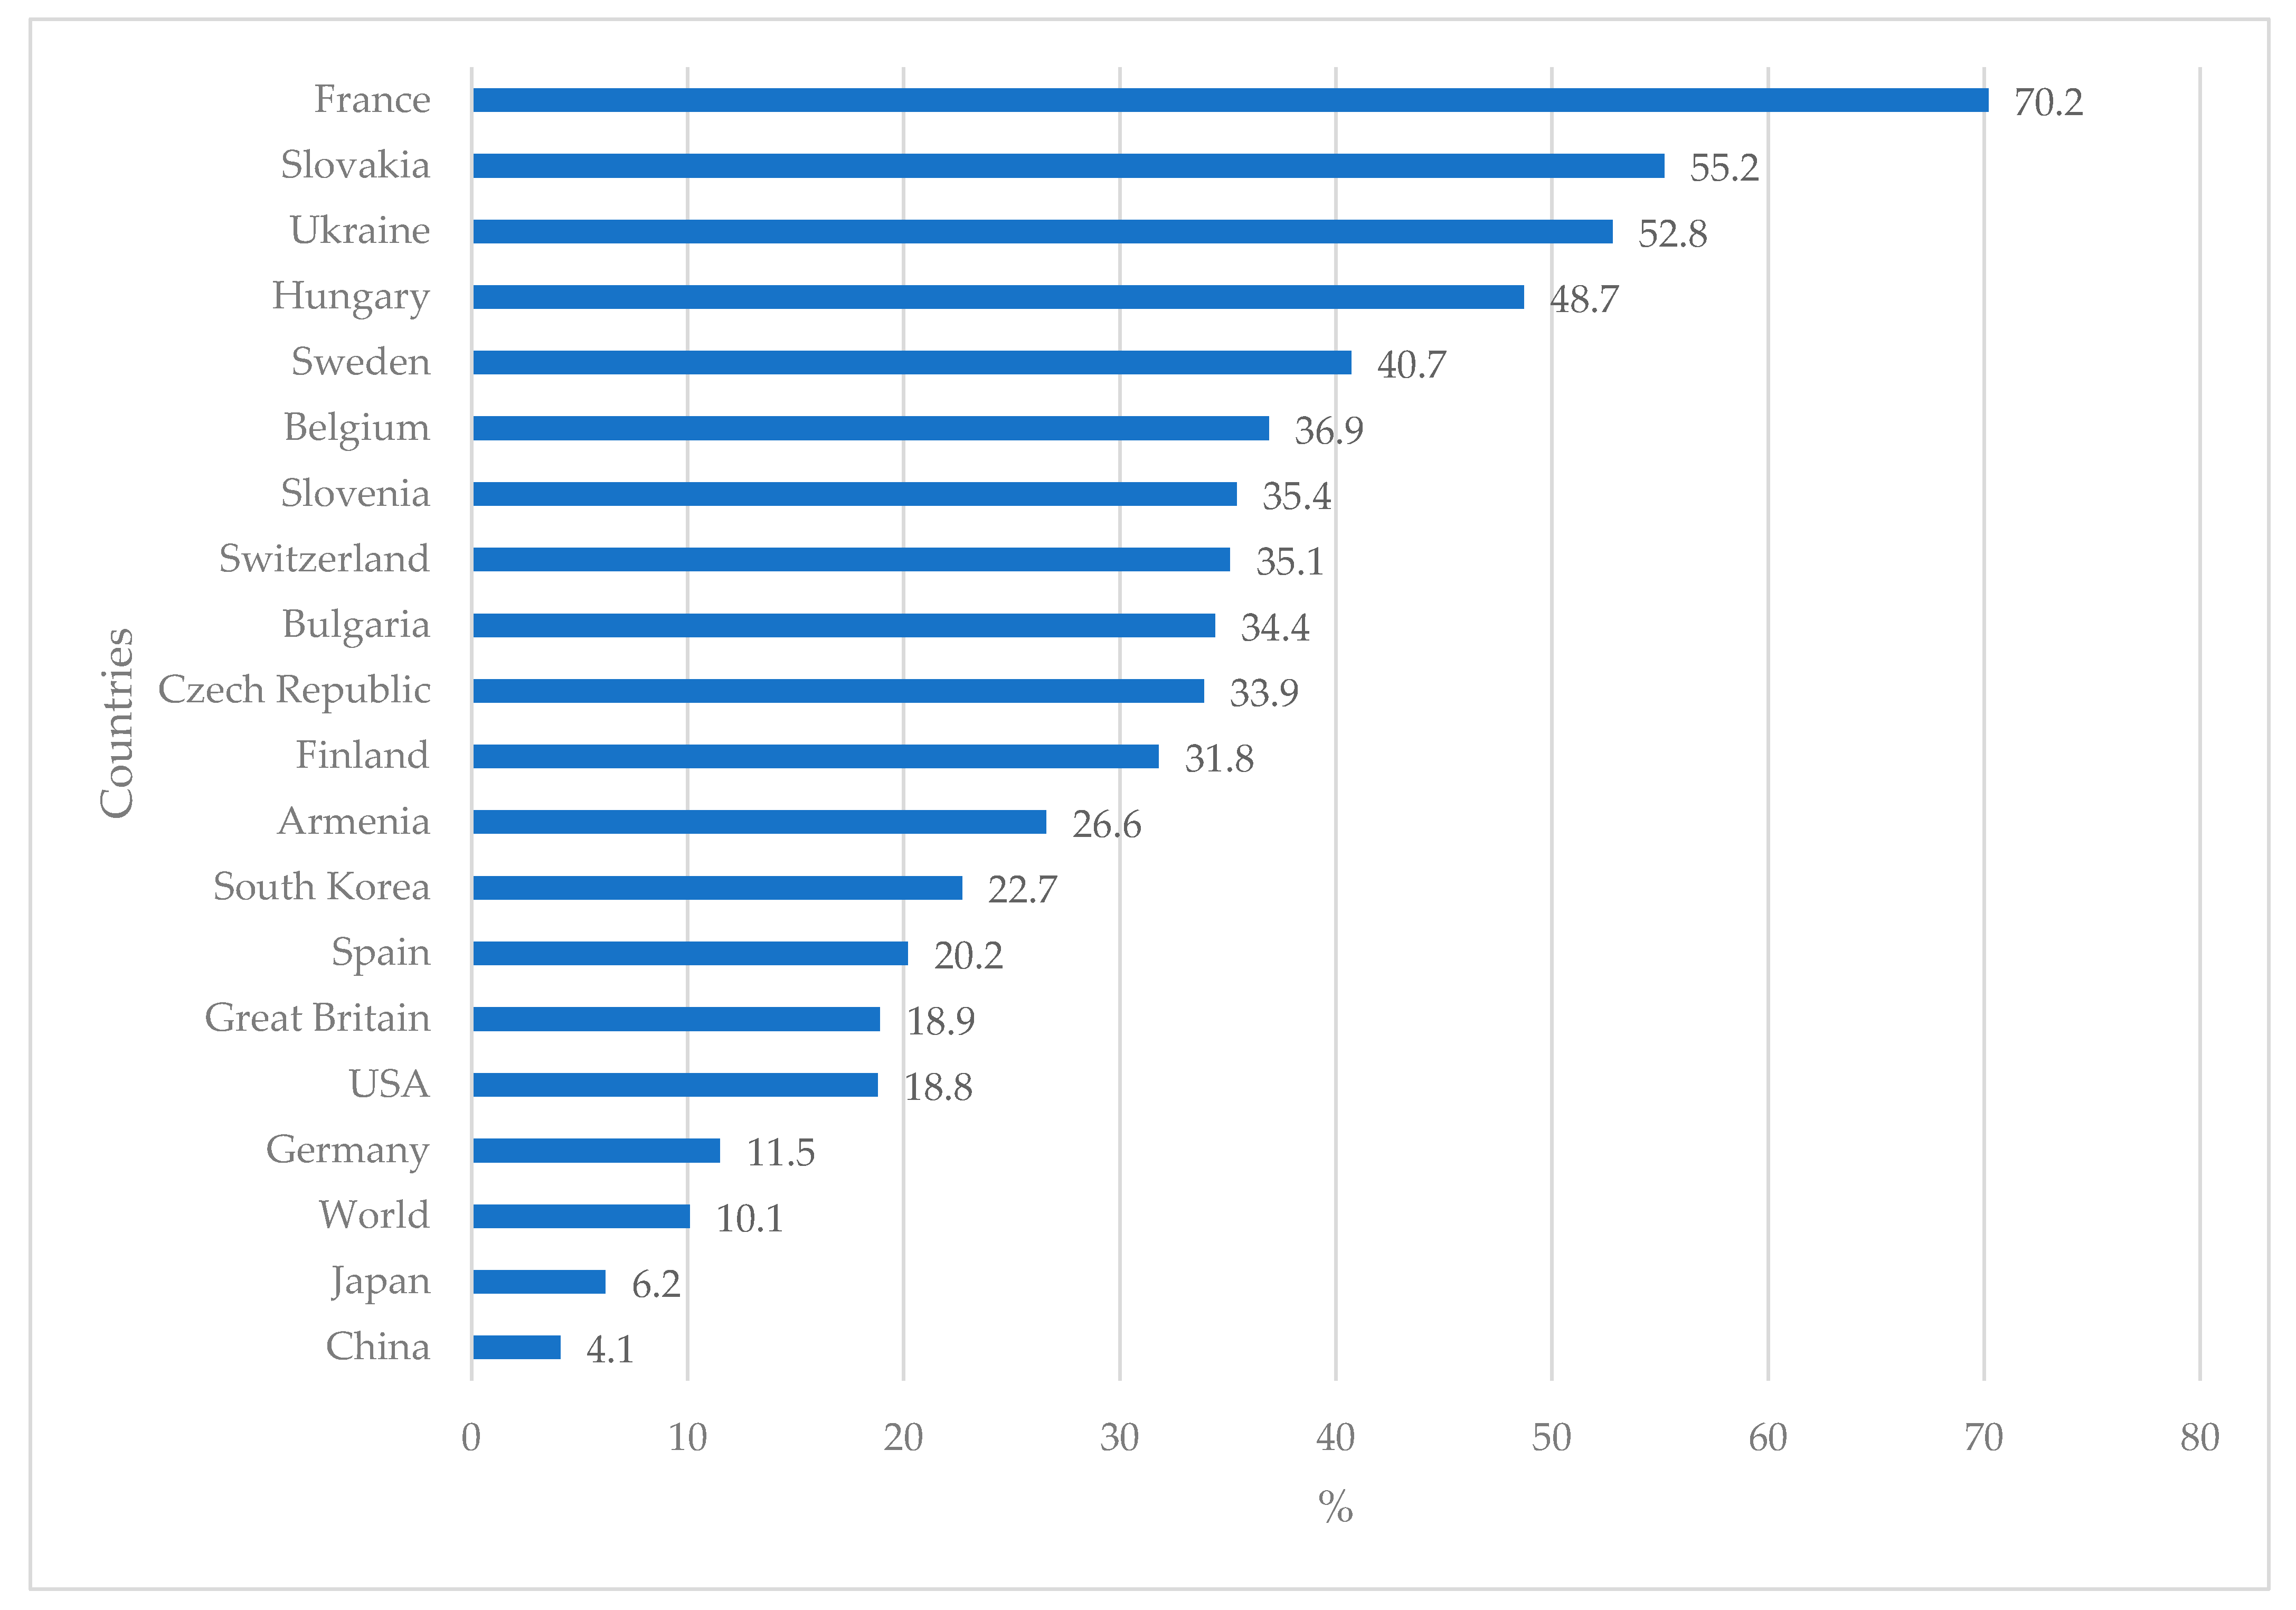
Nuclear power is important and accounts for about 16% of the world’s electricity supply [
72]. The share of nuclear energy in electricity production is diversified regionally. France (70.2%), Slovakia (55.2%), Ukraine (52.8%), Hungary (48.7%), and Sweden (40.7%) are countries with the highest share of nuclear energy in electricity production (
Figure 2). The data demonstrate the importance of this kind of energy. This energy will undoubtedly be a significant part of the total energy in the future for various reasons, such as availability, decreased greenhouse gas emissions, and other characteristics [
72]. The production of nuclear energy is complicated and includes processes such as uranium mining, the production of heat and electricity, cooling the reactor, and, finally, waste disposal. The controversial production leads to the high production of heat and electricity and is safer for the environment compared to fossil fuels [
73].
The world’s production of electricity from nuclear plants is stable. The consumption of electricity plays an important role in economic growth. The relationship between electricity and energy consumption has been analyzed. Higher economic development requires higher consumption of electricity [
75]. The production of electricity and energy affects human well-being and is important for sustainability and development [
71]. The production of electricity from nuclear energy in the future will likely grow because this energy is clean and environmentally friendly. There are no emissions as with fossil fuels, and nuclear energy is cheaper than fossil fuels [
76].
The production of nuclear energy requires a constant supply of technology and its development. Nuclear energy is a key technical challenge, particularly for countries that do not have such technology [
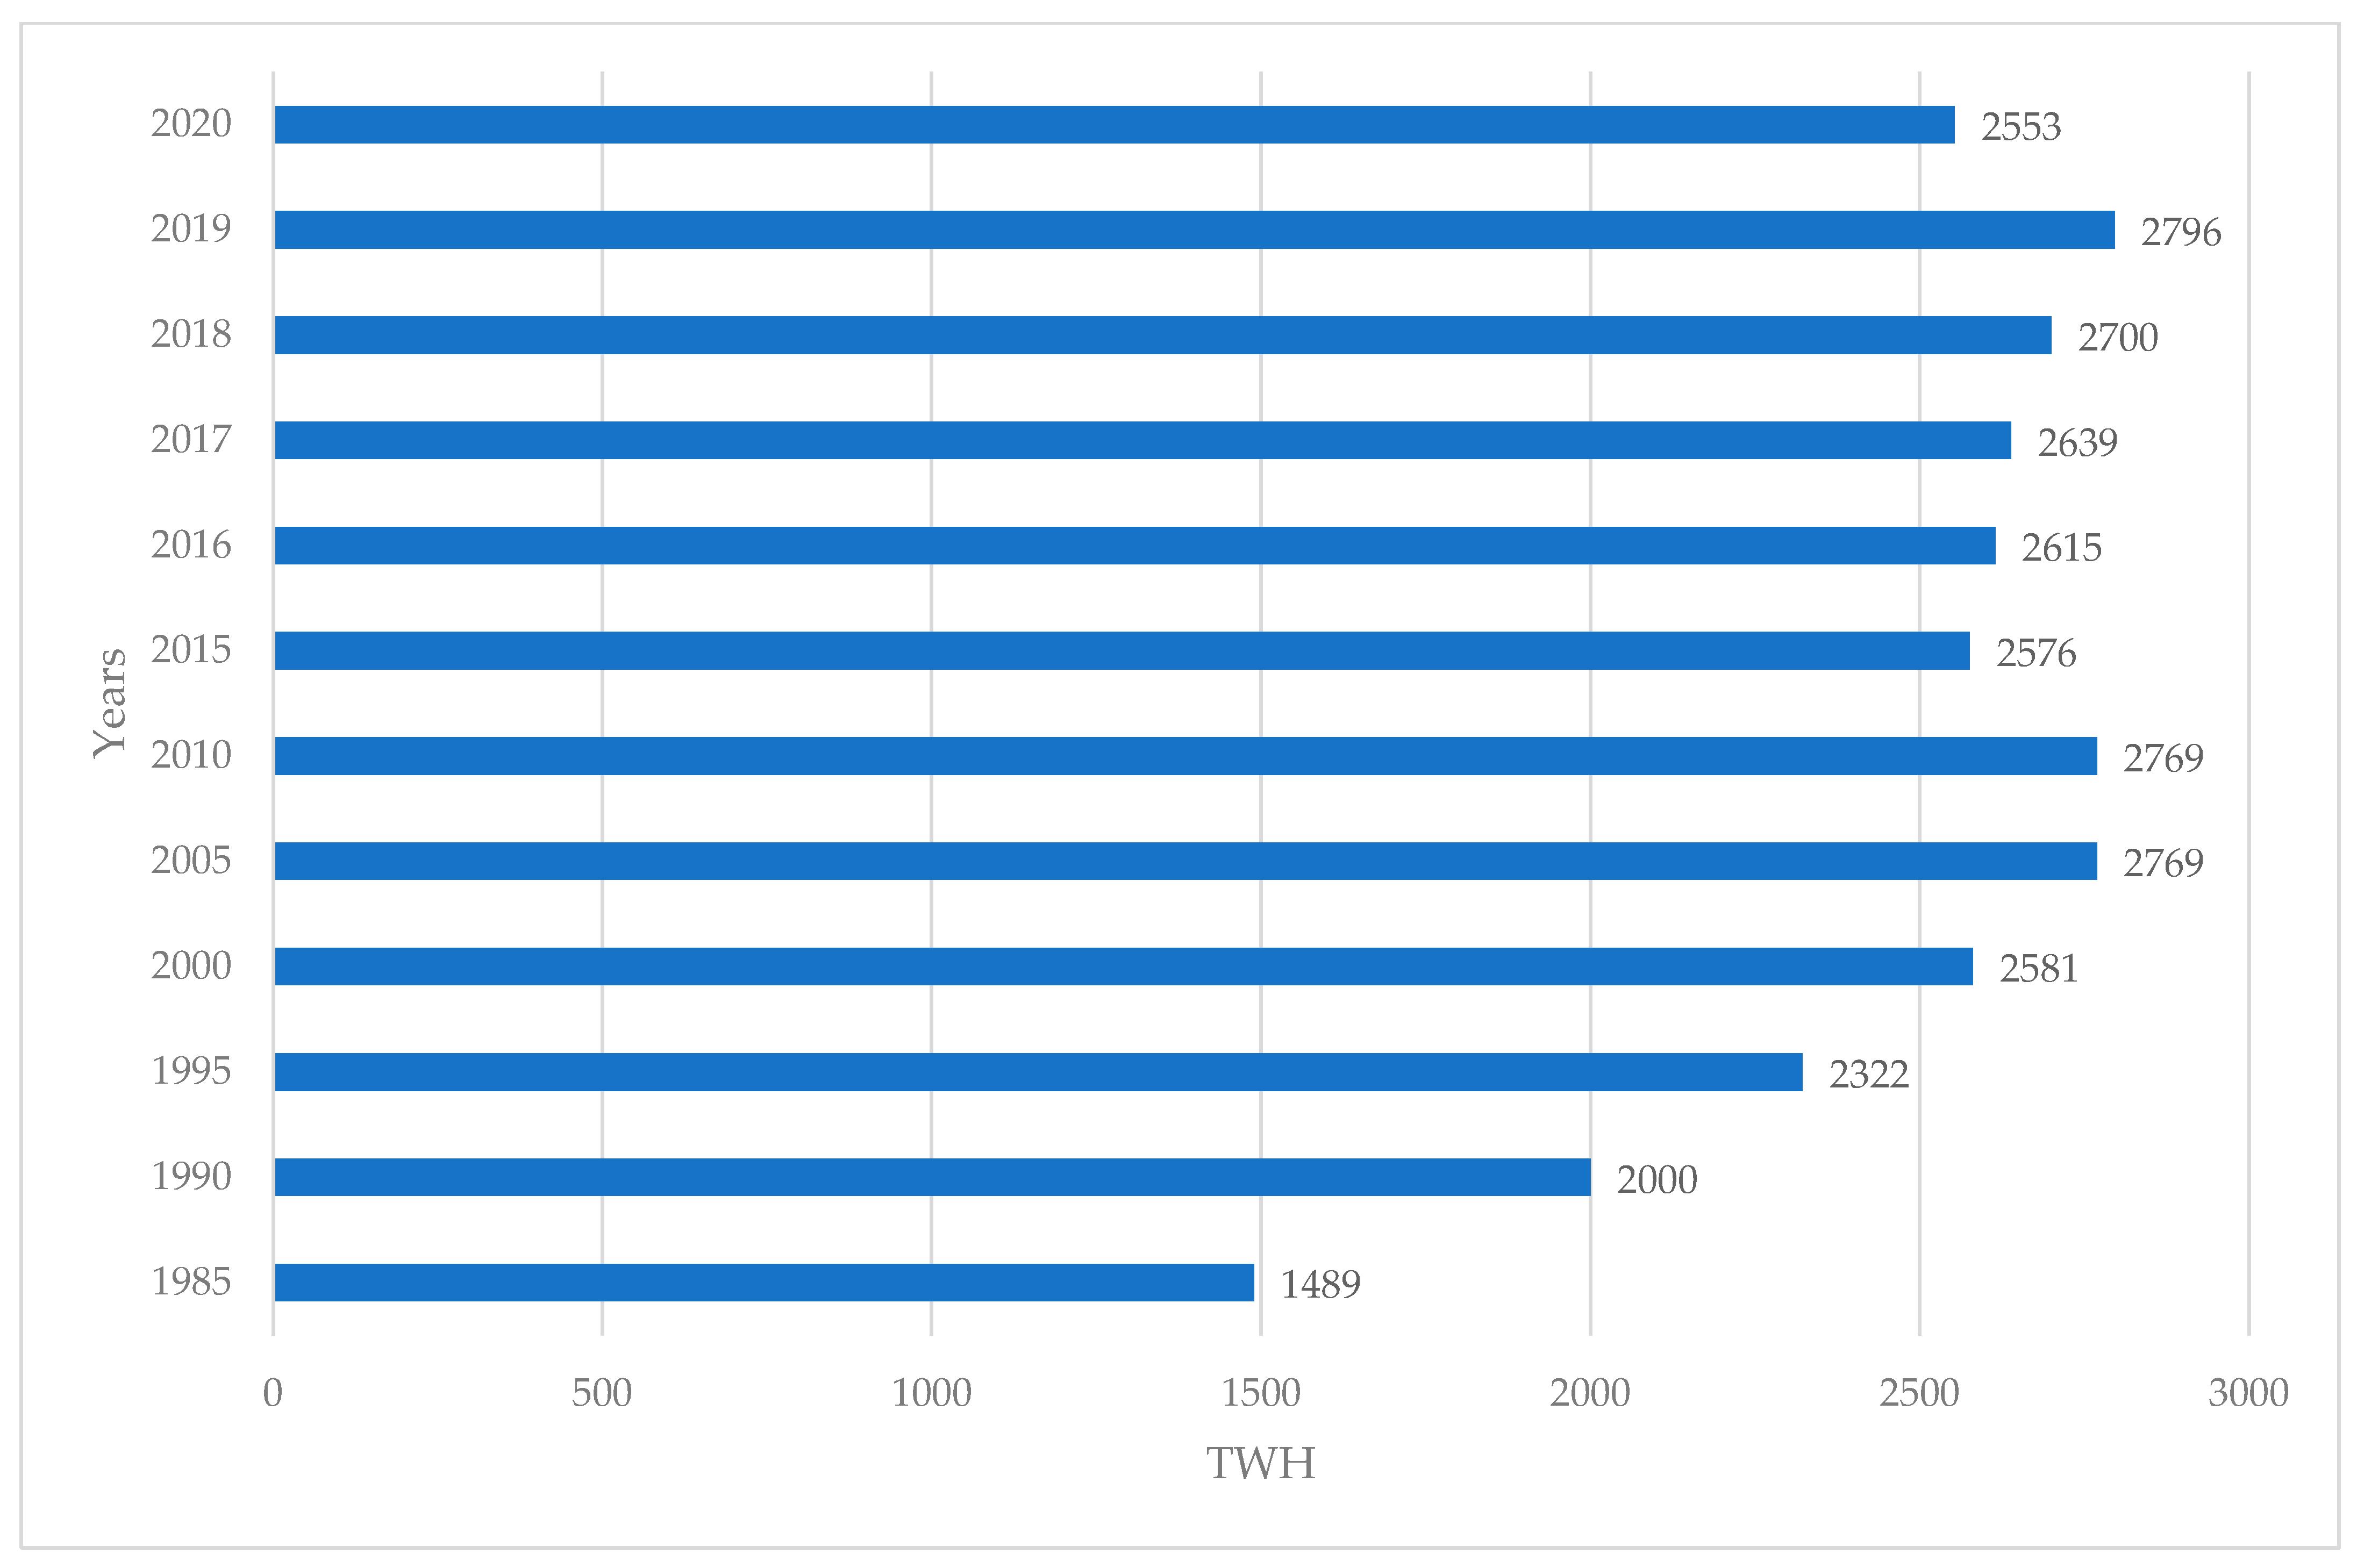
77]. According to the data presented in
Figure 3, the world’s production of electricity in nuclear plants in 2020 was 2553 TWH. It had decreased compared to 2019 by 9.5%. This decrease may be the result of the COVID-19 pandemic, which decreased the demand for electricity, particularly in factories.
The production of nuclear energy has an impact on the development of each country. It has been proven in the literature that countries producing nuclear energy have a Gross Domestic Product (GDP) per capita increase. Moreover, nuclear countries recorded an increase in the production and use of renewable energy sources. Countries producing nuclear energy use more energy than others and import resources [
71]. In 2019, nuclear power plants produced 2796 TWH of electricity. Countries such as the USA, France, China, and Russia together produce over 65% of the total amount of electricity generated in nuclear power plants [
6].
The USA is the biggest producer of nuclear energy. The most important feature of the US nuclear market is its complexity. The US has the longest history of nuclear energy, and the market is mature and efficient. The technology is new, and the US is exporting it worldwide [
78].
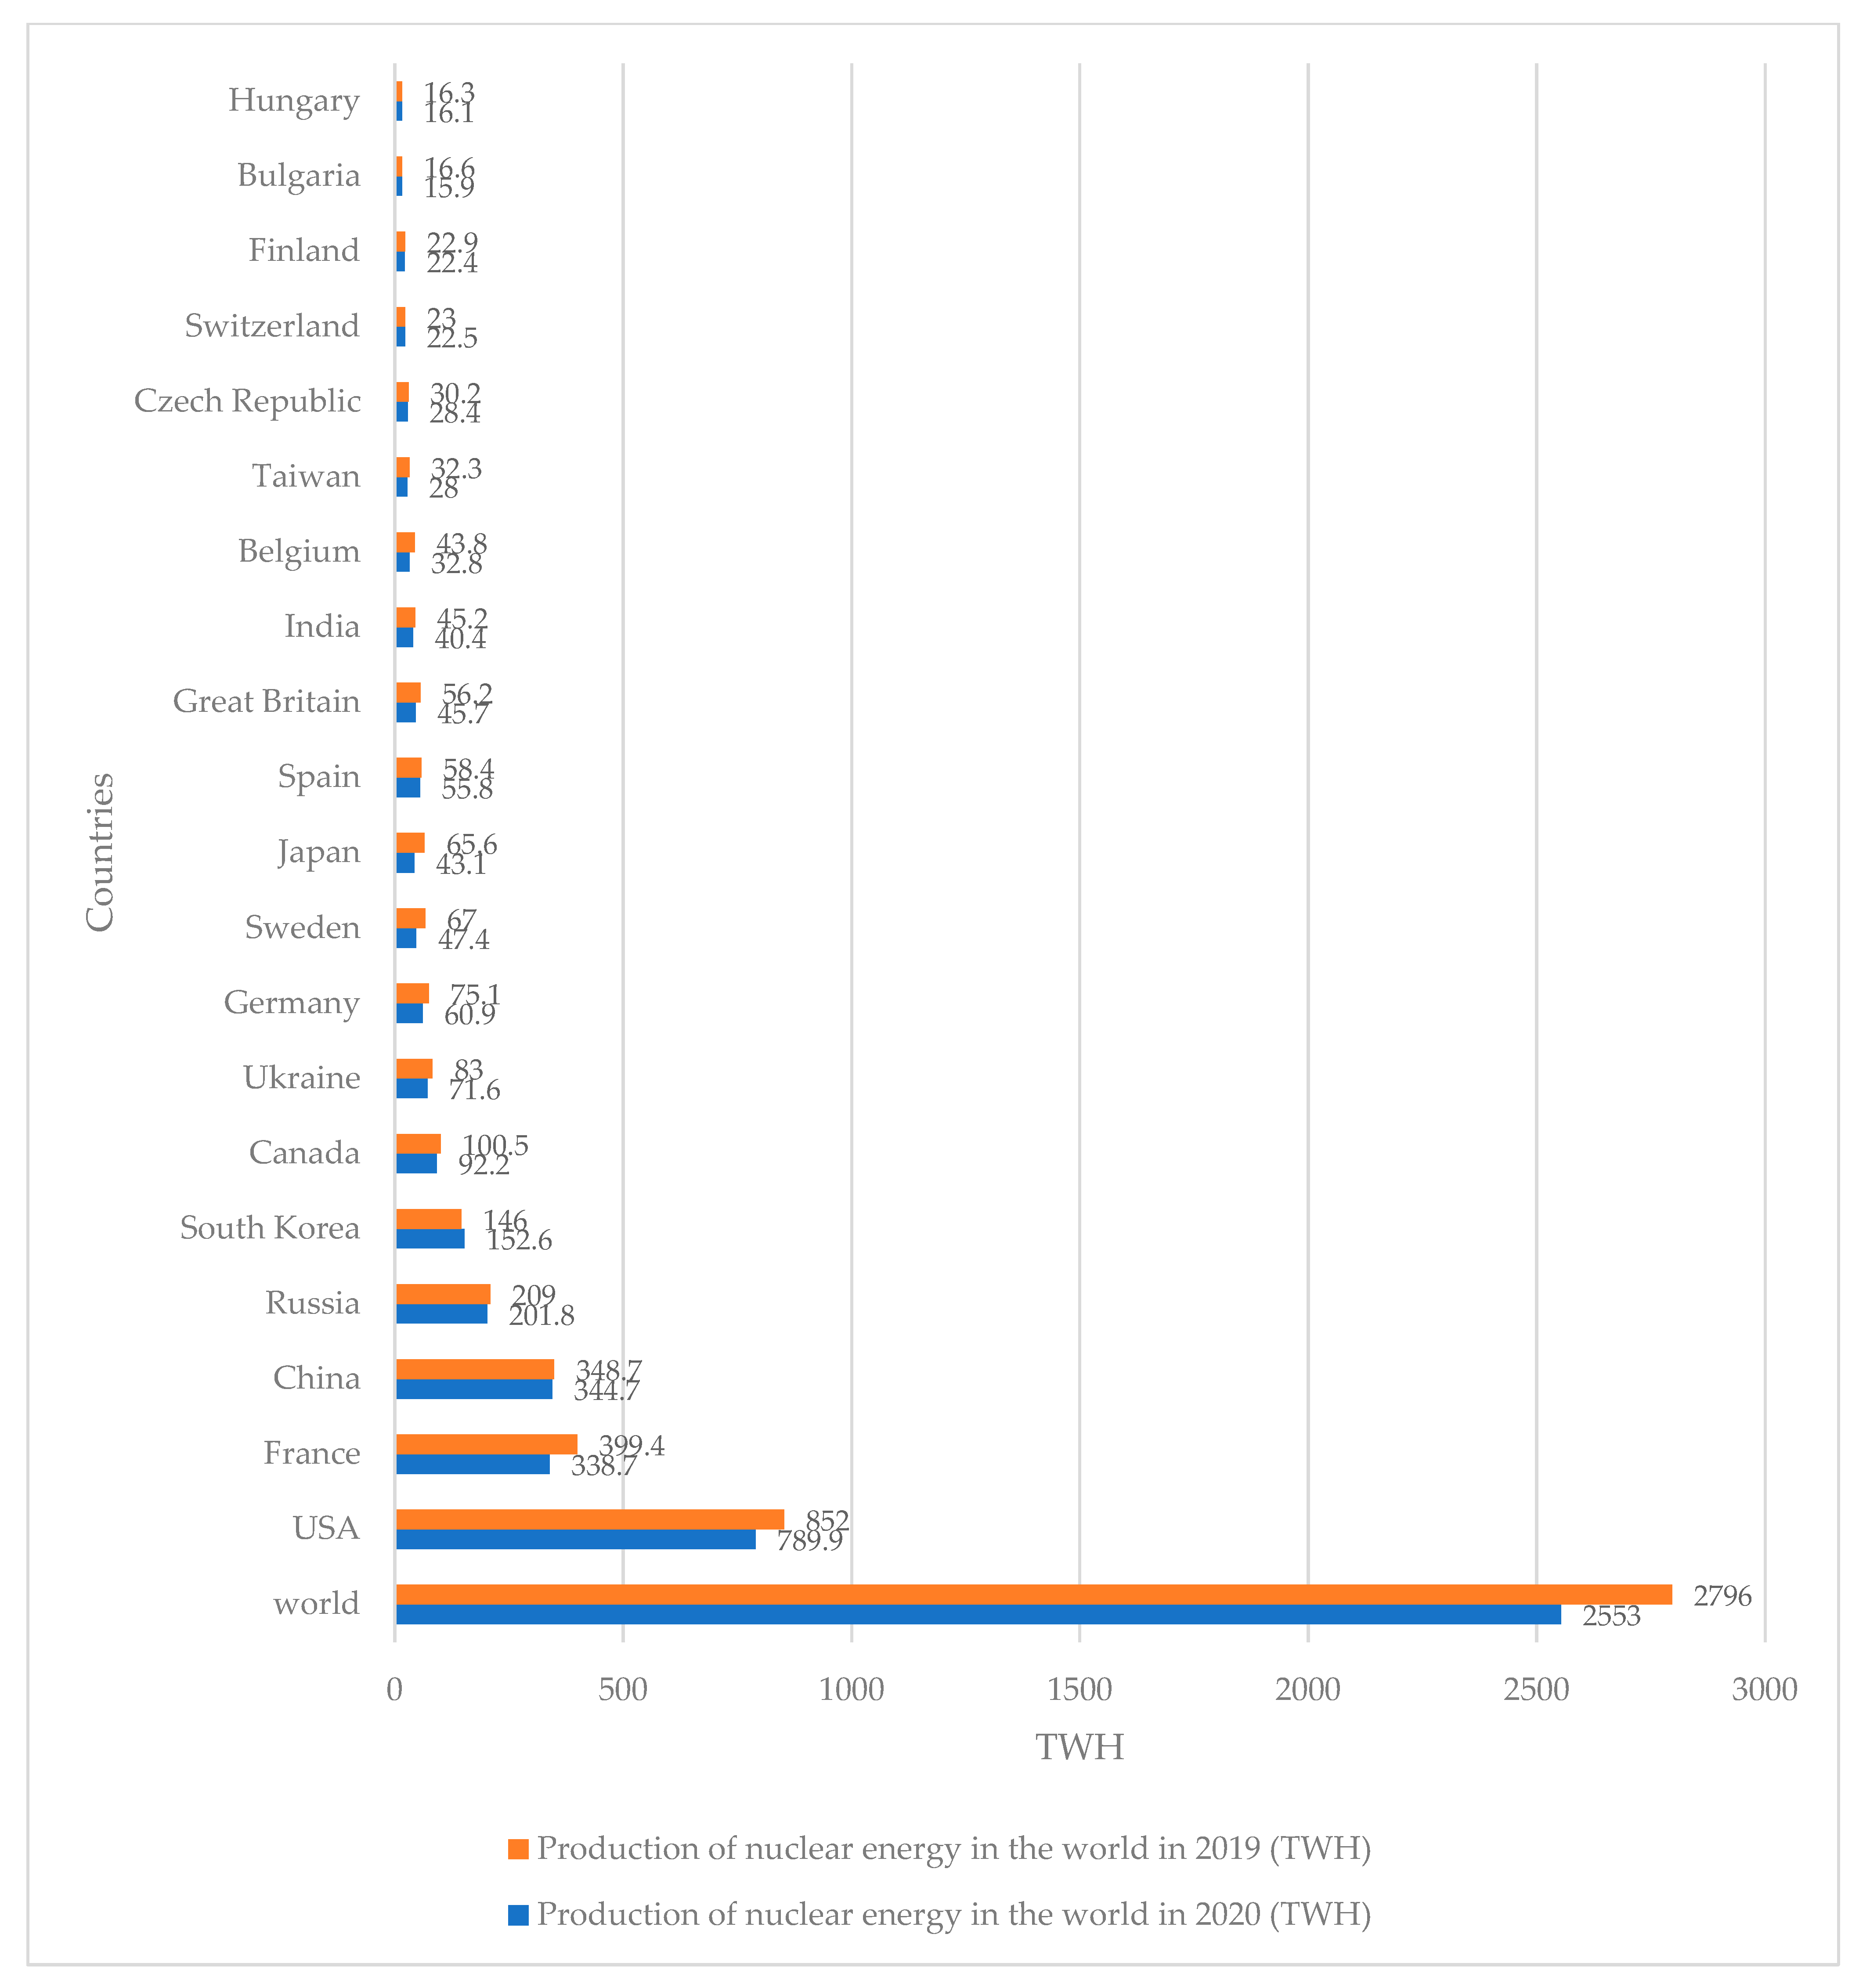
The production of nuclear energy decreased in 2020 compared to 2019. As we can see from
Figure 4, the decrease was noted in most countries. Only South Korea increased the production of nuclear energy in 2020 compared to 2019. The biggest producer was undoubtedly the USA. It accounts for more than 30% of the worldwide nuclear generation of electricity [
79]. The US generates about 98 GWe from 103 reactors, representing 20% of electricity, whereas world production is 370 GW of electricity from 436 nuclear power reactors [
80].
The European Union is a big producer of nuclear energy. However, the biggest producer of nuclear energy in the EU is France. Since Great Britain left the European Union, France has been the leader in nuclear energy production and consumption. Nuclear power plants such as Nord, Paluel, and Cattenom are the biggest French plants. These power plants have a capacity of more than 5200 MN each [
81]. Germany, Sweden, Spain, and Belgium are also big producers of nuclear energy in the European Union (EU). However, countries in the European Union have different strategies concerning nuclear energy. Some want to increase nuclear power production, and others, such as Germany and Belgium, wish to phase out nuclear power in the future, as they consider it very dangerous [
82]. There are 46 power units under construction in over 15 countries worldwide, most of them in China and India. Countries planning to increase the production of electricity should take into account the high costs of production. The high costs of building a nuclear power plant include a large amount of water for cooling the reactor, the protection of the environment against radiation, and the disposal of unprotected radioactive waste [
6]. Low greenhouse gas emissions put nuclear energy in the position of modern electricity technology [
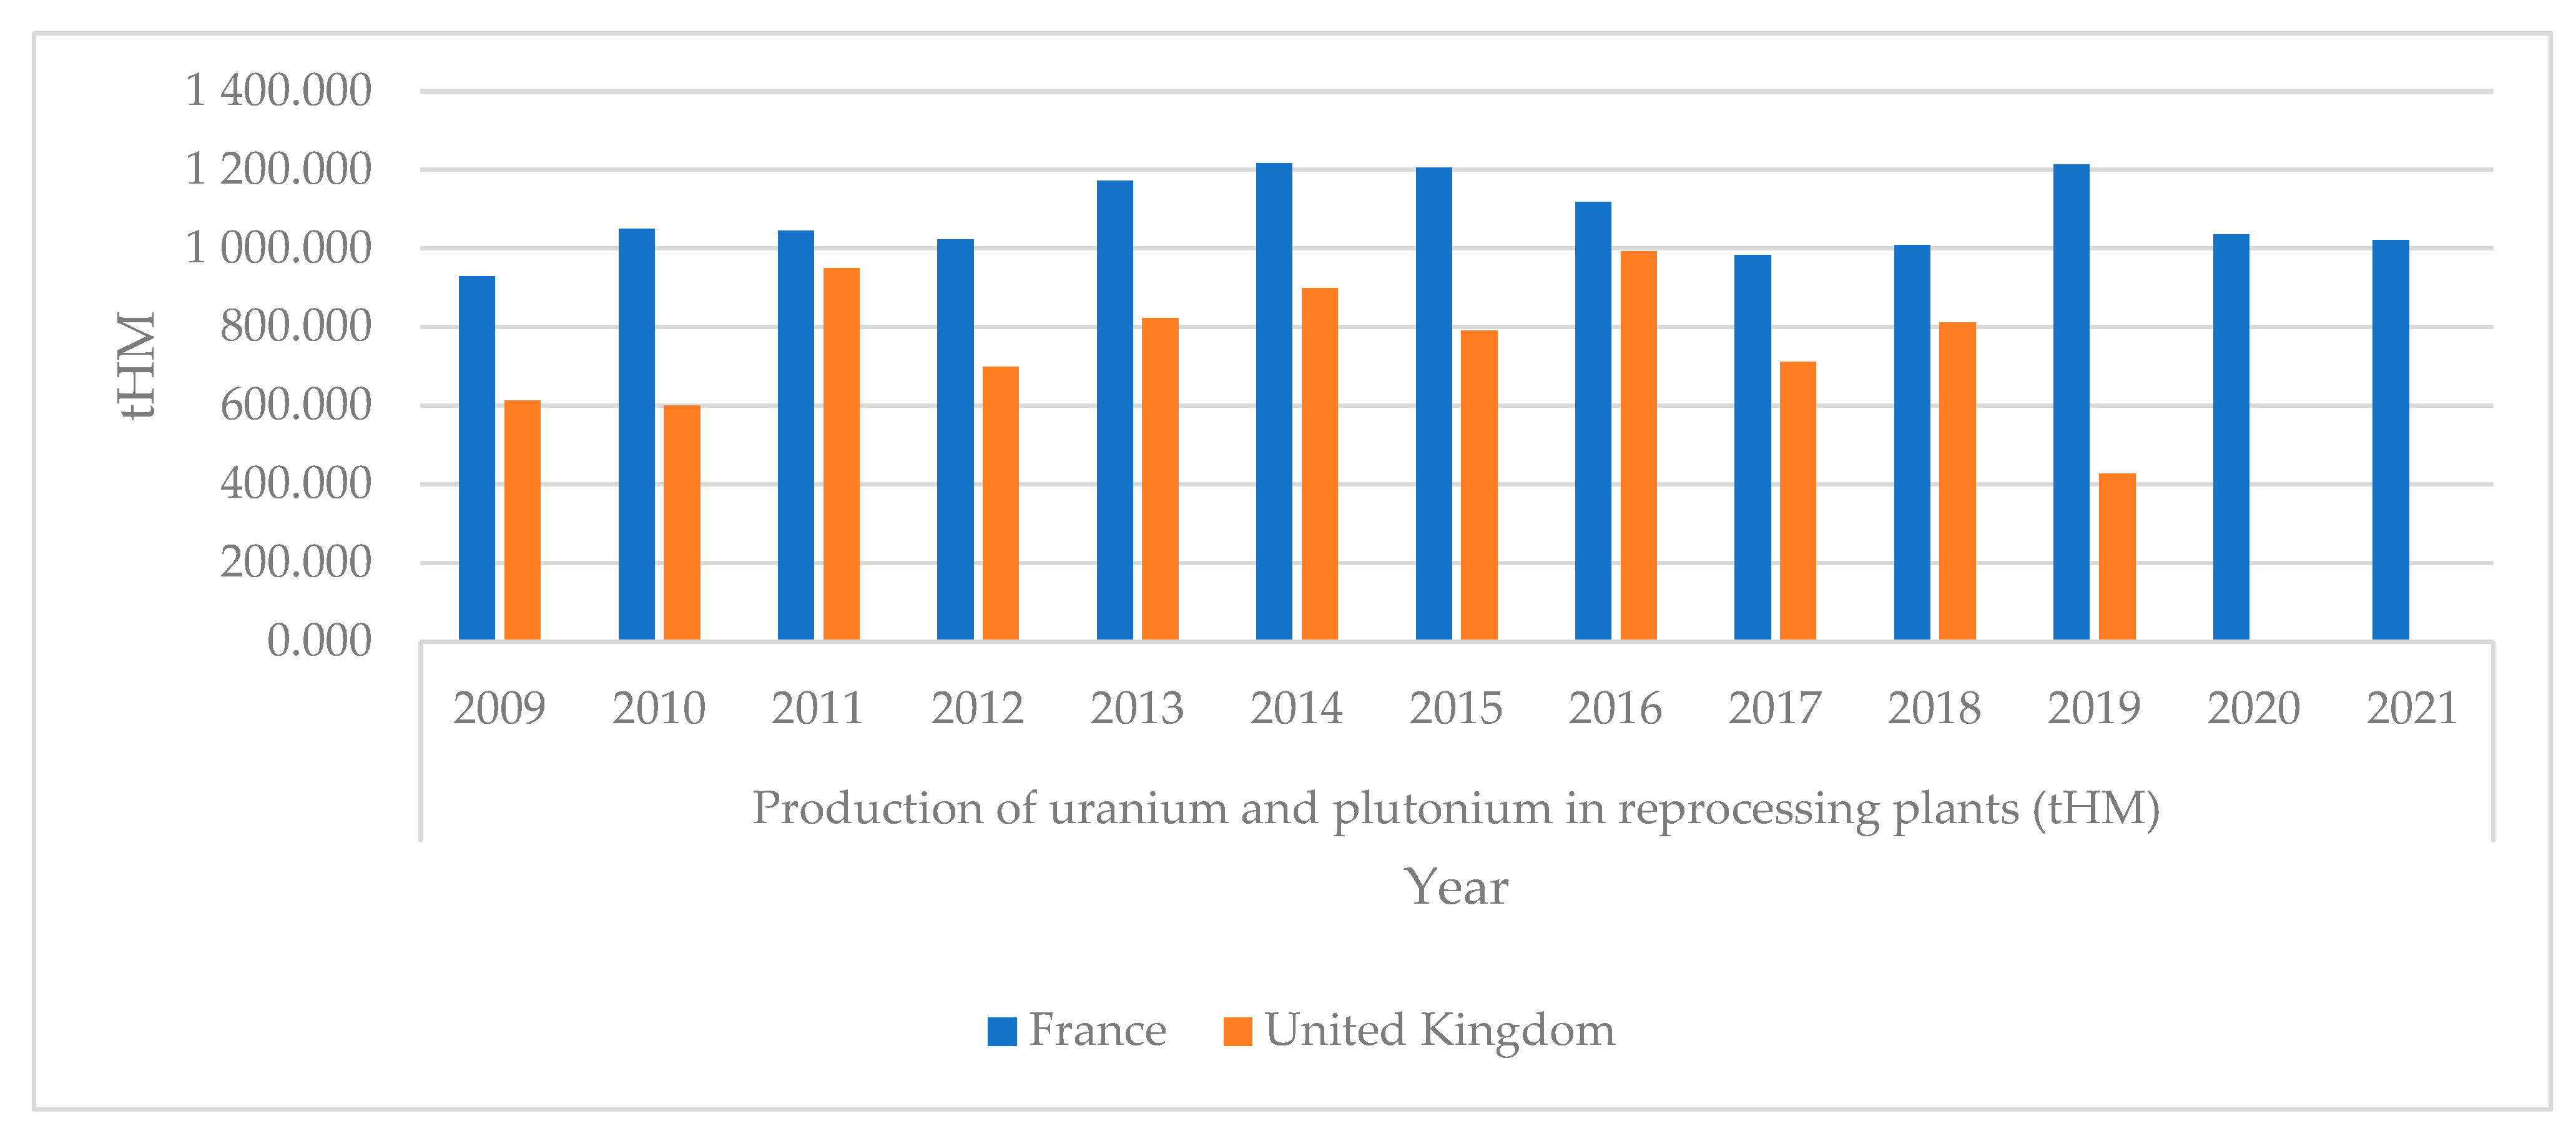
83]. The main chemical elements for nuclear energy production are uranium and plutonium. France is the biggest producer of uranium and plutonium in Europe, and production was 1,021,100 tons of heavy metal (tHM) (
Figure 5).
Nuclear fuels consist of uranium and thorium. From 1 kg of uranium, 235 times as much energy is obtained as in thermal power plants from 2500 tons of coal or 1800 tons of petroleum products [
6]. Processes pertaining to the extraction and conversion of uranium ore are long. They also need energy that can also emit greenhouse gases (GHG) that are attributed to nuclear power [
84].
3.2. Gross Nuclear Electricity Production in the European Union (EU)
The European Union is also a big and meaningful producer of nuclear energy. In some countries, nuclear energy production is the main source of energy, such as France, Slovakia, Ukraine, and Hungary.
To analyze the changes in gross nuclear electricity production, we conducted descriptive statistics (
Table 2). The highest average gross nuclear electricity production in the period 1990–2021 was achieved by France (401,590 GWH), Germany (129,820 GWH), and Sweden (65,345 GWH). The smallest gross nuclear electricity production was in the Netherlands (3832.2 GWH), Slovenia (5382.6 GWH), and Romania (7124.1 GWH).
The coefficient of variation describes the changes in the analyzed variables, and the highest was noted in Lithuania (0.86949) and Romania (0.63354). This informs the changes. For example, Romania started with zero production in 1990 and ended with a production of 11,752 GWH. Lithuania, for example, started with a production of 17,033 GWH and ended with zero production.
Skewedness and kurtosis describe the changes in variables. In terms of skewedness, in most cases, the data were negative, so the data were left-handed compared to the average. Kurtosis was positive in the following examples: Belgium, Bulgaria, Hungary, and the Netherlands. The data are right-handed.
3.3. Stationarity Analysis of the Gross Nuclear Electricity Production in the EU
The energy time series analysis is based on its stationarity or nonstationarity analysis, linerality and nonlinerality, complexity, and seasonality analysis. The nature and pattern characteristics of time series concerning nuclear energy market development can be used to explore perspectives [
85].
In
Table 3, we present the augmented Dickey-Fuller test for gross nuclear electricity production. We tested two hypotheses. The null hypothesis was that the series has a unit root, and the alternative was that the series does not contain a unit root [
86].
We evaluated the gross nuclear electricity production by p-value. This value was quite high, which suggests that the data are not stationary. Only in five countries, Belgium (0.026), the Netherlands (0.001), Slovakia (0.003), Finland (0.000), and Sweden (0.022), were they lower than 0.05, which suggests the stationarity of the gross nuclear electricity production time series.
When describing the data using the test with intercept and linear trends, we achieved similar results, and five countries’ data describing gross nuclear electricity production achieved stationarity. Our time series were transformed from non-stationary to stationary for applying the ARiMA model. Using statistical techniques, we used the ARiMA model, which is a simple tool for analyzing time series [
87].
For the process called nuclear electricity production, the Dickey-Fuller test was performed to test its stationarity. The significance of the delay up to order 5 was checked based on the AIC criterion.
Null hypothesis: The gross nuclear electricity production process was assumed to have a unit root, implying non-stationarity, and was therefore an I(1) process.
Free expression test characteristics (no trend):
Model: (1 − L)y = b0 + (a − 1) × y(−1) + e
The estimated value of (a − 1) is negative for all countries.
The (1)tauc(1) test statistic is also negative for all countries.
The asymptotic p-value is high for most countries which indicates that we cannot reject the null hypothesis at the 5% significance level for this model.
Only Finland, Slovakia, Sweden, and the Netherlands achieved the low value of p and the null hypothesis for these countries can be rejected.
The autocorrelation of the residuals for the first lag is quite low for all countries, which may indicate some dependence in the residuals.
Test with intercept and linear trend:
Model: (1 − L)y = b0 + b1 × t + (a − 1) × y(−1) + e
The estimated value of (a − 1) for all countries has a negative value.
The tauct(1) test statistic is negative for most countries, except France (0.561).
The asymptotic p-value is high for most countries, which means that we definitely cannot reject the null hypothesis for this model. Only for Germany, the Netherlands, Slovakia, and Sweden, can the null hypothesis be rejected.
The autocorrelation of the residuals for the first lag is high, which may also indicate a pattern in the residuals.
Based on the results obtained, we cannot reject the null hypothesis for any of the models, which suggests that the gross nuclear electricity production process is probably non-stationary.
After differentiation, the gross nuclear electricity production process appears to be non-stationary, especially when we consider a model with a linear trend. However, the autocorrelation values of the residuals indicate that the model may not be perfect, which is worth considering in further analysis.
Table 4 and
Table 5 present the ARiMA model for gross nuclear electricity production in EU countries. We evaluated the model based on
p-value. The
p-value describing the AR part of the model was quite low, which confirms the stationarity of the time series. The ARiMA model to forecast the gross nuclear electricity production in the EU showed favorable forecasting performance. Similar results were achieved by Ding et al. [
24], who found a similar prognosis for US nuclear power consumption. Nuclear energy represents the future and is described as a zero-emissions source. Its role in future energy demand cover is enormous, and it provides options for governments [
88].
Taking into account observations from the period 1990–2022 (N = 33 observations in total), the ARIMA model was estimated (after eliminating the need for an integrated component). For the nuclear electricity production variable, an analysis was performed using the AS 197 method, suitable for estimation using the maximum likelihood (ML) method. The following results were obtained from the estimation of the ARIMA model for the constant biomass variable:
Autoregressive coefficient (phi_1): The estimate for the first lag is quite high for all countries with low standard errors. Excellently statistically significant (high z; p ≈ 0), this indicates a strong autoregressive influence of past values of nuclear electricity on its current values.
Moving average coefficient (theta_1): The estimate for the first lag is relatively high for all countries with low standard errors. Even though the value of the z statistic is also relatively high, this coefficient is not statistically significant (high p value).
Additionally, the analysis of AR and MA elements suggests the stability of the models. Specifically, the AR root demonstrates the stability of the autoregression for all countries, while the MA root highlights the inverse relationship in the moving average for gross nuclear electricity production.
The analysis of ARMA models for total energy from 2005 to 2020 showed strong autoregression, which indicates the influence of past gross nuclear electricity energy production values on its current levels. Key statistics, such as the high coefficient of determination R2, confirm the model’s ability to explain variability in the data. Moreover, the stability of the model was verified by AR and MA root analyses, highlighting its reliability.
Forecasts for the period 2023–2032 suggest relatively stable gross nuclear electricity production, despite growing uncertainty in the longer term. Estimates indicate diversified development of the nuclear sector in the EU, with minor fluctuations in production and increasing forecast error. This means that although some stabilization of production can be expected, it will be important to monitor market and technological changes affecting the nuclear sector.
In summary, the presented analysis provides an in-depth look at gross nuclear electricity production in the EU, relying on solid statistical and econometric methods. This enables a better understanding of trends and potential changes in the sector, which is crucial for planning and implementing nuclear energy strategies.
The key statistics of the models are as follows:
The coefficient of determination R2 is quite high for all countries, which indicates the high ability of the model to explain the variability in nuclear electricity production data.
The log likelihood of the model is relatively high for all countries, which is important for comparisons with other potential models for gross nuclear electricity production.
3.4. Prognosis of the Gross Nuclear Electricity Production in the EU Using ARIMA Model
Nuclear energy is the future; however, it is also the most debatable and controversial energy. The construction boom has been particularly noticeable in Asia. The importance of this energy is increasing worldwide. It is believed that nuclear energy can replace conventional fuels and will improve energy security [
89].
Predicting the nuclear energy market is important because policymakers, planners, and producers can obtain useful information for nuclear energy development. Numerous factors affect the prognosis of the nuclear market, such as nuclear accidents, investment supports, technology improvements, and political bias [
90].
Our research enables us to elaborate on the prognosis (
Table 6). The research is quite optimistic. Eight countries in the EU will record an increase in gross nuclear electricity production. Based on the ARIMA model, the following countries will increase gross nuclear electricity production: for example, Belgium, Czechia, France, the Netherlands, Romania, Slovenia, Spain, and Sweden. We did not elaborate on the prognosis for Lithuania because this country stopped using nuclear energy in 2010. Countries such as Bulgaria, Finland, Hungary, and Slovakia will record a decrease in gross nuclear electricity production in the period 2023–2032. Germany will stop producing nuclear energy in the future. Energy concerns, which are a global challenge, show that nuclear energy prediction can enhance positive energy security and also reduce the emission of greenhouse gases (GHG). The future prognosis depends on policy too. Future gross nuclear electricity production depends on information about the upcoming modernization or decommissioning of a unit. However, the current situation and war in Ukraine have forced European Union countries to treat gross nuclear electricity production as a priority. Some countries, such as Poland, which does not produce electricity from nuclear resources, will introduce it in the future to replace fossil fuels and ensure a stable energy supply.
The prognosis for nuclear energy is very promising because this sector can deliver many benefits for the European Union’s economy. The first benefit is increased energy security and the development of almost all sectors of the economy and technology [
91].
The analysis of the forecasts shows that gross nuclear electricity production will remain at a stable level, with minor fluctuations. Nevertheless, there is a noticeable increase in forecast error in subsequent years, which indicates increasing uncertainty in long-term forecasts.
The 95% confidence intervals for subsequent years also widen, highlighting the increasing uncertainty of future forecasts. Nevertheless, these forecasts provide important information about potential trends and can serve as an auxiliary tool in planning development strategies for the nuclear sector.
3.5. Prognosis of the Gross Nuclear Electricity Production in the EU Using the VAR Model
To diversify the analysis, we used the Vector Autoregressive model (VAR) model. As previously mentioned, this method is widely used in forecasting and deep analysis.
In the next step, the order of variable delays was examined (
Table 7). The VAR model successfully passed the verification process (the random component of the model was not normally distributed). The choice of the order of variable lags depends on the researcher, but several criteria indicate to econometricians the best order of lags, and the most popular of them includes Akaike’s information criterion AIC, Schwarz BIC, and Hannan and Quinn HQ.
All criteria indicated the first order of lags of the vector-autoregressive model; therefore, the parameters of the VAR model were estimated. Both the Akaike information criterion and the Hannan and Quinn information criterion indicated the order of lags equal to I (the smallest value of the information criterion). Because most criteria indicated the order of lags equal to I, as well as the fact that we estimated the model based on quarterly data, the authors decided to choose this order of variable lags.
The adjusted coefficient of determination R
2 for the individual equations is very high for all countries. The model has been successfully verified and can be used to predict gross nuclear electricity production. KMNK was used to estimate the parameters of the VAR model. The estimated parameters are presented in
Table 8. As previously stated, the parameters of the VAR model were estimated for the first differences of the variables.
P-values less than 0.05 indicate a significant multiple correlation coefficient. The next step was to examine the autocorrelation of the random components of the individual model equations (
Table 8) and to check whether the individual random components had a normal distribution.
The
p values in
Table 8 indicate the lack of autocorrelation of the random components and prove that the residuals of the individual equations are normally distributed. VAR models have successfully passed the verification process and can be used to determine forecasts for the studied variables.
We used the Portmanteau test to analyze the VAR model. This is a widely used model to evaluate the adequacy of the model’s fit. This statistical test is constructed based on the squared residual autocorrelation function. Based on the achieved results, we can conclude that the model is well-fitted in most countries of the European Union (EU).
Table 9 shows point forecasts, ex-ante forecast errors, 95% confidence intervals for forecasts, and actual values of gross nuclear electricity production in the EU.
All statistics refer to the first differences between both variables. The presented analysis shows that the 95% confidence interval of the forecasts covered the actual value of the forecast variable in the period for which the forecast was calculated. It should be remembered that the forecast interval depends on the average forecast error, so the larger the error, the wider the confidence interval, and vice versa; i.e., the smaller the error, the narrower the confidence interval.
After verifying the model, the forecasts of all variables used for vector autoregressive modeling were calculated. Both point and interval forecasts for two consecutive quarters were counted, and then the forecasts were compared with the actual values of the studied variables in these periods. All predictions concern the first differences between the studied variables. The vast majority of forecasts were accurate. Based on the VAR model, we elaborated the prognosis according to which countries, such as France, Romania, Spain, and Sweden, will increase gross nuclear electricity production in the period 2022–2026.
Based on our prognosis using the VAR model, we can state that five countries will increase gross nuclear electricity production in the period 2023–2032; for example, Czechia, France, the Netherlands, Romania, and Sweden. According to our prognosis, more countries will record a decrease in gross nuclear electricity production in the period 2023–2032; for example, Belgium, Bulgaria, Finland, Hungary, Slovakia, Slovenia, and Spain. Based on our prognosis using the VAR model, Germany will not produce gross nuclear electricity in the coming future.
When comparing the two prognoses based on the ARiMA and VAR models, we can state that the forecasts based on ARIMA models are more optimistic. This is the reason why ARiMA models are used worldwide for predictions. The VAR models are stricter, and the prognosis has more errors. However, these are the limitations of research and prognosis, which depend on data sources. However, global documents and prognosis elaborated by the International Energy Association suggest that nuclear energy in the European Union will deliver 11% of total energy supply in 2050, compared to 10% in 2020. Moreover, in the electricity and heat sectors, nuclear energy will have a share of 13%, compared to 15% in 2020 [
92].
