Abstract
A smart grid protection system based on phasor information at circuit breakers is proposed in this paper. Phasor data for fault diagnosis is obtained from phasor measurement units or intelligent electronic devices installed near circuit breakers, without the need for additional measurement equipment. When a fault occurs, the protection system first locates the core protection circuit breaker closest to the fault point. It then identifies the faulty component by analyzing the current phasor differences between this breaker and adjacent ones. This scheme offers high computational efficiency, enabling rapid identification of faulty equipment and its precise location. The proposed protection system structure can be divided into two types: centralized and decentralized, and the most suitable scheme should be selected based on the actual situation. Finally, the feasibility of the proposed scheme was verified through the IEEE 39-bus system and a simulated actual area power grid model, demonstrating its applicability to practical smart grid scenarios. The simulation network validates the implementation method of the proposed protection strategy.
1. Introduction
A smart grid enhances the reliability, efficiency, and flexibility of the power system through various sensors, communication protocols, automation algorithms, and data analysis software. This advancement brings higher precision and detail requirements for power system operation and management. Given the abundant data and complex communication channels in smart grids, the coordination between protection systems and smart grids has become increasingly crucial.
Traditional relay protection systems primarily rely on hardware devices like protection relays to safeguard the power system. These systems offer fast response and high reliability but struggle to meet the complexities of smart grids [1]. In contrast, smart grid protection systems can coordinate each device to prevent the spread of issues during large-scale power system disturbances. Additionally, protection strategies and parameters are dynamically adjusted through wide-area monitoring technology. When faults occur, they are automatically identified and isolated, reducing the impact of power outages and improving the grid’s self-healing ability and operational reliability [2,3].
Recent years have witnessed significant advancements in smart grid protection system research. According to [4], the implementation of smart grid protection systems involves upgrading traditional protection methods and segmenting the overall system’s protection scope into distinct zones. Moreover, the incorporation of backup relays ensures system resilience, allowing effective operation even in the event of individual relay failures. While this approach effectively integrates traditional protection technologies into intelligent systems, it requires additional equipment investment and complicates data collection processes, potentially impacting overall reliability. Therefore, in the smart grid environment, wide-area monitoring, protection, and control systems play a crucial role in real-time monitoring of the power system, offering new perspectives for innovative implementation of protection systems [5,6].
The core of the smart grid protection system lies in utilizing wide-area information to identify and diagnose faults [7]. In this context, several algorithms have been proposed in the literature to enhance operational reliability. Firstly, wide-area voltage and current protection is a novel concept [8]. To enhance protection algorithm efficiency, [9] proposed a fault detection and processing function based on the analysis of voltage data from synchronous phasor measurement units. The advancement of intelligent electronic devices has led to the consideration of limited relay protection systems with cellular and regional centralized decision-making as viable solutions [10]. Partitioning protection areas based on fault current distribution characteristics can significantly reduce communication traffic [11]. Another implementation method involves distributing data and algorithms across multiple intelligent electronic devices [12].
Many recently proposed protection algorithms, despite their innovations, struggle to replace the main protection functions due to high communication traffic and low fault tolerance. Consequently, they are often implemented as backup protection in practical applications [13,14]. Ref. [15] investigated the switching of protection ranges in wide-area protection, addressing key technologies and methods for transitioning between main and backup protection areas. This includes fault detection and localization, zone selection and optimization, and switching strategies and control.
Refs. [16,17] proposed a protection algorithm utilizing dual-terminal distance measurement and voltage-current estimation for finite phasor measurement units. This approach aims to address the limitations of traditional backup protection, such as complex settings and prolonged operation times. Ref. [18] proposed a protection scheme based on positive sequence integral impedance phase angle, enhancing protection performance through the use of positive sequence phasors of voltage and current signals. Ref. [19] introduced a protection algorithm based on compensating voltage modulus comparison, further addressing and improving power loss scenarios in line protection devices. In short, protection algorithms have undergone various improvements. The ongoing optimization of these algorithms and schemes in the literature continues to drive the development and maturation of smart grid protection technology.
This paper proposes a smart grid protection system based on phasor information at circuit breakers to identify fault locations using wide-area measurement data. This system comprises two key components: the determination of the core protection circuit breaker (CPCB) and a fault identification algorithm. Phasor data for fault diagnosis is obtained from phasor measurement units (PMUs) or intelligent electronic devices (IEDs) installed near circuit breakers. This approach eliminates the need for additional measurement equipment, thereby overcoming challenges in data transmission and infrastructure. When a fault occurs, the protection system first locates the core protection circuit breaker closest to the fault point. It then identifies the faulty component by analyzing the current phasor differences between this circuit breaker (CB) and adjacent ones. Subsequently, the control unit sends instructions to isolate the fault. This scheme offers high computational efficiency, enabling rapid identification of faulty equipment and its precise location.
Compared to traditional relay protection methods, the proposed scheme has the following advantages:
- The protection system is designed for large-scale power grids rather than specific equipment such as transformers, lines, or buses. It selects core protection circuit breakers based on their functional category within the grid, independent of the protected equipment’s types.
- Faulty components are identified by analyzing current phasor differences between the core protection circuit breaker and adjacent circuit breakers using wide-area measurement data from PMUs or IEDs. This straightforward algorithm effectively addresses all types of faults in the power system.
- The proposed protection system structure can be divided into two types: centralized and decentralized. A decentralized structure suits large-scale areas or scenarios with relaxed backup protection time requirements, while a centralized structure is preferable for situations demanding high-level protection or upgrades of existing grid infrastructure. The most suitable solution should be selected based on the actual situation.
The paper is organized as follows: The first part introduces the development of protection systems and outlines current research trends in smart grid protection schemes. Section 2 details the smart transmission network, emphasizing its information collection, equipment operation, and load scheduling mechanisms. In Section 3, the implementation method of a smart grid protection system based on the distribution of phasor information at circuit breakers is explored, and the fault identification algorithms, core protection circuit breaker selection, and protection system structure types are explained in detail. Section 4 validates the proposed scheme’s feasibility using the IEEE 39-bus system and a simulated actual area power grid model, demonstrating its applicability to practical smart grid scenarios. Section 5 concludes this paper and proposes future research directions.
2. Smart Transmission Networks
A smart grid enhances power system automation, intelligence, and efficiency through advanced information and communication technologies. It comprises both smart transmission and distribution networks [20]. This article focuses on the protection system used in smart transmission networks. The following sections will discuss this in detail.
The smart transmission grid enables real-time monitoring and control of power grid status, power quality, and power load through high-speed, high-bandwidth communication networks, thus achieving automated operation and management of the power grid. Additionally, smart transmission technology facilitates long-distance power transmission while minimizing losses [21]. A smart transmission network comprises multiple interrelated and interdependent components, functionally categorized into monitoring, operation, and scheduling, as shown in Figure 1. This structure enables automation, intelligence, and efficient management of the power system [22].
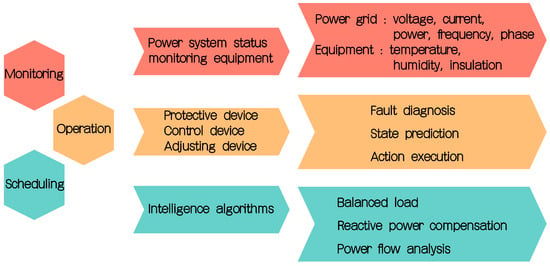
Figure 1.
Main components and functions of smart grid.
Intelligent monitoring relies on high-speed, high-bandwidth communication networks and intelligent sensors to collect and analyze real-time data on operational status, power quality, power load, and other parameters of each node. This system enables prompt detection of abnormal states. In substations, strategically placed sensors and monitoring equipment continuously track operational parameters, including voltage, current, and power, temperature, humidity, and equipment status. This setup allows for real-time monitoring and swift detection of faults and anomalies [23,24].
Intelligent operation employs digital protection devices and intelligent relays to protect and control the transmission network, achieving rapid and accurate fault detection, location, and isolation, thereby ensuring the safe operation of the power system. Shared data from intelligent monitoring systems facilitates remote maintenance and management of electrical facilities. This enables online monitoring, fault diagnosis, and status prediction, ultimately enhancing equipment reliability and operational efficiency [25,26].
Intelligent scheduling, bolstered by advancements in automation control technology and smart algorithms, analyzes monitoring data from smart transmission networks. Using predictive algorithms, it optimally allocates loads in current and future power grids while automatically and accurately performing voltage control, reactive power compensation, and load balancing. It responds promptly to various faults, eliminates faults within the smallest possible range, reduces the outage area, quickly isolates faults, and restores power supply as soon as possible. Furthermore, the system performs intelligent optimization based on real-time conditions, ensuring efficient operation of the transmission network [27,28].
3. Methodology
This chapter details the various stages of the proposed method. Firstly, perform fault analysis using PMU or IED data from the wide-area measurement network. Next, based on the analysis results, carry out fault detection to identify the affected circuit breakers and faulty equipment at each end of the fault location. To reduce computational redundancy, the equation for determining the current phasor is based on the circuit breaker’s functional category in the network while establishing a core protection circuit breaker. The third stage designs the system structure, which can be either distributed or centralized depending on the equipment arrangement. The following sections will provide detailed descriptions of these stages.
Figure 2 illustrates the substation area network model. Assume Substation B is a 220 kV substation serving as the power supply terminal, Substation A is a 110 kV substation serving as a connecting substation, and Substation C is a 110 kV substation serving as the receiving end of the network. Using Substations A and Substations C as examples, this paper proposes a fault identification method for smart grid protection systems based on circuit breaker phasor information.
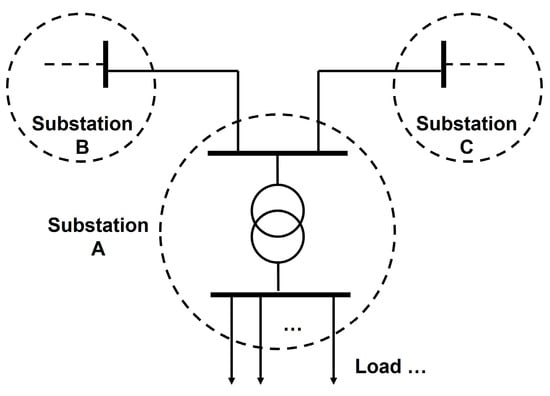
Figure 2.
Substation wide-area network.
3.1. Fault Analysis
Figure 3 depicts the single-line diagram connecting Substation A and Substation C. Both of them employ a single bus segmentation method on their 110 kV sides. IA1, IA2, IA3, IA4, IC1, IC2, IC3, IC4, IAm, and ICm are the measured secondary current values of the current transformers at the corresponding circuit breakers. Applying Kirchhoff’s current law to these parameters, the sum of currents flowing into each bus during normal operation equals zero. This yields the following current relationships for the 110 kV side of Substation A:
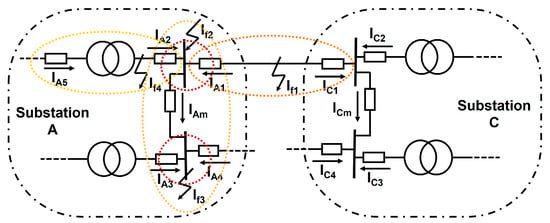
Figure 3.
Single-line diagram of Substation A and Substation C.
(1) Assuming the fault occurs between Substation A and Substation C, i.e., the fault is on line AC with a fault current of If1, the current value at bus 1 changes, modifying the current equation as follows:
(2) Assuming the fault occurs on the upper bus of Substation A (Figure 3), the current value at the upper bus changes, updating the current equation to
(3) Assuming the fault occurs on the lower bus of Substation A (Figure 3), the current value at the lower bus changes, modifying the current equation to
(4) Assuming the fault occurs on the upper main transformer of Substation A, the current values at the upper bus and the low-voltage side of the upper transformer change, updating the current equation to
Analyzing assumption (1), the fault occurs between circuit breaker A1 and circuit breaker C1. In this case, only the equation containing both IA1 and IC1 parameters changes in the current equation set, while others remain constant. This indicates a fault between circuit breaker A1 and circuit breaker C1. To isolate the fault, circuit breakers A1 and C1 should be disconnected, aligning with the initial assumption.
In assumption (2), the fault occurs among circuit breaker A1, circuit breaker A2, and circuit breaker Am. The current equation system shows changes in equations both containing IA1 and IA2 parameters, while others remain unchanged. This initially suggests a fault among circuit breakers A1, A2, A3, and Am. However, Figure 3 shows that circuit breakers A3 and A4 are not adjacent to A1 and A2, while A1 and A2 are adjacent to Am. Thus, we can conclude that the fault occurred between circuit breakers A1, A2, and Am. Disconnect circuit breakers A1, A2, and Am to isolate the fault, consistent with the assumption.
In assumption (3), the fault occurs among circuit breakers A3, A4, and Am. The changes in the current equation system are similar to those in assumption (2). Using analogous inference methods, the fault range can be determined, which confirms the assumption.
Assumption (4) presents a fault between circuit breakers A2 and A5. In the current equation system, applying the inference processes of assumptions (1) and (2), the fault occurs among circuit breakers A1, A2, A5, and Am. However, since circuit breakers A1 and Am are not adjacent to A5, only circuit breakers A2 and A5 should be disconnected.
These assumptions demonstrate that each fault area is enclosed by circuit breakers. In smart grids, each circuit breaker is equipped with a PMU or IED that measures all currents entering the potential fault zone. When a fault occurs in an area, the total incoming current increases significantly compared to pre-fault conditions. Consequently, an area is designated as the fault zone if the sum of its currents exceeds a predefined threshold. During a fault, the current difference at circuit breakers on both ends of the fault changes, while other circuit breakers show no significant changes. However, multiple circuit breakers within the same area may exhibit changes in current difference. To minimize the fault impact, the operational status and relative positions of circuit breakers must be considered to ensure only adjacent breakers operate, preventing overstepping tripping. Therefore, we propose a fault diagnosis method based on current difference. This method incorporates wide-area monitoring information exchange, extends beyond protection equipment, and coordinates the action time and sequence of circuit breakers at the network level. Figure 4 illustrates the workflow of this method.
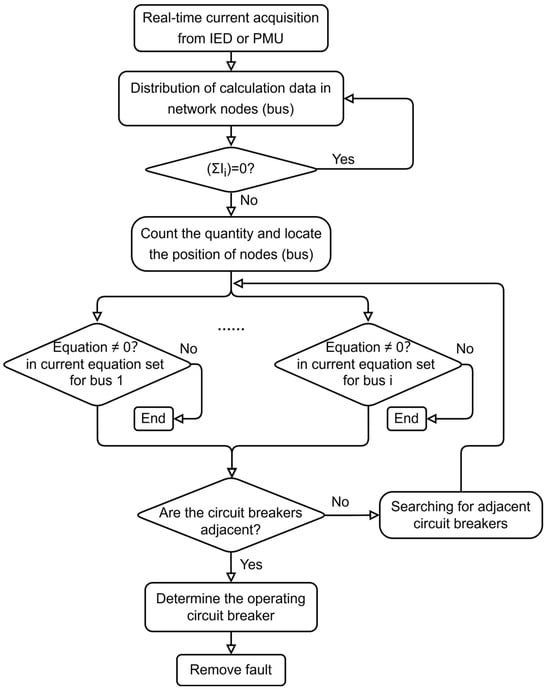
Figure 4.
Fault identification flowchart.
3.2. Determination of Core Protection Circuit Breakers
Our analysis revealed that fault occurrences cause sudden changes in the current phasors of adjacent circuit breakers. However, fault diagnosis based on different circuit breakers leads to redundant equation systems for identical current phasors, resulting in unnecessary computational redundancy. To eliminate this redundancy, we decided to determine the current phasor and equation system based on the functional position of the circuit breaker within the network. This circuit breaker is termed a core protection circuit breaker.
Core protection circuit breakers are selected based on their location and network topology. They are categorized according to their functions and connected devices as power supply side circuit breakers, power receiving side circuit breakers, transformer high-voltage side circuit breakers, transformer medium-voltage side circuit breakers, transformer low-voltage side circuit breakers of transformers, and distribution line circuit breakers. To optimize calculations, we apply the following principles:
- Line current differences are computed only at high-voltage side circuit breakers.
- High-voltage bus and transformer current differences are calculated at transformer high-voltage side circuit breakers.
- Medium- and low-voltage bus current differences are computed at respective transformer side circuit breakers.
This approach ensures comprehensive network coverage while avoiding duplicate calculations.
3.3. Comparison Criteria
In theory, currents on the same line should be equal during normal power system operation, resulting in a zero current difference. However, current transformer errors and load current asymmetry can lead to non-zero differential currents in practice. Factors contributing to unbalanced currents include current transformer errors, transformer internal asymmetry, and load fluctuations, all of which may result in slight non-zero differential currents. To prevent protection system maloperation due to minor current variations during normal operation, the current difference threshold should be set marginally above these small currents. The criterion is thus defined as:
where K is the constraint coefficient and () represents the total operating current of the circuit breaker at a specific location.
Drawing from traditional relay protection practices and extensive field experience, a 10–20% operating current effectively identifies internal faults and maintains stability during normal operation and minor current imbalances. Thus, K is set between 0.1 and 0.2, thereby mitigating CT error impacts and preventing maloperation.
3.4. Protection Structure
The proposed smart grid protection system can be divided into two types based on equipment arrangements: decentralized and centralized.
3.4.1. Decentralized Structure
The decentralized structure, shown in Figure 5, equips each substation with an intelligent electronic device LAN. Data exchange and communication with the IEDs of other substations are carried out through the WAN, achieving comprehensive protection functions. IEDs are installed at every transformer and circuit breaker within smart substations. These devices operate with relative autonomy in measurement, computation, and control, enhancing system’s flexibility and reliability. This structure effectively distributes the protection system workload across various substations, reduces the load on individual equipment, and improves the protection system scalability and reliability. However, this configuration has limitations. Each IED primarily relies on local substation data, with restricted access to broader grid information. Consequently, achieving global optimal control becomes challenging.

Figure 5.
Decentralized structure.
3.4.2. Centralized Structure
Figure 6 illustrates the centralized structure of the smart grid protection system. In this structure, each substation is equipped with a data acquisition unit and an action execution unit, while a central processing unit is placed strategically within the overall power grid. All protection algorithms are centralized in the central processing unit. Data acquisition units collect nodal information, including electrical parameters, status indicators, and event details. The central processing unit performs three primary functions: (1) receiving data from acquisition units; (2) computing control commands via algorithmic processing; and (3) transmitting these commands to relevant action execution units through the network. As the system’s core, the central processing unit demands high-performance computing, substantial storage capacity, and rapid data transmission and processing capabilities, placing significant demands on its equipment. To ensure system continuity and reliability, backup equipment must be configured to handle unexpected situations, like main equipment failures. Moreover, communication system faults or instabilities can compromise the central processing unit’s analytical accuracy and command issuance, potentially impacting overall power grid operations.
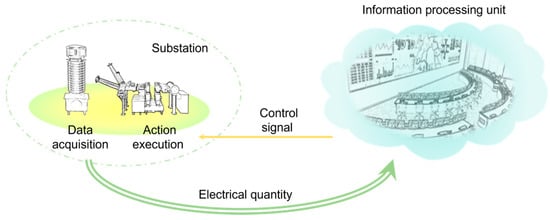
Figure 6.
Centralized structure.
Incorporating the aforementioned considerations, we have developed an updated flowchart depicting the overall area network protection strategy, as shown in the following Figure 7.
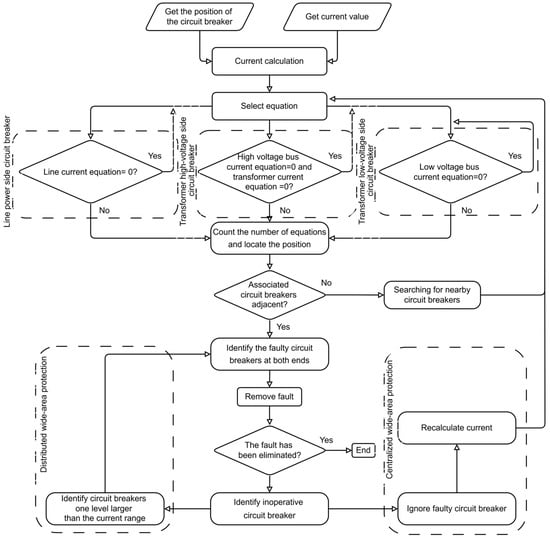
Figure 7.
Protection strategy flowchart.
4. Case Study
This chapter evaluates the efficacy of the proposed protection scheme through two distinct simulation scenarios. The simulation experiments comprise:
- (1)
- Comprehensive testing of universality and functional effectiveness across various fault locations and types.
- (2)
- Specialized testing for different fault conditions on various equipment.
4.1. Comprehensive Testing Using the IEEE 39-Bus Simulation Model
An IEEE 39-bus system was implemented in PowerWorld, as shown in Figure 8 [29]. The system’s basic parameters are presented in Table 1. The protection scheme encompasses all system branches. This study assumes ideal communication conditions, neglecting delays and channel interruptions and enabling real-time data transmission between devices and control centers. Based on this, the performance of the proposed smart grid protection system, which is based on circuit breaker phasor information, was comprehensively analyzed by simulating various faults at different positions in the system.
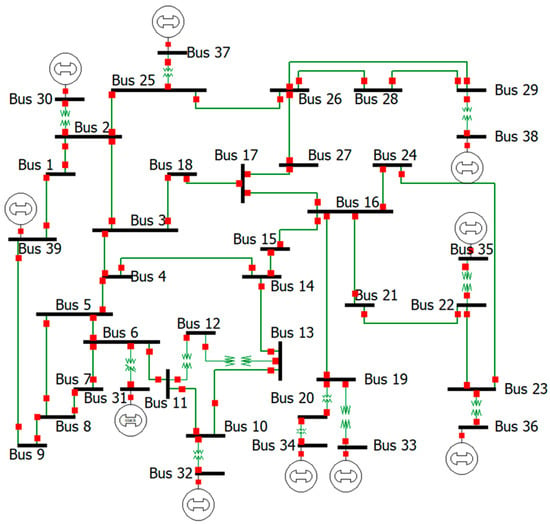
Figure 8.
IEEE 39-bus simulation model.

Table 1.
IEEE 39-bus system parameters.
Determination of core protection circuit breakers: Core protection circuit breakers are identified based on their strategic positions and the network topology structure. Table 2 delineates the distribution of core protection circuit breakers throughout the system. The system comprises 34 lines, 39 buses, 10 generators, and 12 transformers. Conventional protection schemes, employing primary and backup protection for each device, would necessitate 95 protection devices and 151 algorithmic calculations per operation. In the proposed protection scheme, only one protection device or input of the fault identification algorithm into 55 core protection circuit breakers is needed. The protection range still maintains comprehensive equipment coverage while reducing computational costs to 36.42% of conventional systems. This approach significantly reduces hardware costs, space requirements, and computational complexity while preserving protection efficacy.

Table 2.
Allocation table for core protection circuit breakers.
In the simulation system, various faults are set up to comprehensively analyze the protection system. Due to space limitations, we focus on four representative fault locations: F1 at 50% of the Bus5-Bus6 line, F2 at 70% of the Bus5-Bus6 line, F3 with a transformer fault at Bus12-Bus13, and F4 with a bus fault at Bus17. The simulated fault types encompass single-phase ground, interphase, and three-phase faults, all initiated at 0.5 s.
Fault identification: Figure 9 illustrates the current phasor variations at each core protection circuit breaker under different fault conditions. The core protection circuit breakers proximal to fault locations demonstrate consistent fault detection capabilities across all fault types. This prevents single-point measurement errors from causing fault omissions, effectively ensuring the fault tolerance of the protection system. Meanwhile, the number of core protection circuit breakers that need to upload fault information is limited, greatly reducing communication traffic. The core protection circuit breakers experiencing current changes are shown in Table 3. It is evident that the core protection circuit breaker is unique under different faults, significantly accelerating the calculation speed.
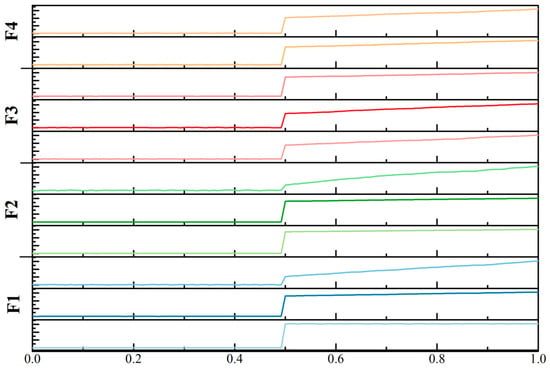
Figure 9.
Changes in the current phasor sum of core protection circuit breakers under different faults.

Table 3.
Core protection circuit breaker with changes in current sum.
Table 4 presents the results of the current equation calculations. After a fault occurs, the phasor sum is much higher than the threshold, enabling precise identification of circuit breakers on both sides of the fault point. These results validate the feasibility of the proposed algorithm.

Table 4.
The results of protection analysis.
4.2. Special Testing Using an Actual Power Grid Simulation Model
The power grid in a certain county area is a complex power transmission and distribution system composed of multiple substations and transmission lines, as shown in Figure 10. Its core is a 220 kV substation (Sub.1), which serves as a crucial power transmission hub. Sub.1 receives power from another 220 kV substation (Sub.0), establishing a robust power network. Sub.1 distributes power to three 110 kV substations (Sub.2, Sub.3, and Sub.4) and supplies power to surrounding users and substations via transmission lines. Additionally, Sub.2 and Sub.4 connect to a 35 kV substation (Sub.5), which further steps down power for distribution to local small-scale industrial and residential areas.
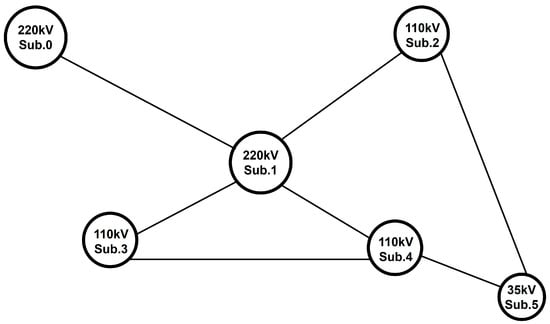
Figure 10.
County area power grid.
The proposed protection scheme is applied to this county power grid, with the equipment arrangement structure illustrated in Figure 11.

Figure 11.
Protection system structure. (a) Decentralized structure; (b) Centralized structure.
Figure 12 presents the PowerWorld simulation model used to validate the aforementioned algorithms.
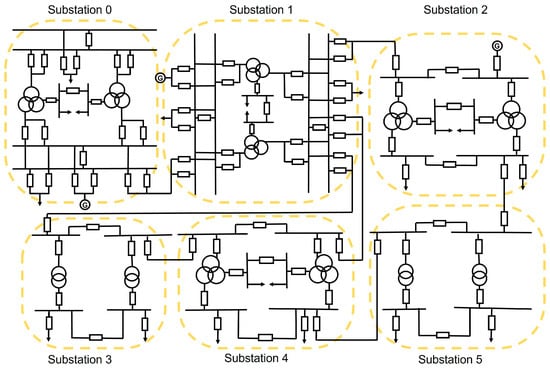
Figure 12.
Simulation system of Figure 10.
The allocation of core protection circuit breakers within the system is shown in Table 5.

Table 5.
Allocation table for core protection circuit breakers.
- (1)
- Bus fault testing
This paper examines system behavior under two scenarios: a bus fault and an uncleared external fault extending to the bus. Fault F1 was simulated on the medium-voltage bus of Sub.1, while fault F2 was set on the line between Sub.4 and Sub.5, simulating a scenario where the circuit breaker of Sub.5 failed to open correctly.
The performance of the scheme for fault F1 is shown in Figure 13. The graph shows that after the fault occurs, the current sum of the core protection circuit breaker B.1TM1 changes significantly. Based on the current equation, the system issued a trip command within 30 ms, successfully isolating the fault. This response indicates the protection system’s correct operation and effectiveness.
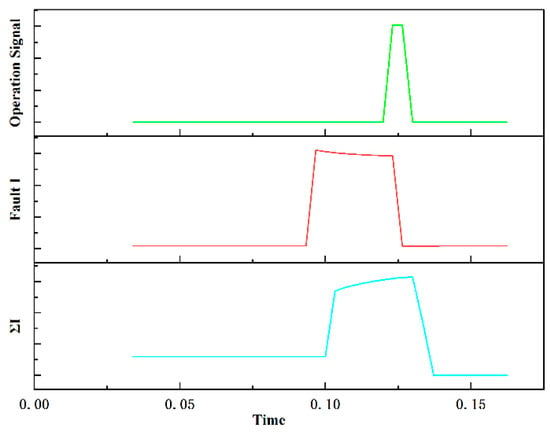
Figure 13.
Performance of protection scheme in case of F1 failure.
The performance of the scheme for fault F2 is shown in Figure 14. It shows a change in the current sum of the core protection circuit breaker B.4L5 following the fault occurrence. Based on the current equation analysis, the system issued a trip command within 0.2 ms. However, due to the failure of the circuit breaker in Sub.5, the backup protection mechanism was immediately activated. Ignoring the circuit breakers of the line in Sub.5, changes were observed in the current sum of both B.4L5 and B.5TH1 core protection circuit breakers. The current equation analysis yielded consistent results for both, leading to an immediate trip command issuance, which successfully isolated the fault within the minimum range.
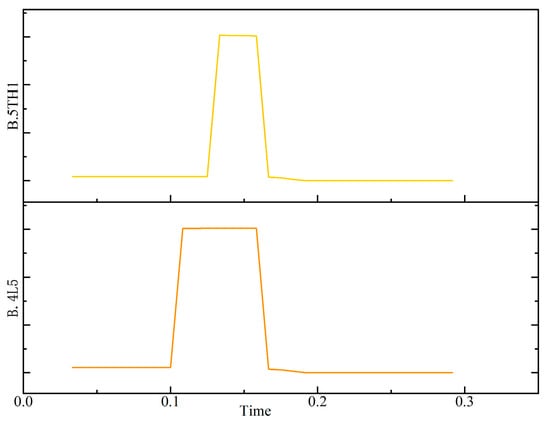
Figure 14.
Performance of protection scheme in case of F2 failure.
- (2)
- Line fault testing
Table 6 summarizes the identification and localization results for various fault types occurring on inter-substation lines. The results demonstrate that the proposed fault line identification algorithm accurately detects both the fault line and location for all fault types occurring within the system.

Table 6.
Identification and localization results of different types of line faults.
5. Conclusions
A smart transmission network protection system based on the distribution of phasor information at circuit breakers has been proposed. This system uses wide-area measurement data to identify fault locations.
Unlike conventional smart transmission network protection schemes, it directly integrates with existing smart grid information collection infrastructure. The fault identification algorithm achieves standardization by operating independently of the protected equipment type and status. To enhance system reliability, a supplementary backup protection scheme has been incorporated based on the algorithm’s characteristics.
The protection scheme’s compatibility and efficacy were validated using both the IEEE 39-bus model and an actual area power grid simulation model. Analysis demonstrates the scheme’s robustness across diverse fault locations and types. Moreover, it has good protection performance for different protected devices in the actual power grid. The protection system of this scheme is easy to implement.
Nevertheless, network latency and information transmission accuracy remain the main challenges faced by this scheme, potentially impacting the timeliness and precision of protection actions. Future research should prioritize the optimization of network communication protocols and data processing algorithms to reduce latency and enhance information transmission reliability, thereby improving system applicability and stability. In conclusion, this protection scheme demonstrates significant potential for practical application within smart grid environments.
Author Contributions
Conceptualization, Y.L. and D.D.; methodology, Y.L. and D.D.; software, Y.L.; validation, D.D.; formal analysis, Y.L.; data curation, D.D.; writing—original draft preparation, Y.L.; writing—review and editing, D.D.; supervision, S.-K.L.; project administration, S.-K.L. All authors have read and agreed to the published version of the manuscript.
Funding
This research received no external funding.
Data Availability Statement
The original contributions presented in the study are included in the article; further inquiries can be directed to the corresponding authors.
Conflicts of Interest
The authors declare no conflicts of interest.
References
- Gonen, T. Electrical Power Transmission System Engineering: Analysis and Design; CRC press: Boca Raton, FL, USA, 2009. [Google Scholar]
- Anderson, P.M.; Henville, C.F.; Rifaat, R.; Johnson, B.; Meliopoulos, S. Power System Protection; John Wiley & Sons: Hoboken, NJ, USA, 2022. [Google Scholar]
- Wang, Q.; Bo, Z.; Zhao, Y.; Ma, X.; Zhang, M.; Zheng, H.; Wang, L. Integrated wide area protection and control for power grid security. CSEE J. Power Energy Syst. 2019, 5, 206–214. [Google Scholar] [CrossRef]
- Sheng, S.; Li, K.; Chan, W.L.; Zeng, X.; Shi, D.; Duan, X. Adaptive agent-based wide-area current differential protection system. IEEE Trans. Ind. Appl. 2010, 46, 2111–2117. [Google Scholar] [CrossRef]
- Ashok, A.; Hahn, A.; Govindarasu, M. Cyber-physical security of wide-area monitoring, protection and control in a smart grid environment. J. Adv. Res. 2014, 5, 481–489. [Google Scholar] [CrossRef] [PubMed]
- Anand, S.; Kalita, K.; Parida, S. A novel transmission system protection scheme using optimal wide-area measurements. Electr. Power Syst. Res. 2023, 216, 108976. [Google Scholar] [CrossRef]
- Adamiak, M.; Apostolov, A.; Begovic, M.; Henville, C.; Martin, K.; Michel, G.; Phadke, A.; Thorp, J. Wide area protection—Technology and infrastructures. IEEE Trans. Power Deliv. 2006, 21, 601–609. [Google Scholar] [CrossRef]
- Yu, F.; Booth, C.; Dysko, A.; Hong, Q. Wide-area backup protection and protection performance analysis scheme using PMU data. Int. J. Electr. Power Energy Syst. 2019, 110, 630–641. [Google Scholar] [CrossRef]
- Judge, M.A.; Khan, A.; Manzoor, A.; Khattak, H.A. Overview of smart grid implementation: Frameworks, impact, performance and challenges. J. Energy Storage 2022, 49, 104056. [Google Scholar] [CrossRef]
- Corsi, S. Voltage Control and Protection in Electrical Power Systems: From System Components to Wide-Area Control; Springer: Berlin/Heidelberg, Germany, 2015. [Google Scholar]
- Boniface, N.; Sitati, S.S.; Byiringiro, J.B.; Wambua, P.M. An Intelligent Model and Simulation of High Voltage Transmission Line Protection Using Time Overcurrent Relay Optimization Settings. Res. Sq. 2024. [Google Scholar] [CrossRef]
- Yin, X.G.; Yang, W.; Zhang, Z. A limited wide-area relay protection partitioning and tripping strategy for smart grid. Chin. Soc. Electr. Eng. 2010, 30, 1–7. [Google Scholar]
- Su, S.; Li, K.K.; Chan, W.L.; Zeng, X.J.; Duan, X.Z. An expert system for wide-area current differential protection zone delineation. Power Syst. Technol. 2005, 29, 55–58+63. [Google Scholar]
- Castello, P.; Gallus, G.; Pegoraro, P.A.; Sulis, S. Measurement Platform for Latency Characterization of Wide Area Monitoring, Protection and Control Systems. IEEE Trans. Instrum. Meas. 2023, 73, 5500812. [Google Scholar] [CrossRef]
- Piskunov, S.A.; Mokeev, A.V.; Ulyanov, D.N.; Khromtsov, E.I. Wide Area Monitoring, Protection, Automation, and Control Systems for Medium Voltage Networks. In E3S Web of Conferences; EDP Science: Alushta, Russia, 2023; Volume 384, p. 01018. [Google Scholar]
- He, J.H.; Li, B.; Liu, L.; Zhang, H. Station area protection based on distributed functions. Power Syst. Prot. Control 2014, 42, 26–32. [Google Scholar]
- Rahman, W.U.; Ali, M.; Mehmood, C.A.; Khan, A. Design and implementation for wide area power system monitoring and protection using phasor measuring units. WSEAS Trans. Power Syst. 2013, 8, 57–64. [Google Scholar]
- Zhang, S.P. Research on Wide Area Backup Protection Based on Estimation and Node Fault Injection Current under Finite PMU. M.S.; Southwest Jiaotong University: Xi’an, China, 2020. [Google Scholar]
- Jena, M.K.; Samantaray, S.; Panigrahi, B.K. A new wide-area backup protection scheme for series-compensated transmission system. IEEE Syst. J. 2015, 11, 1877–1887. [Google Scholar] [CrossRef]
- Lin, X.; Ma, S.; Jin, N.; Tong, N.; Chen, L.; Li, Z.; Rong, Z.; Zhang, P. Compensation voltage moduli comparison-based wide-area protection algorithm independent of data synchronism and integrity. IET Gener. Transm. Distrib. 2020, 14, 6682–6689. [Google Scholar] [CrossRef]
- Buhagiar, T.; Cayuela, J.-P.; Procopiou, A.; Richards, S. Poste Intelligent-the Next Generation Smart Substation for the French Power Grid. In Proceedings of the 13th International Conference on Development in Power System Protection 2016 (DPSP), Edinburgh, UK, 7–10 March 2016. [Google Scholar]
- Ren, G.; Li, S.Q.; Ji, N.; Pang, X. Research on key technologies of hierarchical wide-area protection system for smart grid. Electr. Meas. Instrum. 2020, 57, 93–98. [Google Scholar]
- Xiong, H.Q.; Zhang, Z.K.; Tang, S.W.; Li, C.B. Research Framework and Discussion on Smart Transmission Grid Technology. Hunan Electr. Power 2012, 32, 1–4+19. [Google Scholar]
- Vahidi, S.; Ghafouri, M.; Au, M.; Kassouf, M.; Mohammadi, A.; Debbabi, M. Security of wide-area monitoring, protection, and control (WAMPAC) systems of the smart grid: A survey on challenges and opportunities. IEEE Commun. Surv. Tutor. 2023, 25, 1294–1335. [Google Scholar] [CrossRef]
- Jiang, C.; Ji, L.J. Discussion on the Application of Substation IED Data in Relay Protection. Sichuan Electr. Power Technol. 2018, 41, 76–81. [Google Scholar]
- Muqeet, H.A.; Liaqat, R.; Jamil, M.; Khan, A.A. A state-of-the-art review of smart energy systems and their management in a smart grid environment. Energies 2023, 16, 472. [Google Scholar] [CrossRef]
- Petite, F.S.V.; dos Santos, R.C.; Junior, G.M.; Yang, Q.; Li, J. A comprehensive backup protection for transmission lines based on an intelligent wide-area monitoring system. Int. Trans. Electr. Energy Syst. 2021, 31, e12870. [Google Scholar] [CrossRef]
- Refaat, S.S.; Ellabban, O.; Bayhan, S.; Abu-Rub, H.; Blaabjerg, F.; Begovic, M.M. Smart Grid and Enabling Technologies; John Wiley & Sons: Hoboken, NJ, USA, 2021. [Google Scholar]
- Pai, M.A. Power System Stability in Single Machine System. In Energy Function Analysis for Power System Stability; Kluwer Academic Publishers: Berlin/Heidelberg, Germany, 1989. [Google Scholar]
Disclaimer/Publisher’s Note: The statements, opinions and data contained in all publications are solely those of the individual author(s) and contributor(s) and not of MDPI and/or the editor(s). MDPI and/or the editor(s) disclaim responsibility for any injury to people or property resulting from any ideas, methods, instructions or products referred to in the content. |
© 2024 by the authors. Licensee MDPI, Basel, Switzerland. This article is an open access article distributed under the terms and conditions of the Creative Commons Attribution (CC BY) license (https://creativecommons.org/licenses/by/4.0/).