Abstract
The paper proposes applying an in-house mathematical model of a liquid flat-plate solar collector to calculate the collector time constant. The described model, proposed for the first time in an earlier study, is a one-dimensional distributed parameter model enabling simulations of the collector operation under arbitrarily variable boundary conditions. The model is based on the solution of energy balance equations for all collector components. The formulated differential equations are solved iteratively using an implicit difference scheme. To obtain a stable numerical solution, it is necessary to use appropriate steps of time and spatial division. These were found by comparing the results obtained from the model with the results of the analytical solution available in the literature for the transient state, which constitutes the novelty of the present study. The accuracy of the results obtained from the model was verified experimentally by comparing the measured and calculated history of the fluid temperature at the outlet of the collector. The calculation of the collector time constant is proposed in the paper as an example of the model’s practical application. The results of the time constant calculation were compared with the values obtained experimentally on the test stand. This is another novelty of the presented research. The analysed collector instantaneous efficiency was then calculated for selected outdoor conditions. The presented mathematical model can also be used to verify the correctness of the collector operation. By comparing, on an ongoing basis, the measured and calculated values of the fluid temperature at the collector outlet, conclusions can be drawn about the process of solar glass fouling or glycol gelling. The simplicity of the model and the low computational demands enable such comparisons in an online mode.
1. Introduction
As economic development continues, the role of renewable energy sources (RES) is growing. This is largely due to the increasing environmental pollution caused by the excessive use of fossil fuels [1]. The rising cost of energy produced from fossil fuels, ongoing technological advances, and increasingly stricter regional environmental regulations are also contributing to the growing importance of renewable energy [2]. As indicated by recent studies, the transition to renewable energy is currently a major challenge. However, it cannot be met effectively without understanding the underlying factors [3]. Based on a study of renewable energy consumption in the Eurozone in the years 2000–2019, the authors of [3] showed a significant relationship between renewable energy consumption and the amount of electricity generation and energy production by other sources. They also concluded that energy transition issues should be research priorities for academia. The relevance of the energy transition is also confirmed by [4], which contains research results concerning the relationship between the transition and the factors related to RES, construction, and other sectors. The energy transition is supported by solar technologies, and the paper mentions solar collectors as one of them. The research presented therein mainly concerns the territory of France. It was pointed out that technical and socioeconomic factors were crucial for successful RES implementation.
Flat-plate solar collectors (FPSCs), being an important technology for harnessing solar energy, are clearly part of the energy transition issues analysed above. Due to their simple and reliable design, FSPCs find numerous applications in low- and medium-temperature systems. An interesting example of such an application is presented in [5], where a techno-economic analysis of a prosumer installation was performed. The installation includes FPSCs, a heat pump, and a photovoltaic system. A methodology for selecting specific solutions based on operational data and mathematical models was proposed.
Many works have been undertaken in recent years to improve the efficiency and performance of FPSCs. Among other problems, they focused on reducing heat losses, improving the heat exchange between the absorber and the solar fluid, and developing new solutions for absorbers and solar cover coatings [6]. Other efforts to increase the efficiency of FPSCs consisted of the analysis of the use of nanofluids, polymers, mini-channels, phase-changing materials (PCMs), and enhancement devices such as various types of inserts and reflectors [7]. A new concept of FPSC was proposed by Zheng et al. [8]. It involved the use of silica aerogel in the cover and transparent insulation materials. These solutions were successfully tested numerically and experimentally under steady-state conditions. Current design solutions for FPSCs are reviewed in [9], taking into account the minimisation of heat losses from the collector front surface. Based on this review, it was concluded that there was great potential for improving the FPSC thermal performance. This can contribute to increasing competitiveness and expanding the range of applications for collectors. Interesting FPSC solutions were presented and analysed in [10,11,12]. The main novelty of [10] is the proposal for a stainless steel solar collector with microchannels. Based on numerical analysis and experimental studies, it was found that the collector’s thermal performance could be improved by increasing the width of the microchannel and the height of the corrugations. The advantage of using stainless steel is that a homogeneous temperature distribution can be maintained, which maximises heat absorption. In addition, the use of stainless steel extends the FPSC life. Mohseni-Gharyehsafa et al. [11] carried out a sensitivity analysis and multi-objective optimisation for an FPSC fitted with twisted tapes. The aim of the optimisation was to find the collector most efficient design. Moreover, based on the Nusselt number, a generalised model of collector efficiency was developed. The model makes it possible to integrate different fluid flows. The authors of [12] present the first results of research on the use of FPSCs as cooling devices, exchanging heat at night by radiation, mainly with the sky. For this purpose, non-shielded solar collectors integrated with the building hydronic system were used (the same FPSCs are used during the day to produce domestic hot water, for example). An STC model based on the quasi-dynamic method according to the ISO 9806:2017 standard [13] was used to predict the annual energy gain. This research and the analyses were carried out to establish the potential of the use of FPSCs to reduce the energy demand in the building sector in dry and hot areas.
Efforts have also been made in recent years to study the effects of the application of nanofluids in devices intended for converting solar energy into other types of energy. Such devices include FPSCs, in which the use of nanofluids is an important field of research, numerical simulations, and experiments. In [14], the authors propose a hybrid nanofluid obtained by dispersing ZrO2-SiC particles in distilled water (DW). The nanofluid was used in the FPSC to determine the collector efficiency. It was experimentally confirmed that the presence of this nanofluid resulted in an increase in energy and exergy efficiency compared to a system based on distilled water alone. The results of similar analyses and experimental studies are presented in [15], in which SiC/DW was used as a nanofluid. The studies were conducted for different values of the fluid mass flow rate and different concentrations of nanoparticles. The conclusions from these studies are analogous to those presented in [14]. In both cases, the thermophysical properties of the nanofluids were evaluated first. Struchalin et al. [16] used the concept of the direct-absorption solar collector (DASC), developed in the 1970s. Despite many promising results of research based on DASC nanofluids, interest in this solution was lost due to environmental constraints and costly nanofluids. The authors of [16] compared the results of research on a full-scale DASC with those obtained for the FPSC, finding higher average daily efficiency values for the former. An interesting thing is that the nanofluid was produced using instant coffee. Moreover, the DASC efficiency was compared with the efficiency of a commercial FPSC model. The results of research on the thermal output of FPSCs using advanced ionanofluids and nanofluids are presented in [17]. The testing was carried out both in real conditions and using the FPSC theoretical model available in the literature. Hamdan et al. [18] performed laboratory testing of the effect of a water-based Al2O3 nanofluid on thermal energy storage in a tank. The thermal fluid flowing in the tank coil, at different mass flow rates, was preheated in a flat-plate solar collector. The testing results were used to determine the fluid optimal mass flow rate, corresponding to the nanofluid maximum temperature in the tank, and the nanofluid optimal concentration.
In parallel with the research on new materials and nanofluids for the FPSC, new mathematical models are being developed to simulate the operation of the collectors. This is due to their great potential for industrial applications and small-scale heating systems [11]. Solar collectors always operate in unsteady conditions. As indicated by Duffie and Beckman [19], in most of the literature on the analysis of the FPSC performance, this unsteadiness is not taken into account. One of the first mathematical models of the FPSC was the model proposed by Cadafalch [20]. It was an extension of the model presented in [21], in which steady-state conditions were taken into account. The extension consisted of a more detailed approach to the calculation of the heat exchange of the collector cover and back. At the same time, it was emphasised that the heat exchange in the FPSC was essentially one-dimensional (1D). However, three-dimensional (3D) models can also be found in the literature. Cerón et al. [22] developed a 3D model to predict the collector output curve. This model was based on the Reynolds-averaged Navier-Stokes (RANS) turbulence model, and a steady-state problem was considered. Many 3D models were created using computational fluid dynamics (CFD), and they also concern steady states, for example, those presented in [23,24,25]. An interesting FPSC concept is presented in [23]. To increase the collector efficiency (by reducing heat losses), the integration of a polymethyl methacrylate (PMMA) sheet into a flat-plate collector was proposed. This solution is dedicated to FPSCs used in cold regions. Maji et al. [24] simulated the operation of four FPSCs with similar dimensions. The aim of the simulations was to identify the impact of the channel geometry on the collector performance. The results of similar analyses are presented in [25]. The analyses concerned, among other things, the problem of increasing the heat transfer to the working fluid in the FPSC by using a cross-section different from the traditional circular shape. As highlighted in [26], predicting the FPSC thermal performance is an important issue from the perspective of engineering applications. This prediction is complex and difficult, which is due to the thermal and operating parameters affecting the performance of the collectors. The authors of [26] analysed the potential of various machine learning models to predict the performance of FPSCs with nanofluids as the working fluid. Studies have also been conducted for many years on predicting the FPSC performance using artificial neural networks (ANNs). Kalogirou [27] presented six such prediction models, e.g., to predict the standard performance collector equation coefficients, the collector time constant, the incidence angle modifier coefficients, and the collector stagnation temperature. The use of ANNs is still relevant, as evidenced, for example, by [28], in which the effect of an internally grooved absorber tube on the FPSC performance was analysed. The created ANN models were used to predict the collector performance and the outlet temperature. Just a few works on numerical modelling of the FPSC transient operation are also available in the literature at present. One of them is [29], where a model of a typical FPSC is presented. The model, based on the solution of two-dimensional differential equations formulated for the absorber, was used to calculate the collector heat loss coefficient and efficiency. Constant values were assumed for all thermophysical properties. Freegah et al. [30] performed a numerical and experimental analysis of the thermal responses of a traditional FPSC and its new model. The new model had elliptical tubes and wavy fins. Due to that, the surface area exposed to solar radiation was increased. The numerical models were created using the ANSYS Fluent R 19.3 software.
The analysis of the presented literature points to the relevance of issues related to experimental studies and modelling of the FPSC operation. The efforts of researchers concentrate mainly on improving the efficiency and performance of the collectors. Various nanofluids or new design solutions are proposed for this purpose. The effectiveness of these solutions is usually verified by measurements on real facilities. The point is that attempts at numerical modelling are mainly limited to steady-state analyses, whereas solar collectors always operate under transient conditions. A large number of studies are currently emerging to deal with the use of nanofluids. The impact of their application can be analysed numerically using the one-dimensional distributed parameter mathematical model of the FPSC suggested in the present paper. The basis for obtaining reliable results in this case is the correct determination of the dependence of the thermophysical properties of nanofluids on temperature.
The main objective of the research is to apply the mathematical model of the FPSC, proposed in an earlier paper by one of the authors, to determine the collector time constant under outdoor conditions. The numerical determination of the time constant constitutes the main novelty of the paper. The following sections of the paper include the presentation of the FPSC mathematical model, its computational validation, and experimental verification. The verified model was used to determine the time constant of the selected collector under outdoor conditions. The constant was also determined experimentally. In addition, the instantaneous efficiency of the collector was determined, also under outdoor conditions.
2. A Brief Description of the Model Development
The proposed model of the FPSC operation is a one-dimensional distributed parameter model. It makes it possible to analyse the collector operation under transient conditions at any variable (time-dependent) boundary condition. Five nodes located in a direction perpendicular to the fluid flow direction were considered in the model. The nodes are contained in the control volume shown in Figure 1. They include the solar glass (tg), the air layer between the glass and the absorber (tair), the absorber (ta), the working fluid (tf), and the insulation (ti). It is thus a 5 × N model, where N is the number of nodes (control volumes) in the fluid flow direction. The calculations are carried out along the path of the fluid flow in a single collector tube with dimensions as in the real facility.
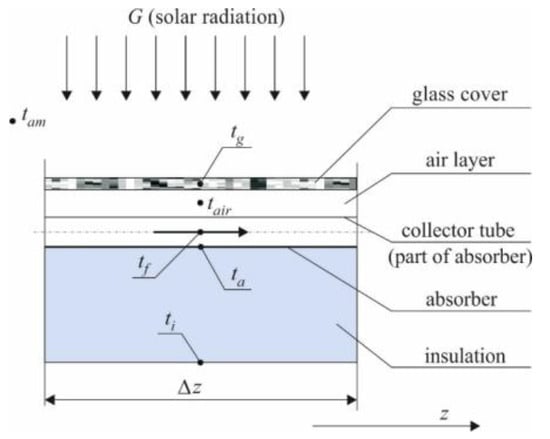
Figure 1.
FPSC control volume.
The mathematical model of the FPSC used herein is described in detail in [31]. For this reason, only its basic assumptions and energy balance equations are given below.
The developed model’s basic assumptions are as follows:
- -
- Uniform fluid flow through all collector tubes.
- -
- The thermophysical properties of the working fluid, the absorber material, and the air between the solar glass and the absorber are determined on an ongoing basis.
- -
- The thermophysical properties of the solar glass and insulation are constant and temperature-independent,
- -
- Heat transfer coefficients are calculated in an online mode based on the relations available in the literature,
- -
- The collector loses heat to the environment through the solar glass and insulation (convection and radiation),
- -
- The collector heat losses through the edges are not taken into account,
- -
- All the collector elements contained in the control volume have the same dimensions as in the real facility.
The above assumptions, taken into account in the mathematical model, do not introduce any simplifications into the model and make it possible to preserve the physics of the phenomena occurring in the collector.
The following energy balance equations were formulated for the above-mentioned five components of the collector (Figure 1):
- -
- for the glass cover:
Cg—thermal capacity of the glass cover, J/K
tg—temperature of the glass cover, °C
τ—time, s
Φg,am—heat flux lost through the glass cover to the environment, W
Φg,a—heat flux exchanged between the glass cover and the absorber due to radiation, W
Φg,air—heat flux exchanged between the glass cover and the air layer due to convection, W
Φg,G—heat flux absorbed by the glass cover due to solar radiation, W
- -
- for the air layer between the glass cover and the absorber:
Cair—thermal capacity of the air layer, J/K
tair—temperature of the air between glass cover and absorber, °C
Φair,g = −Φg,air, W
Φair,a—heat flux exchanged between the air layer and absorber due to convection, W
- -
- for the absorber:
Ca—thermal capacity of the absorber, J/K
ta—temperature of the absorber, °C
Φa,g = −Φg,a, W
Φa,air = −Φair,a, W
Φa,i—heat flux exchanged between the absorber and the insulation due to thermal conductivity, W
Φa,f—heat flux exchanged between the absorber and the fluid due to convection, W
Φa,G—heat flux absorbed by the absorber due to solar radiation, W
- -
- for the working fluid:
Cf—thermal capacity of the working fluid, J/K
tf—temperature of the working fluid, °C
Φf,in—heat flux flowing into the control volume with the fluid, W
Φf,o—heat flux flowing out of the control volume with the fluid, W
Φf,a = −Φa,f, W
- -
- for the insulation:
where:
Ci—thermal capacity of the insulation, J/K
ti—temperature of the insulation, °C
Φi,a = −Φa,i, W
Φi,am—heat flux lost through the insulation to the environment, W
The relationships presented above concern FPSCs with a single solar glass cover operating in a parallel-channel configuration. The method is also suitable for collectors operating in a serpentine flow system and for collectors with a double solar glass cover. For collectors operating in a serpentine flow system, the presented method does not require modification. However, the use of a second solar glass cover requires the derivation of additional energy balance equations for the second cover and for the air layer between the covers.
The formulated differential Equations (1)–(5) were solved iteratively using an implicit difference scheme (time derivatives were replaced by forward difference quotients). In this way, formulae were obtained that make it possible to calculate the time- and space-dependent temperature values at five nodes of each control volume. In this way, 5 × N differential equations are solved in every instant.
The energy balance equation for the fluid (Formula (4)) takes account of the change in total energy in the control volume, over time, the energy flux flowing into and out of the control volume and the heat flux flowing into it through its surface. Considering the slight effect of the other terms of the energy conservation equation (i.e., the heat flux flowing into the control volume due to conduction and the change in the work completed by surface forces and friction forces over time), they are omitted. Also omitted are the momentum and mass balance equations. This resulted in fewer final equations and their more straightforward form, translating into a fast numerical calculation process. The omission of the above-mentioned balance equations is not a limitation of the proposed method, nor does it cause errors in numerical calculations, as demonstrated by the computational and experimental verification carried out in the next two sections below.
The main difference between the model described in [31] and the one used in the present paper lies in the higher computational accuracy now obtained. In [31], Equation (15) describes the tolerance of iteration, and it was applied there for the working fluid only. In the present study, this equation is used for all collector elements for which energy balance equations were formulated. In addition, the accuracy of iterative computations was increased (by assuming the tolerance of iteration ϑ = 10−8).
Recent FPSC models have mainly been created using the ANSYS Fluent software. Some of them enable consideration of transients. The main difference between them and the model proposed in this section is that the latter is entirely in-house. It was used to create an in-house computer program. The few previous transient FPSC models did not include all collector components, or the heat transfer coefficients and thermophysical properties were not temperature dependent. The verification of the results obtained from these models mainly concerns steady-state conditions. The method of solving differential equations by means of an implicit differential scheme is characteristic of the model described in this paper.
The developed model enables simulations of the FPSC operation at any variable boundary conditions (time-dependent intensity of solar radiation, solar fluid temperature, and mass flow rate at the collector inlet). The main outcome of the simulation is the history of the fluid temperature at the collector outlet. The other details of the developed solution, the derived final formulas and the formulas used to describe the heat transfer coefficients are given in [31].
3. Computational Validation
To obtain a stable solution to the derived differential equations, it was first necessary to estimate the values of the steps of time and spatial division, i.e., the time step for the numerical calculations Δτ and the spatial size of the control volume Δz. They should satisfy the Courant-Friedrichs-Lewy condition for one-dimensional problems [32]:
where:
wf—working fluid flow velocity in the solar collector tubes, m/s
By satisfying condition (6), it is possible to avoid the effects of dissipation and dispersion that cause errors in numerical calculations.
The values of steps Δτ and Δz were estimated using an analytical solution available in the literature for the transient state [33,34]. The solution involves forcing a jump rise in heating on the outer surface of the tube (the case close to the real conditions of the operation of solar collectors). The analytical solution in this case makes it possible to calculate the dimensionless increment in the fluid temperature caused by the forcing. Appropriate relations were derived in [34] to compare the results obtained from the proposed mathematical model of the collector with the results of the analytical solution. The relations cover only the energy balance for one tube of the collector and for the fluid flowing inside the tube. These relationships are used in this section in the analysis of the effect of the time and spatial step values on the accuracy of the obtained results. The model validation by comparing the results with the results of the available analytical solutions for the transient state has not been carried out yet.
An aqueous solution of propylene glycol is used as the working fluid. Owing to the fact that in analytical solutions it is impossible to take account of time-dependent changes in thermophysical properties, the following constant properties of the aqueous glycol solution (for a temperature of 40 °C) were adopted for the calculations: density ρf = 1020 kg/m3, specific heat cf = 3750 J/(kg·K), thermal conductivity kf = 0.447 W/(m·K), and dynamic viscosity μf = 0.0013 kg/(s·m). It is also assumed that the 1.9 m-long collector tube with the outer diameter do = 0.01 m and the wall thickness gw = 0.0005 m is made of copper with the following properties: ρw = 8960 kg/m3 and cw = 390 J/(kg·K). The heat transfer coefficient on the wall inner surface is adopted as h = 185 W/(m2K). For validation purposes, the initial temperature of the flowing fluid and of the tube was assumed to be tf = θ = 10 °C. From the next time step on, an input step function appears on the tube’s outer surface in the form of heating with a heat flux G = 500 W/m2. The tube pitch is p = 0.12 m.
The dimensionless variables η and ζ, time and length, respectively, appearing in Figure 2, are expressed by the following equations [34]:
where:
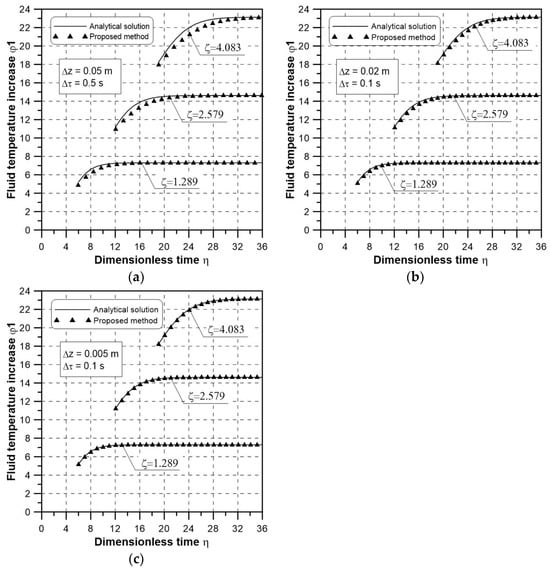
Figure 2.
Comparison of dimensionless histories of the fluid temperature increments. (a) for Δz = 0.05 m and Δτ = 0.5 s; (b) for Δz = 0.02 m and Δτ = 0.1 s; (c) for Δz = 0.005 m and Δτ = 0.1 s.
In the above formulae:
D—time constant characterising the tube thermal inertia,
F—coefficient describing the relation between the fluid heat capacity and the thermal power of the surface of the 1 m-long channel,
τ—time, s
z—spatial coordinate, m
The methodology for the calculation of the fluid temperature increase (φ1) can be found in [33,34].
Three sets of steps in time and spatial division were analysed. The results were compared with the analytical solution results (Figure 2). The presented dimensionless coordinates ζ = 1.289, 2.579, and 4.083 correspond to the dimensional coordinates z = 0.6 m, 1.2 m, and 1.9 m, respectively.
The analysis of Figure 2 indicates that to avoid dissipation and dispersion effects, numerical calculations should be carried out adopting the proposed time and space division shown in Figure 2b or Figure 2c (satisfactory agreement was obtained between the results of the numerical calculations and the analytical solution). It seems that the reasonable choice is to carry out calculations using the time and spatial steps shown in Figure 2b, by means of which sufficient computing accuracy is obtained. If the values of the steps are taken as shown in Figure 2c, the improvement in the accuracy of the calculations is not significant, but the computing time is longer. The time shifts of the curves in individual cross-sections, visible in Figure 2, are due to the fact that the analytical relations enable the determination of time- and space-dependent increments in the fluid temperature in any cross-section z, starting from the time when this cross-section is reached by a particle of the fluid flowing with velocity wf. For example, if the velocity is 1 m/s, analytical solutions make it possible to determine temperature changes in a cross-section that is, for example, 5 m away from the beginning of the tube only after 5 s.
4. Experimental Verification
This section presents experimental verification of the developed mathematical model of the FPSC. The verification, carried out on a purpose-built test stand, consisted of comparing the measured history of the fluid temperature at the collector outlet to the numerical calculation results. The stand is described in detail in [31].
Based on the computational validation presented in Section 3, the following time and space divisions were adopted for the calculations: Δτ = 0.1 s and Δz = 0.02 m (Figure 2b). For the absorber tube with length L = 1.9 m, N = 96 analysed cross-sections (control volumes) were obtained. This means that at every instant, 480 differential equations were solved (M × N = 5 × 96-node model). The temperature histories of the solar glass cover, the air layer between the glass cover and the absorber, the absorber, and the insulation were determined in each of the 96 cross-sections. The working fluid temperature history, on the other hand, was determined in cross-sections 2 through 96. For cross-section 1, the temperature history was known from the measurement. All heat transfer coefficients were calculated online, based on the relations given in [35]. The thermophysical properties of the air layer, the absorber, and the fluid were also calculated online. In the case of the solar glass cover and the insulation, the properties were adopted as constant. For the glass cover, the following values were assumed: cg = 720 J/(kgK) and ρg = 2500 kg/m3, whereas for the insulation layer, ci = 1030 J/(kgK), ρi = 70 kg/m3, and ki = 0.035 W/(mK). An aqueous solution of 50% by weight of propylene glycol C3H8O2 was used as the working fluid. The computational program was created using the Fortran code [36].
The analysed collector is shown in Figure 3, whereas selected results of the measurements, calculations, and comparisons are presented in Figure 4, Figure 5, Figure 6, Figure 7, Figure 8 and Figure 9. The figures refer to the measurements performed using the test stand of the Department of Energy of the Cracow University of Technology on a bright November day (2 November 2023). The tested device was a liquid flat-plate collector with an absorber built of vertical copper tubes parallel to each other.
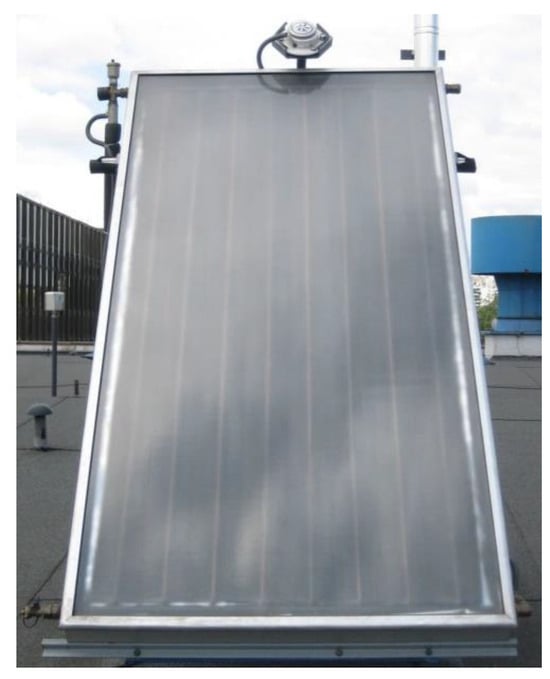
Figure 3.
View of the collector with a pyranometer on the test stand.
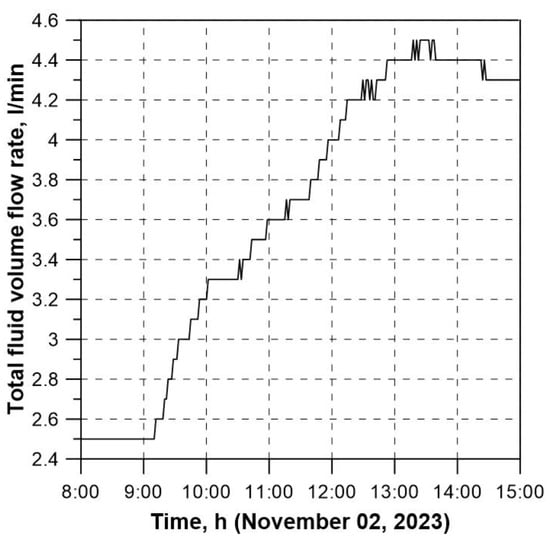
Figure 4.
Measured history of the fluid volume flow rate at the collector inlet.
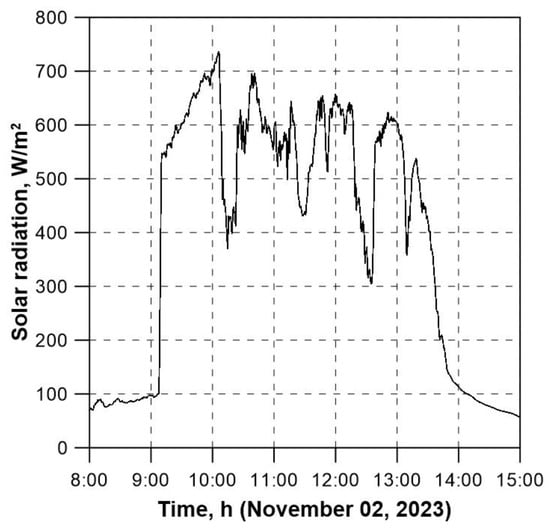
Figure 5.
Measured history of total solar radiation intensity.
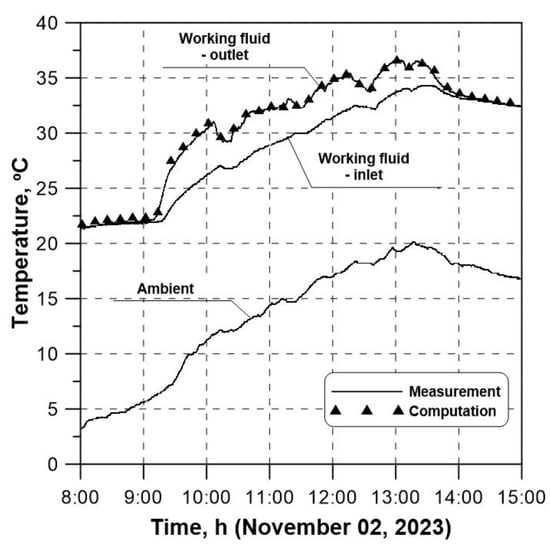
Figure 6.
Comparison between the measured and calculated histories of the fluid temperature at the collector outlet and the measured histories of the fluid temperature at the collector inlet and of ambient temperature.
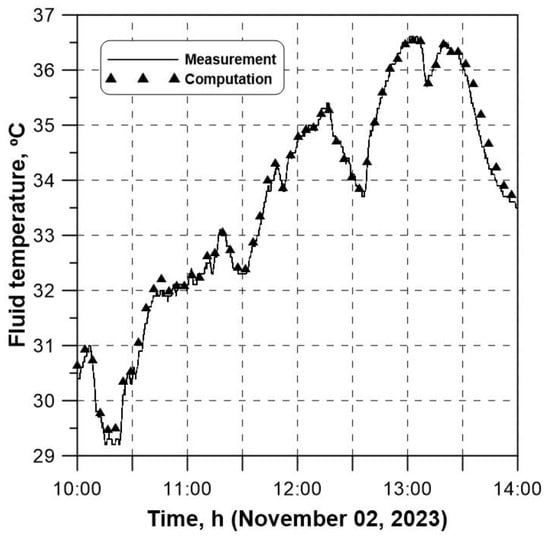
Figure 7.
Fragment of Figure 6 for better visualisation of the time interval with the biggest changes in the measured values of the fluid temperature at the collector outlet.
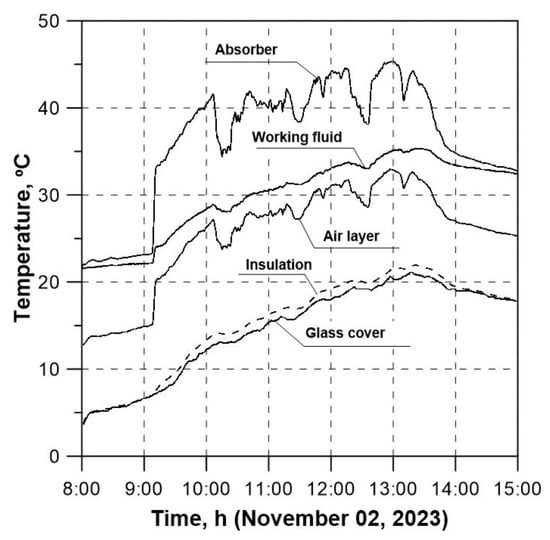
Figure 8.
Calculated temperature histories of the collector individual nodes in cross-section 48 (L = 0.94 m).
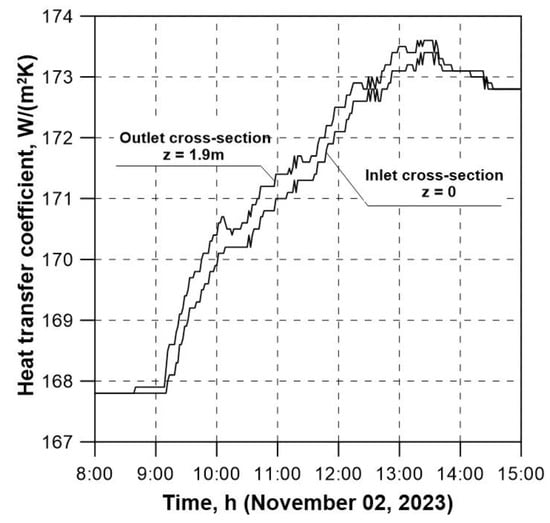
Figure 9.
Calculated histories of the heat transfer coefficient on the collector tube inner surface.
The following measured histories were the input data for the numerical calculations:
The solar radiation intensity (Figure 5) was measured using a pyranometer located in the plane of the collector aperture (Figure 3). Due to the location of the pyranometer, it was not necessary to recalculate the solar radiation intensity values, measured, for example, on the horizontal plane (such measurements are carried out by meteorological stations). The collector was inclined at an angle of 45° to the horizon and facing south.
The comparison between the measured and calculated history of the fluid temperature at the collector outlet is presented in Figure 6. It follows from the figure that there is fully satisfactory agreement between the two curves, which indicates the effectiveness of the proposed mathematical model. To demonstrate the accuracy of reproducing the measured history of the fluid temperature in more detail, Figure 7 shows a fragment of Figure 6 covering the time with the biggest temperature changes. An analysis of Figure 7 also confirms the developed model’s effectiveness.
Figure 8 shows the calculated temperature histories for the collector individual elements (individual nodes of the collector in the direction transverse to the fluid flow) for the selected cross-section No. 48 (L = 0.94 m). Similar curves can be plotted for each of the 96 cross-sections under analysis. Example curves illustrating the changes in the heat transfer coefficient on the collector tube inner surface are shown in Figure 9. These histories are calculated for the inlet and outlet cross-sections. The coefficient values were calculated using the Heaton empirical formula, which applies to laminar flows in short channels [21]. The velocity of the fluid flowing through the collector tubes is small, from about a few mm/s to about a dozen cm/s. Given the small diameter of these tubes, the achieved Reynolds number values, ranging from about a dozen to several hundred, are much lower than the critical value Rekr = 2300. The flow is therefore laminar in nature.
To further confirm the correctness of the results obtained from the developed mathematical model, the values of the relative error (RE) and the root-mean-square error (RMSE) are presented in Figure 10. The values were calculated for the measured and computed history of the fluid temperature at the collector outlet using the following formulae:
where:
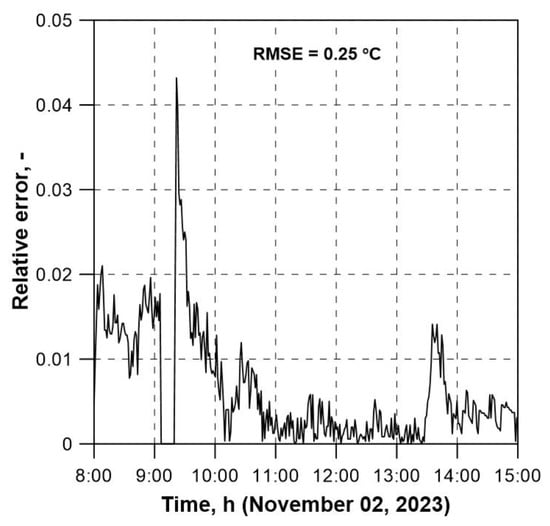
Figure 10.
History of the RE values and the RMSE for the fluid temperature at the collector outlet.
N—number of measurements (N = 2520 measurements, performed every 10 s),
tm—measured temperature,
tc—computed temperature.
The low values of the RE and the RMSE in Figure 10 demonstrate the high efficiency of the mathematical model under verification. They confirm the model’s suitability for simulating the FPSC operation under transient conditions.
The correctness of the proposed approach to the simulation of the transient operation of solar collectors is also confirmed by the mathematical model developed for the parabolic trough collector according to the principles given in Section 2. The model is presented in [37,38], which also contain the results of the model’s computational and experimental verification. The versatility of the presented approach is evidenced by the findings presented in [39], where a similar mathematical model was developed to study the effect of the use of phase-change materials on the performance of a passive solar still. The model was validated using experimental results.
5. Determination of the Collector Time Constant under Outdoor Conditions
Solar collectors always operate under transient conditions. However, their thermal tests are very often performed using a stand equipped with a solar radiation simulator, and the testing is then realised under steady-state conditions. At the request of manufacturers, specialised institutes and laboratories also carry out thermal tests on a stand placed outdoors using natural solar radiation. In both cases, the testing scope includes the determination of thermal efficiency, heat capacity, the time constant, and the incidence angle modifier. These quantities should be determined based on the guidelines specified in a relevant ISO standard [13].
Considering that a fully satisfactory convergence of the measured and computed histories of the fluid temperature at the collector outlet was obtained (see Section 4), it is possible to use the developed mathematical model to determine the collector time constant numerically. The time constant is used to analyse the solar collector performance and makes it possible to estimate how quickly the collector responds to changing sunlight conditions. It is important, for example, when the collector resumes operation after an overnight shutdown. A high time constant is characteristic of heat pipe collectors. Time constants for efficient FPSCs take values of about 60 s, while for vacuum heat-pipe collectors, they may be up to several minutes. The time constant of a solar collector is relevant for temperate climates.
The result of the time constant numerical computation was compared with the value obtained experimentally on the test stand. To confirm the correctness of the obtained values, the time-constant numerical and experimental determinations were carried out twice.
The procedure for determining the collector time constant is described in a relevant standard [13], according to which the test should be carried out under outdoor conditions or using a simulator of solar radiation. In either case, the intensity of solar radiation on the plane of the collector aperture should be higher than 700 W/m2. At first, the aperture should be shielded from solar radiation using a reflective solar shield. The fluid temperature at the collector inlet should be set to a value almost equal to the ambient air temperature. When the steady state is reached, the shield should be removed, and the measurements should be continued until a new steady state is reached.
The following quantities should be measured:
- -
- the fluid temperature at the collector inlet (tin),
- -
- the fluid temperature at the collector outlet (te),
- -
- the ambient air temperature (tam).
The differences between the fluid temperature at the collector outlet and the temperature of ambient air (te − tam) should be plotted as a function of time, starting from the first steady state (te − tam)0 and continuing until the second steady state is reached at a higher temperature (te − tam)1. The differences are shown in Figure 11.
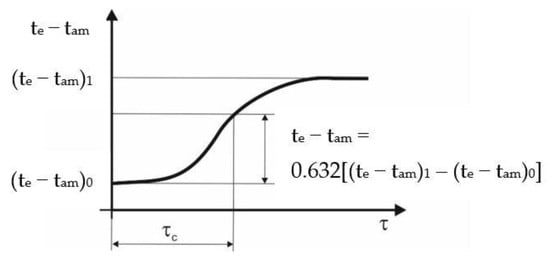
Figure 11.
Determination of the collector time constant τc.
The collector time constant is defined as the time lasting from the moment the shield is taken off to the moment the temperature at the collector outlet rises by 63.2% of the total increment, from (te − tam)0 to (te − tam)1:
The time constant in this case is the time interval calculated from the moment of a change in a parameter, after which the effect of the collector heat capacity on the collector balance can be omitted. In this paper, the parameter is the intensity of solar radiation. The time constant can also be defined as the time after which the collector reaches thermal equilibrium and begins to provide heat for collection in a stable manner, determined by momentary thermal conditions such as the solar radiation intensity, ambient temperature, or wind speed.
Two attempts were made at the time to make a constant experimental determination for the solar collector under analysis. The testing was performed during the summer season in Cracow (Poland). In both cases, the requirements set out in the relevant standard [13] were satisfied. The results of the first test are presented in Figure 12 and Figure 13. At first, the collector was shielded to reflect solar radiation. After the fluid temperature at the collector inlet became almost equal to the temperature of ambient air (the first steady state), the solar reflective shield was removed. The jump in the solar radiation intensity due to the shield removal took place in the 140th second (Figure 12). As indicated by Figure 13, the second steady state was reached at a time of about 310 s. The difference between the temperatures of the fluid at the collector outlet and of ambient air at that time totalled about 6 °C.
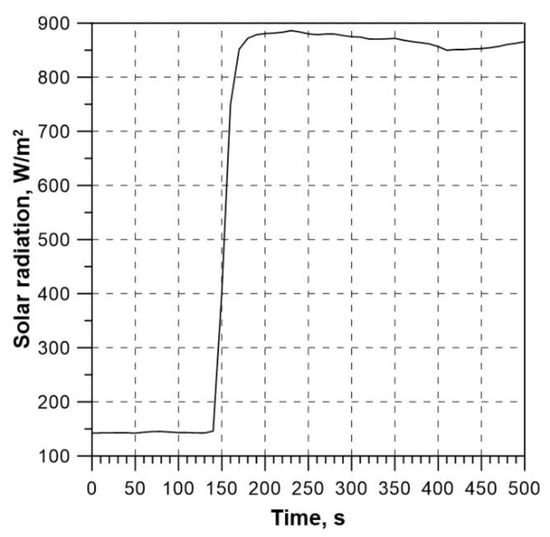
Figure 12.
Time-dependent changes in the measured solar radiation intensity (test 1).
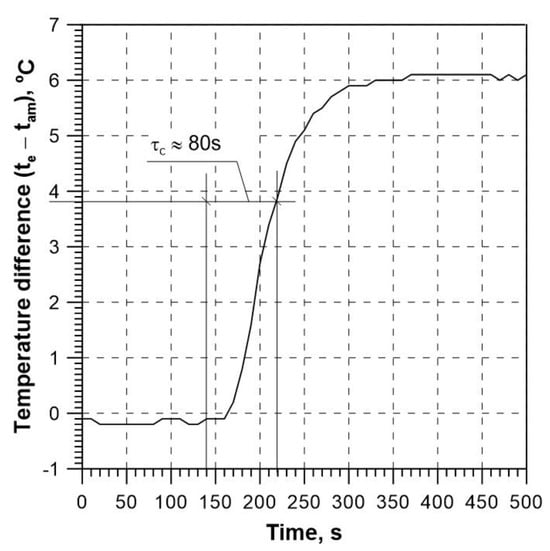
Figure 13.
Time-dependent changes in the measured difference between the temperature of the fluid at the collector outlet and the temperature of ambient air, along with the determined time constant of the collector (test 1).
The increment in the temperature difference, to which the collector time constant corresponds, is: te − tam = 0.632·[6 − (−0.1)] = 3.9 °C. Considering the parameters of the first steady state, i.e., (te − tam)0 = −0.1 °C, the (experimentally determined) time constant thus totals τc ≈ 80 s (Figure 13).
The measurements were repeated (test 2) on another day to confirm the value using the same procedure. The results are presented in Figure 14 and Figure 15. The jump in the solar radiation intensity due to the shield removal took place in the 170th second (Figure 14).
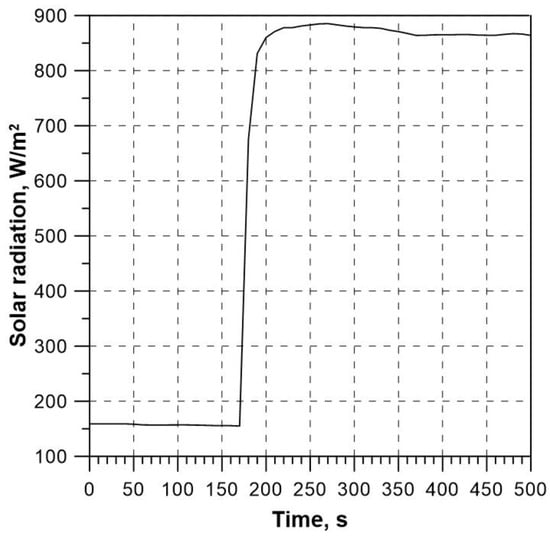
Figure 14.
Time-dependent changes in the measured solar radiation intensity (test 2).
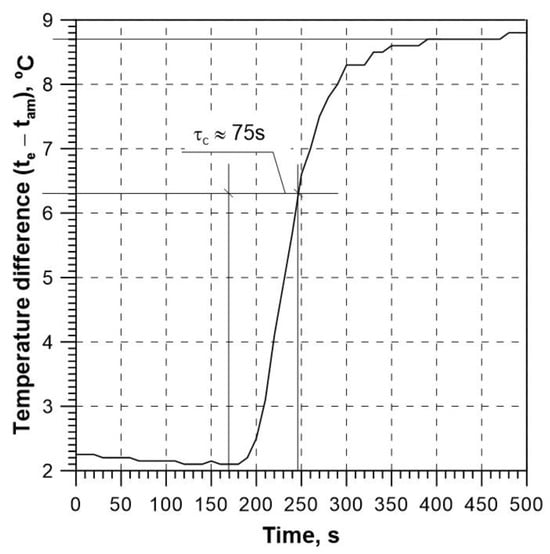
Figure 15.
Time-dependent changes in the measured difference between the temperature of the fluid at the collector outlet and the temperature of ambient air, along with the determined time constant of the collector (test 2).
The increment in the temperature difference, to which the collector time constant corresponds, is (Figure 15): te − tam = 0.632·(8.7 − 2.1) = 4.2 °C.
Seeing that for the first steady state (te − tam)0 = 2.1 °C, the experimentally determined time constant, read for (te − tam) = 4.2 °C + 2.1 °C = 6.3 °C, totals τc ≈ 75 s (Figure 15). This value is very close to the value determined for the conditions of test 1. The agreement between the results proves the correctness of the testing. The experimentally determined time constant of the analysed collector is therefore about 75–80 s.
An example of the application of the collector mathematical model will be presented below in the form of the results of the numerical determination of the collector time constant. The numerical results are compared with the results of experimental testing. To numerically estimate the collector time constant (with the use of the mathematical model), calculations were performed for the above-described conditions of test 1 and test 2.
The following measured histories were the input data for the numerical calculations:
- -
- the history of the fluid total volume flow rate,
- -
- the history of solar radiation intensity,
- -
- the history of the fluid temperature at the collector inlet,
- -
- the history of ambient temperature.
Assuming for the conditions of test 1 that the first steady state took place at the level of about −0.2 °C (the difference between the fluid temperature at the collector outlet and the ambient temperature) and the second steady state (after the shield was removed)—at the level of 5.3 °C, a time constant of about 65 s was obtained (Figure 16).
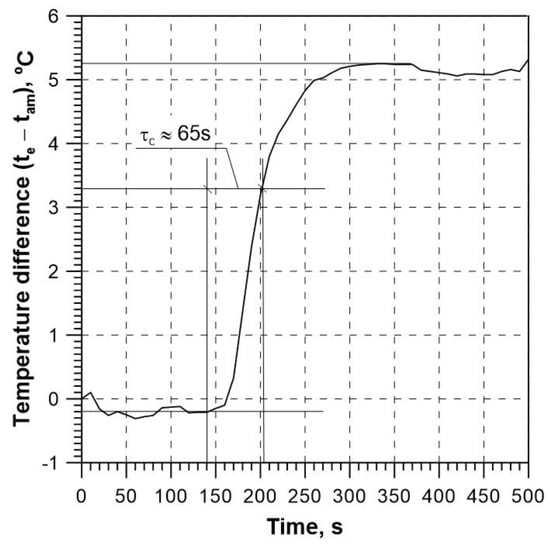
Figure 16.
Time-dependent changes in the calculated difference between the temperature of the fluid at the collector outlet and the measured temperature of ambient air, along with the collector time constant determined for the conditions of test 1.
For the conditions of test 2 (Figure 17), the first steady state was achieved for a temperature difference of about 1.3 °C, and the second was achieved for a temperature difference of about 7.3 °C. The increment in the difference for which the time constant value should be read is thus (taking into account that the initial difference is 1.3 °C): te − tam = 0.632·(7.3 − 1.3) + 1.3 = 5.1 °C. For this value of the difference between the temperature of the fluid at the collector outlet and the ambient temperature, the collector time constant read from Figure 17 is about 70 s.
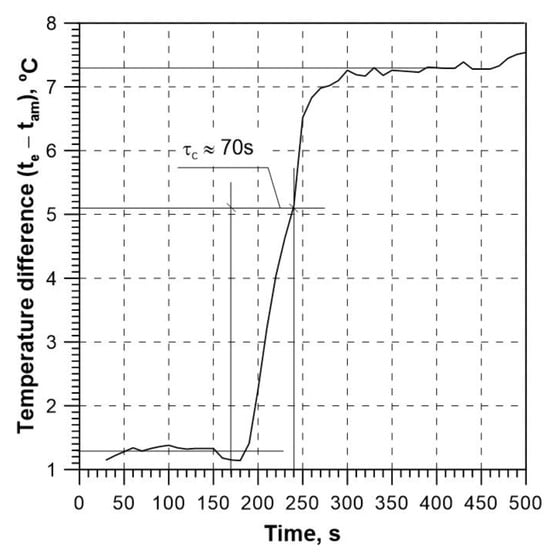
Figure 17.
Time-dependent changes in the calculated difference between the temperature of the fluid at the collector outlet and the measured temperature of ambient air, along with the collector time constant determined for the conditions of test 2.
The results of the numerical determination of the collector time constant differ slightly from the time constant determined experimentally. Some differences were to be expected, even due to the fact that the initial conditions adopted in the numerical model differ slightly from the real ones. This mainly relates to the fact that the temperature of the fluid at the collector outlet was calculated using the developed mathematical model, while during the experiment it was measured. Nonetheless, taking account of the very big jump in the intensity of solar radiation that is required for the correct determination of the time constant, the obtained results of numerical calculations can be viewed as satisfactory, and the developed mathematical model can be considered a helpful tool in the case of the FPSC time constant determination.
6. Instantaneous Efficiency of the Collector under Outdoor Conditions
This section presents selected results of the measurements and calculations performed to determine the instantaneous efficiency of the FPSC installed on the test stand.
To calculate the collector instantaneous efficiency, the testing should be carried out under conditions meeting the requirements specified in [13].
The collector’s instantaneous efficiency should be determined for a steady state. Efficiency is defined as:
where:
Gβ—total intensity of solar radiation reaching the collector surface, W/m2,
Aap—surface area of the collector aperture, m2,
—instantaneous power collected by the fluid flowing through the collector channels, W.
Instantaneous power is calculated as:
Substituting expression (11) in formula (10), the following is obtained (steady-state instantaneous efficiency):
The conditions for which it is assumed that the steady state is achieved under outdoor conditions are described by standard [13]. As specified by the standard, the period of testing steady-state measuring points should include an initial period of at least 15 min with an appropriate temperature at the inlet, followed by a period of steady-state measurements of at least 10 min. The collector is considered to have operated during the period of measurements under steady-state conditions if, during the measurements, none of the experimental parameters deviated from their mean values by more than the limit value given in Table 1. To determine whether steady-state conditions have occurred, the mean values of each parameter (obtained for another interval of 30 s) should be compared with the mean values of the entire period of the measurements. During the testing, the solar radiation intensity on the plane of the collector aperture should be higher than 700 W/m2.

Table 1.
Permitted deviation of measured parameters during the measurement period [13].
Figure 18 presents measured histories of ambient temperature (tam) and of the fluid at the collector inlet (tin) and outlet (te) for a selected summer day in Cracow. The measured history of the total solar radiation intensity (Gβ) for the day is illustrated in Figure 19. The measurements cover the period from 5 a.m. to 4 p.m.
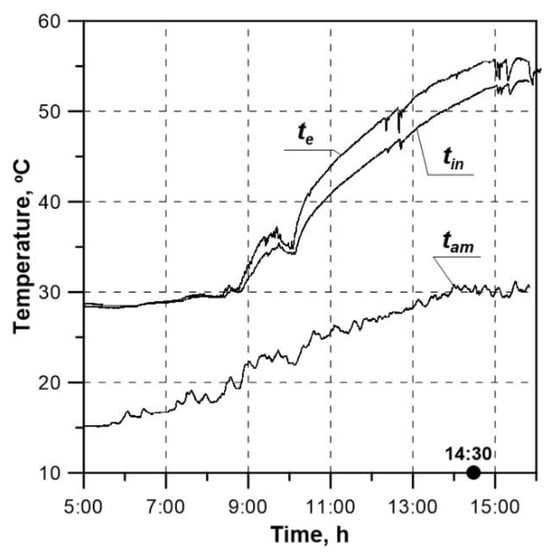
Figure 18.
Measured histories of the fluid temperature at the collector inlet (tin) and outlet (te) and of ambient temperature (tam).
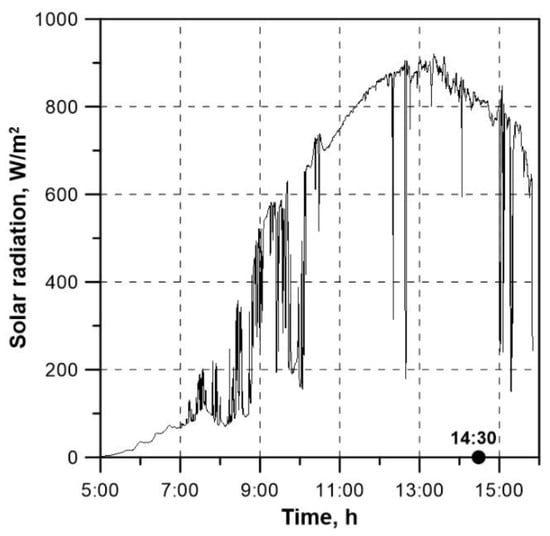
Figure 19.
Measured history of total solar radiation intensity Gβ.
Based on the measurements, it was found that the requirements specified in the above-mentioned standard were satisfied at about 2.30 p.m. The collector instantaneous efficiency calculated using Formula (14) was η = 79.6%. The calculations were carried out for the collector aperture surface area of Aap = 1.83 m2 and for the measured volume flow rate = 6.03 L/min (mass flow rate = 0.1027 kg/s).
Moreover, to establish the collector heat losses through the casing:
The following quantities were determined:
- -
- the energy of solar radiation reaching the collector surface:
- -
- the collector’s optical losses:
The individual components of Formula (15) for the analysed steady state total are:
= 1485.6 W (for Gβ = 811.8 W/m2),
= 215.4 W (for the transmission-absorption coefficient τα = 0.9·0.95 = 0.855),
= 1183.1 W (for cf = 3600 J/(kgK), tin = 52 °C and te = 55.2 °C),
= 87.1 W.
Moreover, using the following relationship:
The maximum measuring error was determined (a one-off measurement) with a probability of 0.999.
All measurements, the results of which are presented in this study, were carried out with specific accuracy. The measurements of the fluid volume flow rate and of solar radiation intensity Gβ were performed with an accuracy of ±0.1% of the measuring range. Consequently, the volume flow measurement accuracy (using a flowmeter with a measuring range of 2–40 L/min) was 0.04 L/min. The accuracy of measuring solar radiation intensity (using a pyranometer with a range of 0–1500 W/m2) totalled 1.5 W/m2. The measurement of the difference in the fluid temperature Δtf = (te − tin) was performed using error compensation of Pt100 sensors at both measuring points. The accuracy of the measurement in this case totalled ±0.1 °C. This means that it was higher than the accuracy of a single Pt100 input, which is ±0.5 °C.
The maximum error calculated for the above data is 0.032. The collector’s real instantaneous efficiency is thus totalled ηins = η + Δηmax = 79.6% ± 3.2%.
The collector instantaneous efficiency was also determined for the selected time instant of the measurements of 2 November 2023 (Section 4). As indicated by the results, the requirements shown in Table 1 were met at about 1 p.m. The instantaneous efficiency determined by Equation (14) was 68%. The calculations were carried out for the measured
- -
- volume flow rate = 4.4 L/min (mass flow rate = 0.0754 kg/s),
- -
- solar radiation intensity Gβ = 602.6 W/m2,
- -
- fluid temperature at the collector inlet and outlet of 33.7 °C and 36.5 °C, respectively.
In addition, for the fluid average temperature of 35 °C, the fluid specific heat of 3560 J/(kg K) and density of 1028 kg/m3 were used for the calculations. Using Equation (18), the maximum error obtained for this case was also 3.2%.
7. Conclusions
The paper briefly describes an in-house mathematical model of a liquid flat-plate solar collector, enabling simulation of the collector’s transient-state operation. The differential equations, which constitute the energy balance equations for all the collector components, were formulated and solved in an earlier study. Time and space derivatives were approximated using appropriate difference schemes. The result was a one-dimensional distributed parameter model. From the perspective of the stability of numerical solutions, the important issue is the adoption of appropriate values for the time and spatial division steps. For this purpose, the analytical solution for the transient state was used, which takes account of the forcing of heating on the tube’s outer surface. The established values of steps Δτ and Δz were then applied for experimental verification, consisting of comparing the calculated and measured history of the fluid temperature at the collector outlet. Fully satisfactory agreement between the histories was obtained, which is confirmed by low RE values and the RMSE (0.25 °C).
The determination of the collector time constant presented in the paper is an example of the model application. The values of the time constant obtained for two cases were compared with the values determined experimentally. A satisfactory agreement was found between the results. The values of the time constant determined numerically and experimentally totalled about 65–70 s and about 75–80 s, respectively. The obtained time constant values demonstrate the good thermal properties of the collector. It quickly reaches thermal stability, for example, after a sudden change in solar intensity, and transfers heat in a stable manner to the receiver.
The subsequently calculated collector instantaneous efficiency for the two cases with different weather conditions was 79.6% and 68%, respectively. In both cases, the maximum error in the efficiency determination was 3.2%. It should be noted that the efficiency values are high, but only momentary.
The proposed mathematical model can prove useful in many cases, making it possible to simulate the obtained thermal and flow parameters without the need to carry out tests on real facilities. The collector time constant analysed in the paper can serve as an example. The model can also be used successfully to analyse the effectiveness of the application of new absorber coatings, new collector covers (replacing traditional solar glass covers), or various nanofluids. For the collector user, the model can be useful in the diagnostics of the correct operation of the device. A systematic comparison of the fluid temperature measured at the collector outlet with the results of numerical computations makes it possible to draw conclusions about the technical state of the collector and the working fluid. If the values obtained from the fluid temperature measurement are lower than the numerical results, this may be the effect of fouling of the outer surface of the solar panel glass cover or of deterioration in the fluid thermophysical properties due to glycol gelling or reduced efficiency of the absorber.
The studies presented in the paper were limited to the analysis of flows through parallel channels. However, the proposed model can also be used successfully for serpentine solar collectors. Appropriate formulation of the energy balance equations also makes it possible to apply the model to concentrators and air collectors.
Author Contributions
Conceptualization, W.Z.; methodology, W.Z. and Ł.M.; software, K.S.; validation, W.Z., Ł.M. and K.S.; formal analysis, W.Z.; investigation, Ł.M. and K.S.; data curation, W.Z. and K.S.; writing—original draft preparation, W.Z.; writing—review and editing, W.Z., Ł.M. and K.S. All authors have read and agreed to the published version of the manuscript.
Funding
This research received no external funding.
Data Availability Statement
The original contributions presented in the study are included in the article, further inquiries can be directed to the corresponding author.
Conflicts of Interest
The authors declare no conflicts of interest.
References
- Sharma, R.; Shahbaz, M.; Kautish, P.; Vo, X.V. Does energy consumption reinforce environmental pollution? Evidence from emerging Asian economies. J. Environ. Manag. 2021, 297, 113272. [Google Scholar] [CrossRef] [PubMed]
- Song, M.; Xu, H.; Shen, Z.; Pan, X. Energy market integration and renewable energy development: Evidence from the European Union countries. J. Environ. Manag. 2022, 317, 115464. [Google Scholar] [CrossRef] [PubMed]
- Estevão, J.; Lopes, J.D. SDG7 and renewable energy consumption: The influence of energy sources. Technol. Forecast. Soc. Chang. 2024, 198, 123004. [Google Scholar] [CrossRef]
- Lamnatou, C.; Cristofari, C.; Chemisana, D. Renewable energy sources as a catalyst for energy transition: Technological innovations and an example of the energy transition in France. Renew. Energy 2024, 221, 119600. [Google Scholar] [CrossRef]
- Kędzierski, A.; Bielecki, S. Comparative analysis of selected prosumer renewable energy solutions for a single-family residential house. Rynek Energii 2023, 2, 23–33. (In Polish) [Google Scholar]
- Chopra, K.; Pathak, P.K.; Samykano, M.; Tyagi, V.V.; Pandey, A.K. Recent Advancements in Design of Flat Plate Solar Collectors. IOP Conf. Ser. Mater. Sci. Eng. 2021, 1127, 012007. [Google Scholar] [CrossRef]
- Pandey, K.M.; Chaurasiya, R. A review on analysis and development of solar flat plate collector. Renew. Sustain. Energy Rev. 2017, 67, 641–650. [Google Scholar] [CrossRef]
- Zheng, J.; Febrer, R.; Castro, J.; Kizildag, D.; Rigola, J. A new high-performance flat plate solar collector. Numerical modelling and experimental validation. Appl. Energy 2024, 355, 122221. [Google Scholar] [CrossRef]
- Shemelin, V.; Matuška, T. Quantitative review on recent developments of flat-plate solar collector design. Part 1: Front-side heat loss reduction. Energy Rep. 2023, 9, 64–69. [Google Scholar] [CrossRef]
- He, Y.; Yu, H.; Duan, G.; Wang, Y.; Yang, Q.; Feng, L.; Zhang, J. Thermal performance and experimental analysis of stainless steel flat plate solar collector with full-flow channels. Heliyon 2024, 10, e28255. [Google Scholar] [CrossRef]
- Mohseni-Gharyehsafa, B.; Esfahani, J.A.; Kim, K.C.; Ouerdane, H. Soft computing analysis of thermohydraulic enhancement using twisted tapes in a flat-plate solar collector: Sensitivity analysis and multi-objective optimization. J. Clean. Prod. 2021, 314, 127947. [Google Scholar] [CrossRef]
- Abdelnour, N.; Braun, R.; Torio, H.; Eicker, U. Testing of uncovered solar thermal collectors under dynamic conditions and identification of performance parameters—For nocturnal radiative cooling applications. Sol. Energy Adv. 2023, 3, 100038. [Google Scholar] [CrossRef]
- ISO 9806:2017; Solar Energy—Solar Thermal Collectors—Test Methods. International Organization for Standardization: Geneva, Switzerland, 2017.
- Ajeena, A.M.; Farkas, I.; Víg, P. Performance enhancement of flat plate solar collector using ZrO2-SiC/DW hybrid nanofluid: A comprehensive experimental study. Energy Convers. Manag. X 2023, 20, 100458. [Google Scholar] [CrossRef]
- Ajeena, A.M.; Farkas, I.; Víg, P. Energy and exergy assessment of a flat plate solar thermal collector by examine silicon carbide nanofluid: An experimental study for sustainable energy. Appl. Therm. Eng. 2024, 236, 121844. [Google Scholar] [CrossRef]
- Struchalin, P.G.; Zhao, Y.; Balakin, B.V. Field study of a direct absorption solar collector with eco-friendly nanofluid. Appl. Therm. Eng. 2024, 243, 122652. [Google Scholar] [CrossRef]
- Huminic, G.; Huminic, A. Capabilities of advanced heat transfer fluids on the performance of flat plate solar collector. Energy Rep. 2024, 11, 1945–1958. [Google Scholar] [CrossRef]
- Hamdan, M.; Abdelhafez, E.; Ajib, S.; Sukkariyh, M. Improving Thermal Energy Storage in Solar Collectors: A Study of Aluminum Oxide Nanoparticles and Flow Rate Optimization. Energies 2024, 17, 276. [Google Scholar] [CrossRef]
- Duffie, J.A.; Beckman, W.A. Solar Engineering of Thermal Processes, 3rd ed.; Wiley Interscience: New York, NY, USA, 2006. [Google Scholar]
- Cadafalch, J. A detailed numerical model for flat-plate solar thermal devices. Sol. Energy 2009, 83, 2157–2164. [Google Scholar] [CrossRef]
- Duffie, J.A.; Beckman, W.A. Solar Engineering of Thermal Processes, 2nd ed.; Wiley Interscience: New York, NY, USA, 1991. [Google Scholar]
- Cerón, J.F.; Pérez-García, J.; Solano, J.P.; García, A.; Herrero-Martín, R. A coupled numerical model for tube-on-sheet flat-plate solar liquid collectors. Analysis and validation of the heat transfer mechanisms. Appl. Energy 2015, 140, 275–287. [Google Scholar] [CrossRef]
- Zhou, L.; Wang, Y.; Huang, Q. CFD investigation of a new flat plate collector with additional front side transparent insulation for use in cold regions. Renew. Energy 2019, 138, 754–763. [Google Scholar] [CrossRef]
- Maji, A.; Deshamukhya, T.; Choubey, G. Numerical investigation and optimisation of flat plate solar collectors using two swarm-based metaheuristic algorithms. Eng. Anal. Bound. Elem. 2023, 156, 78–89. [Google Scholar] [CrossRef]
- Quitiaquez, W.; Estupiñán-Campos, J.; Nieto-Londoño, C.; Quitiaquez, P. CFD Analysis of Heat Transfer Enhancement in a Flat-Plate Solar Collector/Evaporator with Different Geometric Variations in the Cross Section. Energies 2023, 16, 5755. [Google Scholar] [CrossRef]
- Alawi, O.A.; Kamar, H.M.; Salih, S.Q.; Abba, S.I.; Ahmed, W.; Homod, R.Z.; Jamei, M.; Shafik, S.S.; Yaseen, Z.M. Development of optimized machine learning models for predicting flat plate solar collectors thermal efficiency associated with Al2O3-water nanofluids. Eng. Appl. Artif. Intell. 2024, 133, 108158. [Google Scholar] [CrossRef]
- Kalogirou, S.A. Prediction of flat-plate collector performance parameters using artificial neural networks. Sol. Energy 2006, 80, 248–259. [Google Scholar] [CrossRef]
- Chilambarasan, L.; Thangarasu, V.; Ramasamy, P. Solar flat plate collector’s heat transfer enhancement using grooved tube configuration with alumina nanofluids: Prediction of outcomes through artificial neural network modelling. Energy 2024, 289, 129953. [Google Scholar] [CrossRef]
- Al-Tabbakh, A.A. Numerical transient modeling of a flat plate solar collector. Results Eng. 2022, 15, 100580. [Google Scholar] [CrossRef]
- Freegah, B.; Alkhafaji, M.H.; Alhamdo, M.H. Study the thermal response of a solar flat-plate collector under transient solar radiation experimentally and numerically. J. Eng. Res. 2024, in press. [CrossRef]
- Zima, W.; Dziewa, P. Modelling of liquid flat-plate solar collector operation in transient states. Proc. Inst. Mech. Eng. Part A J. Power Energy 2011, 225, 53–62. [Google Scholar] [CrossRef]
- Gerald, C.F.; Wheatley, P.O. Applied Numerical Analysis; Addison-Wesley Publishing Company: New York, NY, USA, 1994. [Google Scholar]
- Serov, E.P.; Korolkov, B.P. Dynamics of Steam Generators; Energia: Moscow, Russia, 1981. (In Russian) [Google Scholar]
- Zima, W.; Dziewa, P. Mathematical modelling of heat transfer in liquid flat-plate solar collector tubes. Arch. Thermodyn. 2010, 31, 45–62. [Google Scholar] [CrossRef]
- Pluta, Z. Fundamentals of Solar Energy Thermal Conversion; Warsaw University of Technology: Warszawa, Poland, 2000. (In Polish) [Google Scholar]
- Microsoft Developer Studio. Fortran PowerStation, 4.0; Microsoft Corporation: Redmond, WA, USA, 1995.
- Zima, W.; Cebula, A.; Cisek, P. Mathematical Model of a Sun-Tracked Parabolic Trough Collector and Its Verification. Energies 2020, 13, 4168. [Google Scholar] [CrossRef]
- Zima, W.; Cisek, P.; Cebula, A. Mathematical model of an innovative double U-tube sun-tracked PTC and its experimental verification. Energy 2021, 235, 121293. [Google Scholar] [CrossRef]
- Radomska, E.; Mika, Ł.; Sztekler, K.; Kalawa, W.; Lis, Ł.; Pielichowska, K.; Szumera, M.; Rutkowski, P. Experimental and Theoretical Investigation of Single-Slope Passive Solar Still with Phase-Change Materials. Energies 2023, 16, 1188. [Google Scholar] [CrossRef]
Disclaimer/Publisher’s Note: The statements, opinions and data contained in all publications are solely those of the individual author(s) and contributor(s) and not of MDPI and/or the editor(s). MDPI and/or the editor(s) disclaim responsibility for any injury to people or property resulting from any ideas, methods, instructions or products referred to in the content. |
© 2024 by the authors. Licensee MDPI, Basel, Switzerland. This article is an open access article distributed under the terms and conditions of the Creative Commons Attribution (CC BY) license (https://creativecommons.org/licenses/by/4.0/).