Article

Assessing the Environmental Impact of Biobased Exterior Insulation Panel: A Focus on Carbon Uptake and Embodied Emissions

Department of Sustainable Resources Management, SUNY College of Environmental Science and Forestry, Syracuse, NY 13210, USA
*
Author to whom correspondence should be addressed.
Energies 2024, 17(14), 3406; https://doi.org/10.3390/en17143406
Submission received: 3 April 2024 / Revised: 17 May 2024 / Accepted: 8 June 2024 / Published: 11 July 2024
(This article belongs to the Section G: Energy and Buildings)

Abstract

:
There are millions of older buildings in the colder climate regions of the world where envelope upgrades are needed to improve the indoor quality of buildings, reduce energy costs, and lower greenhouse gas (GHG) emissions. This study assessed the global warming potential (GWP) with and without accounting for CO2 uptake in trees (biogenic carbon) for 20- and 100-year timespans of an exterior insulation panel. The panels consisted of six different materials with three-ply cross-laminated timber (CLT) as its main component. The net GWP100-Uptake impact when explicitly accounting for biogenic CO2 uptake over a 100-year time period was 7.2 kgCO2-eq/m2 which was 92.7% lower than if it was not included (GWP100-Fossil of 98.7 kgCO2-eq/m2). Using a 20-year GWP increased the impact of the GWP fossil by 21.7% and the CO2 uptake scenario by 298%. The major contributor was the energy used for manufacturing panel’s materials (53%), with embodied carbon in bio-products primarily responsible for offsetting emissions. The findings will be helpful for policymakers in setting net-zero carbon emission goals for embodied and operational impacts of building materials.

1. Introduction

The buildings sector, which includes residential and commercial buildings, accounted for 30% of global final energy use and 33% of total energy sector greenhouse gas (GHG) emissions in 2021, of which 27% resulted from operational processes and 6% from manufacturing building materials [1]. These emissions resulted from the use of fossil fuels during operation (e.g., cooking, heating, electricity) and embodied carbon in initial construction and renovation materials (e.g., cement, aluminum, steel) [2]. Residential buildings consume three-quarters of the total energy used in the building sector [3]. Thus, reducing carbon emissions from residential building operations and materials is critical for decarbonizing this sector.
In 2021, the U.S. building sector accounted for 39% of the U.S. total energy consumption [4] and 35% of the U.S. total GHG emissions [5]. Space heating and cooling consumed 43% of this energy [6]. However, 81% of building heat energy loss occurs due to fabric heat loss in the exterior [7]. The 2021 American Housing Survey [8] reported that 33% of buildings in the U.S. were built before the 1980s. These are energy-inefficient [9] where heating or cooling causes 60% of the overall energy use [10]. About 93% of these residential buildings and 60% of commercial buildings will exist until 2050 [11]. Hence, increasing the thermal envelope performance of these buildings is crucial for reducing energy use as well as GHG emissions [12]. Insulation is considered the key element for reducing heat loss [13], so improving insulation performance can be an effective solution for enhancing thermal efficiency [14]. Thus, a rational choice of insulation materials can significantly contribute to the thermal energy efficiency of new and retrofitted buildings throughout their whole service life [15,16].
Currently, inorganic mineral and fossil-derived thermal insulation materials are predominant in the U.S. because of their performance and relatively low cost [17]. Such mainstream insulation systems include expanded polystyrene (EPS), extruded polystyrene (XPS), polyurethane (PUR), and polyisocyanurate (PIR). The mainstream inorganic insulations such as fiberglass and mineral wool are widely used in buildings because of their advantageous performance in terms of thermal conductivity and water resistance capacity [18,19]. However, fossil fuels are used in their production, involving energy-intensive processes, excessive cost, flammability, and an extremely high amount of embodied carbon per unit of application, which results in adverse impacts on the environment (Table S1). Thus, the lack of sustainable and cost-effective thermal insulation systems in the building sector remains an obstacle to achieving net-zero emission of buildings [20,21,22].
Subsequently, biobased materials are considered environmentally and user-friendly in that they are renewable, biodegradable, and have a comparatively lower respiratory irritation effect than some conventional insulation materials [23]. Consequently, there is increasing interest in the application of biobased materials in low-carbon buildings [24,25]. They are wholly or partly derived from biomass [26], which sequesters atmospheric CO2 during its growth prior to harvest and thereby stores carbon [27]. Because biobased materials exhibit proper hygrothermal behavior [27,28,29,30] and have lower energy requirements for transformation processes than fossil- and mineral-derived insulation materials [31] they are classified as low-embodied energy materials that can reduce building energy use and greenhouse gas emissions [23]. As a result, studies are focusing on substituting fossil-derived materials with biobased materials to reduce the embodied carbon of buildings [32,33,34].
The analysis (Figure 1, Table S2) indicates that fossil-derived materials have moderate to high global warming potential (GWP) values, ranging from 49.4 to 132 kgCO2-eq/m2. Mineral-derived insulation materials, on the other hand, exhibit a wider range of GWP values, spanning from 51 to 844 kgCO2-eq/m2. In contrast, biomass-derived materials demonstrate notably lower GWP values, ranging from 2.72 to 83 kgCO2-eq/m2, suggesting their potential as more environmentally friendly alternatives. These findings provide valuable guidance for evaluating insulation material choices in construction to mitigate the environmental impact [13,16,18,24,31,35,36,37,38,39,40,41,42,43,44,45,46,47,48,49,50,51,52,53,54,55].
Currently, some established biomass-derived insulation panels are produced from agricultural feedstocks such as straw [56,57], hemp [27,58], flax [59], cotton stalks [60], rice husk [61], bamboo [62,63], sunflower [64], corn cobs [65], ichu [66], miscanthus [67] and forest-based feedstocks (e.g., timber [68], wood chips [69], cork [70], etc.) and built into component products such as composite boards, sandwich panels, and binder-less fiberboard panels, glued together with polymer adhesives [71,72,73,74,75]. Historically the use of biomass-derived insulation panels has been limited because of their lower performance with thermal conductivity and density [26,76]. These challenges must be addressed for the better adoption of biobased-derived insulation materials [32,77]. If millions of homes and buildings are going to be insulated, there needs to be a better understanding of the climate impact of different insulation materials and this should be factored into future decisions.
Cross-laminated timber (CLT), glue-laminated timber (glulam or GLT), laminated veneer lumber (LVL), and nail-laminated timber (NLT) are a sustainable alternative to fossil- and mineral-derived structural materials in building construction [78,79]. Most recently, CLT and other timber products are receiving interest from property owners, designers, researchers, and governments [80] for offering a lower carbon footprint [81], faster erection times, less waste generation, lower costs, and significant levels of prefabrication [82,83,84,85].
CLT is an effective construction material in terms of cost effectiveness and environmental performance [84,86]. CLT is a reusable and recyclable construction material which serves as a carbon sink throughout its service life [33,81,87]. The use of CLT can reduce operational energy [88], labor [89], and pace per floor [90] in comparison to conventional structural materials. It also offers more flexible design alternatives [89], competitive pricing [91], and equivalent fire- and heat-resistant capacities [92,93,94]. The life cycle assessment (LCA) method is a valuable tool for evaluating the environmental impact of building materials like CLT [84,95]. While various approaches have been employed to account for biogenic carbon during the estimation of CLT’s environmental impacts [96], research on CLT buildings within the U.S. remains limited [52,97], with only a few publicly available studies [98]. Furthermore, existing studies often focus on long-term impacts based on the global warming potential for 100 years (GWP100), overlooking short-term or near-term impacts. Therefore, there is a need for LCAs of CLT in buildings to highlight the benefits of biogenic carbon over the course of its service life. This approach helps to reconcile discrepancies between shorter-term (e.g., 20 years) and longer-term (e.g., 100 years) assessments of environmental impacts by emphasizing CLT’s carbon sequestration potential [99,100,101,102,103,104,105].
Furthermore, existing LCA studies of mass timber construction primarily focus on the main substrate, such as CLT, glued laminated timber (glulam) or nail-laminated timber (NLT), thereby overlooking the associated products and potentially underestimating actual impacts. This study, however, was conducted on a composite three-ply CLT insulation panel with five different layers, modeled for installation in a building located in Syracuse, New York, the U.S. We applied the Intergovernmental Panel on Climate Change (IPCC) 2021 method for assessing the short-term and long-term net impact on global warming potential (GWP) and the Tool for the Reduction and Assessment of Chemical and other environmental Impacts (TRACI) for examining the impact of this panel on other environmental impact categories. Our results will be useful for authorities that are working to achieve a net-zero energy goal by 2050 and setting limits on the embodied emissions of construction materials.

2. Materials and Methods

2.1. Goal and Scope

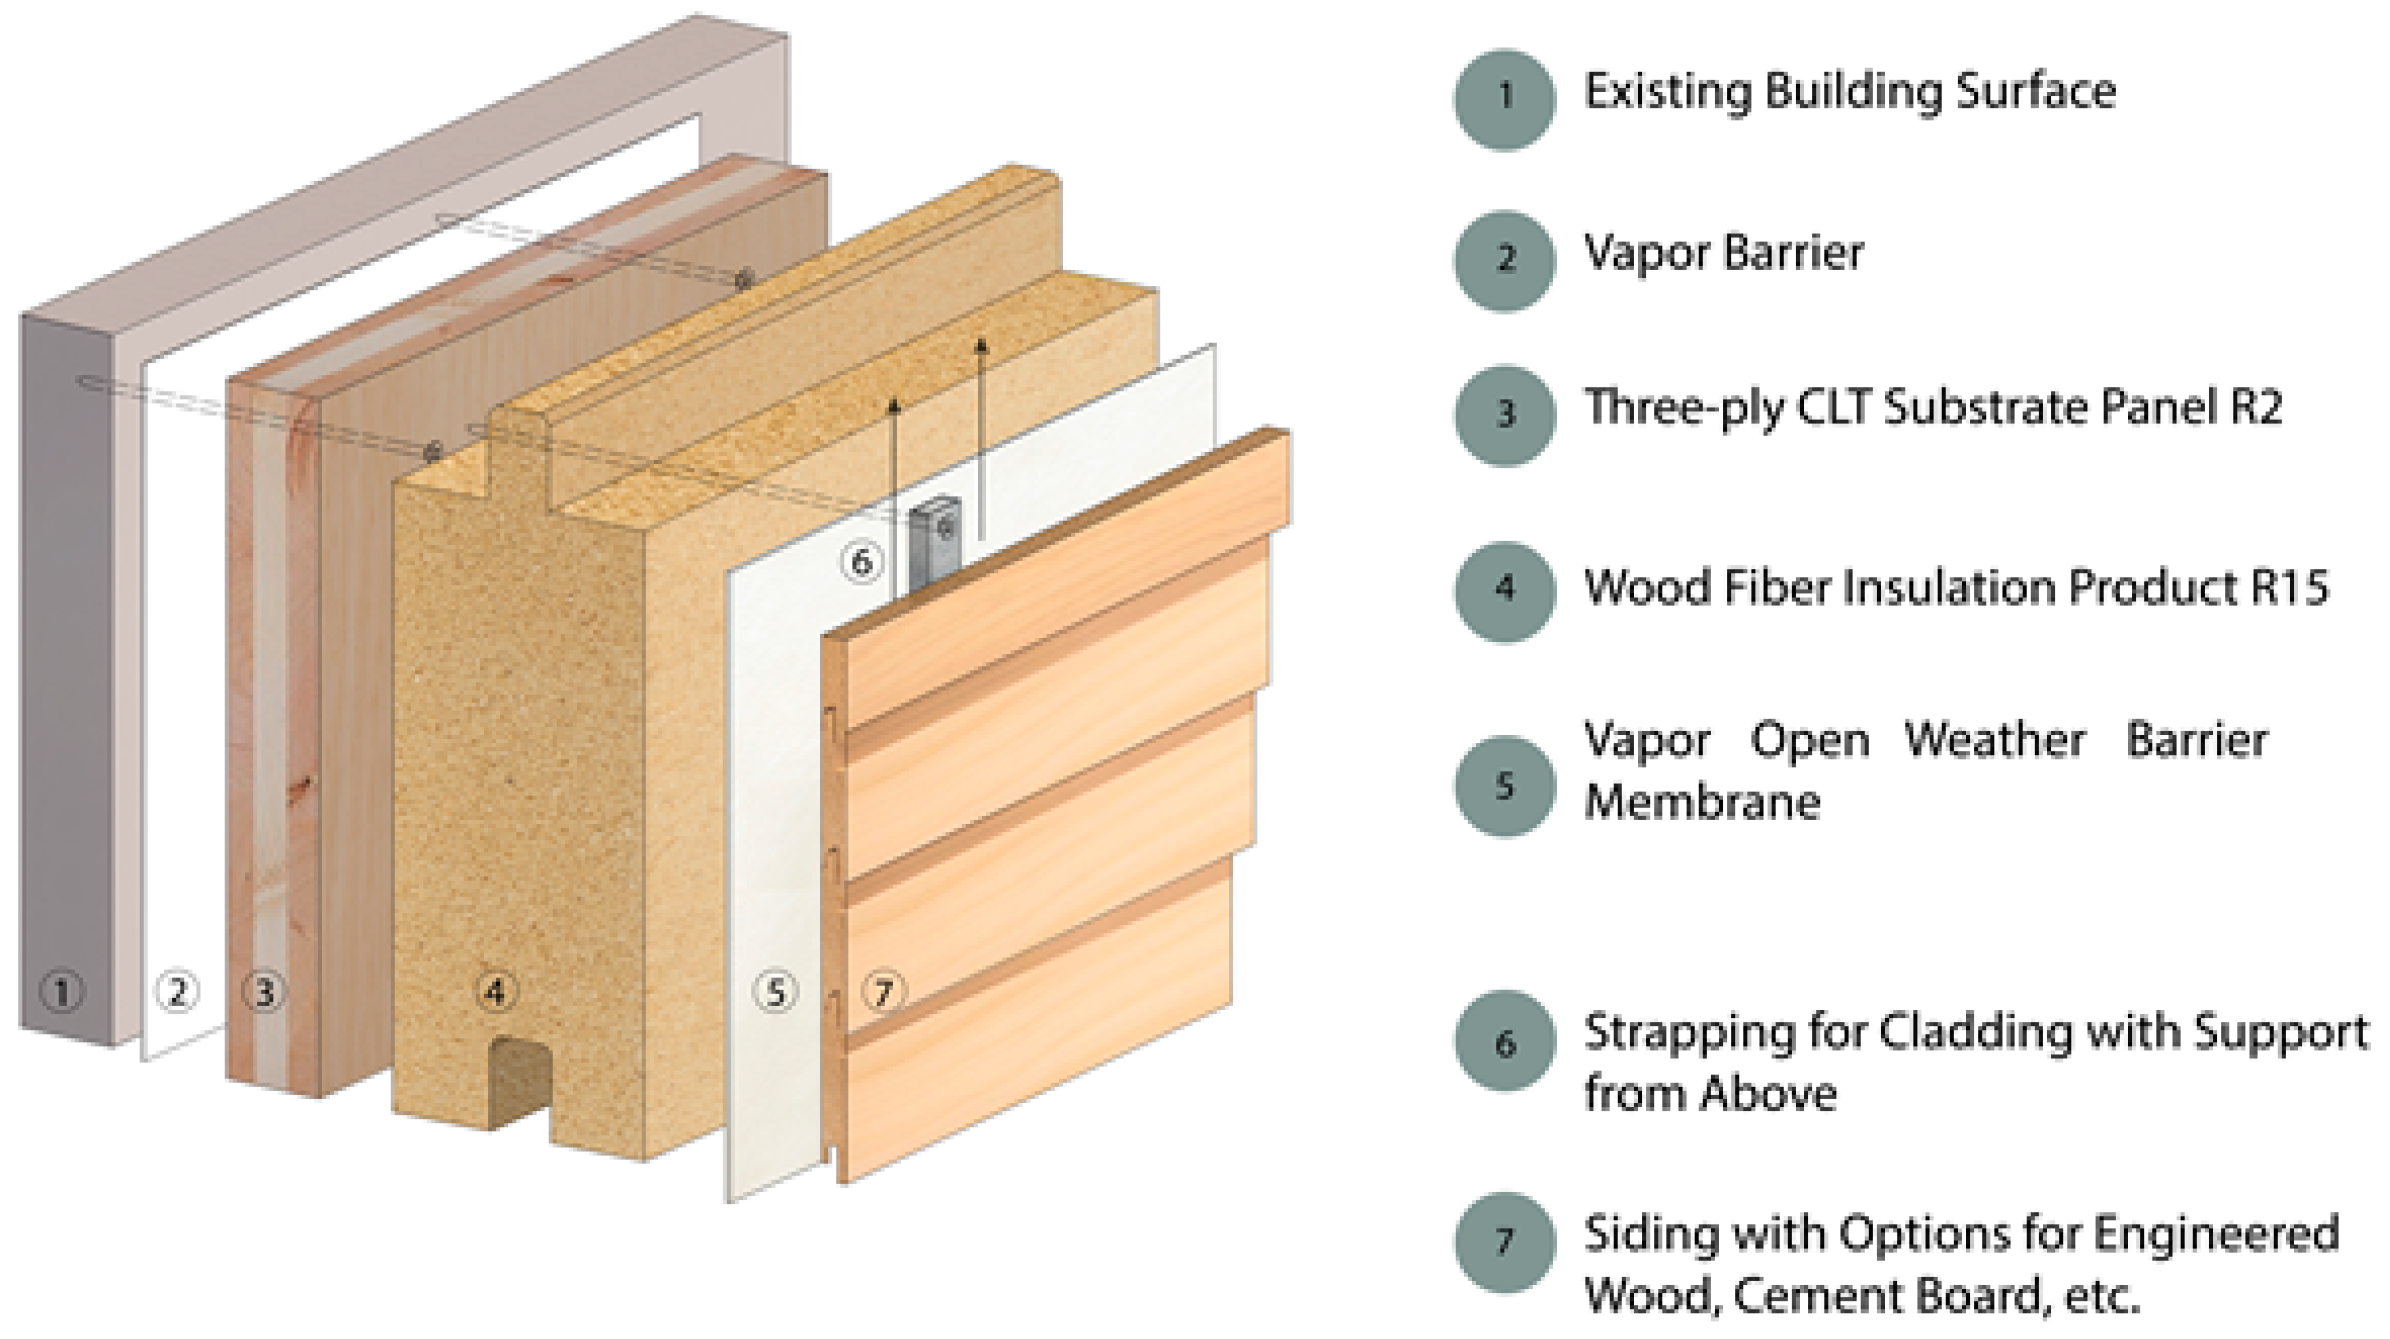
This study evaluates the environmental impacts of the exterior insulation materials of buildings associated with 3-ply CLT biobased insulation panels. The LCA principles and framework applied in this study were based on ISO 14040 [106], ISO 14044 [107], and ISO 21930:2017 procedures [108]. The composite assembly was made of six different materials, including the 3-ply CLT biobased substrate panel, a vapor resistant membrane, a water-resistant membrane, wood fiberboard insulation, exterior cladding, and a strapping material (Figure 2). The 3-ply CLT substrate panel was manufactured by the College of Environmental Science and Forestry (ESF) from wood harvested in New York State. The Syracuse Housing Authority (SHA) is planning to demonstrate this concept on four houses, built between 1890 and 1940, located in Syracuse, NY (USA).
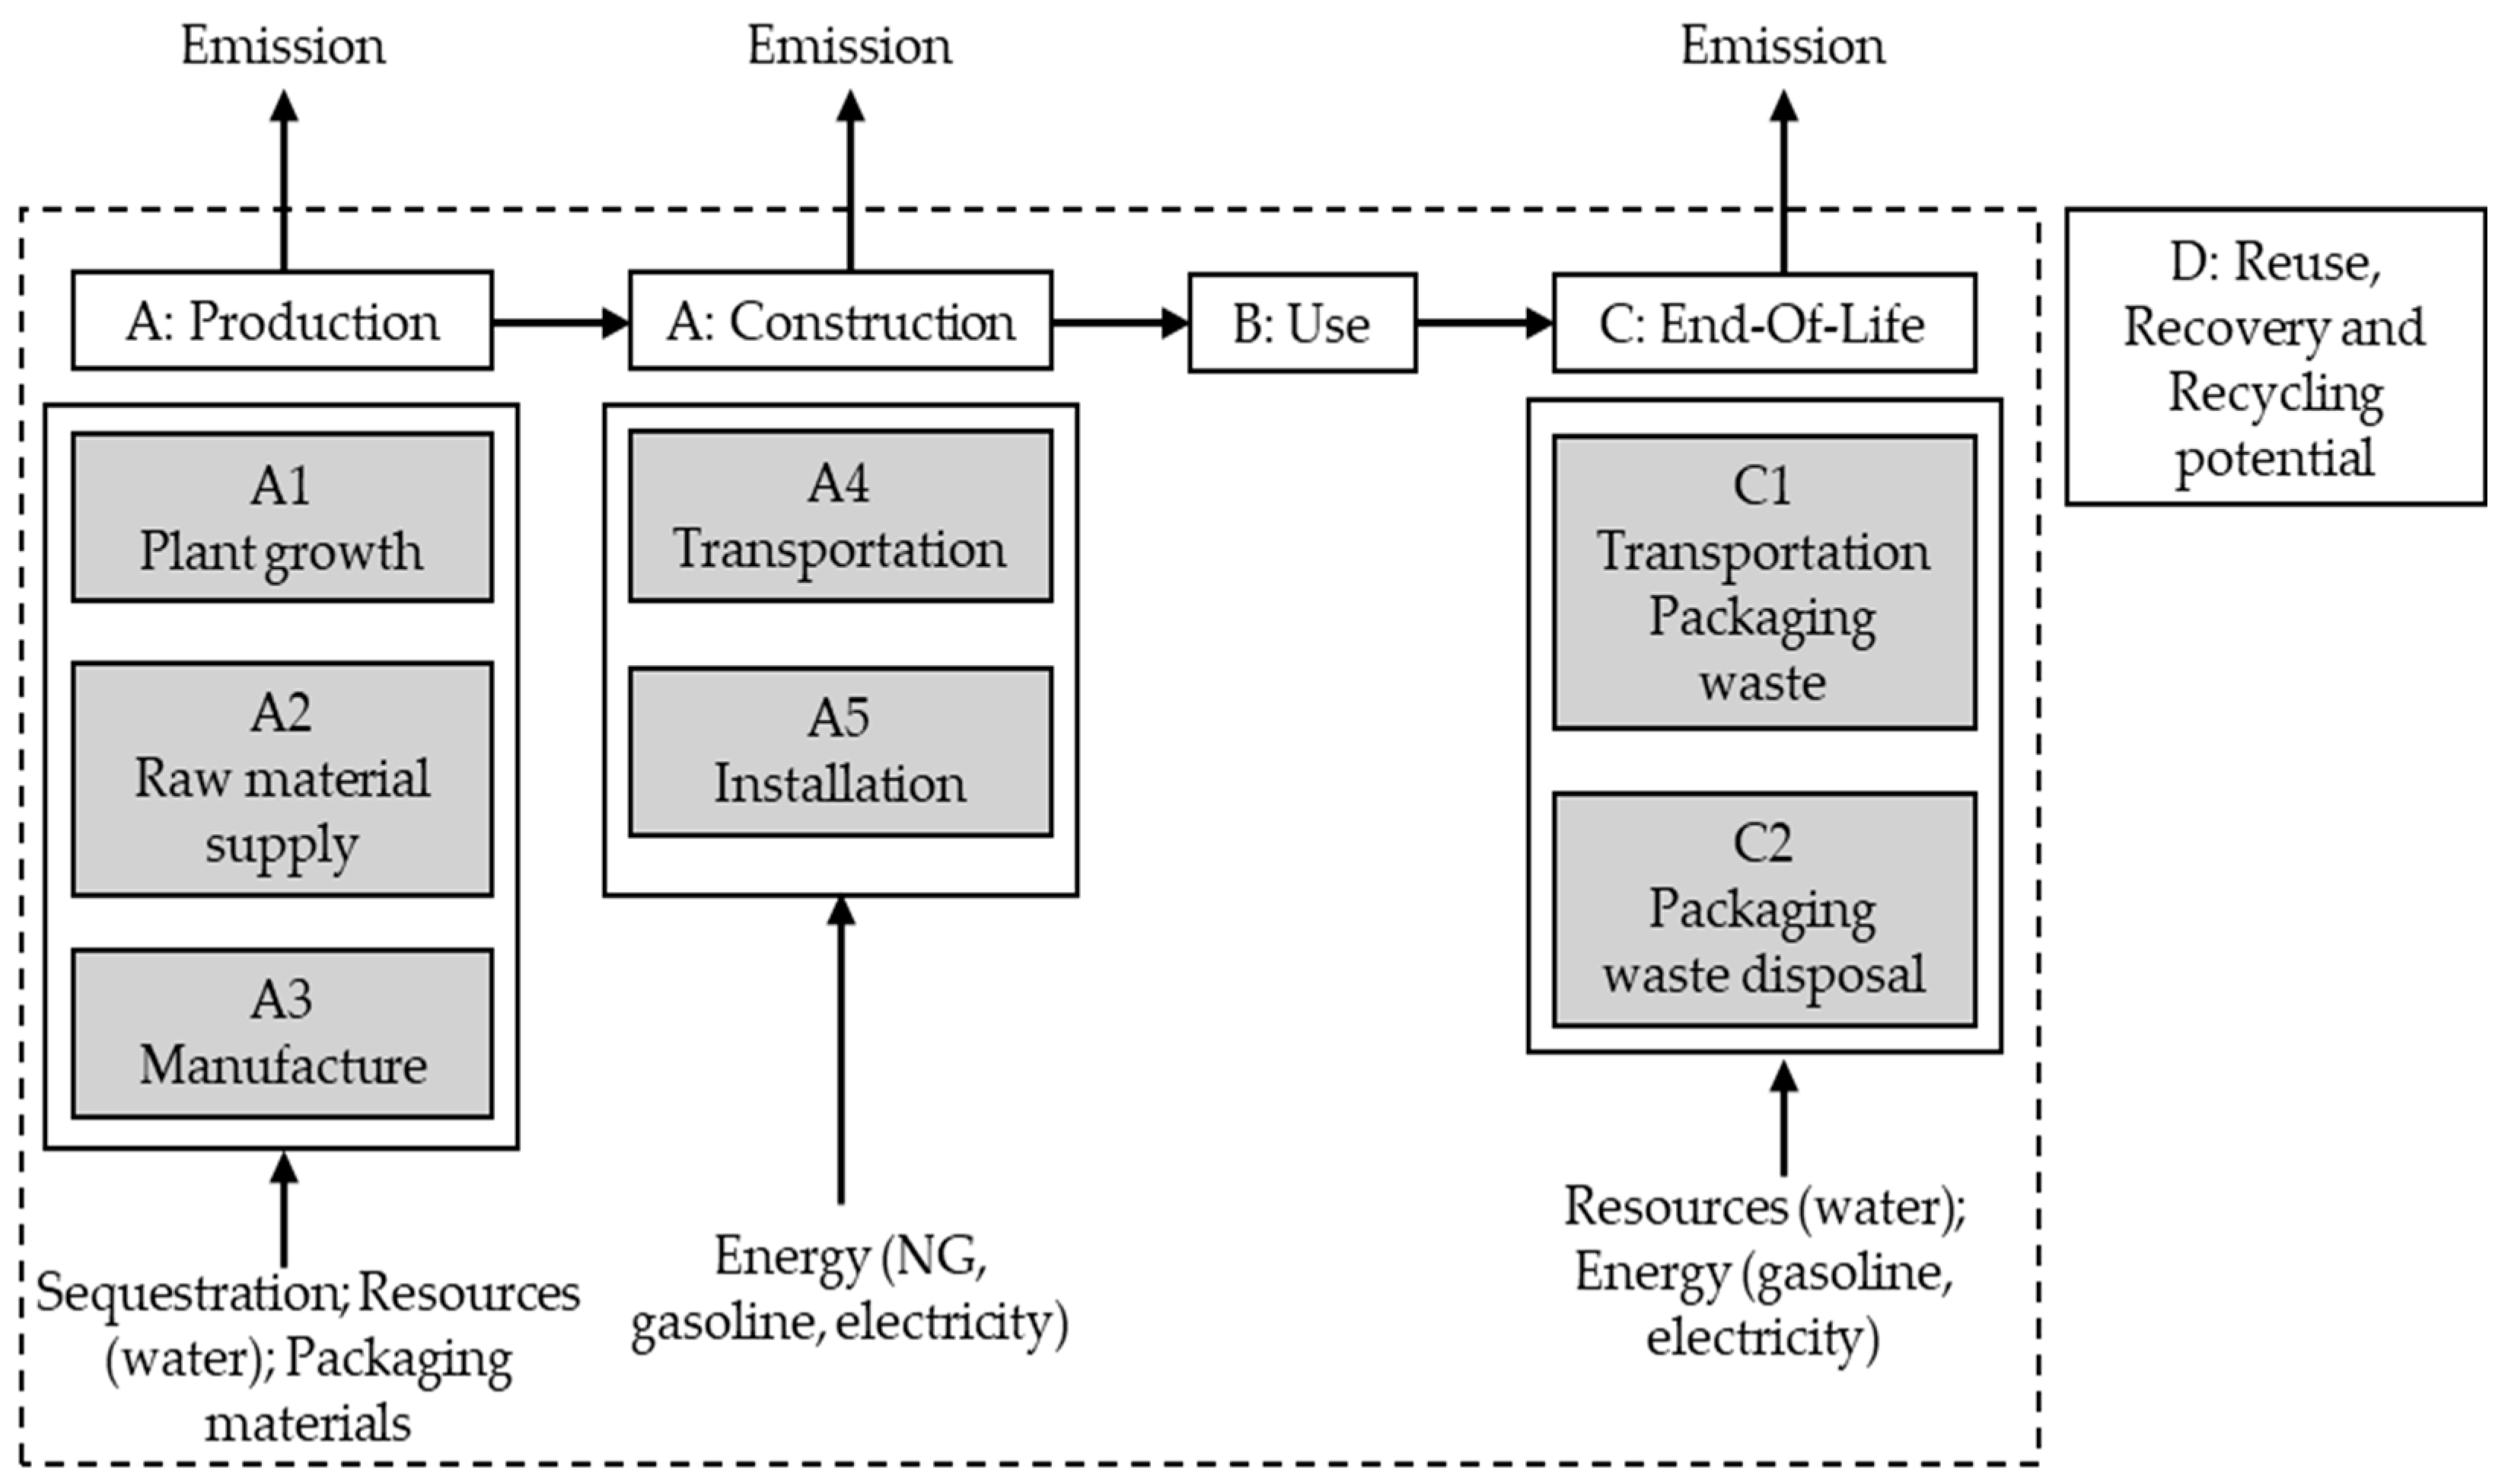
Syracuse lies in Climate Zone 5 and, in accordance with the International Energy Conservation Code (IECC), buildings must have a basic thermal envelope with an R-value of 20, which is determined by the Department of Energy of the United States [110]. The CLT substrate- and biobased insulation was developed to improve the thermal resistance and airtightness of existing walls by increasing their average R-value from R5-7 to over R20 and reducing the values of air changes per hour at 50 pascals (ACH50) from between 7 and 22 to less than 1 [109]. In light of these improvements, this study is designed to determine the environmental impacts of this CLT-panel, including all additional materials required for installation throughout its service life. Accordingly, we chose the functional unit (FU) as 1 m2 of this insulating panel with an R-15 value having a service lifetime of at least 50 years. The system boundaries included the processes associated with the production of all six materials, their transportation, manufacturing and installation of the panel and packaging waste disposal (Figure 3). Plant growth and carbon sequestration were included for the wood-based materials. It was assumed that the panels were designed for deconstruction and will be recovered at the end of their service lifetime for reuse or recycling. Thus, a cut-off approach was used where the impacts for material recovery, reuse and recycling were allocated to the next product phase.
We used the principles in ISO 21930:2017, which recommend employing intermediate flows of materials, to calculate a product’s LCI measurements. It is advised to exclude flows that are transferred between modules or products and to only measure input and output flows that cross the specified system boundary. This includes products, biogenic CO2, non-renewable primary resources having energy content, and renewable primary resources [108,111]. Based on the ISO 21930:2017 reporting guidance, we quantified the impacts for production (A), use (B) and end-of-life (EOL) (C) stages. The plant growth (A1), raw material supply (A2), energy use in the manufacturing of materials (A3), transportation (A4) and installation (A5) of the biobased panel are all included in the production stage (Figure 3). The use stage is not included because this biobased panel has no recorded emission during its service life. We also included the transportation (C1) and disposal (C2) of package waste in the EOL stage, but the reuse, recovery, and recycling of the biobased panel (D) is attributed to the next product [108,112]. In addition, we also excluded human labor, equipment for the installation such as forklifts, and the extraction of unidentified raw materials. It is anticipated that these exclusions would have no significant impact on the interpretation of the results.

2.2. Life Cycle Inventory (LCI)

We used ISO 14040 [106], ISO 14044 [107], and ISO 21930:2017 standards [108] to assess the impact on the environment of an external insulating panel to determine the environmental impacts of an exterior insulation panel consisting of six different materials with a CLT substrate as its main component. This involved foregrounding processes such as plant growth, raw material supply, transportation, energy use in the manufacturing of materials, installation, and the transportation of package waste and disposal. The LCA model is developed in SIMAPRO software (version 9.4.0.2), integrating product-specific details and geographically relevant data obtained from the Environmental Product Declarations (EPDs) for vapor barrier, wood fiber, membrane sheet, strapping, and siding materials. The background inventory data (e.g., electricity, transport) are derived from DATASMART LCI, Ecoinvent V3.6 [113], and the U.S. Life Cycle Inventory (US-LCI) database [114] (Table S3).

2.2.1. Sequestration and Embodied Carbon Estimation

We retrieved the amount of stored carbon in the dry mass of wood used as raw materials from the U.S. LCI database and used the ratio for calculating the stored carbon per FU (kg/m2). For example, 3-ply CLT was made using 94.1 kg (0.2159 m3 for 1 m2 FU) of dry conifer softwood lumber, which had a carbon density of 422 kg/m3. With the lumber’s bulk density of 436 kg/m3, the carbon ratio was 0.97, and the estimated stored carbon was −91.1 kg/FU [115]. Other dry woods that are used to create wood fiber, cladding, and siding have carbon ratios of 0.90, 0.78, and 0.95, respectively.

2.2.2. Material Supply

Vapor Barrier

To regulate water vapor diffusion flow through the building envelope, a fluid vapor barrier system was applied on the existing building wall in Syracuse, NY (New York), during its retrofitting process. The fluid used to coat the existing external wall was Perm-A-Barrier NPL-10, produced by GCP Allied Technologies (GCP) at its factory in Chicago, Illinois (Figure S1). The ability of this membrane to establish a strong barrier against air flow and be vapor impermeable saves energy loss. It acts as the building’s first line of defense for both indoor air quality and energy efficiency. The density of this barrier was 1.15 kg/L, and its dry thickness was 1.016 mm. Hence, 2.038 kg was needed to provide a strong barrier that prevented water vapor from entering and exiting a surface area of 1 m2 (Table 1 and Table S4) [116,117]. Using the Google distance calculator, we determined the distances from the raw material extraction field to the facility and from the facility to the Syracuse installation site were 10 km and 684 km, respectively (Figure S1).

Three-Ply CLT Substrate Panel

The 3-ply cross-laminated timber (CLT) was used as a structural panel on the outer building wall. It is constructed from white pine, from Ward Lumber in Jay, NY, which was hauled by a truck (111 km) from the Adirondack Forest in New York State. The harvested log was sawed, dried, and trucked to Fayetteville, NY (314 km), where it was sold on the retail market. The dried boards were then transported to ESF from Fayetteville (12 km) and used in the lab to create 3-ply CLT panels for the building wall retrofitting in Syracuse (2 km). The major processes for the production of the 3-ply CLT panels were as follows: tree growth and management, harvesting and transportation, debarking and sawing into boards, kiln drying, mixing adhesives, and manufacturing 3-ply CLT sheets (Figure S2). Moreover, 1 m3 of oven-dried planed softwood lumber weighs 436 kg, uses 122.74 MJ of natural gas for drying, and 57.98 kWh of electricity for sawing and planning in a saw mill [115]. Further, adhesive application, pressing, and finishing processes together require 84.75 kWh of additional electricity for 1 m3 of a finished 3-ply CLT panel [118]. For the retrofitting of a 1 m2 exterior wall, 94.1 kg (1 m × 1 m × 0.2159 m) of the 3-ply CLT panel was required and the manufacturing process used 30.8 kWh of electricity and 26.5 MJ of natural gas (Table 1 and Table S4).

Wood Fiber Insulation Product

As a base insulation against thermal leakage and a sound barrier in the wall, two pressure-resistant insulation fiber boards were layered on the 3-ply CLT panel. These boards were made by STEICO in Casteljaloux, France, from 82.2% coniferous wood that was harvested from the forest near Captieux (35 km), using a drying process that yielded a mass of 157.49 kg per m3 [119] (Table 1 and Table S4). The primary processes included growing and harvesting coniferous trees, the transportation of harvested wood, making wood chips, drying, defibration, refining the wood, preparing adhesives, calibrating, forming mattresses, cutting, molding, packaging, and transportation (Figure S3). For the retrofitting of a 1 m2 exterior wall, this panel used two 12.7 kg of STEICO fiber (1 m × 1 m × 0.08 m). It was packaged and shipped from the facility to Bordeaux Port (91 km), then by barge to New York Seaport (6612 km), and finally to Syracuse, NY (258 km).

Membrane Sheet

A membrane sheet weather barrier made of Tyvek, a DuPont product, was used as a protective layer to better shield buildings against water and air infiltration. Its surface mass was 0.110 kg/m2 (Table 1 and Table S4) [120], and the raw materials were gathered (20 km) and manufactured in Delaware by using tape, cap screws, staples, sheeting, and flashing. For the retrofitting of a 1 m2 exterior wall, 8.82 × 10⁻⁵ kg of membrane sheet (1 m × 1 m × 0.0008 m) was used that was packaged and transported by truck to the site, located at 437 km (Figure S4).

Strapping Material

Every 16 inches across the surface, 1″ × 3″ pressure-treated southern pine was utilized as a vertical strapping or furring, fastened with galvanized 60d nails (0.017 kg per piece) every 2′ along the length. The southern pine was produced by Culpeper in Virginia and harvested from a nearby forest (16 km distant), and it was modified utilizing a controlled “closed hygrothermal modification technique” that was carried out at 160 psi inside a pressured cylinder [121]. This process resulted in a mass loss of 7%, resulting in a material with a density of 6.5 kg/m3, after which waterborne copper naphthenate (CuN-W) was fully injected into the wood cells as a fixative preservative (Table S4) [122,123]. Each treating cycle requires 24 to 48 h for the preservatives to fix and form a shield on the wood. The finished southern pine wood trucked to Syracuse, New York (723 km), and the weight of the southern pine wood (1 m × 0.08 m × 0.03 m) and that of the 2′′ galvanized 6d nails required to retrofit a 1 m2 exterior wall were computed to be 1.43 kg and 0.057 kg, respectively (Table 1). For 1 m2 of wood treatment, the energy consumption was calculated using the energy requirements of a typical commercial kiln for thermal modification (Figure S5).

Siding Material

Siding, the outermost layer of the panel, was made of SmartSide materials manufactured by Louisiana-Pacific (LP) in Newberry, Michigan. It was put on a supporting wall as a covering and cladding sheet for ventilated exteriors and ceilings. Aspen, basswood, soft maple, pine, balsam poplar, and white birch are used to make about 93% of the siding products produced by LP [124]. The used SmartSide siding materials was made of aspen, which came from the Manistee National Forest (10 km), has a density of 657 kg per m3 [124], and used 7.32 kg (1.83 m × 1.23 m × 0.008 m) to retrofit a 1 m2 exterior wall (Table 1). The production process included harvesting and making deliveries to the factory, debarking, logging, cutting, drying, blending, and gluing with zinc borate and wax, as well as overlapping with phenolic resin, packaging, and ultimately making deliveries to the Syracuse installation site (840 km) (Table S4, Figure S5).

2.2.3. Energy Use for Material Manufacturing and Panel Installation

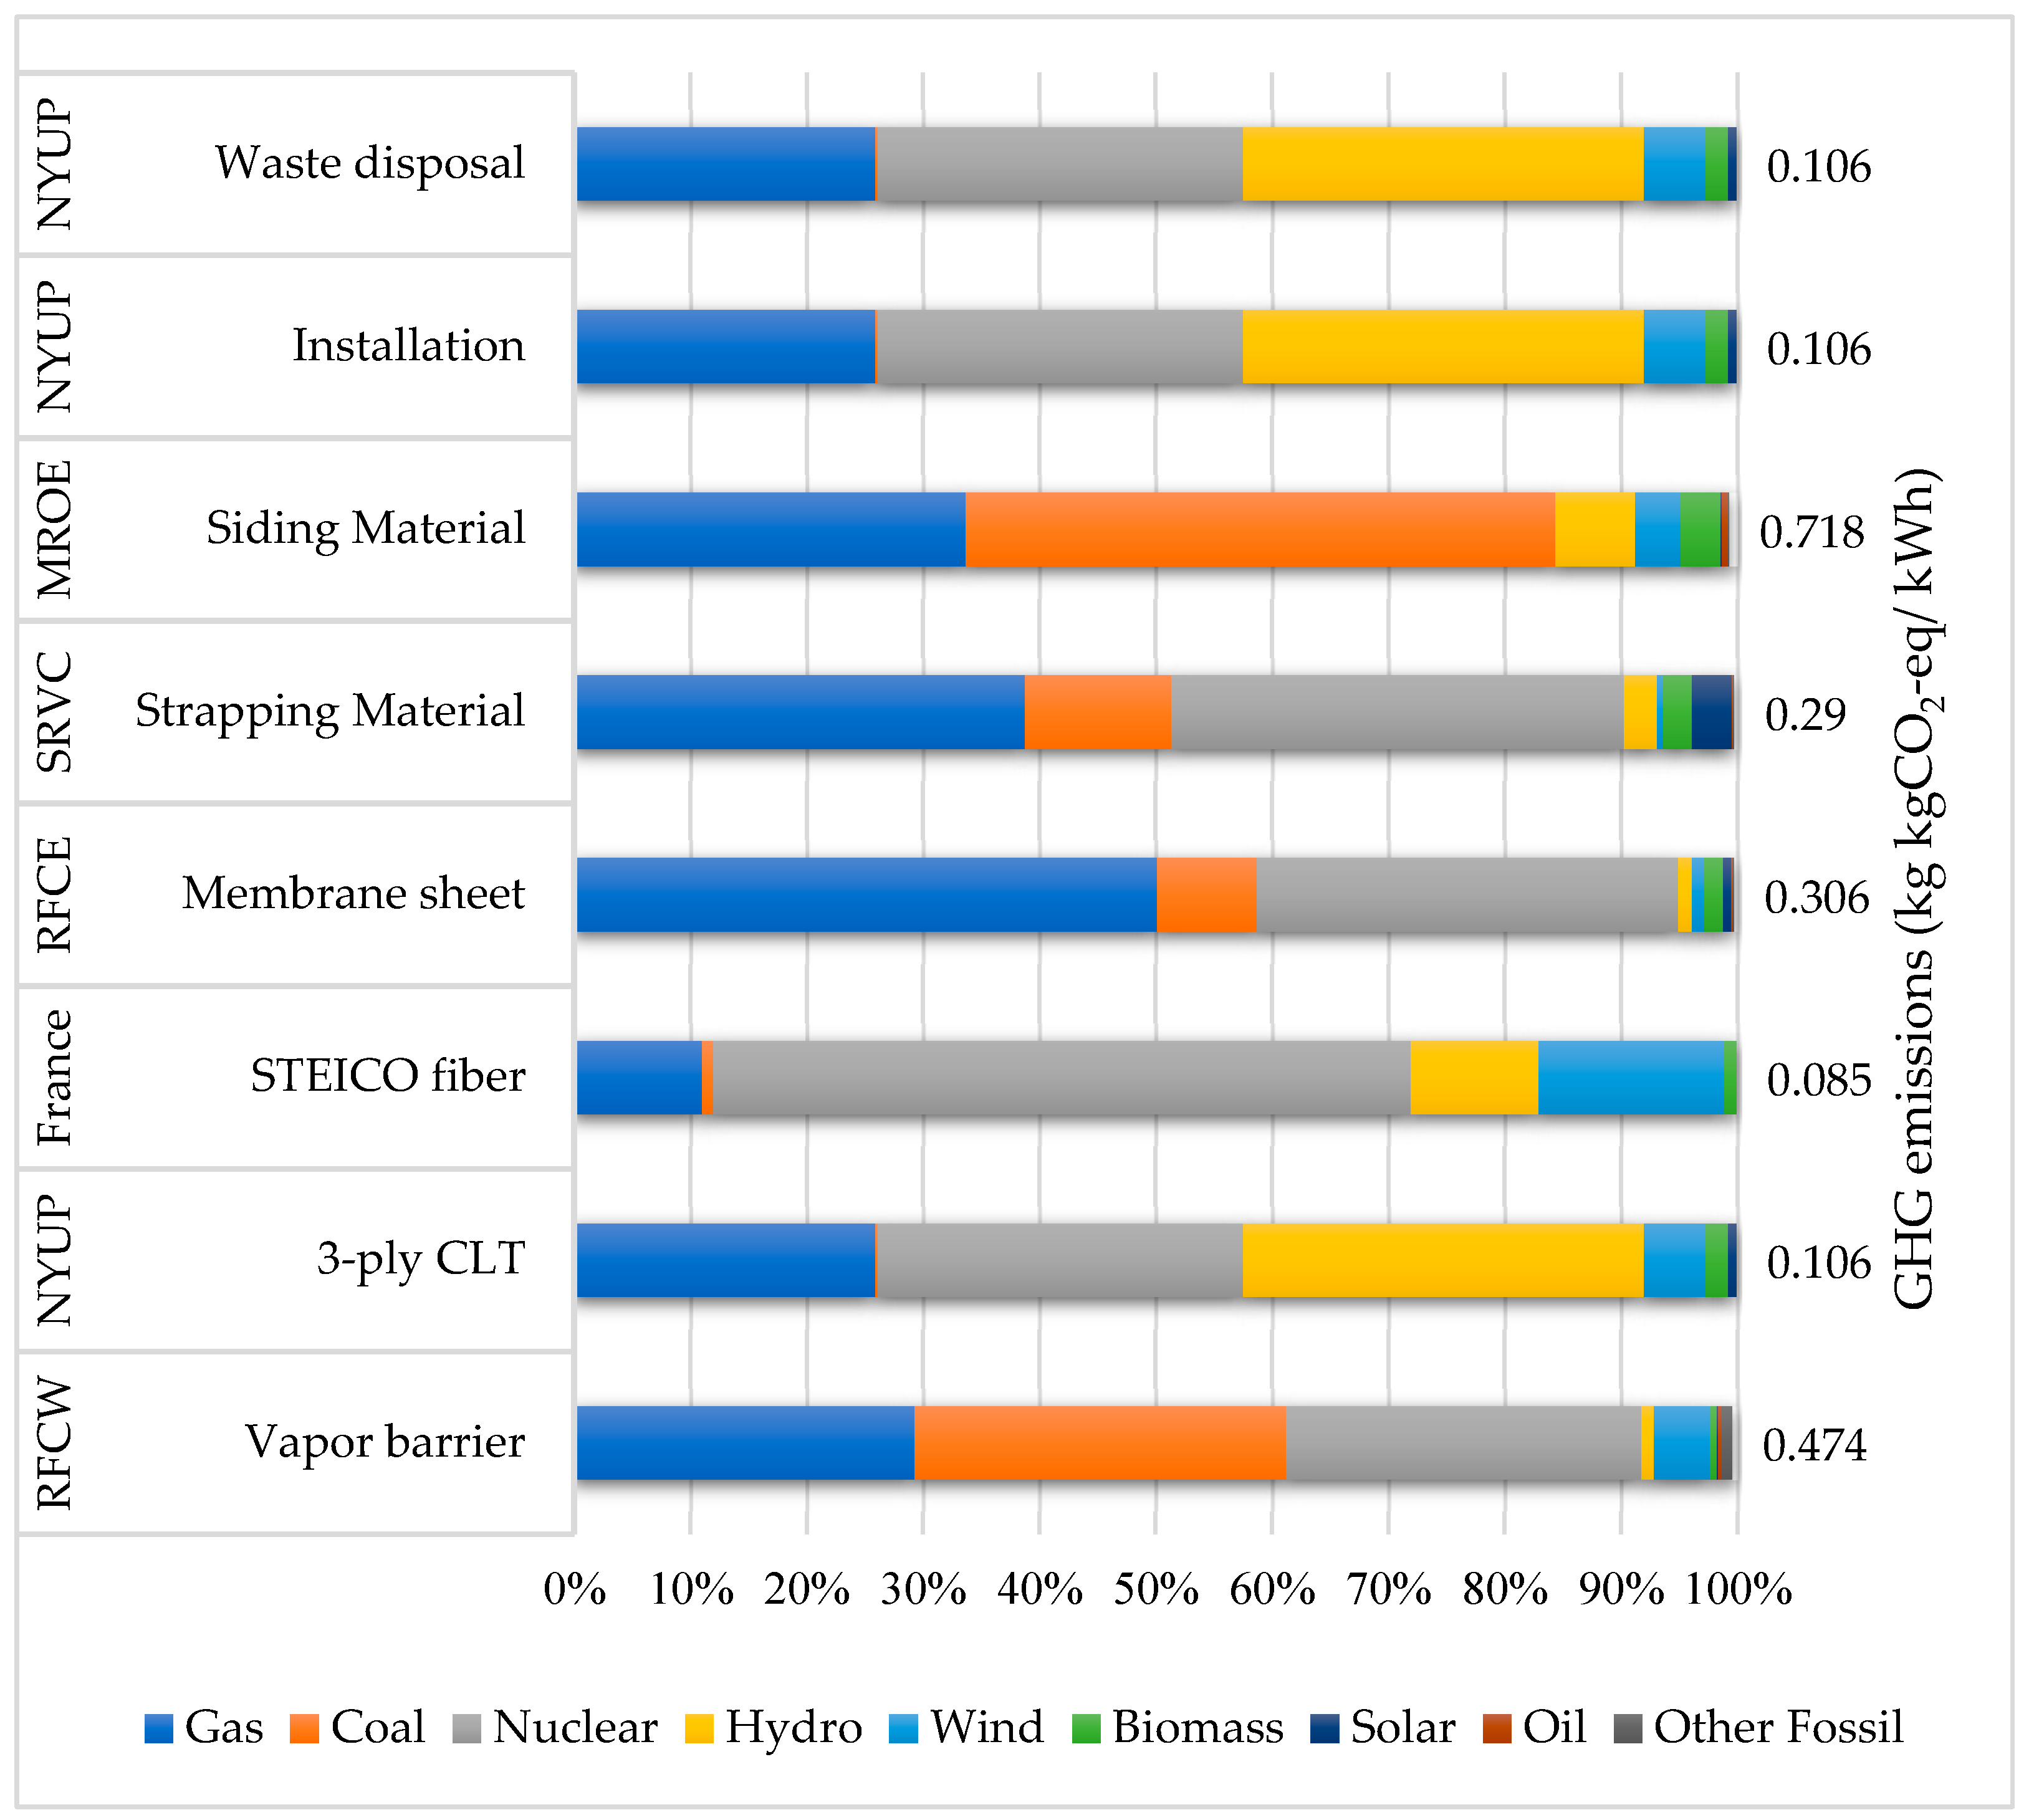
A total of 128.8 kWh of electricity was consumed during the manufacturing processes to produce and assemble all the materials needed for 1 m2 insulation panel. Moreover, the energy consumption for installing the exterior wall of an 8-story building with mass timber in the northeastern region of the USA amounts to 14 kWh/m2 [125]. Additionally, 21.65 L of water were used in the manufacturing process and 30.1 MJ of natural gas were used in drying processes as part of the production. The impacts of each product for electricity use were evaluated based on the power generation mix used during its production, installation, and waste disposal procedures. We collected information on the electricity generation mix from the US EPA Power Profile [126] for products made in the USA and France’s Electricity Transmission Network (RTE) for STEICO wood fiber panels [126] (Figure 4 and Table S6).

2.2.4. Packaging Waste Disposal

The waste disposal scenario only included the packaging waste produced during the installation. It was assumed that the entire biobased insulation panel would be reused after 50 years. For one square meter of building wall insulation, there was 0.272 kg of packaging wastes produced, of which 28% were cardboard and 72% were plastics (Table S7). We evaluated the end-of-life (EOL) impact of these wastes using Onondaga County, New York’s current waste management and treatment scenarios.
Packaging wastes are discarded in municipal waste bins and Syracuse waste haulers and delivered to Manlius for disposal (13.1 km). Onondaga County burnt 35.9% of its municipal waste, recycled 51.9% of it, and dumped 12.2% of it on land in 2019 [127]. In terms of materials, 35% of cardboard waste was recycled, 52.8% incinerated, and 12.2% dumped. In addition, only 2.3% of plastic was recycled, while 80.5% was burned and 17.2% was dumped in sanitary landfills (Table S8) [127,128]. It is assumed that 5 kWh of electricity is consumed during the packaging waste disposal.

2.3. Life Cycle Impact Assessment

The impact assessment was conducted in SIMAPRO v.9.4.0.2 (Amersfoort, the Netherlands) using the IPCC 2021 and TRACI characterization methods [129]. The new IPCC report “AR6 Climate Change 2021: The Physical Science Basis” is the basis for the IPCC 2021 V1.01 method, which measures the global temperature potential (GTP) and global warming potential (GWP) over various time horizons both with (GWPUptake) and without explicitly accounting for carbon dioxide uptake (GWPFossil). We used the approach that implicitly accounts for CO2 uptake across short (20 years) and long (100 years) time periods to quantify the impacts of GWP from fossil emissions; thus, we refer to them as GWP20-Fossil and GWP100-Fossil throughout this paper, respectively. Similarly, we also determined the impact of the panel using the approach that explicitly considers CO2 uptake in addition to emissions from fossil fuels, biogenic emissions, and land transformation, which we will refer to as GWP20-Uptake and GWP100-Uptake in this paper. Furthermore, we also aggregated the impacts from all categories to determine the net impacts of this panel for both time periods, and the impact was expressed in kilograms of the carbon dioxide equivalent (kgCO2-eq/FU). Additionally, TRACI v.2.1 was also used for characterizing the potential impacts on ozone depletion (kg CFC-11 eq/FU), smog formation (kg O3 eq/FU), acidification (kg SO2 eq/FU), eutrophication (kg N eq/FU), human carcinogenic toxicity (CTUh/FU) and human noncarcinogenic toxicity (CTUh/FU), respiratory effects associated with particulate matter (kg PM2.5 eq/FU), ecotoxicity (CTUe/FU) and fossil fuel depletion (MJ surplus/FU).

2.4. Uncertainty Analysis

Uncertainty and sensitivity to variable parameter changes (±20%) are calculated based on 10,000 Monte Carlo simulations based on an assumed 95% probability normal distribution. The coefficient of variation (CV) was applied to normalize the indicator of dispersion in the impact category data [130].

3. Results

3.1. Impacts on Global Warming Potential

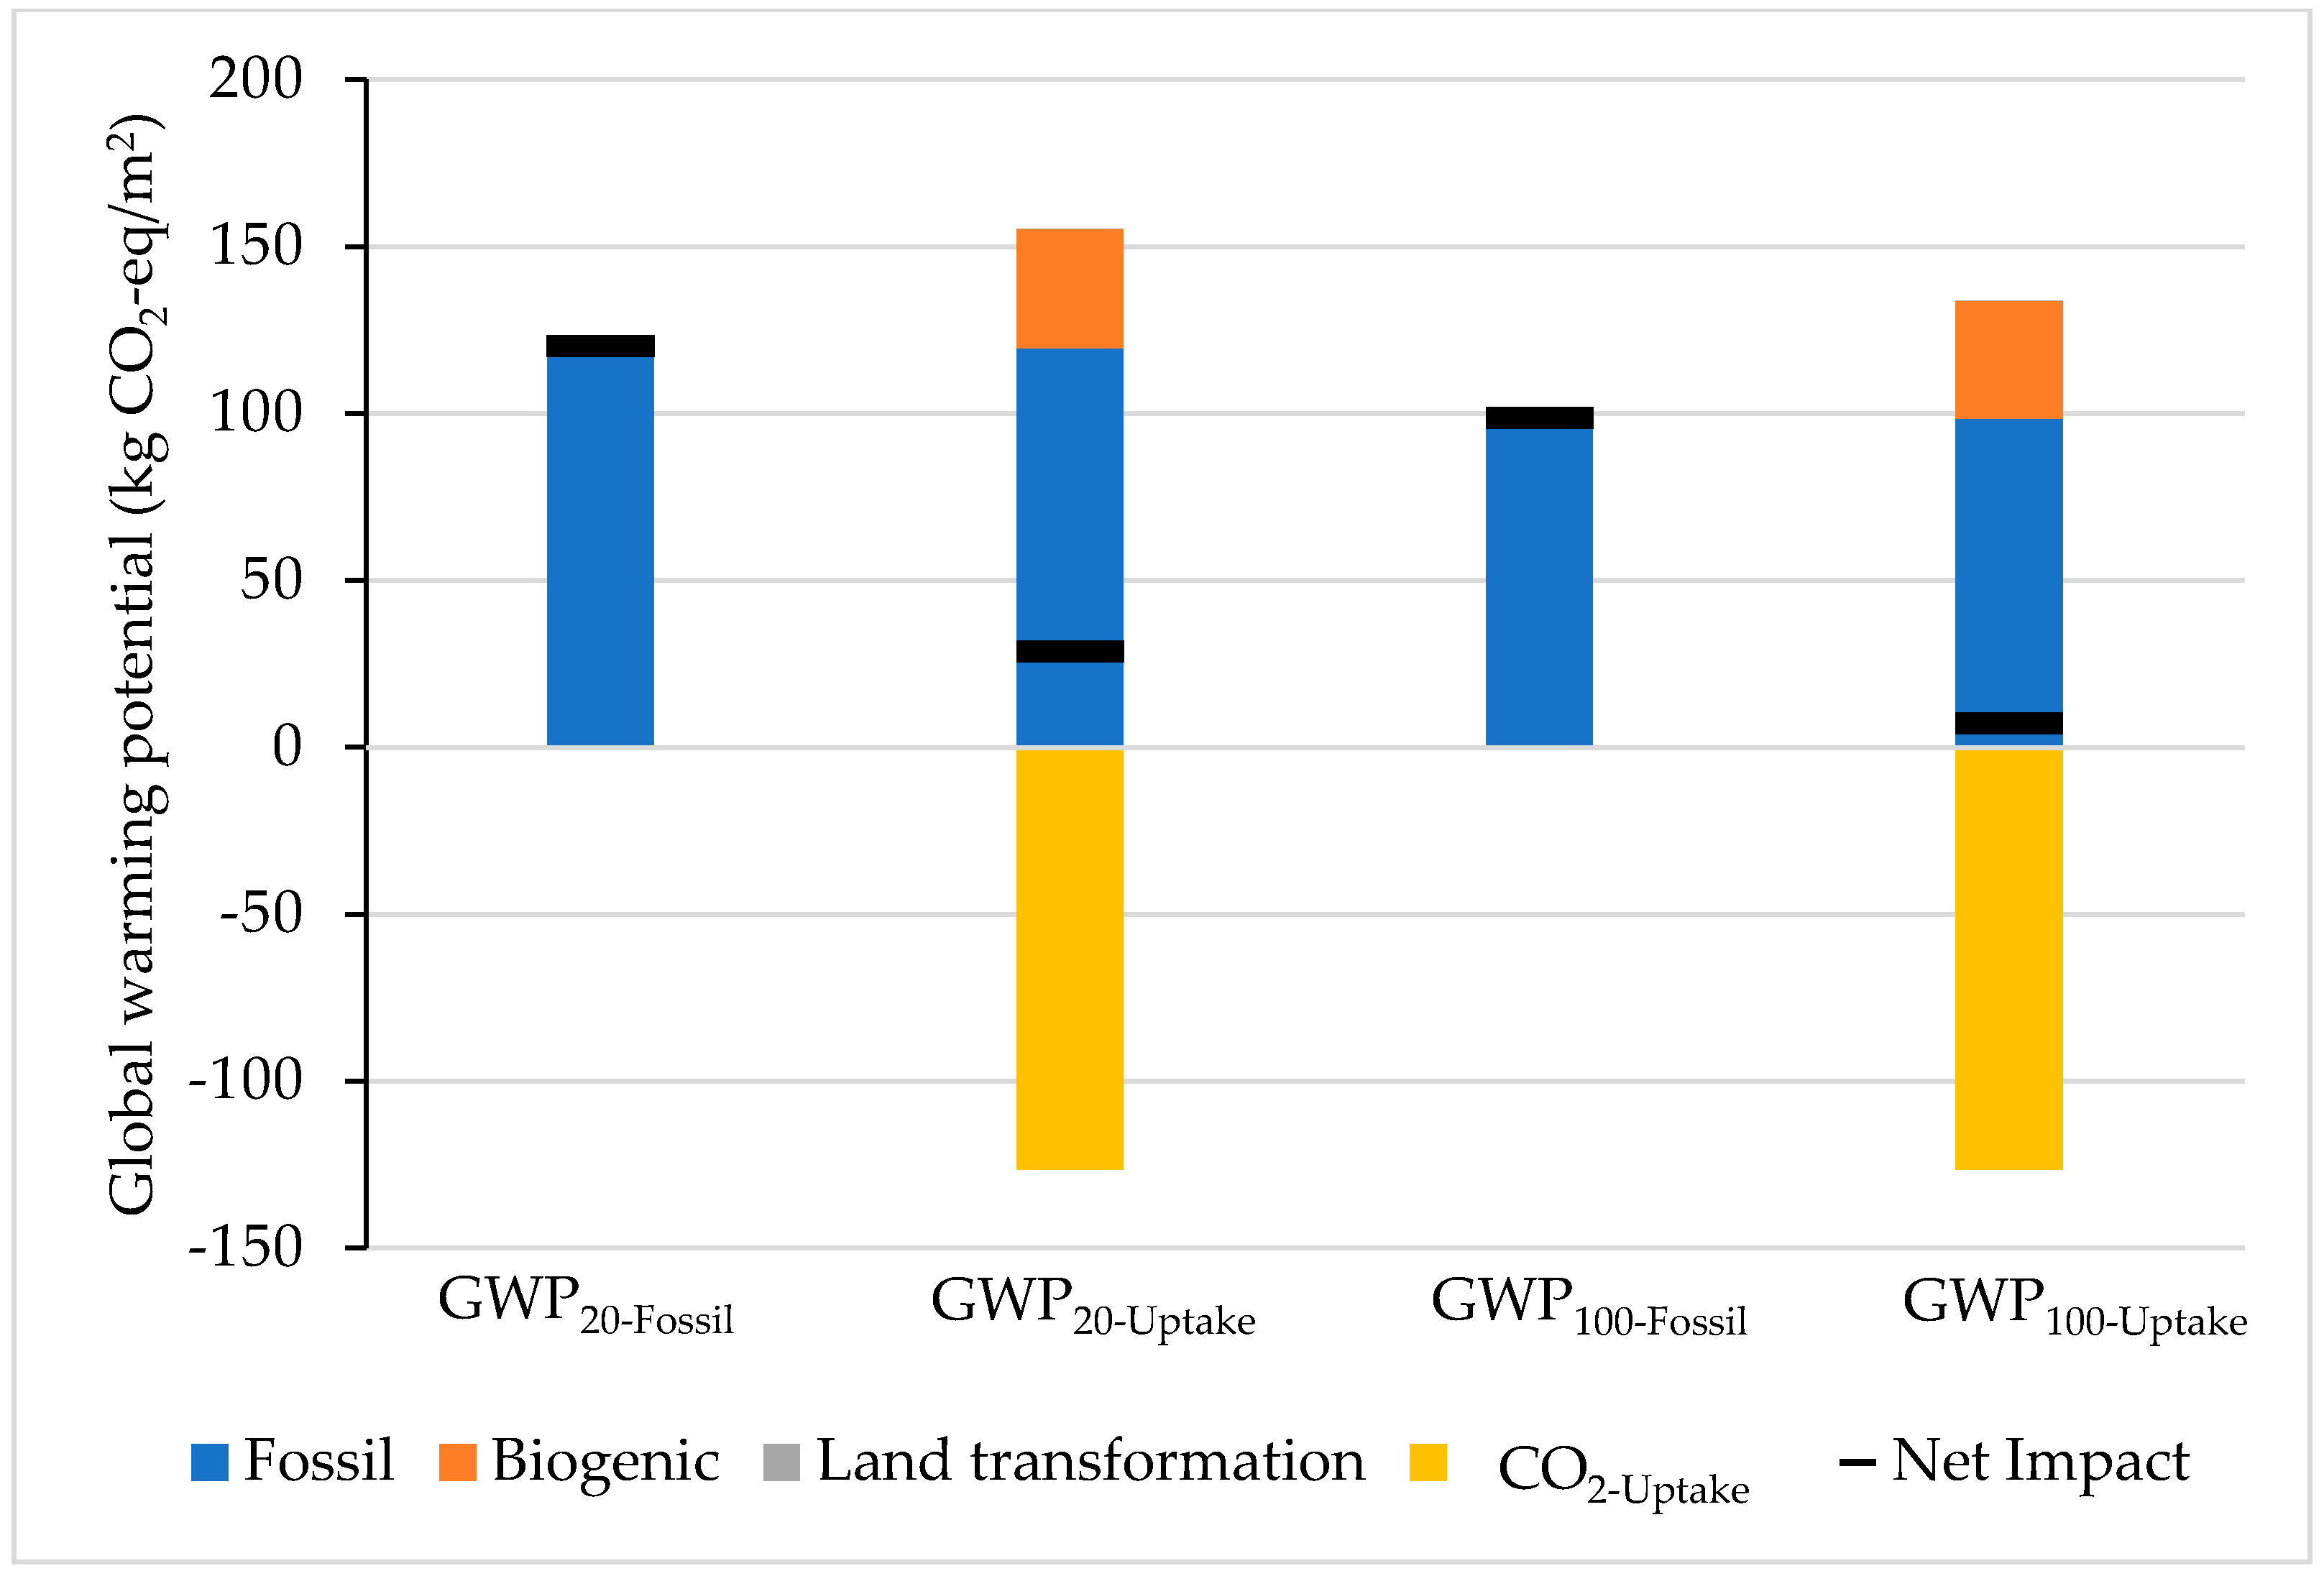
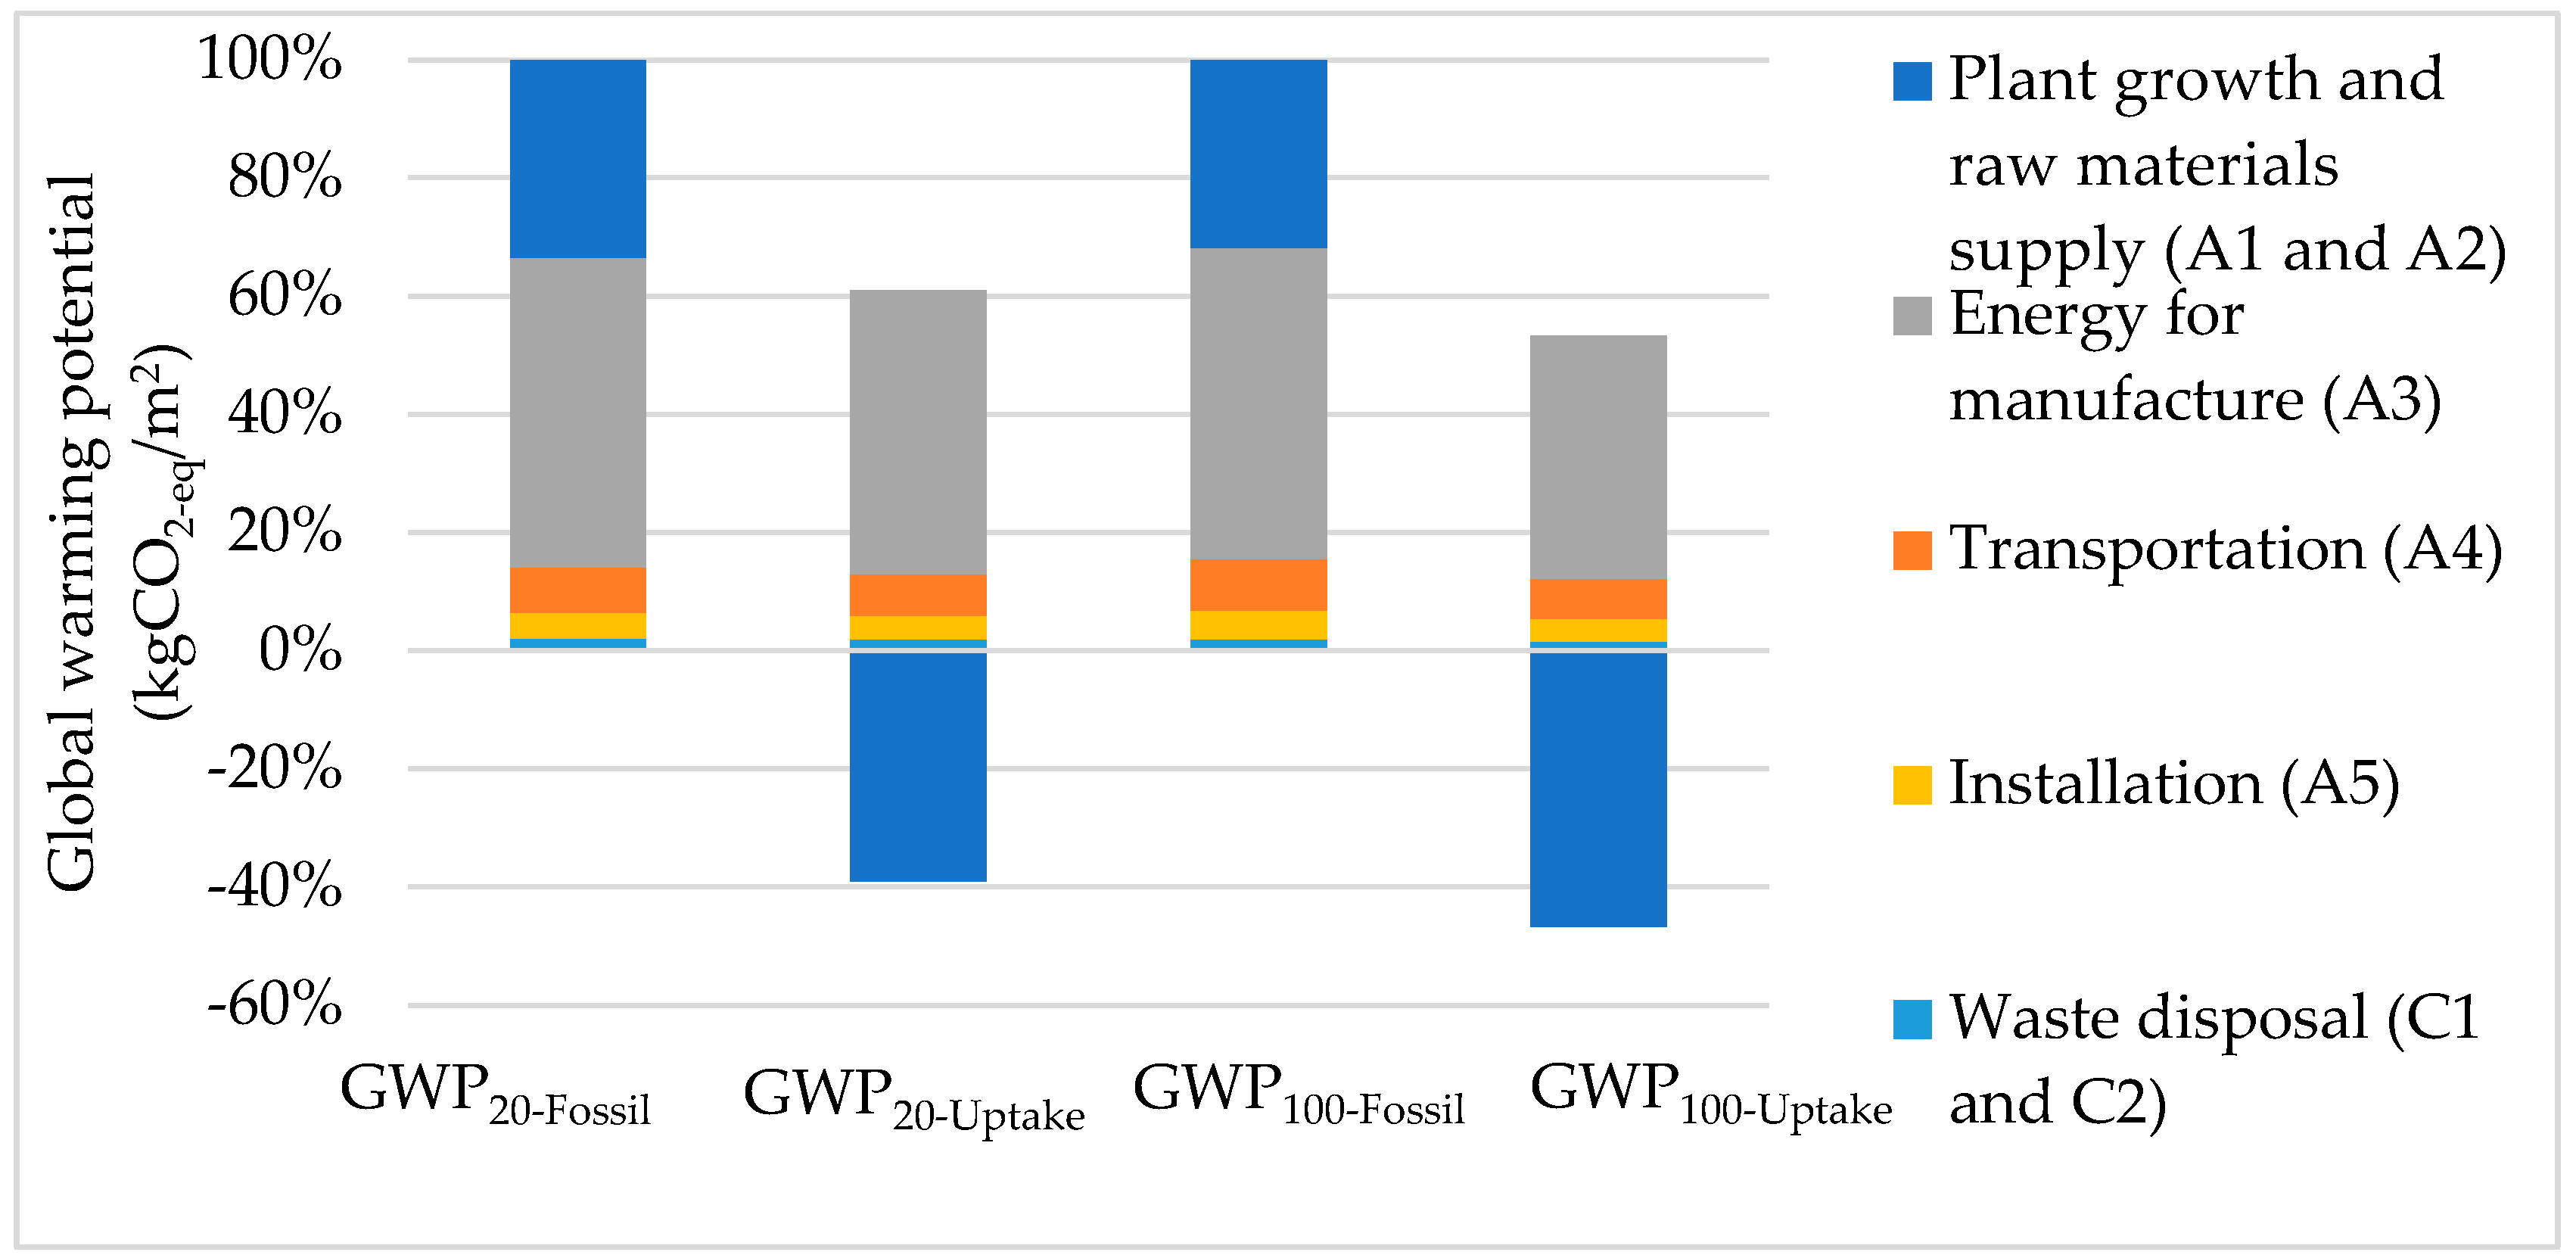
The estimated net impact GWPFossil of the installed panel is considerably higher than the GWPUptake for both short-term (20 years) and long-term (100 years) time horizons (Figure 5). The net GWPFossil for 20 years (GWP20-Fossil) was 120.2 kgCO2-eq/m2 and 98.7 kgCO2-eq/m2 for 100 years (GWP100-Fossil). The contribution from CO2 uptake was −126.5 kgCO2-eq/m2 for both GWP20-Uptake and GWP100-Uptake; as a result, the net impacts after accounting for carbon dioxide uptake were found to be 28.7 kgCO2-eq/m2 for GWP20-Uptake and 7.2 kgCO2-eq/m2 for GWP100-Uptake. The impact on land transformation was determined to be negligible for both methods and time periods, although biogenic impacts were found to be 35 kgCO2-eq/m2 for the uptake methods (GWP20-Uptake and GWP100-Uptake) (Figure 5).
The siding material contributed most (34%) to GWPFossil for both the 20- and 100-year time horizons, then three-ply CLT (24%), followed by strapping material (17%), wood fiber (10%), and vapor barrier (8%). The panel installation (5%), waste disposal processes (2%), and the membrane sheet (0.1%) had a lower contribution to the GWPFossil. The impact of wood fiber and installation increased by 1% from GWP20-Fossil to GWP100-Fossil, whereas there was a 1% decline for the vapor barrier (Table S8). But, the net impact of the panel was considerably reduced when the CO2-uptake was accounted for explicitly (Figure 6). For 20 years, the net impact decreased from 120.2 to 28.7 kgCO2-eq/m2 (303%), and for 100 years, it decreased from 98.7 to 7.2 kgCO2-eq/m2. This is because the carbon absorbed by the three-ply CLT and STEICO wood fiber, which are biobased materials, outweighs the fossil and biogenic carbon emitted by the panel. When CO2 uptake (−89.4 kgCO2-eq/m2) was considered, the net impacts of three-ply CLT in the short term and long term dropped from 28.7 to −27.8 kgCO2-eq/m2 and 23.9 to −32.7 kgCO2-eq/m2, respectively. Similarly, after accounting for CO2 uptake (−22.9 kgCO2-eq/m2), the net impacts of wood fiber during these periods also dropped from 11.9 to −10.8 kgCO2-eq/m2 and from 10.6 to −12.1 kgCO2-eq/m2, respectively. Even though strapping and siding were also made with biobased materials, the CO2 emissions from both biogenic sources and fossil fuels outweighed their CO2 uptake, resulting in net positive carbon impacts. Time and CO2 uptake had no effects on the net impacts of the membrane sheet and vapor barrier as well as installation and waste disposal processes (Table S9).
The production phase (A1-A3) was found to have the highest (84–86%) contribution to fossil fuel carbon emissions (GWPFossil), followed by construction (12–14%), and EOL (2%). The energy used for producing the panel’s materials (A3) contributed 52–53% of the total emission consumed during production, followed by transportation (A4), and installation (A5), which accounted for 8–9% and 4–5%, respectively. The net impacts in the short term and long term for all phases aside from production were slightly changed, even after accounting for CO2 uptake (GWPUptake). The CO2 uptake during the growth of the plant (A1) offsets the carbon emissions from raw materials supply (A2) and manufacturing energy use (A3) in the production phase, balancing net fossil fuel carbon emissions in both the short and long term (Figure 7). Therefore, the production phase had a net negative impact on the GWP100-Uptake, while slightly positively impacting the GWP20-Uptake.

3.2. Other Impact Categories Results

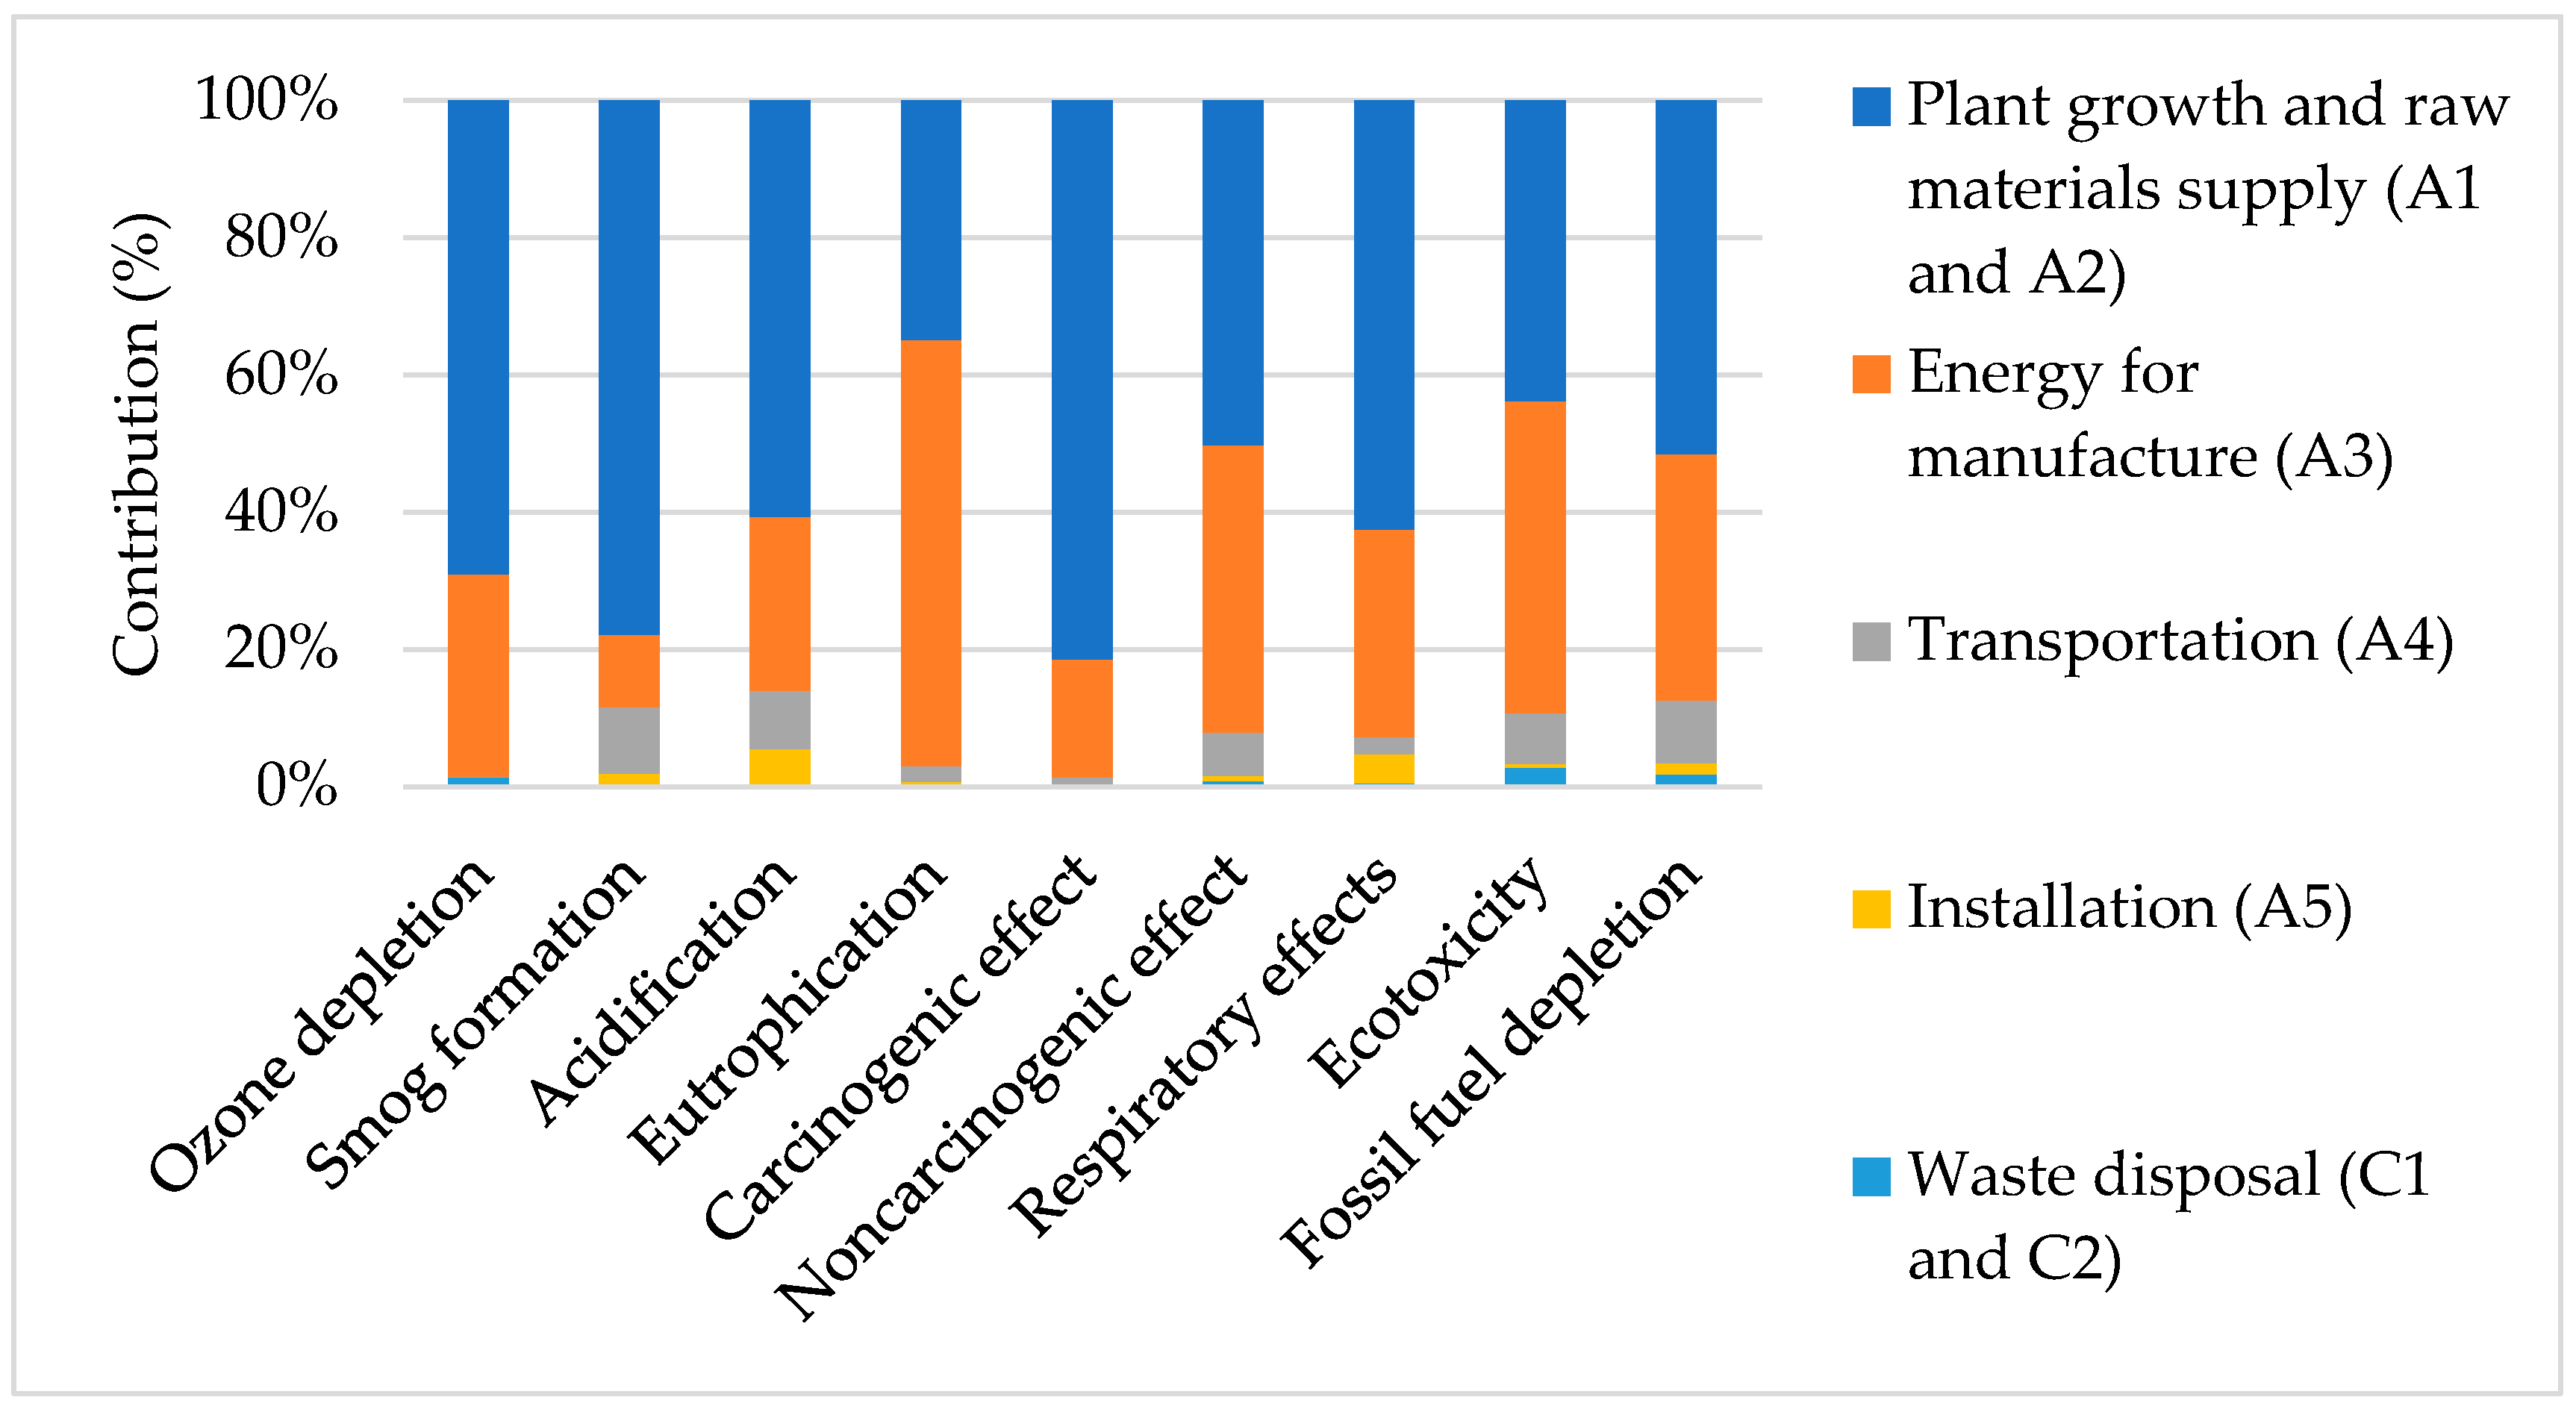
Siding material, which contributed 6–64% across each of the impact categories, followed by three-ply CLT, which contributed 16–77% were the greatest contributors (Table 2). Smog formation (64%), acidification (56%) and eutrophication (55%) were found to have the most impacts for siding materials while carcinogenics (77%), ozone depletion (73%) as well as respiratory impacts (50%) were shown to be the greatest impacts by 3-ply CLT. Additionally, the impacts of the cladding material ranged from 2–24%, with wood fiber and vapor barrier having less than 9%, installation, and waste disposal having less than 5% across all impact categories. Membrane sheets had very little or no contribution (0.002%–0.008%) across all impact categories.
In terms of phases, the plant growth (A1) and raw materials supply (A2) contributed to 35–78% across all impact categories, which makes it the greatest contributor (Figure 8 and Figure S7). The only exception is eutrophication where energy used for manufacturing the panel’s materials (A3) contributed to 62% of the total impact.

3.3. Uncertainty Analysis

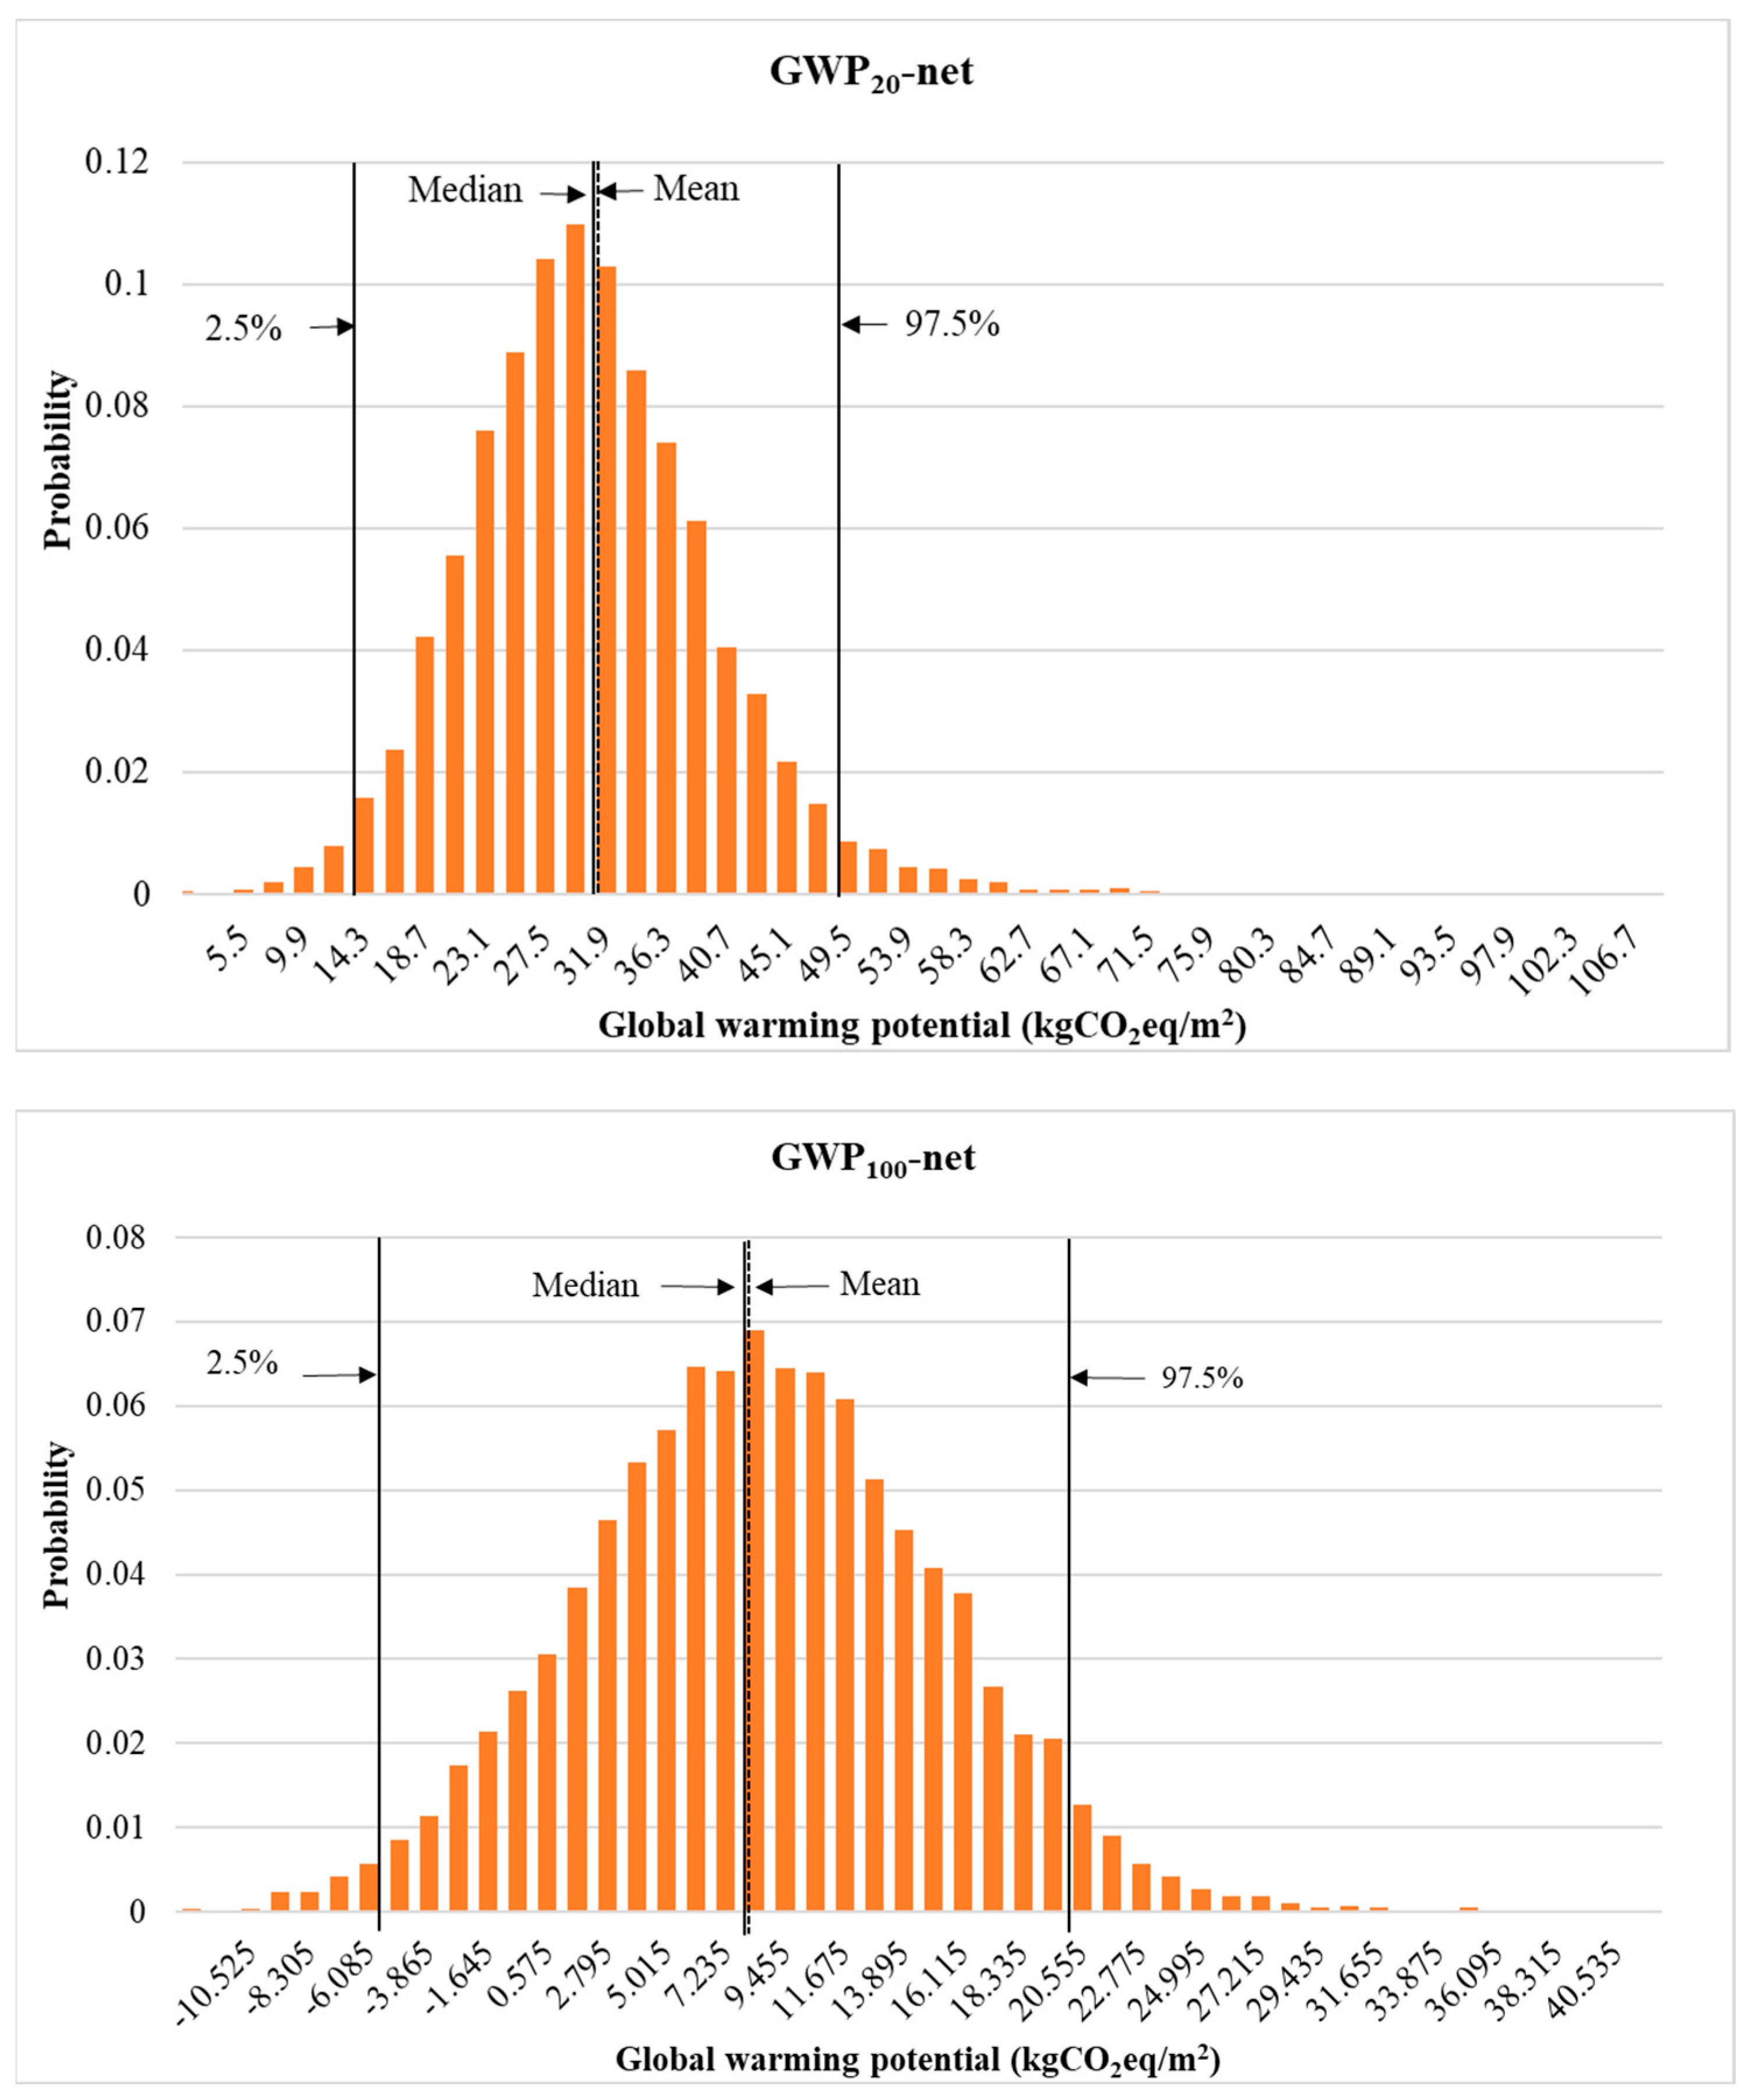
The short-term net GWP impact of the panel has a distribution that is slightly skewed positive (30.8 ± 9.3) and ranges from 3.3 to 108.2 kgCO2-eq/m2 (Figure 9). The long-term net impact, on the other hand, has a mean value of 8.6 ± 6.9 kgCO2-eq/m2, ranging from −11.6 to 41.6 kgCO2-eq/m2, respectively. The calculated range of uncertainty values shows that in 95% of circumstances, the derived results lie between the range in terms of the ratio between the 2.5th and 97.5th percentiles (Figure 9, Table S10).
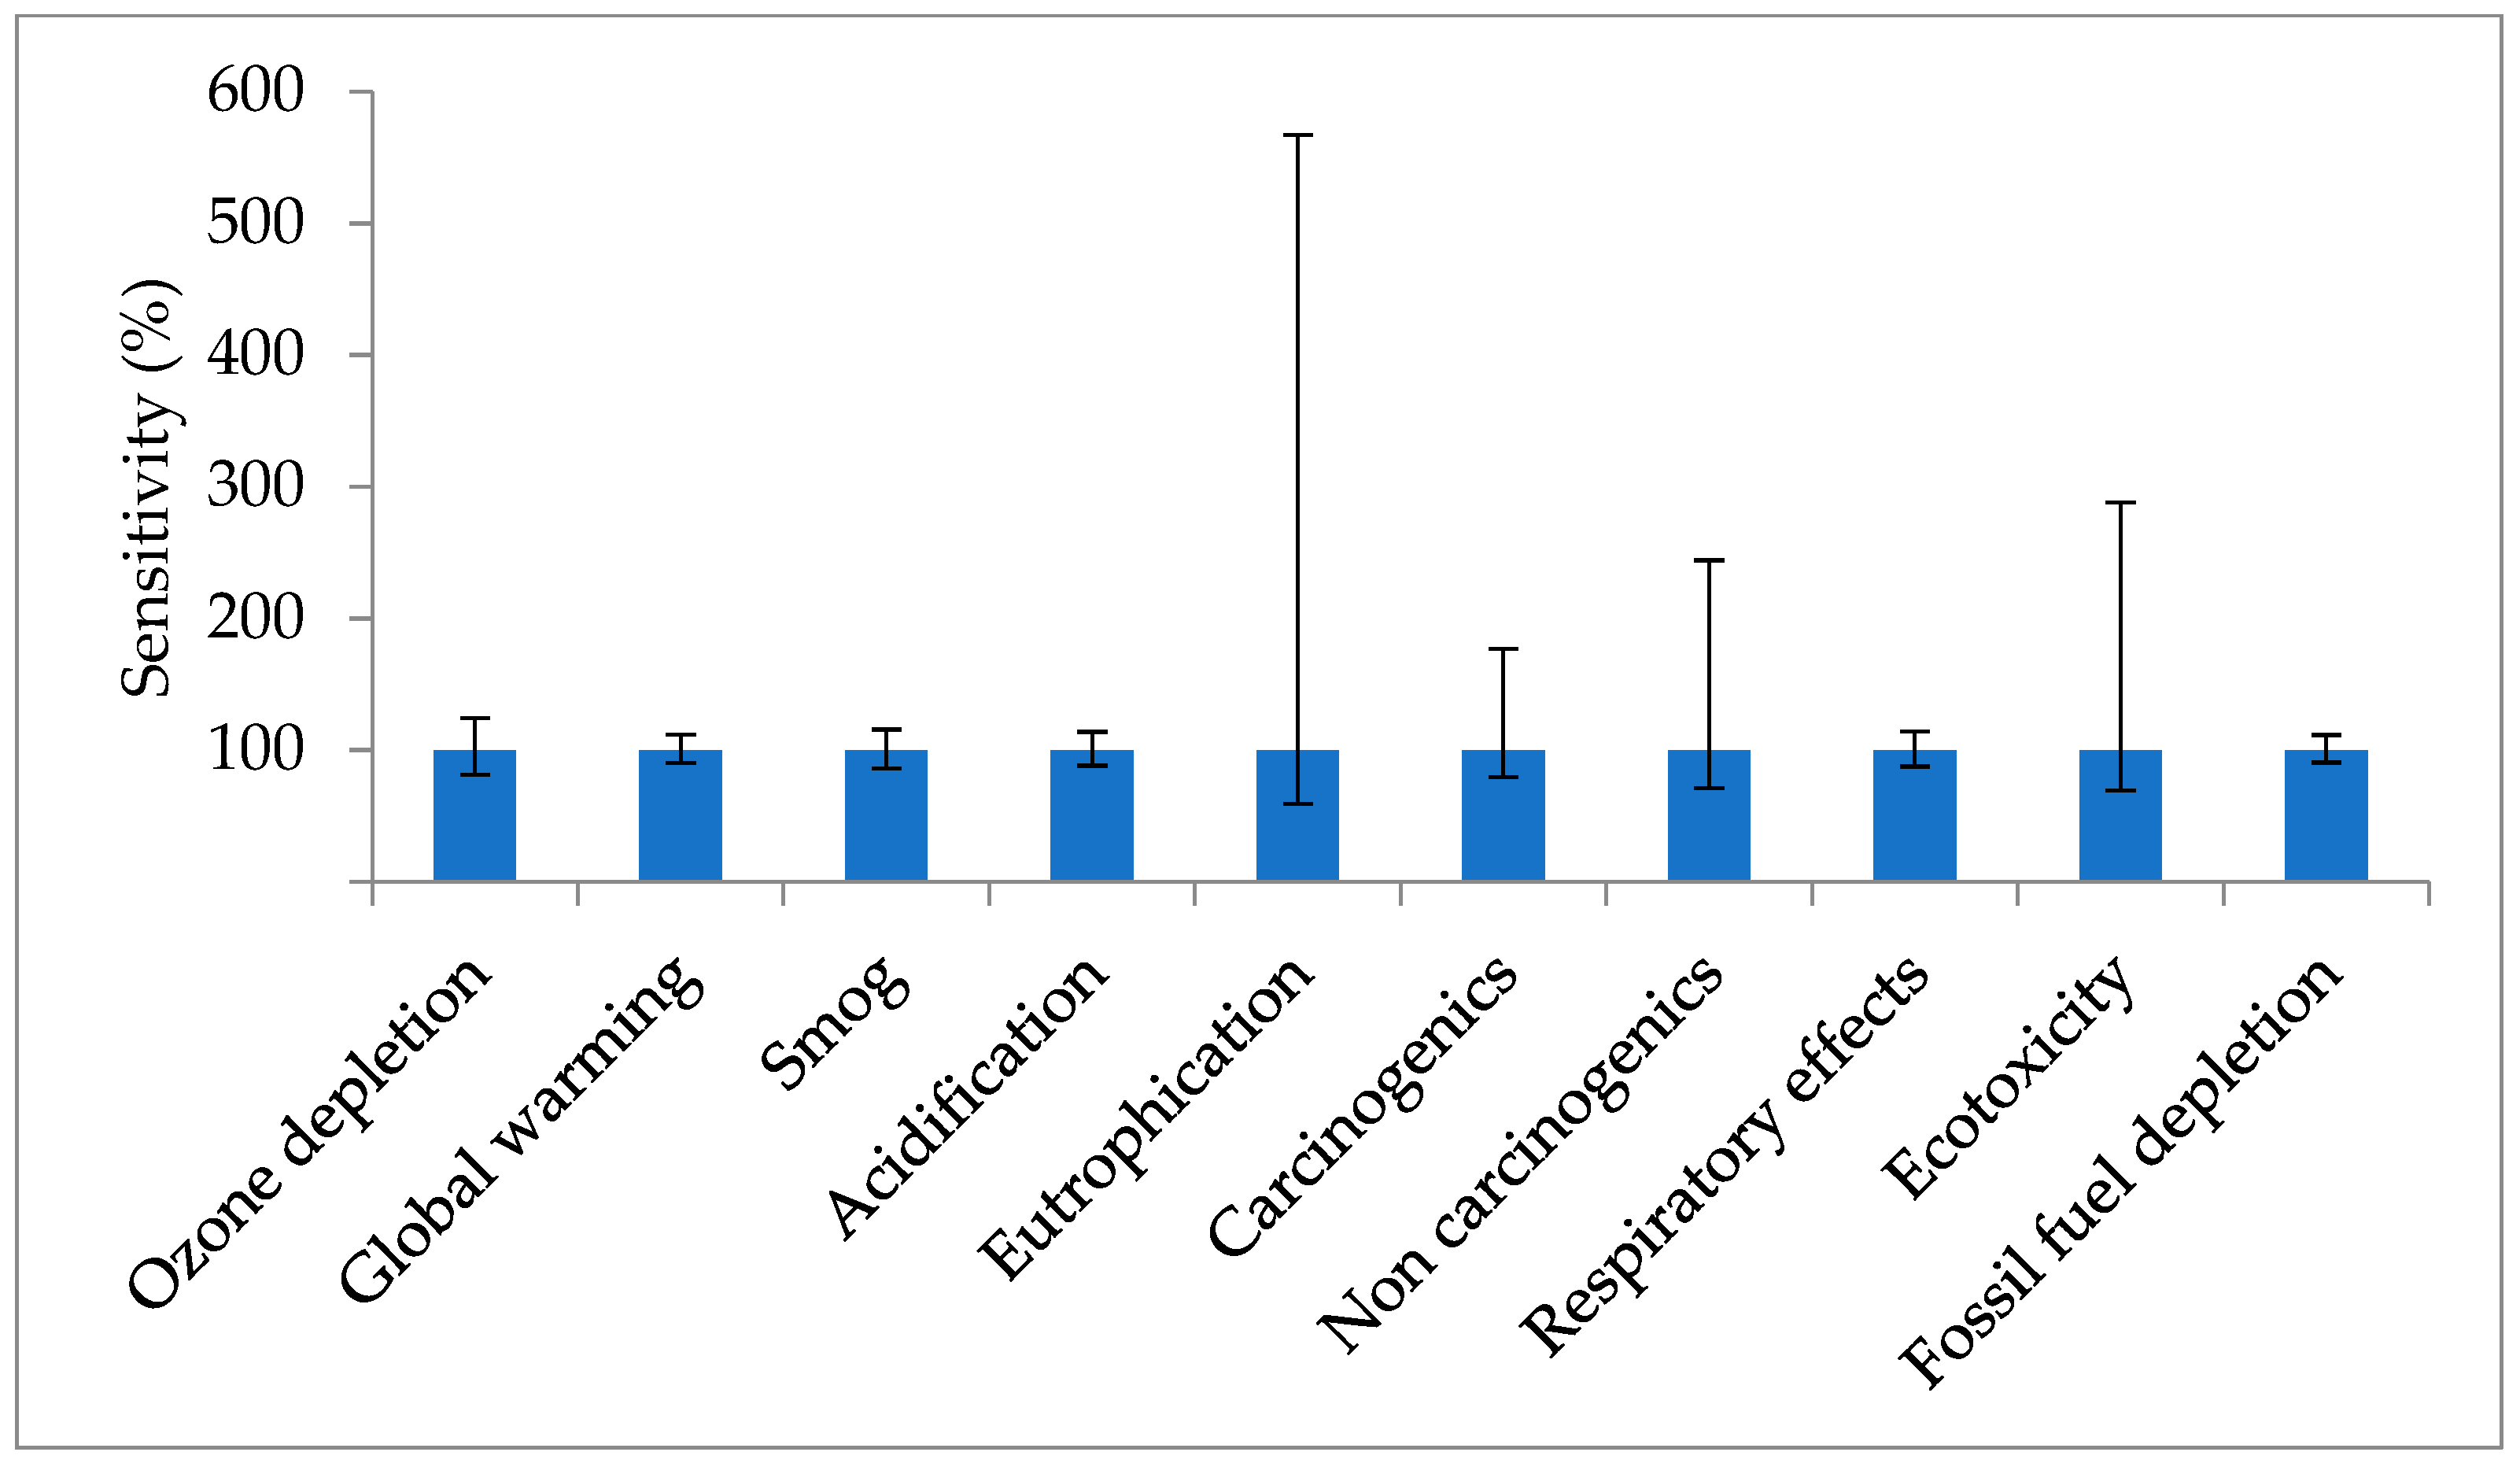
The results of the normalized indicators demonstrate that a 20% change in the inputs resulted in a large degree of sensitivity being introduced into the eutrophication, ecotoxicology, and human non-carcinogenic impacts. Other impact indicators, on the other hand, have smaller variance (Figure 10).

4. Discussion

The GWP timeframe and taking CO2 uptake into account in the assessment both had an influence on the panel’s impact. Over the course of its service life, we found a difference between the net impacts in the short and long term. Due to the CO2 uptake by the biobased materials in the panel, the net effects in the short and long term were both reduced by 75% and 92%, respectively. The impacts of fossil emission (GWPFossil) were offset by the uptake of CO2 during plant growth (A1) and the supply of raw materials (A2), causing the net impact in this production phase to decrease by 224% in 20 years and by 284% for the 100 years, but it had no effect on the net impact for other phases. When CO2 uptake and biogenic emissions (GWPUptake) are considered, the impact decreases from 7 to 21% from 20 to 100 years, with waste disposal (C1 and C2) having the highest net impact reduction (21%), followed by energy used for material manufacturing (A4), plant growth (A1), and raw material supply (A2) (16%). Our estimated long-term fossil impact (GWP100-Fossil) was 45%, 143%, and 190% greater than Mouton et al. [55], Marcea and Lau [131], and Lechon et al.’s results [132], but 38%, 49%, 50%, and 70% lower than CWC [51], Liang et al. [52], Penaloza et al. [133] and Pierobon et al.’s results [97]. Our result of the net impact of the panel was 92% and 94% lower than Gustavsson et al. [134] and Robertson et al.’s results [54], but it was 44% higher than Penaloza et al.’s results [133] (Table 3).
The amount of carbon offset was driven by the mass of wood materials used in the panel [135]. We noticed a comparatively higher mass of three-ply CLT used in panels than STEICO wood fiber resulted in a higher contribution to carbon offset. Similarly, small portions of wood products used in strapping and LP siding materials could not subside their emissions from other fossil-derived emissions [136]. However, the contribution may vary with wood type, region, and building lifetime [137]. Further, we found comparatively lower impacts in both GWP20-Uptake and GWP100-Uptake scenarios [62] due to the comparatively higher decay rate in GWPUptake as it takes into account carbon sinks of ocean and atmospheric systems as well as the re-establishment and regrowth of harvested stands [138].
Our GWP100-Fossil impact for three-ply CLT (23.87 kgCO2-eq/m2) was comparatively lower than that of a similar study (96.71 kgCO2-eq/m2) [84]. Lumber production in three-ply CLT contributed more than half in the GWP100-Fossil impact category (11.9 kgCO2-eq/m2), which is lower than Chen et al.’s [63] reported value (58.94 kgCO2-eq/m2). This variation was due to various factors, including wood density, wood moisture content, electricity mix, and type of energy used for drying [139]. In addition, the EoL disposal of the used panel is another important factor because the impact is higher in year 1 from biobased materials, particularly for CH4 emissions, and then gradually decreases over time. A larger proportion of their finished products are accounted for as deemed off specification and thus sent to landfills as opposed to being reused or recycled [140]. Biobased products such as three-ply CLT and siding material have similar emissions profiles that show higher initial post-demolition emissions. Hence, the degree of the postponement of EoL emissions is highly dependent upon the wood product types and building life span parameters [141].
In addition to GWP, we found this panel to have a substantial impact on ecotoxicology and fossil fuel depletion. In this case, siding material was found to be the greatest contributor followed by three-ply CLT, strapping material, STEICO wood fiber, and vapor barriers. We found the impact on these categories was driven by adhesives and resins, electricity use, lumber production, and transportation processes. Petroleum-derived materials [142], fuels [143], and coal and natural gas use in electricity mixes [144,145] emit volatile formaldehyde that causes toxicity. This panel used melamine, methylene, polyvinyl, and phenolic resins in manufacturing and diesel for transportation which led to a substantial impact on ecotoxicity and fossil fuel depletion. However, the impact may vary with the type and mass of the resins used in manufacturing processes. For example, we quantified GWP impacts (<5.1 kgCO2-eq/m2) for polyurethane and phenolic mixed resins, which were lower than formaldehyde resins (29.38 kgCO2-eq/m2), as determined by Chen et al. [63]. Phenolic or polyurethane resins are needed in lower amounts than other conventional formaldehydes, resulting in reduced human health impacts [135]. Moreover, products that used a higher proportion of coal in electricity generation (e.g., LP siding 51.1%; vapor barrier 32.1%) caused a substantial impact on these categories. Therefore, the careful selection of suppliers of materials based on their energy mix could help reduce the embodied impacts of the panel.
Eutrophication is mostly caused by the release of nitrogen and phosphorus compounds from the use of fossil fuels in transportation systems and thermal power production. During the processes of mining, extraction, transportation, and burning, coal and natural gas emit PO43− and NOx, which dissolve in freshwater and lead to eutrophication [146,147,148]. We found the products including membrane sheets, cladding, and siding materials contributed 75%–98% of eutrophication because a larger percentage (51% to 85%) of fossil fuels were used in the power mix. Furthermore, we observed that zinc (9%), polyvinyl resin (34%), ammonium chloride (20%), and wax (19%) also contributed to eutrophication and increased the variability in the uncertainty analysis.
Meanwhile, time horizon has a considerable impact on the GWP [141,149]. We found a comparatively lower net impact in GWP100-Fossil than GWP20-Fossil scenarios. Over longer time periods, more carbon is sunk by ocean atmosphere interactions, which explains the higher decay rate for GWP100-Uptake. The impact was reduced with time since a longer period of time allows more CO2 to sink via ocean–atmosphere interactions than shorter times [138]. Moreover, it allows biomass a longer time to grow and re-establish, which also enhances the biomass-derived CO2 decay rate, and can even bring negative GWP [150,151,152]. This clearly shows that biobased materials act as carbon storage that causes delays in biogenic carbon emissions to the technosphere. As a result, it can be beneficial to avoid any amount in the short term to reduce any irreparable changes in dynamic climates that may hit a tipping point [105,153]. This postponement also decreases the amount of wood disposal and increases the recycling capacity, which eventually reduces fossil-derived GHG emissions [154]. Thus, biobased building insulation could be a good substitute for fossil fuel-derived insulation and reduce GHG emissions per m2 [105].
Impacts could be also reduced by replacing other fossil-derived materials with biobased materials. For example, biobased wood adhesives (e.g., tannin, lignin, proteins) as well as non-formaldehyde resins could lower 62% of the impacts [142]. Further, the impact can be reduced by 15–20% by using wood with a higher density, shortening the transportation distance, improving road conditions, and using locally sourced wood [84,97]. Furthermore, wood waste can potentially be used in renewable fuel pathways such as in Bioenergy with Carbon Capture and Storage (BECCS) or can be transferred to another life cycle for an exceptionally prolonged period that will also bring down the CO2 emissions [105,155,156].
In terms of processes, our study measured higher impacts for energy use for manufacturing materials than D’Alessandro et al.’s [36], in which drying processes had a substantial contribution. Further, we observed that electricity mixed with a higher ratio of natural gas (e.g., three-ply CLT, 26%; STEICO, 11%) with other fossil fuels had comparatively lower variability in both scenarios. In the transportation process, vehicle types (i.e., single and combination units) did not appear to have any considerable variation in imposing an impact on GWP.

5. Implications

Biobased building exterior walls are made from natural materials and as such, as they require less energy and accumulate carbon during their service life, they are helpful for mitigating climate change [157]. To meet the climate and social justice goals of the Climate Act, NYS established initiatives to encourage biobased feedstocks rather than fossil-based ones. Additionally, it promotes the use of durable, long-lasting wood products, particularly as a replacement for fossil fuel-based and fossil fuel-intensive items (such steel, concrete, brick, or vinyl) in building construction to improve long-term carbon storage [158].
New York State has the oldest housing units in the USA due to the median age of its dwellings, which is 68 years. This indicates that the typical year of construction was 1958, before the state’s building code mandate in 1979. These homes contribute to 71% of air leakage rates of 10 air changes per hour at 50 pascals of pressure (ACH50), indicating a considerable amount of air leakage through the building envelope. If the heat loss through the wall is cut by 73%, 46% of the energy used for space heating and cooling may be saved, which is almost 21% of the total energy use of these homes [109].
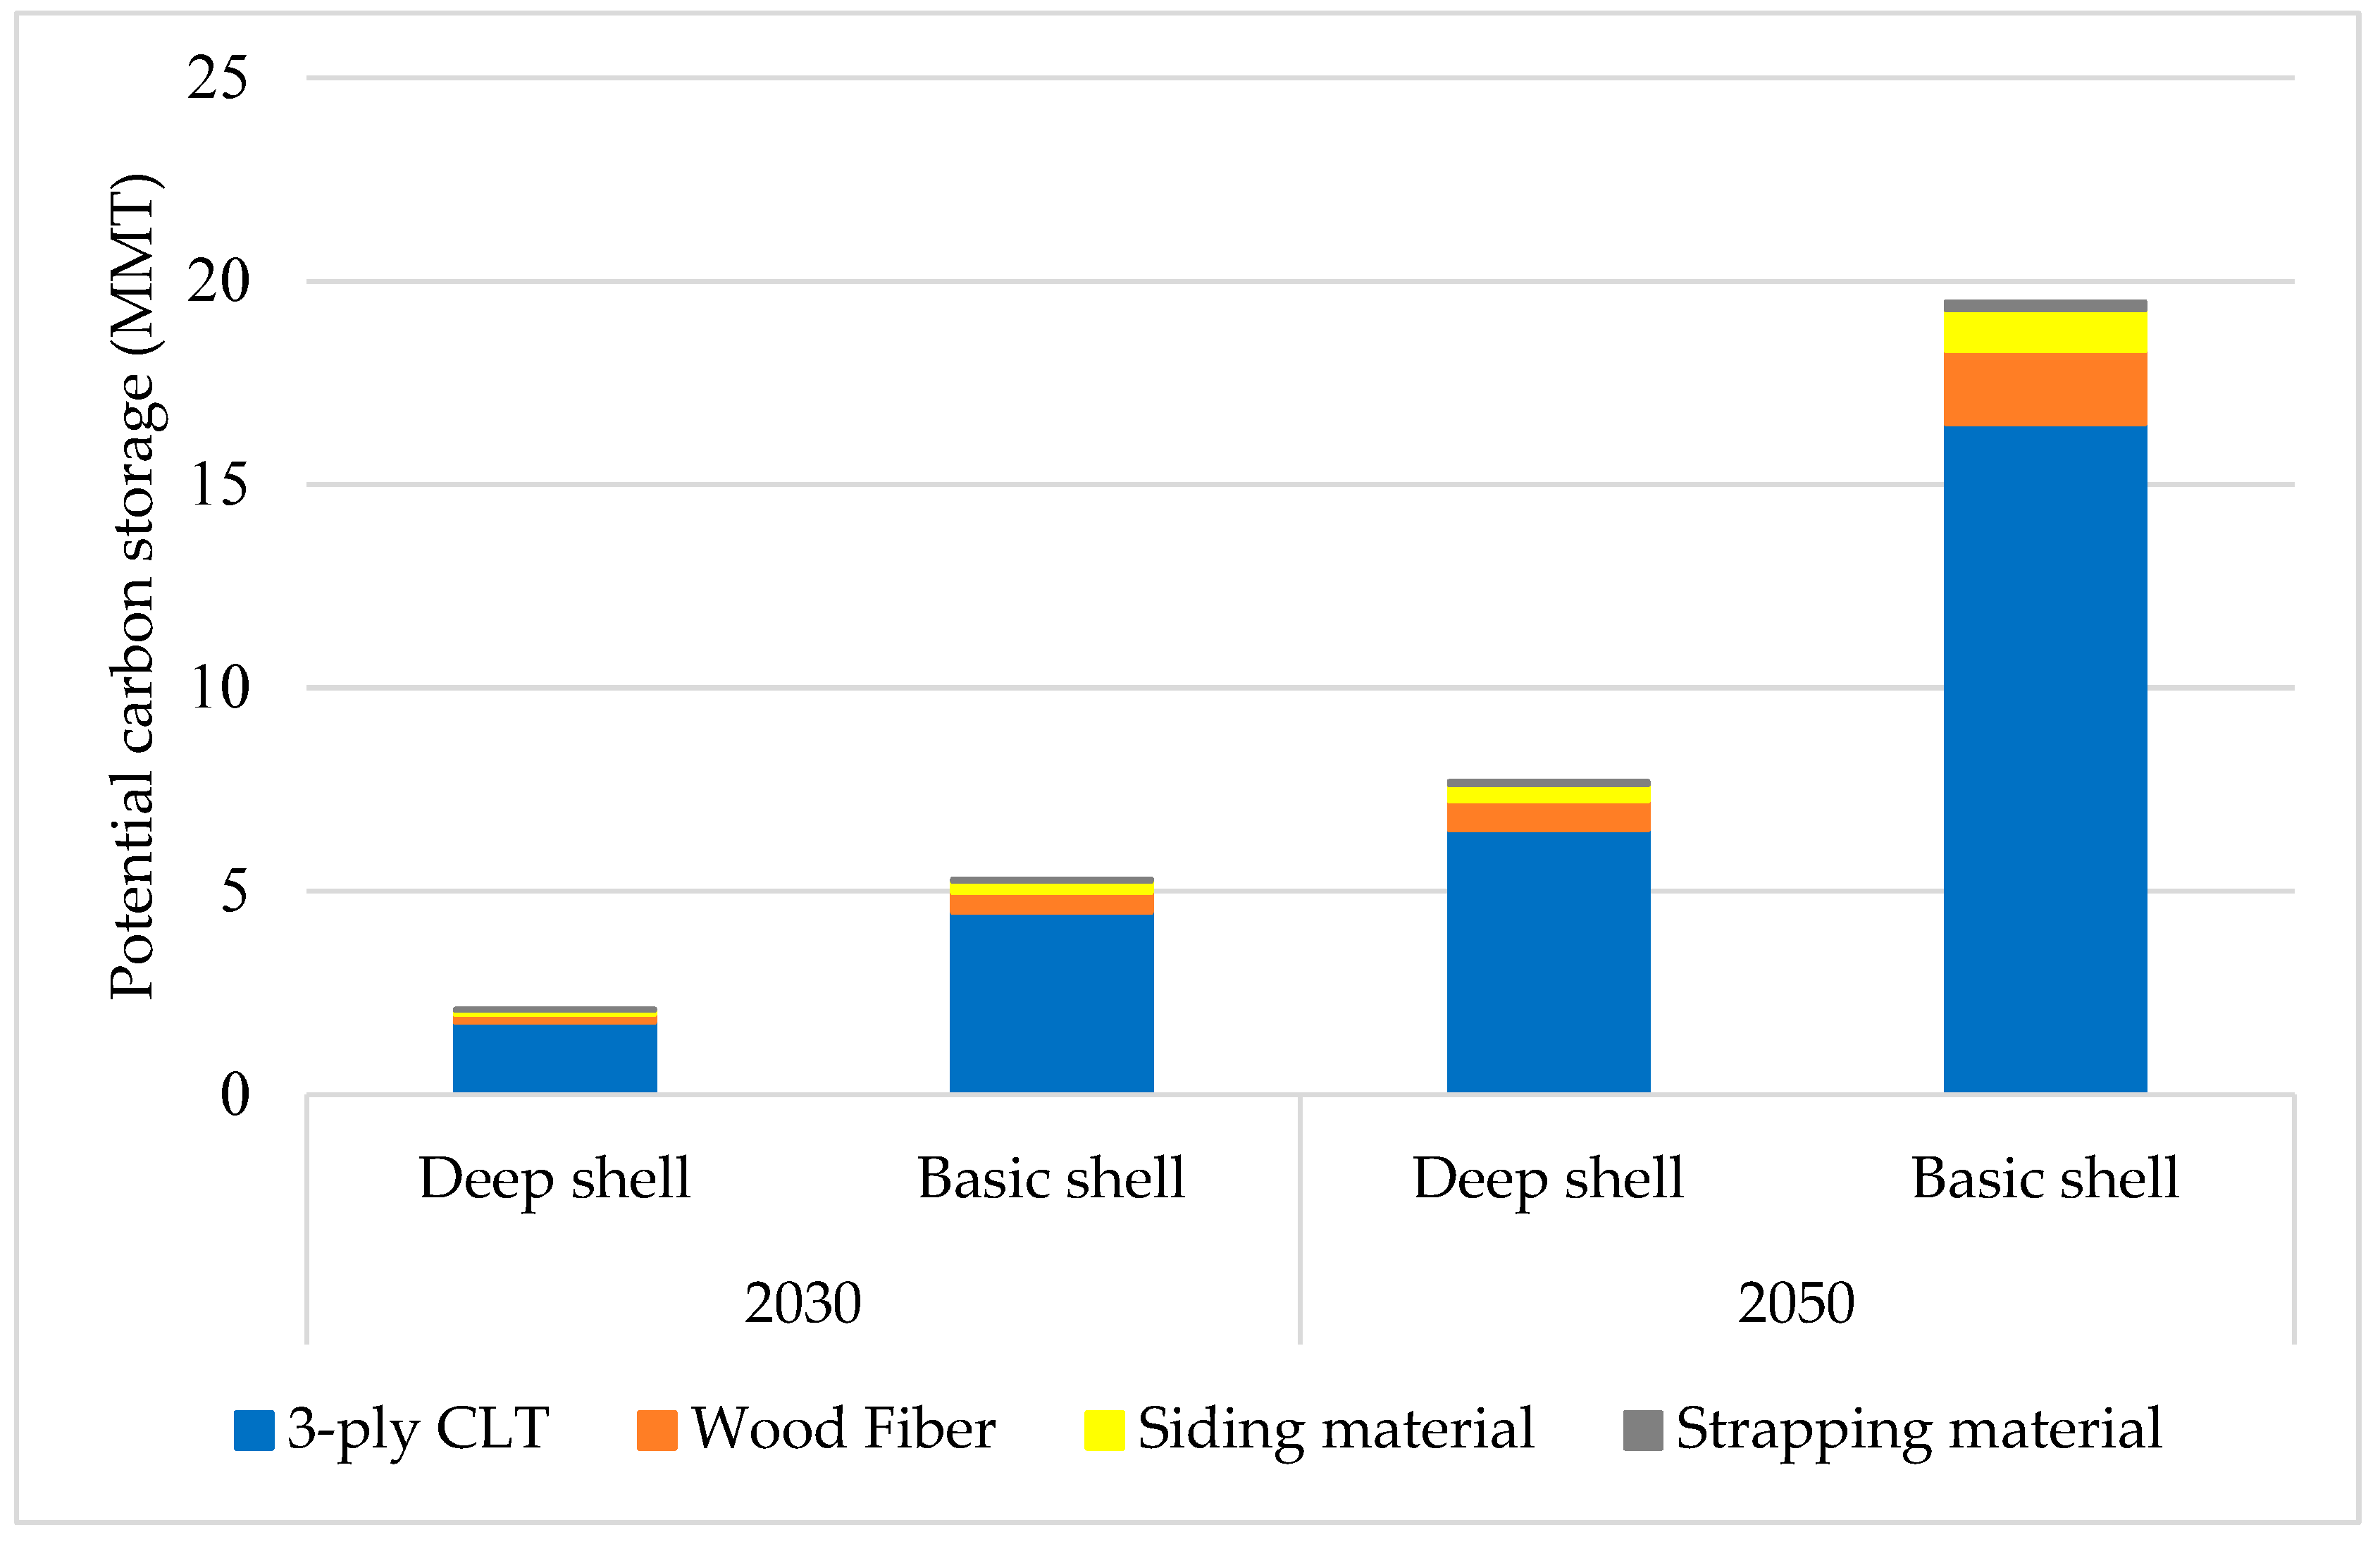
NYS has 8,278,173 dwelling units totaling 6.7 billion square feet, of which 2.96 billion square feet are exterior wall space [159,160]. The total external wall area of low-rise (1–3 story) multifamily buildings is 1.8 billion square feet, and the US multifamily sector has an annual retrofit rate of about 1% [161]. All strategic scenarios in the NYS Scoping Plan (the Strategic Use of Low-Carbon Fuels; Accelerated Transition Away from Combustion; and Beyond 85% Reduction) call for retrofitting 7% (0.21 billion square feet) of walls with deep shells to cut heating and cooling energy use by 27–44% and 14–27%, respectively, as well as 18% (0.53 billion square feet) of walls with basic shells to cut heating and cooling energy use by 57–87% by 2030. These scenarios also call for retrofitting 26% (0.77 billion square feet) of walls with deep shells and 66% (1.95 billion square feet) of walls with basic shells by 2050.
We determined that installing this biobased panel on external walls will need 7.73 MMT by 2030, and 28.40 MMT, by 2050, of wood products will be needed for walls with basic shells and deep shells. This will result in the storage of 7.40 MMT by 2030 and 27.19 MMT by 2050 of carbon, even without considering the benefits of the total energy savings from this panel installation (Figure 11). Hence, this indicates a potential to make a substantial contribution to the NYS climate target of attaining net-zero emissions by 2050.

6. Conclusions

Biobased materials offset their carbon emissions by storing carbon for the time-of-service period and beyond by avoiding their release back into the atmosphere. They contribute to the current biogenic carbon stock that contributes to the changes in atmospheric CO2 each year. Our results show that biobased materials used in the insulation panel have subsided the equivalent amount of their fossil-derived CO2 emissions.
Accounting for CO2 uptake explicitly in life cycle assessments has a substantial impact on GWP when these biogenic CO2 are not released to the atmosphere at the EoL of a product. The GWP100-Fossil was 98.7 kgCO2-eq/m2, but when carbon uptake was included, it dropped to 7.2 kgCO2-eq/m2 for GWP100-Uptake. The GWP100-Fossil was 17.8% lower than the GWP20-Fossil, but the GWP100-Uptake was 74.9% lower than the GWP20-Uptake. Moreover, it is noteworthy to mention the potential for further environmental impacts by replacing fossil-derived materials with biobased materials, lowering transportation distances and increasing the share of renewable energy sources. Since biogenic carbon will be stored for a longer time in the biobased insulation panel and gradually sink by natural processes, it could therefore be a good substitute for fossil-derived insulation panels.
This finding can be useful for authorities such as energy commissions, building authorities, and state or federal governments that are working to achieve a net-zero emissions goal by 2050 and setting limits on the embodied emissions of construction materials. Moreover, these results also can be used by energy-saving programs while ensuring thermal comfort. It also could be used by groups (e.g., the New York Climate Justice Working Group) for advocating this environment-friendly assembled insulation panel during existing building retrofitting. Further, it will also help to show how to design and manufacture biobased materials for the construction sector to achieve the zero emission goal.

Supplementary Materials

The following supporting information can be downloaded at: https://www.mdpi.com/article/10.3390/en17143406/s1, Figure S1: Process flow diagram for proprietary polymer-based vapor barrier technology; Figure S2: Process flow diagram for 3-Ply CLT Substrate panel board; Figure S3: Process flow diagram for STEICO wood fiber insulation board; Figure S4: Process flow diagram for weather barrier membrane product; Figure S5: Process flow diagram for pressure-treated SP cladding material; Figure S6: Process flow diagram for LP siding used as a siding material; Figure S7: Contribution (>5%) of energy consumption on the impact categories; Table S1: Performance characteristics of insulation materials used in exterior walls; Table S2: Environmental impacts of different types of insulation materials; Table S3: Databases Used for Life Cycle Inventory (LCI) for background processes; Table S4: Mass of products (kg) used per FU (1 m2) of building insulation during installation; Table S5: Distance in transportation; Table S6: Electricity generation mix by sources (in percent) involved with product manufacturing processes; Table S7: Sources of packaging waste; Table S8: Waste treatment scenarios (in percent) in Manlius waste management yard in 2021; Table S9: Variations in GWPFossil and GWPUptake emissions for 20- and 100-year time horizons; Table S10: Uncertainties analysis for characterized LCIA per FU (at 95% confidence interval).

Author Contributions

Conceptualization, P.C., O.T. and T.A.V.; methodology, O.T. and M.S.H.; software, O.T. and M.S.H.; validation, P.C., O.T., T.A.V. and M.S.H.; formal analysis, M.S.H. and O.T.; investigation, M.S.H. and P.C.; resources, P.C. and M.S.H.; data curation, P.C. and O.T.; writing—original draft preparation, M.S.H.; writing—review and editing, O.T., P.C. and T.A.V.; visualization, M.S.H. and O.T.; supervision, O.T. and T.A.V.; project administration, T.A.V., P.C. and O.T.; funding acquisition, T.A.V., O.T. and P.C. All authors have read and agreed to the published version of the manuscript.

Funding

This research was funded in part by the MASBio (Mid-Atlantic Biomass Consortium for Value-Added Products) project, which is supported by the Agriculture and Food Research Initiative, competitive grant no. 2020-68012-31881 and New York State Agriculture and Markets (MOU #0314-AD).

Data Availability Statement

Data are contained within the article.

Acknowledgments

This project serves as the culmination of our efforts in the Advanced Life Cycle Assessment course at SUNY ESF. We extend our gratitude to Ruth Yanai, Jenna Zukswert, David Scott Andrews, and Fate Syewoangnuan for their invaluable feedback during the Scientific Writing course. Their constructive comments and efforts significantly enhanced the organization and quality of this article.

Conflicts of Interest

The authors declare no conflicts of interest.

References

  1. IEA. Buildings; Net Zero by 2050 A Roadmap for the Global Energy Sector; International Energy Agency: Paris, France, 2021; pp. 141–149.
  2. IEA. Global Status Report for Buildings and Construction 2019; International Energy Agency and United Nations Environment Programme: Paris, France, 2019; p. 39.
  3. González-Torres, M.; Pérez-Lombard, L.; Coronel, J.F.; Maestre, I.R.; Yan, D. A Review on Buildings Energy Information: Trends, End-Uses, Fuels and Drivers. Energy Rep. 2022, 8, 626–637. [Google Scholar] [CrossRef]
  4. EIA. Monthly Energy Review; Energy Information Administration: Washington, DC, USA, 2023.
  5. EIA. U.S. Energy-Related Carbon Dioxide Emissions, 2021; Energy Information Administration: Washington, DC, USA, 2022.
  6. U.S. Energy Information Administration. Annual Energy Outlook 2022; Independent Statistics and Analysis, U.S. Energy Information Administration: Washington, DC, USA, 2022; p. 38.
  7. Najjar, M.K.; Figueiredo, K.; Hammad, A.W.A.; Tam, V.W.Y.; Evangelista, A.C.J.; Haddad, A. A Framework to Estimate Heat Energy Loss in Building Operation. J. Clean. Prod. 2019, 235, 789–800. [Google Scholar] [CrossRef]
  8. U.S. Department of Housing. American Housing Survey (AHS) in 2021; American Housing Survey (AHS); Department of Housing and Urban Development (HUD) & U.S. Census Bureau: Washington, DC, USA, 2022; p. 1.
  9. IEA. Global Energy Review 2021: Analysis and Key Findings; International Energy Agency: Paris, France, 2021; p. 36.
  10. Harris, C. Opaque Envelopes: Pathway to Building Energy Efficiency and Demand Flexibility: Key to a Low-Carbon, Sustainable Future; National Renewable Energy Lab. (NREL): Golden, CO, USA, 2021. [Google Scholar]
  11. U.S. Energy Information Administration. Annual Energy Outlook 2021 with Projection to 2050; Annual Energy Outlook; Independent Statistics & Analysis, U.S. Energy Information Administration (EIA), U.S. Department of Energy: Washington, DC, USA, 2021; p. 33.
  12. Pargana, N.; Pinheiro, M.D.; Silvestre, J.D.; De Brito, J. Comparative Environmental Life Cycle Assessment of Thermal Insulation Materials of Buildings. Energy Build. 2014, 82, 466–481. [Google Scholar] [CrossRef]
  13. Kumar, D.; Alam, M.; Zou, P.X.; Sanjayan, J.G.; Memon, R.A. Comparative Analysis of Building Insulation Material Properties and Performance. Renew. Sustain. Energy Rev. 2020, 131, 110038. [Google Scholar] [CrossRef]
  14. Zhang, C.; Xiao, F.; Wang, J. Design Optimization of Multi-Functional Building Envelope for Thermal Insulation and Exhaust Air Heat Recovery in Different Climates. J. Build. Eng. 2021, 43, 103151. [Google Scholar] [CrossRef]
  15. Blengini, G.A.; Di Carlo, T. The Changing Role of Life Cycle Phases, Subsystems and Materials in the LCA of Low Energy Buildings. Energy Build. 2010, 42, 869–880. [Google Scholar] [CrossRef]
  16. Zhao, J.R.; Zheng, R.; Tang, J.; Sun, H.J.; Wang, J. A Mini-Review on Building Insulation Materials from Perspective of Plastic Pollution: Current Issues and Natural Fibres as a Possible Solution. J. Hazard. Mater. 2022, 438, 129449. [Google Scholar] [CrossRef] [PubMed]
  17. Pescari, S.; Merea, M.; Pitroacă, A.; Vilceanu, C.-B. A Particular Case of Urban Sustainability: Comparison Study of the Efficiency of Multiple Thermal Insulations for Buildings. Sustainability 2022, 14, 16283. [Google Scholar] [CrossRef]
  18. Grazieschi, G.; Asdrubali, F.; Thomas, G. Embodied Energy and Carbon of Building Insulating Materials: A Critical Review. Clean. Environ. Syst. 2021, 2, 100032. [Google Scholar] [CrossRef]
  19. Pavel, C.C. Competitive Landscape of the EU’s Insulation Materials Industry for Energy-Efficient Buildings; European Commission, Joint Research Centre; Publications Office of the European Union: Luxembourg, 2018; p. 24. [Google Scholar]
  20. Dickson, T.; Pavía, S. Energy Performance, Environmental Impact and Cost of a Range of Insulation Materials. Renew. Sustain. Energy Rev. 2021, 140, 110752. [Google Scholar] [CrossRef]
  21. Wi, S.; Park, J.H.; Kim, Y.U.; Kim, S. Evaluation of Environmental Impact on the Formaldehyde Emission and Flame-Retardant Performance of Thermal Insulation Materials. J. Hazard. Mater. 2021, 402, 123463. [Google Scholar] [CrossRef] [PubMed]
  22. Luangcharoenrat, C.; Intrachooto, S.; Peansupap, V.; Sutthinarakorn, W. Factors Influencing Construction Waste Generation in Building Construction: Thailand’s Perspective. Sustainability 2019, 11, 3638. [Google Scholar] [CrossRef]
  23. Lawrence, M. Reducing the Environmental Impact of Construction by Using Renewable Materials. J. Renew. Mater. 2015, 3, 163–174. [Google Scholar] [CrossRef]
  24. Schulte, M.; Lewandowski, I.; Pude, R.; Wagner, M. Comparative Life Cycle Assessment of Bio-based Insulation Materials: Environmental and Economic Performances. GCB Bioenergy 2021, 13, 979–998. [Google Scholar] [CrossRef]
  25. Liu, L.; Li, H.; Lazzaretto, A.; Manente, G.; Tong, C.; Liu, Q.; Li, N. The Development History and Prospects of Biomass-Based Insulation Materials for Buildings. Renew. Sustain. Energy Rev. 2017, 69, 912–932. [Google Scholar] [CrossRef]
  26. Sherwood, J.; Clark, J.H.; Farmer, T.J.; Herrero-Davila, L.; Moity, L. Recirculation: A New Concept to Drive Innovation in Sustainable Product Design for Bio-Based Products. Molecules 2016, 22, 48. [Google Scholar] [CrossRef] [PubMed]
  27. Kymäläinen, H.-R.; Sjöberg, A.-M. Flax and Hemp Fibres as Raw Materials for Thermal Insulations. Build. Environ. 2008, 43, 1261–1269. [Google Scholar] [CrossRef]
  28. Mnasri, F.; Abahri, K.; El Ganaoui, M.; Gabsi, S. Numerical Investigation of Hygrothermal Behavior on Porous Building Materials. Int. J. Civ. Environ. Eng. 2016, 10, 789–793. [Google Scholar]
  29. El Faridy, Z.F.; Trabelsi, A.; Kuznik, F. A Picture on Bio-Based Building Materials as Thermal Insulation for Sustainable Buildings. Acad. J. Civ. Eng. 2019, 37, 634–641. [Google Scholar]
  30. Romano, A.; Bras, A.; Grammatikos, S.; Shaw, A.; Riley, M. Dynamic Behaviour of Bio-Based and Recycled Materials for Indoor Environmental Comfort. Constr. Build. Mater. 2019, 211, 730–743. [Google Scholar] [CrossRef]
  31. Asdrubali, F.; D’Alessandro, F.; Schiavoni, S. A Review of Unconventional Sustainable Building Insulation Materials. Sustain. Mater. Technol. 2015, 4, 1–17. [Google Scholar] [CrossRef]
  32. Churkina, G.; Organschi, A.; Reyer, C.P.; Ruff, A.; Vinke, K.; Liu, Z.; Reck, B.K.; Graedel, T.; Schellnhuber, H.J. Buildings as a Global Carbon Sink. Nat. Sustain. 2020, 3, 269–276. [Google Scholar] [CrossRef]
  33. Lafond, C.; Blanchet, P. Technical Performance Overview of Bio-Based Insulation Materials Compared to Expanded Polystyrene. Buildings 2020, 10, 81. [Google Scholar] [CrossRef]
  34. Cetiner, I.; Shea, A.D. Wood Waste as an Alternative Thermal Insulation for Buildings. Energy Build. 2018, 168, 374–384. [Google Scholar] [CrossRef]
  35. Aditya, L.; Mahlia, T.; Rismanchi, B.; Ng, H.; Hasan, M.; Metselaar, H.; Muraza, O.; Aditiya, H. A review on insulation materials for energy conservation in buildings. Renew. Sustain. Energy Rev. 2017, 73, 1352–1365. [Google Scholar] [CrossRef]
  36. Li, T.-T.; Chuang, Y.-C.; Huang, C.-H.; Lou, C.-W.; Lin, J.-H. Applying vermiculite and perlite fillers to sound-absorbing/thermal-insulating resilient PU foam composites. Fibers Polym. 2015, 16, 691–698. [Google Scholar] [CrossRef]
  37. Berardi, U.; Madzarevic, J. Microstructural analysis and blowing agent concentration in aged polyurethane and polyisocyanurate foams. Appl. Therm. Eng. 2020, 164, 114440. [Google Scholar] [CrossRef]
  38. Tingley, D.D.; Hathway, A.; Davison, B.; Allwood, D. The environmental impact of phenolic foam insulation boards. Proc. Inst. Civ. Eng.-Constr. Mater. 2017, 170, 91–103. [Google Scholar] [CrossRef]
  39. Yang, W.; Li, Y. Sound absorption performance of natural fibers and their composites. Sci. China Technol. Sci. 2012, 55, 2278–2283. [Google Scholar] [CrossRef]
  40. Schiavoni, S.; D’Alessandro, F.; Bianchi, F.; Asdrubali, F. Insulation materials for the building sector: A review and comparative analysis. Renew. Sustain. Energy Rev. 2016, 62, 988–1011. [Google Scholar] [CrossRef]
  41. Hill, C.; Norton, A.; Dibdiakova, J. A comparison of the environmental impacts of different categories of insulation materials. Energy Build. 2018, 162, 12–20. [Google Scholar] [CrossRef]
  42. Samar, M.; Saxena, S. Study of chemical and physical properties of perlite and its application in India. Int. J. Sci. Technol. Manag. 2016, 5, 70–80. [Google Scholar]
  43. Muthukumar, K.; Sabariraj, R.; Kumar, S.D.; Sathish, T. Investigation of thermal conductivity and thermal resistance analysis on different combination of natural fiber composites of banana, pineapple and jute. Mater. Today Proc. 2020, 21, 976–980. [Google Scholar] [CrossRef]
  44. Brzyski, P.; Barnat-Hunek, D.; Suchorab, Z.; Łagód, G. Composite materials based on hemp and flax for low-energy buildings. Materials 2017, 10, 510. [Google Scholar] [CrossRef] [PubMed]
  45. Muthuraj, R.; Lacoste, C.; Lacroix, P.; Bergeret, A. Sustainable thermal insulation biocomposites from rice husk, wheat husk, wood fibers and textile waste fibers: Elaboration and performances evaluation. Ind. Crops Prod. 2019, 135, 238–245. [Google Scholar] [CrossRef]
  46. Sierra-Pérez, J.; Boschmonart-Rives, J.; Gabarrell, X. Environmental assessment of façade-building systems and thermal insulation materials for different climatic conditions. J. Clean. Prod. 2016, 113, 102–113. [Google Scholar] [CrossRef]
  47. Gonzalez, D. Life Cycle Assessment of a Hybrid Biobased Panel for Insulated Concrete Forms Used in Residential Buildings. Master Thesis, University of Waterloo, Waterloo, ON, Canada, 2021. [Google Scholar]
  48. Ingrao, C.; Scrucca, F.; Tricase, C.; Asdrubali, F. A comparative Life Cycle Assessment of external wall-compositions for cleaner construction solutions in buildings. J. Clean. Prod. 2016, 124, 283–298. [Google Scholar] [CrossRef]
  49. Zieger, V. Dynamic life cycle assessment to compare conventional and bio-based building construction impact on global warming. Master Thesis, Aalto University, Lorient, France, 2019. [Google Scholar]
  50. Guggemos, A.A.; Horvath, A. Comparison of environmental effects of steel-and concrete-framed buildings. J. Infrastruct. Syst. 2005, 11, 93–101. [Google Scholar] [CrossRef]
  51. CWC. Comparing the Environmental Effects of Building Systems: A Case Study; Canadian Wood Council (CWC): Ottawa, ON, Canada, 1997; pp. 1–11. [Google Scholar]
  52. Liang, S.; Gu, H.; Bergman, R.; Kelley, S.S. Comparative Life-Cycle Assessment of a Mass Timber Building and Concrete Alternative. Wood Fiber Sci. 2020, 52, 217–229. [Google Scholar] [CrossRef]
  53. Krogmann, U.; Minderman, N.; Senick, J.; Andrews, C. Life-Cycle Assessment of New Jersey Meadowlands Commission Center for Environmental and Scientific Education Building; Rutgers Center for Green Building: New Brunswick, NJ, USA, 2008. [Google Scholar]
  54. Robertson, A.B.; Lam, F.C.F.; Cole, R.J. A Comparative Cradle-to-Gate Life Cycle Assessment of Mid-Rise Office Building Construction Alternatives: Laminated Timber or Reinforced Concrete. Buildings 2012, 2, 245–270. [Google Scholar] [CrossRef]
  55. Mouton, L.; Allacker, K.; Röck, M. Bio-Based Building Material Solutions for Environmental Benefits over Conventional Construction Products—Life Cycle Assessment of Regenerative Design Strategies (1/2). Energy Build. 2023, 282, 112767. [Google Scholar] [CrossRef]
  56. Thomson, A.; Walker, P. Durability Characteristics of Straw Bales in Building Envelopes. Constr. Build. Mater. 2014, 68, 135–141. [Google Scholar] [CrossRef]
  57. D’Alessandro, F.; Bianchi, F.; Baldinelli, G.; Rotili, A.; Schiavoni, S. Straw Bale Constructions: Laboratory, in Field and Numerical Assessment of Energy and Environmental Performance. J. Build. Eng. 2017, 11, 56–68. [Google Scholar] [CrossRef]
  58. Sassoni, E.; Manzi, S.; Motori, A.; Montecchi, M.; Canti, M. Experimental Study on the Physical–Mechanical Durability of Innovative Hemp-Based Composites for the Building Industry. Energy Build. 2015, 104, 316–322. [Google Scholar] [CrossRef]
  59. El Hajj, N.; Mboumba-Mamboundou, B.; Dheilly, R.-M.; Aboura, Z.; Benzeggagh, M.; Queneudec, M. Development of Thermal Insulating and Sound Absorbing Agro-Sourced Materials from Auto Linked Flax-Tows. Ind. Crop. Prod. 2011, 34, 921–928. [Google Scholar] [CrossRef]
  60. Zhou, X.; Zheng, F.; Li, H.; Lu, C. An Environment-Friendly Thermal Insulation Material from Cotton Stalk Fibers. Energy Build. 2010, 42, 1070–1074. [Google Scholar] [CrossRef]
  61. da Rosa, L.C.; Santor, C.G.; Lovato, A.; da Rosa, C.S.; Güths, S. Use of Rice Husk and Sunflower Stalk as a Substitute for Glass Wool in Thermal Insulation of Solar Collector. J. Clean. Prod. 2015, 104, 90–97. [Google Scholar] [CrossRef]
  62. Huang, P.; Zeidler, A.; Chang, W.; Ansell, M.P.; Chew, Y.J.; Shea, A. Specific Heat Capacity Measurement of Phyllostachys Edulis (Moso Bamboo) by Differential Scanning Calorimetry. Constr. Build. Mater. 2016, 125, 821–831. [Google Scholar] [CrossRef]
  63. Pongon, R.S.; Aranico, E.C.; Dagoc, F.L.S.; Amparado, R.F., Jr. Carbon Stock Assessment of Bamboo Plantations in Northern Mindanao, Philippines. J. Biodivers. Environ. Sci. 2016, 9, 97–112. [Google Scholar]
  64. Binici, H.; Eken, M.; Kara, M.; Dolaz, M. An Environment-Friendly Thermal Insulation Material from Sunflower Stalk, Textile Waste and Stubble Fibers. In Proceedings of the 2013 International Conference on Renewable Energy Research and Applications (ICRERA), Madrid, Spain, 20–23 October 2013; pp. 833–846. [Google Scholar]
  65. Pinto, J.; Paiva, A.; Varum, H.; Costa, A.; Cruz, D.; Pereira, S.; Fernandes, L.; Tavares, P.; Agarwal, J. Corn’s Cob as a Potential Ecological Thermal Insulation Material. Energy Build. 2011, 43, 1985–1990. [Google Scholar] [CrossRef]
  66. Charca, S.; Noel, J.; Andia, D.; Flores, J.; Guzman, A.; Renteros, C.; Tumialan, J. Assessment of Ichu Fibers as Non-Expensive Thermal Insulation System for the Andean Regions. Energy Build. 2015, 108, 55–60. [Google Scholar] [CrossRef]
  67. Wagner, M.; Kiesel, A.; Hastings, A.; Iqbal, Y.; Lewandowski, I. Novel Miscanthus Germplasm-Based Value Chains: A Life Cycle Assessment. Front. Plant Sci. 2017, 8, 990. [Google Scholar] [CrossRef] [PubMed]
  68. Vay, O.; De Borst, K.; Hansmann, C.; Teischinger, A.; Müller, U. Thermal Conductivity of Wood at Angles to the Principal Anatomical Directions. Wood Sci. Technol. 2015, 49, 577–589. [Google Scholar] [CrossRef]
  69. Kawasaki, T.; Kawai, S. Thermal Insulation Properties of Wood-Based Sandwich Panel for Use as Structural Insulated Walls and Floors. J. Wood Sci. 2006, 52, 75–83. [Google Scholar] [CrossRef]
  70. Cherki, A.; Remy, B.; Khabbazi, A.; Jannot, Y.; Baillis, D. Experimental Thermal Properties Characterization of Insulating Cork–Gypsum Composite. Constr. Build. Mater. 2014, 54, 202–209. [Google Scholar] [CrossRef]
  71. Chikhi, M.; Agoudjil, B.; Boudenne, A.; Gherabli, A. Experimental Investigation of New Biocomposite with Low Cost for Thermal Insulation. Energy Build. 2013, 66, 267–273. [Google Scholar] [CrossRef]
  72. Alavez-Ramirez, R.; Chiñas-Castillo, F.; Morales-Dominguez, V.; Ortiz-Guzman, M. Thermal Conductivity of Coconut Fibre Filled Ferrocement Sandwich Panels. Constr. Build. Mater. 2012, 37, 425–431. [Google Scholar] [CrossRef]
  73. Panyakaew, S.; Fotios, S. New Thermal Insulation Boards Made from Coconut Husk and Bagasse. Energy Build. 2011, 43, 1732–1739. [Google Scholar] [CrossRef]
  74. Pavelek, M.; Adamová, T. Bio-Waste Thermal Insulation Panel for Sustainable Building Construction in Steady and Unsteady-State Conditions. Materials 2019, 12, 2004. [Google Scholar] [CrossRef]
  75. Wei, K.; Lv, C.; Chen, M.; Zhou, X.; Dai, Z.; Shen, D. Development and Performance Evaluation of a New Thermal Insulation Material from Rice Straw Using High Frequency Hot-Pressing. Energy Build. 2015, 87, 116–122. [Google Scholar] [CrossRef]
  76. Torres-Rivas, A.; Palumbo, M.; Haddad, A.; Cabeza, L.F.; Jiménez, L.; Boer, D. Multi-Objective Optimisation of Bio-Based Thermal Insulation Materials in Building Envelopes Considering Condensation Risk. Appl. Energy 2018, 224, 602–614. [Google Scholar] [CrossRef]
  77. Vink, E.T.; Rabago, K.R.; Glassner, D.A.; Gruber, P.R. Applications of Life Cycle Assessment to NatureWorksTM Polylactide (PLA) Production. Polym. Degrad. Stab. 2003, 80, 403–419. [Google Scholar] [CrossRef]
  78. Lukić, I.; Premrov, M.; Leskovar, Ž.V.; Passer, A. Assessment of the Environmental Impact of Timber and Its Potential to Mitigate Embodied GHG Emissions. IOP Conf. Ser. Earth Environ. Sci. 2020, 588, 022068. [Google Scholar] [CrossRef]
  79. Skullestad, J.L.; Bohne, R.A.; Lohne, J. High-Rise Timber Buildings as a Climate Change Mitigation Measure—A Comparative LCA of Structural System Alternatives. Energy Procedia 2016, 96, 112–123. [Google Scholar] [CrossRef]
  80. Podesto, L.; Breneman, S. CLT Research: Available and Accessible to North American Designers. Wood Des. Focus 2016, 26, 3–7. [Google Scholar]
  81. Gu, H.; Bergman, R. Life Cycle Assessment and Environmental Building Declaration for the Design Building at the University of Massachusetts; Gen. Tech. Rep. FPL-GTR-255; US Department of Agriculture, Forest Service, Forest Products Laboratory: Madison, WI, USA, 2018; pp. 1–73. [Google Scholar]
  82. Bowick, M. Brock Commons Tallwood House, University of British Columbia an Environmental Building Declaration According to EN 15978 Standard; Athena Sustainable Materials Institute: Ottawa, ON, Canada, 2018. [Google Scholar]
  83. Hammond, G.P.; Jones, C.I. Embodied Energy and Carbon in Construction Materials. Proc. Inst. Civ. Eng.-Energy 2008, 161, 87–98. [Google Scholar] [CrossRef]
  84. Chen, C.X.; Pierobon, F.; Ganguly, I. Life Cycle Assessment (LCA) of Cross-Laminated Timber (CLT) Produced in Western Washington: The Role of Logistics and Wood Species Mix. Sustainability 2019, 11, 1278. [Google Scholar] [CrossRef]
  85. Connolly, T.; Loss, C.; Iqbal, A.; Tannert, T. Feasibility Study of Mass-Timber Cores for the UBC Tall Wood Building. Buildings 2018, 8, 98. [Google Scholar] [CrossRef]
  86. Brandner, R.; Flatscher, G.; Ringhofer, A.; Schickhofer, G.; Thiel, A. Cross Laminated Timber (CLT): Overview and Development. Eur. J. Wood Prod. 2016, 74, 331–351. [Google Scholar] [CrossRef]
  87. Lehmann, S. Sustainable Construction for Urban Infill Development Using Engineered Massive Wood Panel Systems. Sustainability 2012, 4, 2707–2742. [Google Scholar] [CrossRef]
  88. Dong, Y.; Cui, X.; Yin, X.; Chen, Y.; Guo, H. Assessment of Energy Saving Potential by Replacing Conventional Materials by Cross Laminated Timber (CLT)—A Case Study of Office Buildings in China. Appl. Sci. 2019, 9, 858. [Google Scholar] [CrossRef]
  89. Silva, C.V.; Branco, J.M.; Lourenço, P.B. A Project Contribution to the Development of Sustainable Multi-Storey Timber Buildings. In Chapter 5—Innovative Construction Systems; MULTICOMP—Artes Gráficas, Lda: Guimarães, Portugal, 2013; pp. 379–386. [Google Scholar]
  90. Mallo, M.F.L.; Espinoza, O. Awareness, Perceptions and Willingness to Adopt Cross-Laminated Timber by the Architecture Community in the United States. J. Clean. Prod. 2015, 94, 198–210. [Google Scholar] [CrossRef]
  91. Van De Kuilen, J.; Ceccotti, A.; Xia, Z.; He, M. Very Tall Wooden Buildings with Cross Laminated Timber. Procedia Eng. 2011, 14, 1621–1628. [Google Scholar] [CrossRef]
  92. Younis, A.; Dodoo, A. Cross-Laminated Timber for Building Construction: A Life-Cycle-Assessment Overview. J. Build. Eng. 2022, 52, 104482. [Google Scholar] [CrossRef]
  93. Frangi, A.; Fontana, M.; Hugi, E.; Jübstl, R. Experimental Analysis of Cross-Laminated Timber Panels in Fire. Fire Saf. J. 2009, 44, 1078–1087. [Google Scholar] [CrossRef]
  94. Klippel, M.; Schmid, J. Design of Cross-Laminated Timber in Fire. Struct. Eng. Int. 2017, 27, 224–230. [Google Scholar] [CrossRef]
  95. Dsilva, J.; Zarmukhambetova, S.; Locke, J. Assessment of Building Materials in the Construction Sector: A Case Study Using Life Cycle Assessment Approach to Achieve the Circular Economy. Heliyon 2023, 9, e20404. [Google Scholar] [CrossRef]
  96. Guest, G.; Cherubini, F.; Strømman, A.H. Global Warming Potential of Carbon Dioxide Emissions from Biomass Stored in the Anthroposphere and Used for Bioenergy at End of Life. J. Ind. Ecol. 2013, 17, 20–30. [Google Scholar] [CrossRef]
  97. Pierobon, F.; Huang, M.; Simonen, K.; Ganguly, I. Environmental Benefits of Using Hybrid CLT Structure in Midrise Non-Residential Construction: An LCA Based Comparative Case Study in the US Pacific Northwest. J. Build. Eng. 2019, 26, 100862. [Google Scholar] [CrossRef]
  98. Cadorel, X.; Crawford, R. Life Cycle Analysis of Cross Laminated Timber in Buildings: A Review; The Architectural Science Association and RMIT University Melbourne: Melbourne, Australia, 2018; pp. 107–114. [Google Scholar]
  99. Röck, M.; Saade, M.R.M.; Balouktsi, M.; Rasmussen, F.N.; Birgisdottir, H.; Frischknecht, R.; Habert, G.; Lützkendorf, T.; Passer, A. Embodied GHG Emissions of Buildings–The Hidden Challenge for Effective Climate Change Mitigation. Appl. Energy 2020, 258, 114107. [Google Scholar] [CrossRef]
  100. Carcassi, O.B.; Minotti, P.; Habert, G.; Paoletti, I.; Claude, S.; Pittau, F. Carbon Footprint Assessment of a Novel Bio-Based Composite for Building Insulation. Sustainability 2022, 14, 1384. [Google Scholar] [CrossRef]
  101. Lan, K.; Kelley, S.S.; Nepal, P.; Yao, Y. Dynamic Life Cycle Carbon and Energy Analysis for Cross-Laminated Timber in the Southeastern United States. Environ. Res. Lett. 2020, 15, 124036. [Google Scholar] [CrossRef]
  102. Balasbaneh, A.T.; Sher, W. Comparative Sustainability Evaluation of Two Engineered Wood-Based Construction Materials: Life Cycle Analysis of CLT versus GLT. Build. Environ. 2021, 204, 108112. [Google Scholar] [CrossRef]
  103. De Rosa, M.; Pizzol, M.; Schmidt, J. How Methodological Choices Affect LCA Climate Impact Results: The Case of Structural Timber. Int. J. Life Cycle Assess. 2018, 23, 147–158. [Google Scholar] [CrossRef]
  104. Levasseur, A.; Lesage, P.; Margni, M.; Samson, R. Biogenic Carbon and Temporary Storage Addressed with Dynamic Life Cycle Assessment. J. Ind. Ecol. 2013, 17, 117–128. [Google Scholar] [CrossRef]
  105. Brandão, M.; Levasseur, A.; Kirschbaum, M.U.; Weidema, B.P.; Cowie, A.L.; Jørgensen, S.V.; Hauschild, M.Z.; Pennington, D.W.; Chomkhamsri, K. Key Issues and Options in Accounting for Carbon Sequestration and Temporary Storage in Life Cycle Assessment and Carbon Footprinting. Int. J. Life Cycle Assess. 2013, 18, 230–240. [Google Scholar] [CrossRef]
  106. ISO 14040; Environmental Management—Life Cycle Assessment: Principles and Framework. International Organization for Standardization: Geneva, Switzerland, 2006.
  107. ISO 14044; Environmental Management-Life Cycle Assessment-Requirements and Guidelines. International Organization for Standardization: Geneva, Switzerland, 2006.
  108. ISO 21930:2017; Sustainability in Buildings and Civil Engineering Works–Core Rules for Environmental Product Declarations of Construction Products and Services. International Organization for Standardization (ISO): Geneva, Switzerland, 2017; p. 25.
  109. Crovella, P.; Tom, K.; Mohamad, R.; William, S. A Zero-Carbon Energy Retrofit Solution for NYS Buildings from NYS Forests; SUNY College of Environmental Science and Forestry: New York, NY, USA, 2021; p. 41. [Google Scholar]
  110. International Code Council (ICC). 2009 International Energy Conservation Code; International Code Council (ICC): Washington, DC, USA, 2009; Volume 2009, p. 93.
  111. ACLCA. ACLCA Guidance to Calculating Non-LCIA Inventory Metrics in Accordance with ISO 21930:2017; Product Category Rule (PCR) Committee of the American Center for Life Cycle Assessment: Philadelphia, PA, USA, 2019; p. 70. [Google Scholar]
  112. De Serres-Lafontaine, C.; Blanchet, P.; Charron, S.; Delem, L.; Wastiels, L. Bio-Based Innovations in Cross-Laminated Timber (CLT) Envelopes: A Hygrothermal and Life Cycle Analysis (LCA) Study. Build. Environ. 2024, 256, 111499. [Google Scholar] [CrossRef]
  113. Ecoinvent. Ecoinvent Life Cycle Assessment Database; Ecoinvent: Zurich, Switzerland, 2023; Available online: https://ecoinvent.org/database/ (accessed on 10 September 2023).
  114. NREL U.S. Life Cycle Inventory (USLCI) Database. The Federal LCA Commons (FLCAC), National Renewable Energy Laboratory. 2012. Available online: https://www.lcacommons.gov/ (accessed on 20 November 2023).
  115. Puettmann, M.E.; Wagner, F.G.; Johnson, L. Life Cycle Inventory of Softwood Lumber from the Inland Northwest US. Wood Fiber Sci. 2010, 42, 52–66. [Google Scholar]
  116. GCP Applied Technologies Inc. Environmental Product Declaration of GCP Applied Technologies Inc. Perm-A-Barrier® Air Barriers; GCP Applied Technologies Inc.: Alpharetta, GA, USA, 2017. [Google Scholar]
  117. GCP Applied Technologies Inc. PERM-A-BARRIER® NPL 10/ NPL 10 LT Data Sheet: Fluid-Applied Impermeable Air and Vapor Barrier Membrane; GCP Applied Technologies Inc.: Alpharetta, GA, USA, 2023. [Google Scholar]
  118. Structurlam. EPD for Cross Laminated Timber Produced by Structurlam in Okanagan Falls, BC; Structurlam Mass Timber Corporation: Penticton, BC, Canada, 2020; p. 15. [Google Scholar]
  119. STEICO. EPD for Wood Fibre Insulation Boards Manufactured in a Dry Process; Institut Bauen und Umwelt: Berlin, Germany, 2020; p. 10. [Google Scholar]
  120. DuPont. Environmental Product Declaration: Tyvek® Mechanically Fastened Air and Water Barrier Systems; DuPont: Wilmington, IL, USA, 2017; p. 18. [Google Scholar]
  121. Aro, M.D. Life-Cycle Assessment of Thermally-Modified Southern Pine Decking. Ph.D. Thesis, University of Minnesota, Minneapolis, MN, USA, 2018. [Google Scholar]
  122. SFPA. Pressure-Treated Southern Pine; Southern Forest Products Association: Metairie, LA, USA, 2019; p. 24. [Google Scholar]
  123. SFPA. Southern Pine Use Guide; Southern Forest Products Association: Metairie, LA, USA, 2018; p. 20. [Google Scholar]
  124. LP SmartSide. LP® SmartSide® Environmental Product Declaration; Louisiana-Pacific Corporation: Nashville, TN, USA, 2021; p. 21. [Google Scholar]
  125. Puettmann, M.; Pierobon, F.; Ganguly, I.; Gu, H.; Chen, C.; Liang, S.; Jones, S.; Maples, I.; Wishnie, M. Comparative LCAs of Conventional and Mass Timber Buildings in Regions with Potential for Mass Timber Penetration. Sustainability 2021, 13, 13987. [Google Scholar] [CrossRef]
  126. U.S. Energy Information Administration (EIA). New York: State Profiles and Energy Estimates. Monthly 2022, 1. Available online: https://www.eia.gov/state/data.php?sid=NY (accessed on 27 July 2023).
  127. Spillane, K. 2021 Annual Report on Recyclables Recovered & Updated Comprehensive Recycling Analysis; Onondaga County Resource Recovery Agency (OCRRA): Syracuse, NY, USA, 2022; p. 11. [Google Scholar]
  128. Glance, D. 2019 Annual Report on Recyclables Recovered; Onondaga County Resource Recovery Agency (OCRRA): Syracuse, NY, USA, 2020; p. 20. [Google Scholar]
  129. Bare, J. TRACI 2.0: The Tool for the Reduction and Assessment of Chemical and Other Environmental Impacts 2.0. Clean Technol. Environ. Policy 2011, 13, 687–696. [Google Scholar] [CrossRef]
  130. Guo, M.; Murphy, R.J. LCA Data Quality: Sensitivity and Uncertainty Analysis. Sci. Total Environ. 2012, 435–436, 230–243. [Google Scholar] [CrossRef]
  131. Marcea, R.; Lau, K. Carbon Dioxide Implications of Building Materials. J. For. Eng. 1992, 3, 37–43. [Google Scholar] [CrossRef]
  132. Lechón, Y.; La Rúa, C.D.; Lechón, J.I. Environmental Footprint and Life Cycle Costing of a Family House Built on CLT Structure. Analysis of Hotspots and Improvement Measures. J. Build. Eng. 2021, 39, 102239. [Google Scholar] [CrossRef]
  133. Peñaloza, D.; Erlandsson, M.; Falk, A. Exploring the Climate Impact Effects of Increased Use of Bio-Based Materials in Buildings. Constr. Build. Mater. 2016, 125, 219–226. [Google Scholar] [CrossRef]
  134. Gustavsson, L.; Joelsson, A.; Sathre, R. Life Cycle Primary Energy Use and Carbon Emission of an Eight-Storey Wood-Framed Apartment Building. Energy Build. 2010, 42, 230–242. [Google Scholar] [CrossRef]
  135. Chaudhary, A.; Messer, A. Life Cycle Assessment of Adhesives Used in Wood Constructions Life Cycle Assessment (LCA) of Adhesives Used in Wood Constructions; ETH: Zurich, Switzerland, 2015. [Google Scholar]
  136. Liu, W.; Zhang, Z.; Xie, X.; Yu, Z.; von Gadow, K.; Xu, J.; Zhao, S.; Yang, Y. Analysis of the Global Warming Potential of Biogenic CO2 Emission in Life Cycle Assessments. Sci. Rep. 2017, 7, 39857. [Google Scholar] [CrossRef]
  137. Andersen, J.H.; Rasmussen, N.L.; Ryberg, M.W. Comparative Life Cycle Assessment of Cross Laminated Timber Building and Concrete Building with Special Focus on Biogenic Carbon. Energy Build. 2022, 254, 111604. [Google Scholar] [CrossRef]
  138. Breton, C.; Blanchet, P.; Amor, B.; Beauregard, R.; Chang, W.-S. Assessing the Climate Change Impacts of Biogenic Carbon in Buildings: A Critical Review of Two Main Dynamic Approaches. Sustainability 2018, 10, 2020. [Google Scholar] [CrossRef]
  139. Hubbard, S.S.; Bergman, R.D.; Sahoo, K.; Bowe, S.A. A Life Cycle Assessment of Hardwood Lumber Production in the Northeast and North Central United States; CORRIM Report; Consortium for Research on Renewable Industrial Materials (CORRIM): Corvallis, OR, USA, 2020; 45p. [Google Scholar]
  140. Hosseini, S.S.; Yaghmaeian, K.; Yousefi, N.; Mahvi, A.H. Estimation of Landfill Gas Generation in a Municipal Solid Waste Disposal Site by LandGEM Mathematical Model. Glob. J. Environ. Sci. Manag. 2018, 4, 493–506. [Google Scholar] [CrossRef]
  141. Head, M.; Magnan, M.; Kurz, W.A.; Levasseur, A.; Beauregard, R.; Margni, M. Temporally-Differentiated Biogenic Carbon Accounting of Wood Building Product Life Cycles. SN Appl. Sci. 2021, 3, 62. [Google Scholar] [CrossRef]
  142. Gonçalves, D.; Bordado, J.M.; Marques, A.C.; Galhano dos Santos, R. Non-Formaldehyde, Bio-Based Adhesives for Use in Wood-Based Panel Manufacturing Industry—A Review. Polymers 2021, 13, 4086. [Google Scholar] [CrossRef] [PubMed]
  143. González-García, S.; Feijoo, G.; Heathcote, C.; Kandelbauer, A.; Moreira, M.T. Environmental Assessment of Green Hardboard Production Coupled with a Laccase Activated System. J. Clean. Prod. 2011, 19, 445–453. [Google Scholar] [CrossRef]
  144. Chen, L.; Miller, S.A.; Ellis, B.R. Comparative Human Toxicity Impact of Electricity Produced from Shale Gas and Coal. Environ. Sci. Technol. 2017, 51, 13018–13027. [Google Scholar] [CrossRef] [PubMed]
  145. Burchart-Korol, D.; Pustejovska, P.; Blaut, A.; Jursova, S.; Korol, J. Comparative Life Cycle Assessment of Current and Future Electricity Generation Systems in the Czech Republic and Poland. Int. J. Life Cycle Assess. 2018, 23, 2165–2177. [Google Scholar] [CrossRef]
  146. Hertwich, E.G.; Gibon, T.; Bouman, E.A.; Arvesen, A.; Suh, S.; Heath, G.A.; Bergesen, J.D.; Ramirez, A.; Vega, M.I.; Shi, L. Integrated Life-Cycle Assessment of Electricity-Supply Scenarios Confirms Global Environmental Benefit of Low-Carbon Technologies. Proc. Natl. Acad. Sci. USA 2015, 112, 6277–6282. [Google Scholar] [CrossRef] [PubMed]
  147. Poinssot, C.; Bourg, S.; Ouvrier, N.; Combernoux, N.; Rostaing, C.; Vargas-Gonzalez, M.; Bruno, J. Assessment of the Environmental Footprint of Nuclear Energy Systems. Comparison between Closed and Open Fuel Cycles. Energy 2014, 69, 199–211. [Google Scholar] [CrossRef]
  148. Atilgan, B.; Azapagic, A. Life Cycle Environmental Impacts of Electricity from Fossil Fuels in Turkey. J. Clean. Prod. 2015, 106, 555–564. [Google Scholar] [CrossRef]
  149. Levasseur, A.; Brandão, M.; Lesage, P.; Margni, M.; Pennington, D.; Clift, R.; Samson, R. Valuing Temporary Carbon Storage. Nat. Clim. Chang. 2012, 2, 6–8. [Google Scholar] [CrossRef]
  150. Cherubini, F.; Peters, G.P.; Berntsen, T.; Strømman, A.H.; Hertwich, E. CO2 Emissions from Biomass Combustion for Bioenergy: Atmospheric Decay and Contribution to Global Warming. GCB Bioenergy 2011, 3, 413–426. [Google Scholar] [CrossRef]
  151. Holtsmark, B. Quantifying the Global Warming Potential of CO2 Emissions from Wood Fuels. GCB Bioenergy 2015, 7, 195–206. [Google Scholar] [CrossRef]
  152. Holtsmark, B. A Comparison of the Global Warming Effects of Wood Fuels and Fossil Fuels Taking Albedo into Account. GCB Bioenergy 2015, 7, 984–997. [Google Scholar] [CrossRef]
  153. Lenton, T.M. Early Warning of Climate Tipping Points. Nat. Clim. Chang. 2011, 1, 201–209. [Google Scholar] [CrossRef]
  154. Ximenes, F.A.; Cowie, A.L.; Barlaz, M.A. The Decay of Engineered Wood Products and Paper Excavated from Landfills in Australia. Waste Manag. 2018, 74, 312–322. [Google Scholar] [CrossRef] [PubMed]
  155. Fouquet, M.; Levasseur, A.; Margni, M.; Lebert, A.; Lasvaux, S.; Souyri, B.; Buhé, C.; Woloszyn, M. Methodological Challenges and Developments in LCA of Low Energy Buildings: Application to Biogenic Carbon and Global Warming Assessment. Build. Environ. 2015, 90, 51–59. [Google Scholar] [CrossRef]
  156. Garcia, R.; Alvarenga, R.A.F.; Huysveld, S.; Dewulf, J.; Allacker, K. Accounting for Biogenic Carbon and End-of-Life Allocation in Life Cycle Assessment of Multi-Output Wood Cascade Systems. J. Clean. Prod. 2020, 275, 122795. [Google Scholar] [CrossRef]
  157. Castellano, G.; Paoletti, I.M.; Malighetti, L.E.; Carcassi, O.B.; Pradella, F.; Pittau, F. Bio-Based Solutions for the Retrofit of the Existing Building Stock: A Systematic Review. In Bio-Based Building Materials; Amziane, S., Merta, I., Page, J., Eds.; RILEM Bookseries; Springer Nature: Cham, Switzerland, 2023; Volume 45, pp. 399–419. ISBN 978-3-031-33464-1. [Google Scholar]
  158. NYSCAC. Scoping Plan; New York State Climate Action Council: Albany, NY, USA, 2022; p. 433. [Google Scholar]
  159. Wilcox, J.; Hammer, H.; Patane, N. Appendix G: Integration Analysis Technical Supplement New York State Climate Action Council Scoping Plan; New York State Energy Research & Development Authority (NYSERDA) and New York State Department of Environmental Conservation (NYSDEC): New York, NY, USA, 2022; p. 184. [Google Scholar]
  160. NYSERDA. Market Characterization Study: Building Stock Assessment and Architectural Profiles of Predominant New York State Multifamily Building Types; NYSERDA RetrofitNY; New York State Energy Research and Development Authority, Pratt Institute School of Architecture, Syracuse University School of Architecture: Albany, NY, USA, 2020; p. 118. [Google Scholar]
  161. Reyna, J.; Wilson, E.; Parker, A.; Satre-Meloy, A.; Egerter, A.; Bianchi, C.; Praprost, M.; Speake, A.; Liu, L.; Horsey, R. US Building Stock Characterization Study: A National Typology for Decarbonizing US Buildings; National Renewable Energy Lab. (NREL): Golden, CO, USA, 2022; p. 93. [Google Scholar]
Figure 1. Box-and-whisker plot summarizing embodied carbon (kgCO2-eq/m2) of fossil- and mineral-derived and biobased insulation material literature studies (see Table S2 for details). Middle bar indicates the median, × is the mean, edges of the box are the 25th and 75th percentiles, whiskers dots are outliers and error bars are the minimum and maximum of the values (fossil-derived insulation: n = 6, median = 59, min = 49 and max 132; mineral-derived insulation: n = 10, median = 174, min = 51, max = 844; biobased insulation: n = 6, median = 13, min = 2.72 and max = 83).
Energies 17 03406 g001
Figure 2. Six key components in the CLT and wood fiber-based insulation panel being tested in Syracuse, NY [109].
Energies 17 03406 g002
Figure 3. The system boundary and the process steps associated with the manufacturing and installation of a CLT and wood fiber biobased insulation panel.
Energies 17 03406 g003
Figure 4. Electricity generation mix by sources and carbon dioxide (equivalent) emissions per kWh for each product to corresponding regions (note: RFCW = Reliability First Corporation West; NYUP = upstate New York; RFCE = Reliability First Corporation East; SRVC = South-Eastern Electric Reliability Council, Virginia/Carolina; MROE = Midwest Reliability Organization East).
Energies 17 03406 g004
Figure 5. Global warming potential of the biobased insulation by subcategories for wood-based (three-ply CLT and wood fiber) insulation panels for building.
Energies 17 03406 g005
Figure 6. Global warming of individual material components of biobased insulation panel (three-ply CLT and wood fiber).
Energies 17 03406 g006
Figure 7. GWP contribution of all processes in the growth, manufacturing, installation, and waste disposal of biobased insulation panels.
Energies 17 03406 g007
Figure 8. Contribution of all processes of growth, manufacturing, transportation, installation, and waste disposal of biobased insulation panel on different impact categories.
Energies 17 03406 g008
Figure 9. Uncertainty analysis of the net impacts of the panel based on probability distribution of characterized global warming potential for 20 and 100 years.
Energies 17 03406 g009
Figure 10. Sensitivity of impact categories to a 20% increase in input parameters of the biobased insulation panel (error bars represent the range of sensitivity).
Energies 17 03406 g010
Figure 11. Potential carbon storage (MMT) for retrofitting exterior building wall with either deep shell or basic shell designs if the targets in the NYS Scoping Plan are reached.
Energies 17 03406 g011
Table 1. Inventory of materials and energy consumption per functional unit (1 m2) associated with the manufacturing and installation of a CLT and wood fiber biobased insulation panel (Table S4 for details).
PhasesVapor Barrier3-Ply CLTWood FiberMembrane SheetStrapping MaterialSiding Material
Plant growth (kgCO2-eq) (A1) a−89−22.7−1.11−11.2
Raw materials (kg), (A2) b2.1494.212.78.82 × 10−51.597.32
Transportation (A3)On road (km)694439384437739
Barge (km)6610
Energy use (A4)Electricity (kWh)5.030.830.11.27 × 10−233.929.0
Natural gas (MJ)3.6026.5
Installation (A5)Electricity (kWh)0.2781.391.390.2780.2781.39
Packaging waste (kg) (C1 and C2)9.77 × 10−23.81 × 10−23.81 × 10−21.00 × 10−49.77 × 10−23.61 × 10−4
a Not applicable. b Detailed flows are provided in the Supplementary Information (Table S4).
Table 2. Life Cycle impact assessment results for the selected impact categories per FU (1 m2).
Impact CategoryUnitVapor BarrierThree-Ply CLTWood FiberMembrane SheetStrapping MaterialSiding MaterialInstallationWaste TreatmentTotal
Ozone depletionkg CFC-11 eq3.92 × 10−76.41 × 10−61.93 × 10−73.85 × 10−101.14 × 10−65.35 × 10−78.63 × 10−111.27 × 10−78.79 × 10−6
Smog formationkg O3 eq0.3453.801.401.75 × 10−40.62611.50.3203.03 × 10−218.1
Acidificationkg SO2 eq2.87 × 10−21.37 × 10−18.11 × 10−21.66 × 10−55.53 × 10−24.38 × 10−14.10 × 10−22.38 × 10−30.783
Eutrophicationkg N eq1.01 × 10−22.74 × 10−21.30 × 10−25.71 × 10−62.44 × 10−29.27 × 10−25.80 × 10−47.64 × 10−40.169
Carcinogenic effectCTUh2.14 × 10−78.36 × 10−63.77 × 10−72.12 × 10−104.54 × 10−71.41 × 10−68.83 × 10−92.92 × 10−81.08 × 10⁻⁵
Noncarcinogenic effectCTUh1.15 × 10−64.08 × 10−62.15 × 10−65.78 × 10−104.44 × 10−66.21 × 10−61.52 × 10−71.51 × 10−71.83 × 10⁻⁵
Respiratory effectskg PM2.5 eq1.78 × 10−32.34 × 10−24.25 × 10−31.21 × 10−63.93 × 10−31.13 × 10−21.99 × 10−32.51 × 10−44.69 × 10−2
EcotoxicityCTUe24.952.939.51.15 × 10−249.31581.859.43336
Fossil fuel depletionMJ surplus16.751.419.21.36 × 10−226.059.63.003.24179
Table 3. Comparison of the GWP100 from this study compared to other studies that assessed alternative insulation products.
Studies on Biobased Building MaterialsGWP100 Impacts (kgCO2-eq/m2)Materials Studied
Marcea and Lau [131]40.7Wood compared to non-wood building materials in North American context.
Mouton et al. [55]68.22Timber-, straw- and hemp-based materials in European context.
Liang et al. [52]193Mass timber (CLT and glued laminated timber (glulam)) and associated materials in the U.S. context.
CWC [51]159Mass timber (nail-laminated timber (NLT), glulam, and CLT) in Canadian context.
Pierobon et al. [97]327.53Hybrid CLT structure (CLT and gypsum as wallboard) in the U.S. Pacific Northwest context.
Gustavsson et al. [134]89 *Wood residues (branches, foliage, bark, construction, and demolition wood) in Swedish context.
Robertson et al. [54]126 *CLT and glulam in Canadian context.
Lechon et al. [132]34Cross-laminated timber (CLT) in Spanish context.
Penaloza et al. [133]5 *CLT and cellulose fiber insulation material in Swedish context.
Penaloza et al. [133]197
This study98.7CLT and associated materials for installation (vapor barrier, wood fiber, membrane sheet, and strapping and siding materials).
This study7.2 *
* Net emissions, i.e., carbon storage of wood is considered as a credit.
Disclaimer/Publisher’s Note: The statements, opinions and data contained in all publications are solely those of the individual author(s) and contributor(s) and not of MDPI and/or the editor(s). MDPI and/or the editor(s) disclaim responsibility for any injury to people or property resulting from any ideas, methods, instructions or products referred to in the content.