1. Introduction
Power quality can be defined as the suitability of an electrical energy source for the operation of electrical and electronic equipment without causing damage or undesirable interference. The increasing use of nonlinear loads and power electronic devices connected to the power system (PS) directly affects its operational capabilities. Disturbances in the fundamental voltage waveform, such as frequency variations, interruptions, fluctuations, and/or distortions [
1], referred to as voltage disturbances, can undermine the stability and security of the PS, damage sensitive equipment (e.g., transformers, motors, and electronic devices), affect power quality, and cause interruptions to the power supply. Early detection and classification of disturbances in electrical power systems coupled with other relevant strategies aim to ensure the reliability, stability, and continuity of the supply to consumers and the integrity of PS equipment and components, highlighting the need for continuous monitoring of power systems [
2].
Power quality studies have been a widely studied subject in the electrical sector. In the specialized literature, the following publications can be highlighted. Reference [
3] presents a system dedicated to detecting and classifying transients and voltage waveform distortions based on digital filtering and mathematical morphology. RMS voltage value analysis is used in cases of short-term and long-term disturbances. This method identifies the type of disturbance and its parameters, such as the temporal location, duration, and magnitude. It is suitable for real-time monitoring and implementation of power systems using a digital signal processor. The proposed method identifies disturbances and their parameters (time, duration, magnitude), which is suitable for real-time power system monitoring with a DSP. It accurately detects and measures power quality disturbances, which is ideal for standalone DSP-based instruments due to the low computational needs. Testing with simulated and real data showed it is faster than the discrete wavelet transform method, with easily adjustable sensitivity through the threshold levels.
In reference [
4], the proposed method identifies disturbances and their parameters (time, duration, magnitude) suitable for real-time power system monitoring with a DSP. Because of the low computational needs, it accurately detects and measures power quality disturbances properly for standalone DSP-based instruments. Testing with simulated and real data showed it is faster than the discrete wavelet transform method, with easily adjustable sensitivity through the threshold levels. A method is presented that is aimed at decision support for automatically detecting and classifying voltage disturbances based on signal-processing techniques and intelligent systems. This method is composed of four modules: (1) the first module continuously analyzes the operational status of the electrical system; (2) the second extracts the relevant characteristics of the three-phase voltage signal based on the discrete wavelet transform, multiresolution analysis and the concept of the entropy norm; (3) the signal signature is processed through standardization and coding; and finally, (4) the fourth module elaborates the classification of the type of disturbance based on the use of a fuzzy-ARTMAP ANN, a neural network architecture for incremental supervised learning of recognition categories and multidimensional maps in response to arbitrary sequences of analog or binary input vectors [
5]. The results show that the proposed method is efficient, robust, and offers high computing performance with low processing time, making it suitable for real-time applications. The continuous detection process for voltage anomalies succeeded in all the diagnoses with a detection time of approximately 2.9 ms due to the reduced processing complexity. The method, combined with FANN, proved robust against common diagnostic challenges. Designed to balance the needs and constraints of power companies, it is simple and cost-effective to implement, requiring only a data acquisition system and standard data-processing devices. Additionally, its continuous training module offers an advantage over traditional techniques by not requiring reinitialization, preserving previously acquired knowledge.
Ref. [
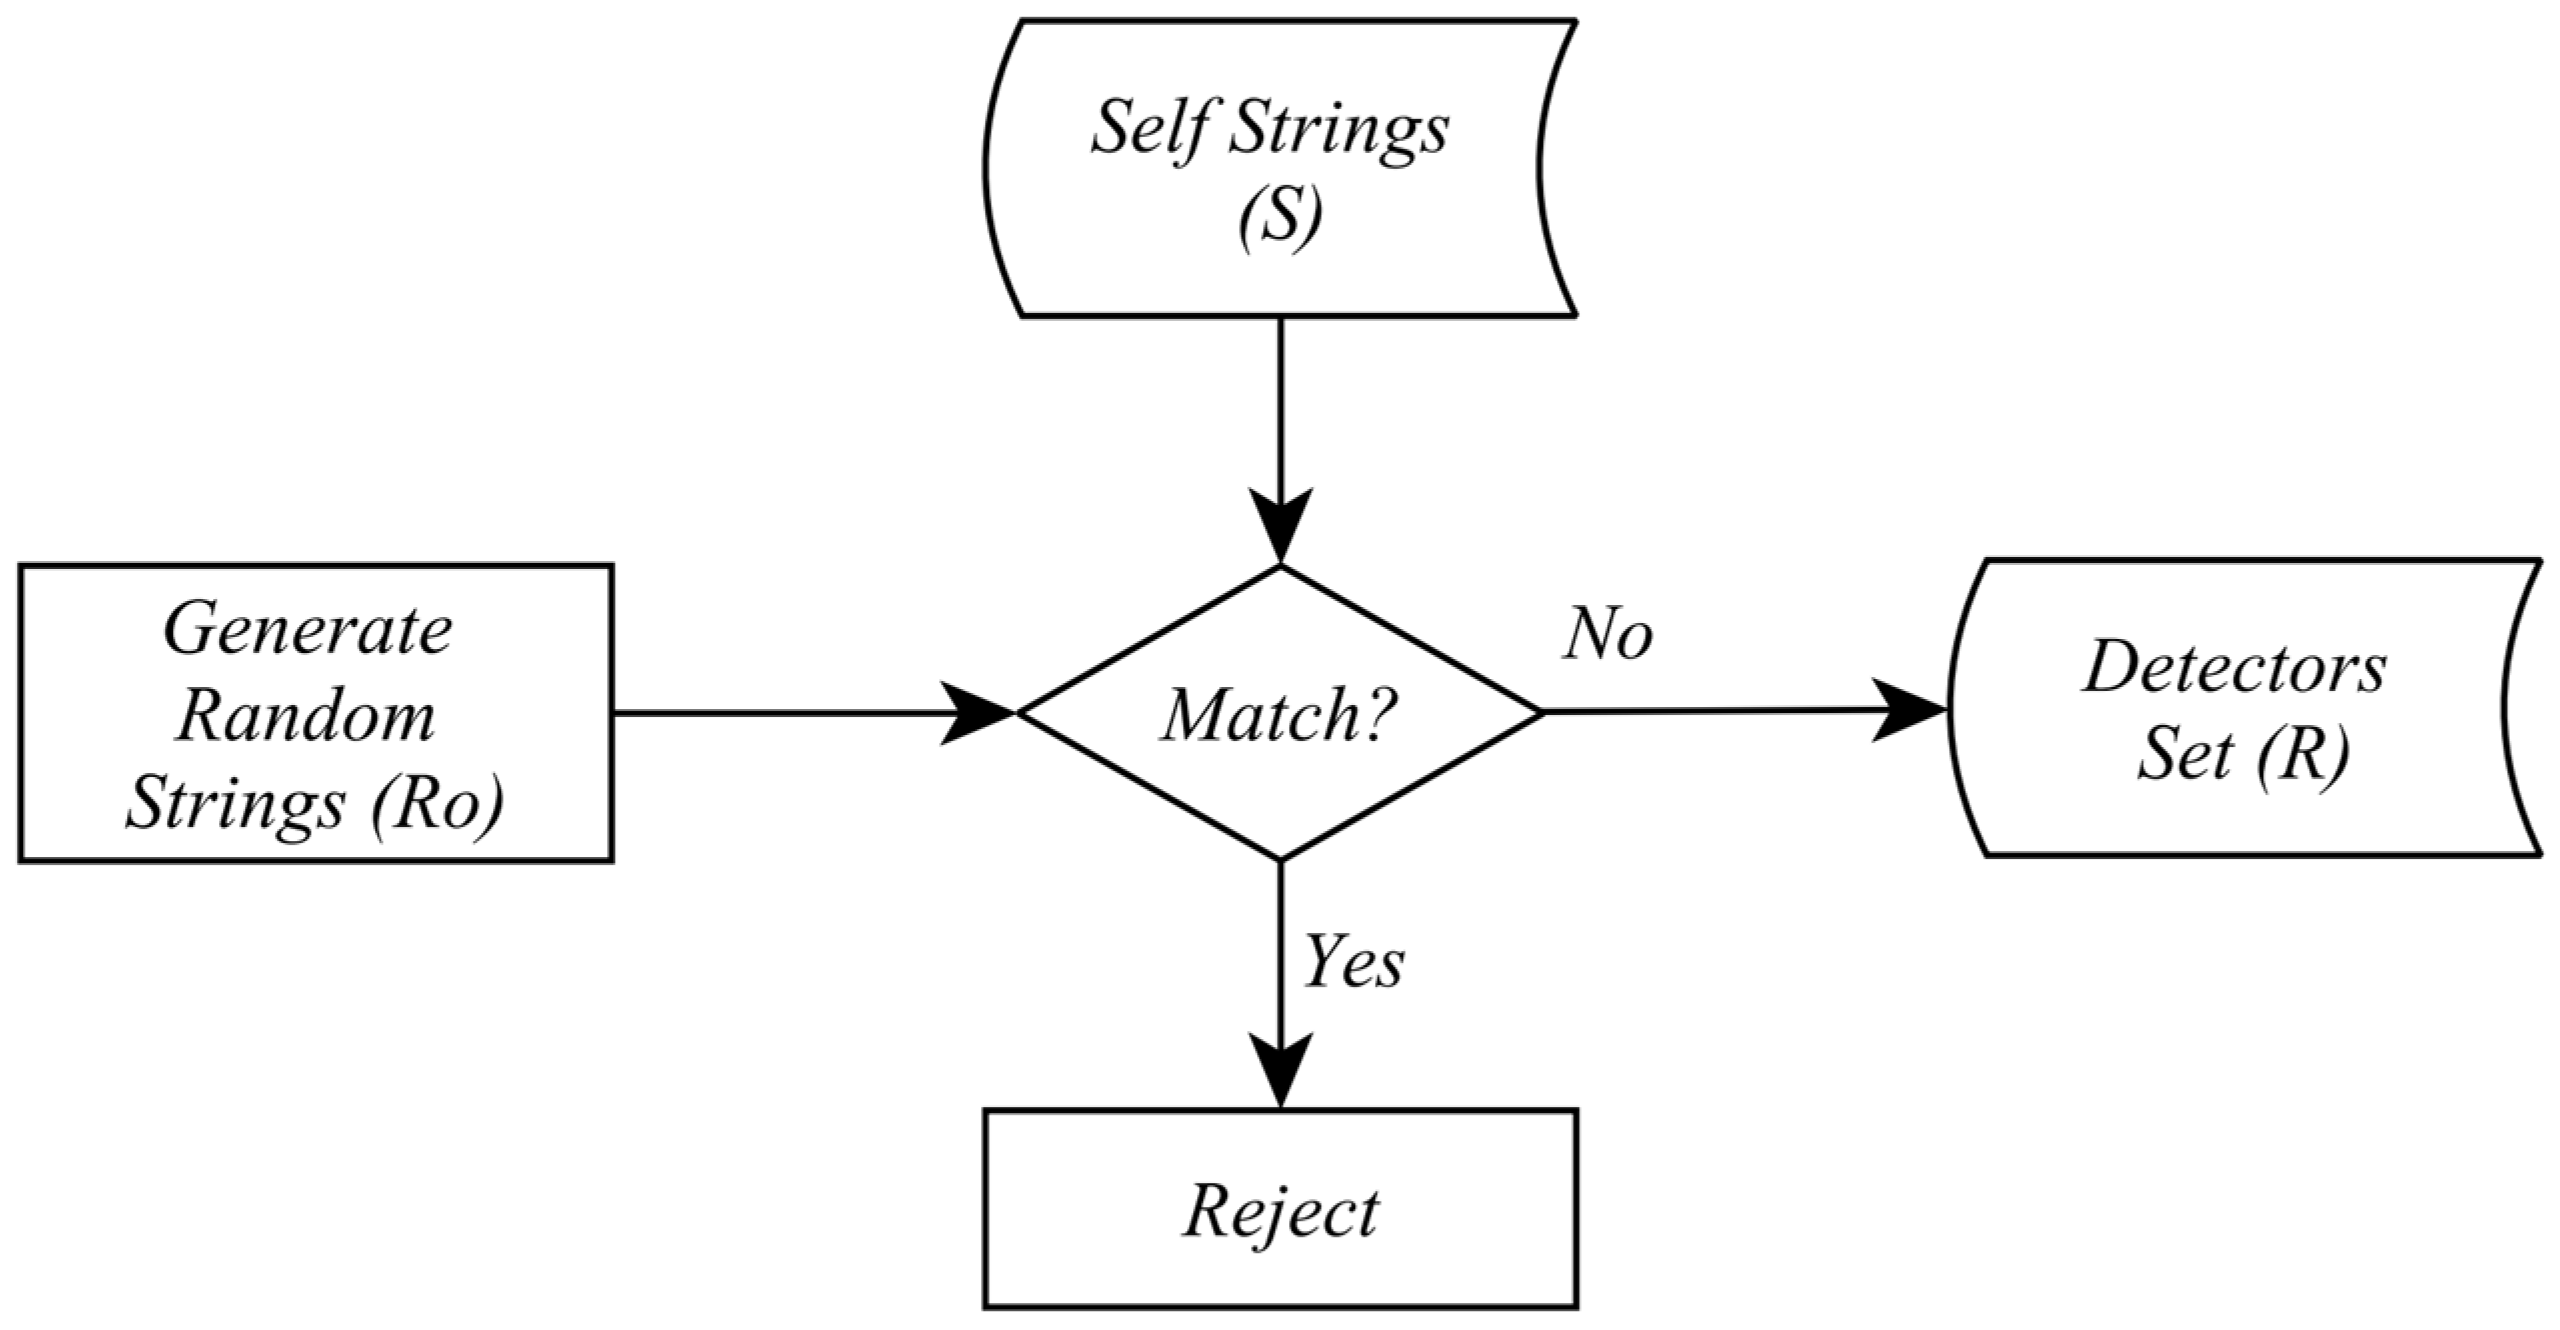
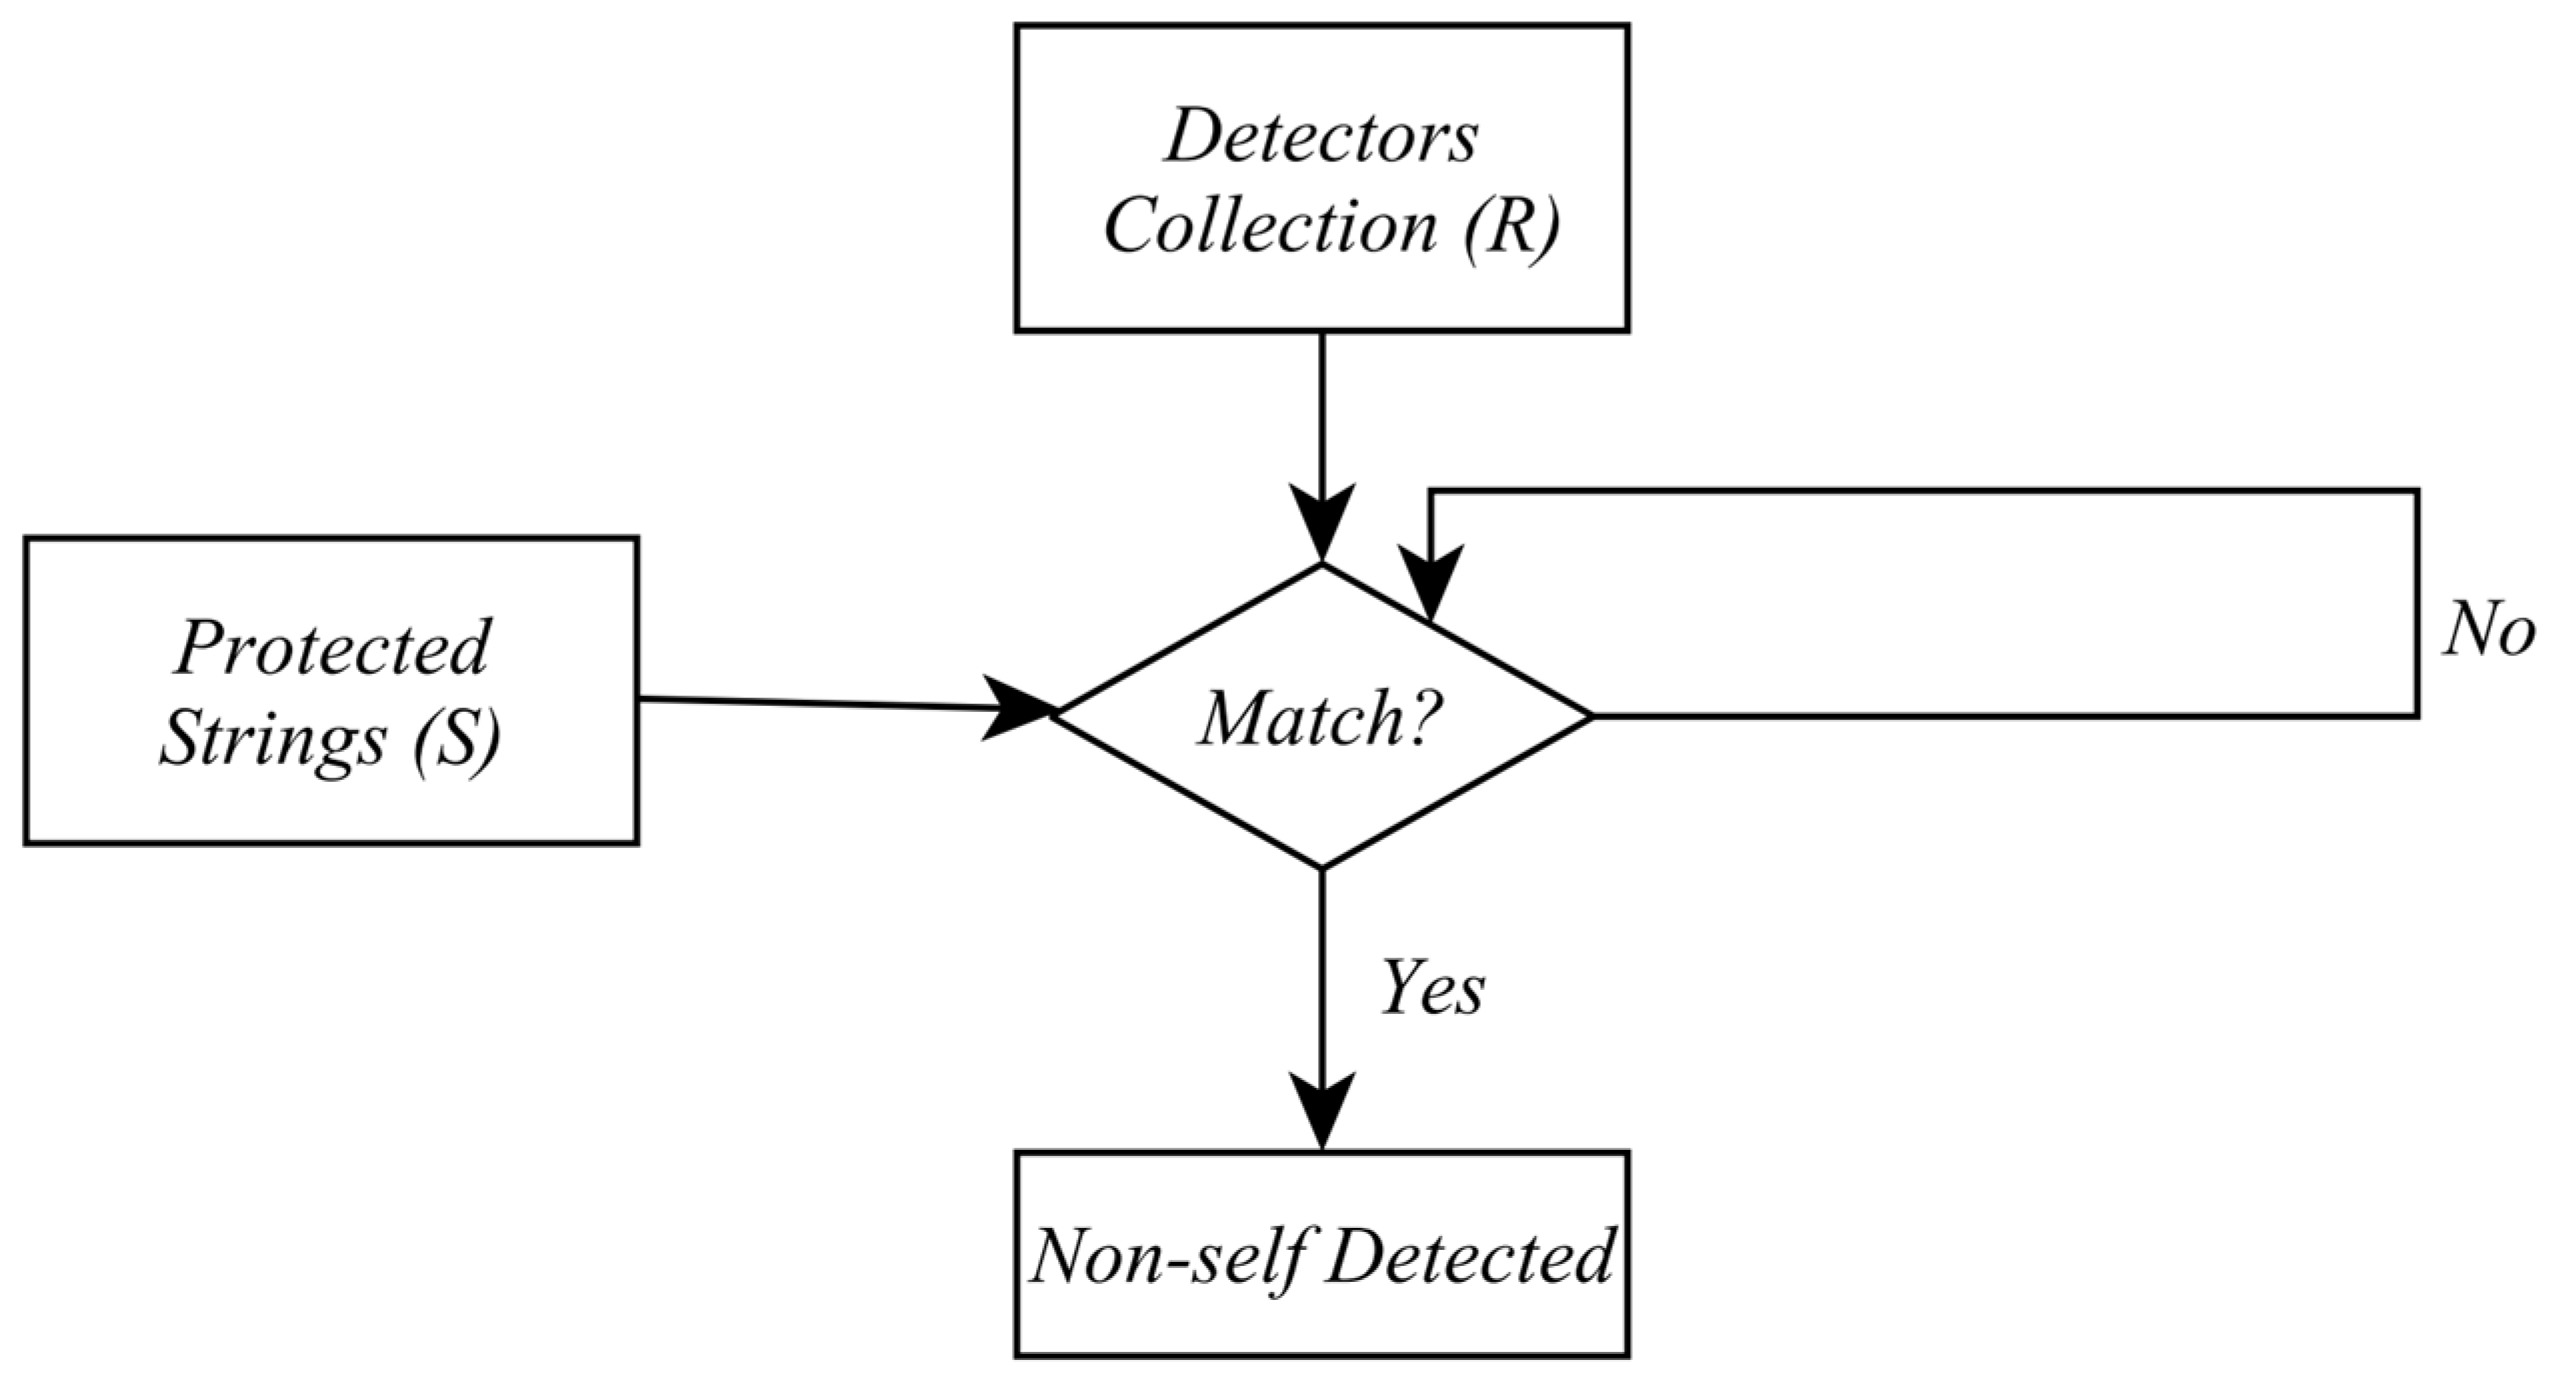
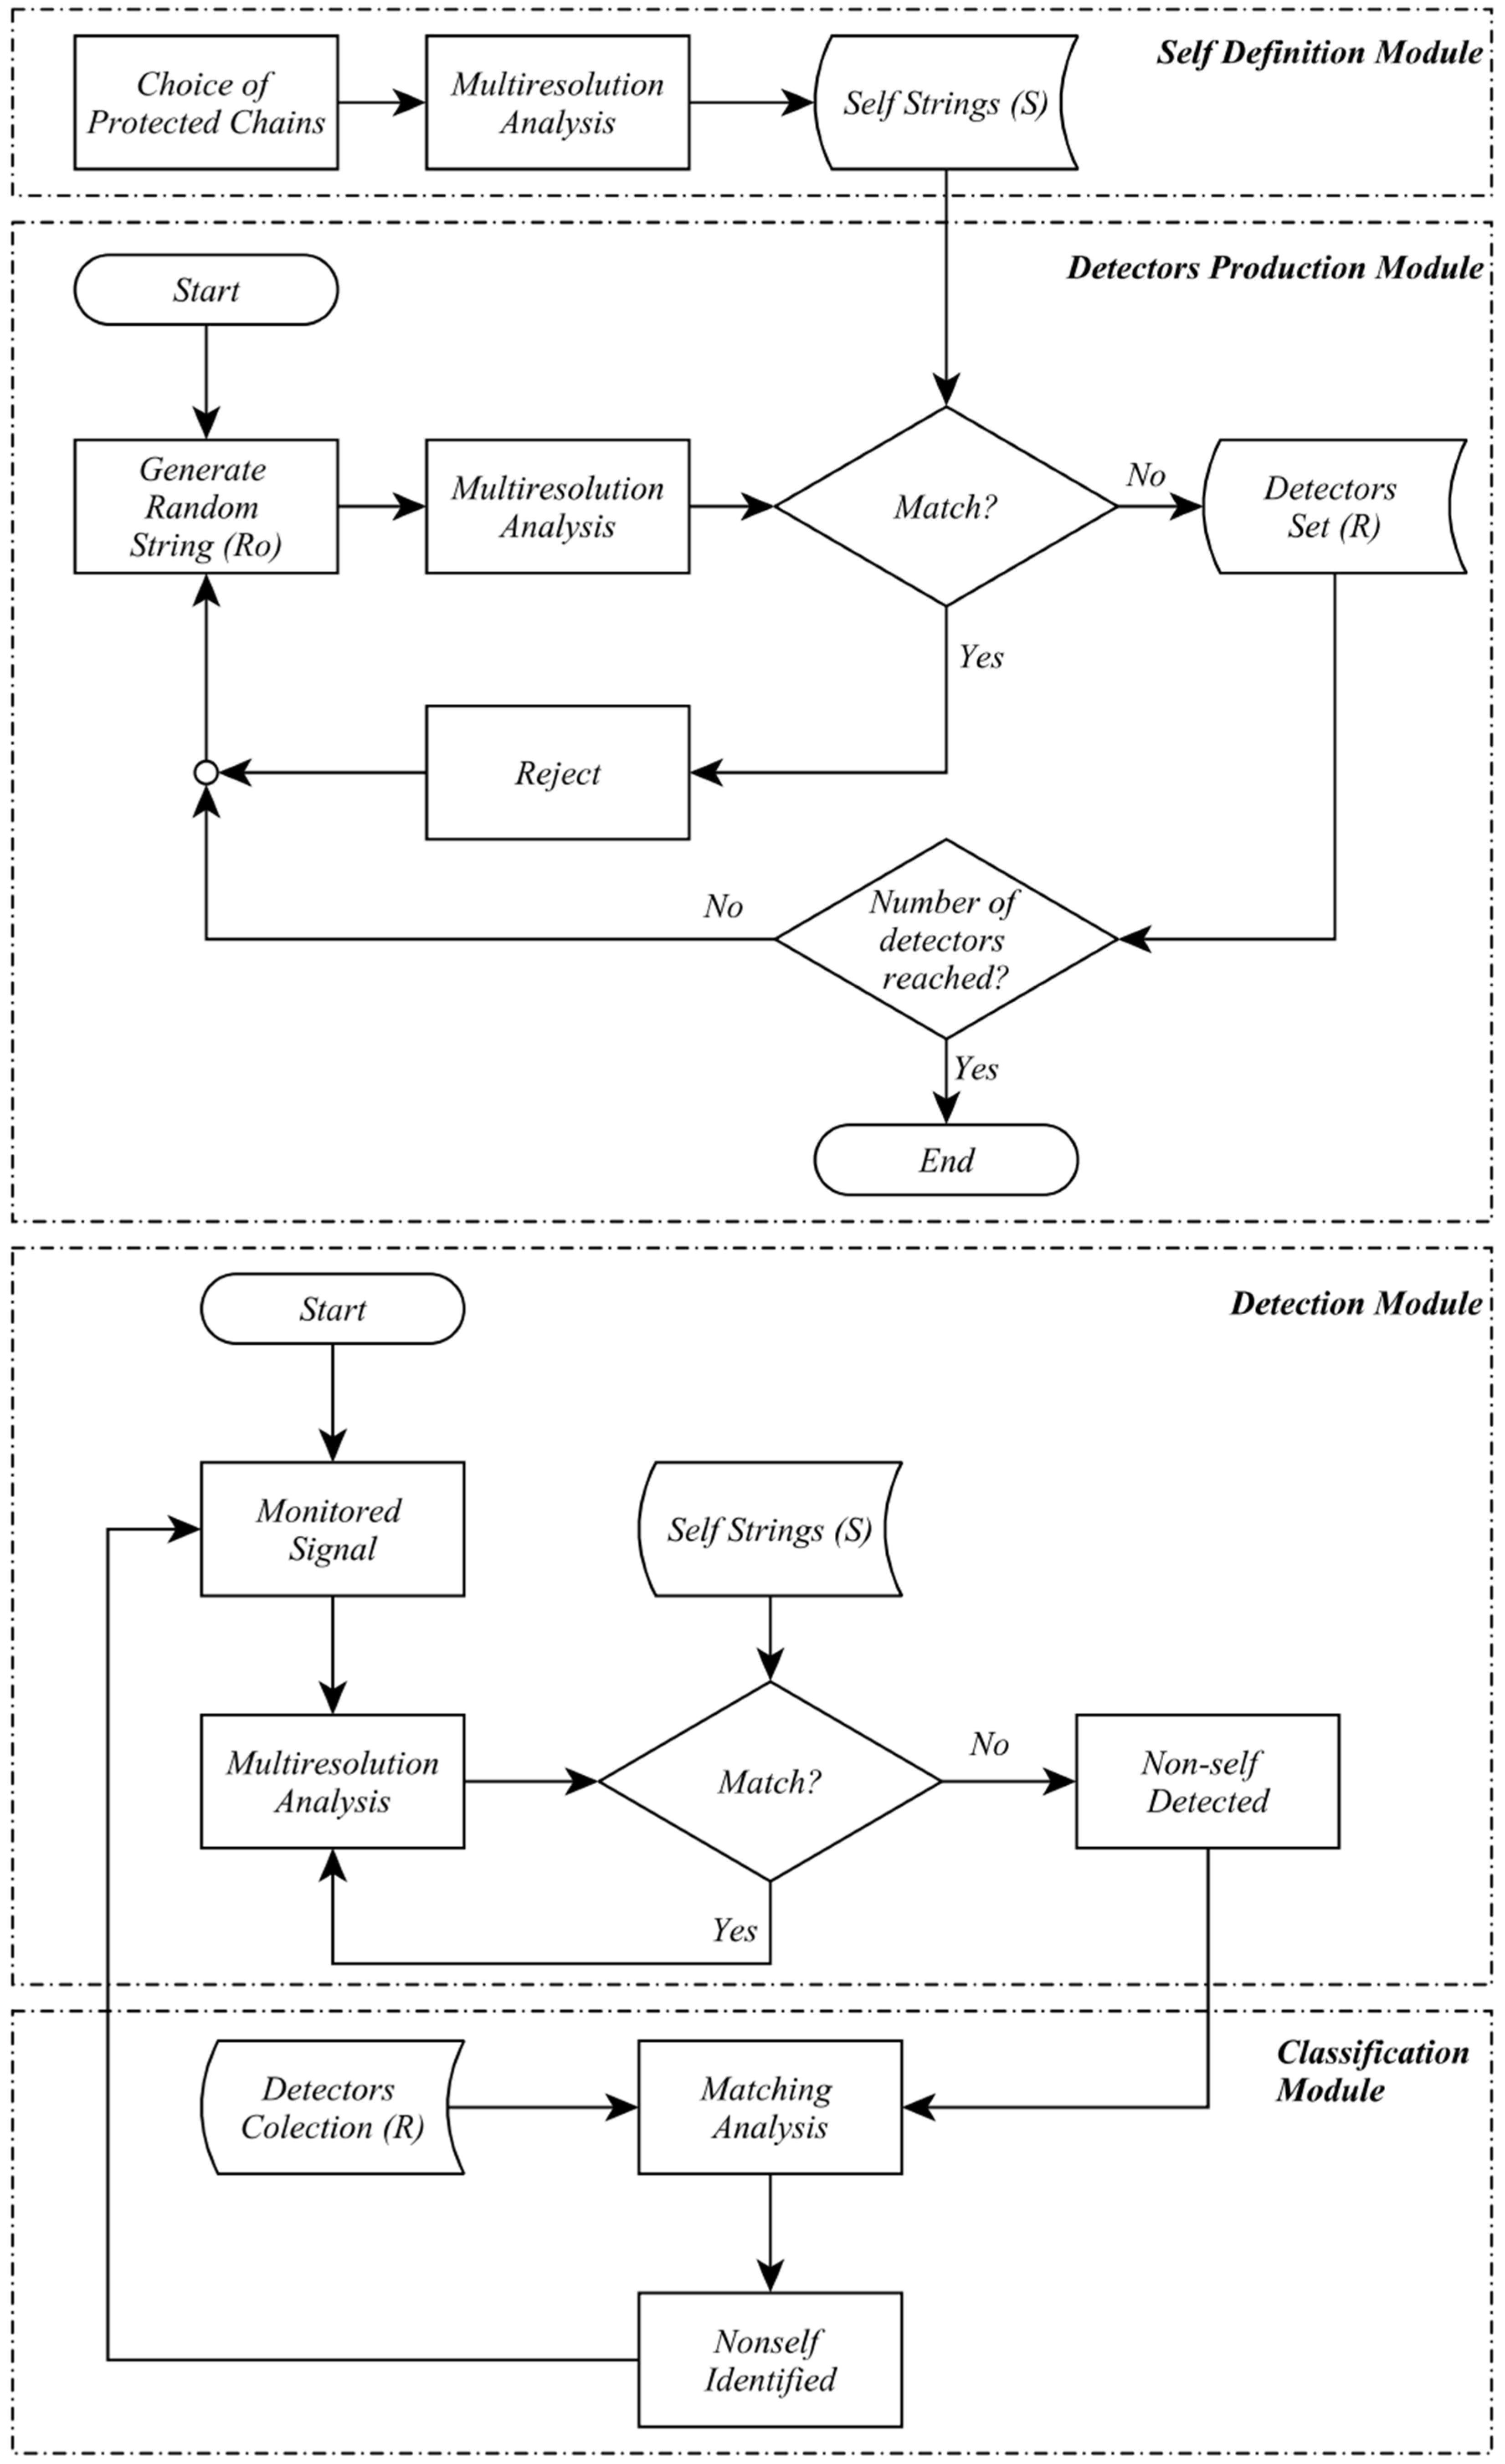
6] presents a method for detecting and classifying voltage disturbances in distribution power systems to assist with operation during faults and supervise the protection system. The proposed diagnostic tool is based on artificial immune systems, specifically the negative selection algorithm, and uses three-phase voltage measurements obtained at substations to monitor the system. The detectors are generated in the censoring phase, and the AIS monitors the process. This phase is executed offline and separated by phase, where each phase (three-phase system) has self-detectors. The monitoring phase is divided into three modules: realize the data acquisition, proper/non-proper discrimination, and classify the disturbances. The proposed algorithm demonstrates excellent results, with approximately 99.16% accuracy in every simulated sample. Therefore, the detector phase requires more computational time and is executed offline. However, the monitoring phase is very fast, allowing the algorithm to be used online, as decisions need to be made swiftly.
Reference [
7] explores various deep-learning architectures trained and validated using simulated data and tested with experimental data. The simulated data were augmented to generalize the results and address the discrepancies between simulated and measured data. The architectures, including LSTM, CNN, and a hybrid LSTM-CNN, were trained and validated with augmented datasets and then tested on field-acquired experimental data. Experimental validation focused on classifying interruptions and sag disturbances, with all the architectures successfully identifying sag signals. However, discrepancies arose in classifying interruption signals, with the LSTM-CNN with adjusted hyper-parameters proving superior. Overall, the LSTM-CNN with adjusted hyper-parameters consistently outperformed the others in classifying disturbances in simulated and experimental datasets, particularly excelling with transient disturbances.
In reference [
8], the paper addresses the real-time detection and classification of power quality disturbances in power delivery systems by proposing a sequential and multivariate detection method. This detector follows a non-parametric and supervised approach, learning nominal and anomalous patterns from training data that include clean and disturbed signals. Its multivariate nature allows for joint data processing from multiple meters, enabling quicker detection through cooperative analysis. The authors extend this supervised sequential detection method to a multi-hypothesis setting, aiming to classify disturbance events as quickly and accurately as possible in real time. This multi-hypothesis method requires a training dataset for each hypothesis, covering each disturbance type and the “no disturbance” case. The method’s asymptotic optimality in minimizing the average detection delay in the minimax sense was demonstrated. Through voltage disturbance simulations, the technique outperformed existing sequential detectors, ODIT and GLLR, in quick detection while maintaining the same false alarm rate. Analyzing four voltage disturbance types (sag, swell, oscillatory transient, and harmonics), the proposed sequential classifier achieved accurate classification—98.38% accuracy with a 0.38% false alarm rate under 20 dB SNR, and 100% accuracy with 0% false alarm under 30 dB SNR—within less than a waveform cycle on average (0.61 cycles, corresponding to 39.46 samples or 0.0123 s).
Reference [
9] proposes a PQD classification and detection method using image processing and deep learning-based auto-encoders. Fifteen simulated PQD signals are generated and converted into images, which are processed with a Gabor filter to obtain the original features. These features are then passed through a DAE neural network trained to learn the optimal, robust, and non-redundant features, followed by a SoftMax classifier for PQD classification. The method includes converting the images to grayscale for accurate temporal detection of disturbances. The proposed approach accurately classifies accurate and noisy PQDs, requires less computation time than methods like SVM, and effectively determines PQD temporal information. The model demonstrates over 97% classification accuracy with a 20 dB SNR, outperforming other popular PQD classification methods.
The high information-processing capacity and inherent resource optimization ability of biological systems render them of great interest to the scientific community. Ant colonies initially move without a specific destination but with a well-defined objective: the food search. Once the food is found, these small invertebrates return to the colony, leaving a pheromone trail that enables other ants to stop moving randomly and start following this trail [
10]. Algorithms inspired by neural networks aim to mathematically model the behavior of the central nervous system. The neuronal model in [
11] proposes computational elements derived from the physiological properties of a biological neuron and its connections (synapses). Artificial neurons, analogous to biological neurons, use mathematical techniques to store acquired knowledge and weigh it in decision-making. The main characteristic of neural networks is their ability to interact with their environment to recognize patterns that can solve problems, e.g., the adaptive resonance Theory, known as ART, is a cognitive and neural theory explaining how the brain independently learns to categorize, recognize, and anticipate objects and events within a dynamic environment [
12].
Advanced mathematical tools for signal processing are potent allies in addressing detection and classification problems. Ref. [
13] proposed a method based on combining discrete wavelet transform (DWT) with a wavelet network for diagnosing power quality disturbances. The technique eliminates the distorted waveform to obtain a signal with a higher signal-to-noise ratio. Then, DWT is used to extract the feature vectors for different disturbances. These information clusters are presented to the wavelet network for training and testing. The proposed method’s effectiveness is demonstrated through testing with various PQ disturbances, such as DC offset, harmonics, flicker, interrupt, sag, swell, notching, transients, and their combinations, achieving a classification accuracy of 98.18%. Compared to other methods, including wavelet transform, neural network, neural fuzzy, wavelet packet, support vector machines, and combinations thereof, the proposed wavelet network-based algorithm is faster, more accurate, and more robust, excelling in individual and combined PQ disturbance detections. Though one wavelet-fuzzy classifier matched its accuracy, it could not detect combined PQ events like the proposed algorithm.
Ref. [
14] presents a generalized version of the Fourier transform, the fractional Fourier transform (FRFT), which is used to extract signal features. The FRFT has an additional order control and can provide a signal’s intermediate time, frequency, and time–frequency representations. The order control offers multi-domain feature extraction, meaning the transform can be adjusted to emphasize different signal aspects depending on the application needs. This results in a robust feature matrix that can be classified under various conditions. In most cases, the proposed technique outperforms the Stockwell transform (ST)-based classification, especially under higher noise levels, validating with real PQDs from experimental setups that the results closely match the simulations. Evaluating the performance in terms of the TFRs, computational burden, processing time, feature effectiveness, and accuracy, the FRFT provides less sophisticated TFRs but allows easy visual characterization of PQDs. The FRFT approach processes 11 × 15,000 complex vectors of size 1 × 1280, whereas the ST handles 15,000 complex matrices of size 640 × 1280. Despite this, FRFT-DT is suitable for real-time applications due to its processing time and accuracy, while FRFT-BP can be used for faster classification with parallel processing. Overall, FRFT-based classification is deemed suitable for practical applications.
Artificial immune systems (AISs) are computational models inspired by the principles and processes of the biological immune system, which are designed to solve complex problems in various domains. These systems leverage the adaptive and learning capabilities of the natural immune system to detect anomalies, classify patterns, and optimize processes. AISs are particularly adept at recognizing and responding to novel and evolving threats due to their ability to learn from exposure to different patterns and adapt over time, making them highly effective in intrusion detection, fault diagnosis, and data-mining applications, where traditional methods may struggle with dynamic and unpredictable environments. By mimicking immune mechanisms like negative selection, clonal selection, and immune network theory, an AIS provides robust, flexible, and efficient solutions for various computational challenges.
This work presents a methodology for detecting and classifying voltage disturbances based on the association of wavelet transform via multiresolution analysis with the negative selection algorithm. Combining artificial immune systems (AISs) with advanced signal processing techniques like wavelet transform offers several significant advantages in the detection and classification of voltage disturbances in power systems:
Adaptation to Variable Environments: An AIS is known for adapting to dynamic and changing environments, providing crucial information in power grid contexts where operational conditions can rapidly fluctuate due to various internal and external influences.
Detection of Complex Anomalies: Wavelet transform effectively decomposes signals to capture features across different time and frequency scales. This enables precise detection of voltage disturbances occurring in various forms and durations, including rapid variations and transient oscillations.
Reduced False Positives: Combining AIS techniques such as negative selection algorithms helps reduce false positives by generating a set of “antibodies” (detectors) specifically sensitive to anomalous patterns in voltage signals. This enhances the detection and classification reliability.
Generalization Capability: AIS can generalize from limited examples, which is advantageous in voltage disturbance detection applications where disturbance characteristics can vary widely. This allows for a broader and more robust detection system application across different scenarios and operational conditions.
Efficient Real-Time Processing: Integrating an AIS with wavelet transform enables efficient real-time processing of voltage oscillograms collected at substations or monitoring points. This is critical for power systems where a rapid response to disturbance detection can aid in mitigating impacts on equipment and maintaining the energy supply quality.
Continuous Improvement with Adaptive Learning: An AIS features adaptive-learning capabilities, allowing continuous improvement of detection system performance as more data are collected and more disturbances are detected and classified. This contributes to enhanced accuracy over time.
In summary, leveraging artificial immune systems with techniques like wavelet transform provides a robust and practical approach to detecting and classifying voltage disturbances in power systems. This approach enhances the reliability, accuracy, and adaptability to varying electrical environment conditions. The proposed tool aims to assist professionals in diagnosing disturbances in the electrical system by analyzing voltage oscillographs collected at the substation output bus. This instrument seeks to prevent the deterioration of system components and avoid the improper triggering of protection devices.
3. Multiresolution Analysis
Multiresolution analysis is a powerful signal-processing technique that allows analysis of a signal at different resolution scales. It is beneficial for dealing with non-stationary signals, i.e., signals whose characteristics change over time. The principle of wavelet transform involves decomposing the original signal into different frequency components and time localization. This decomposition is achieved through a series of filtering and down-sampling operations, progressively reducing the temporal resolution of the signal.
Certain disturbances pose great difficulty in terms of their interpretation as the deformations caused in the signal by the disturbance can be extremely subtle. A convenient solution is to expand the signal, akin to a photographic “zoom”, at various levels of resolution. This strategy, termed multiresolution analysis (MRA), enables the inspection of the intricacies contained in the signal at various levels of detail. Adapting the resolution of a signal allows for processing only the relevant details for a given task [
21]. However, caution must be exercised to ensure that altering a signal’s resolution does not distort its interpretation of reality. This issue is often addressed in computational image processing.
Ref. [
22] studied the properties of the operator that approximates a signal at a specific resolution and showed that the information difference between the approximation of a signal at resolutions
and
can be extracted by decomposing the signal into an orthonormal wavelet basis
, where an orthonormal wavelet basis is a family of functions
constructed by dilating and translating a unique function
. This decomposition defines an orthogonal multiresolution called the wavelet representation. MRA is a method for constructing orthogonal wavelets [
23].
The multiresolution analysis of a signal consists of its representation as successive approximations, where each approximation is a smoothed version of the previous one [
24]. The multiresolution analysis calculates the signal’s approximation at various resolutions with orthogonal projections in different spaces
,
[
21]. Mathematically, multiresolution analysis is defined as an increasing sequence of closed subspaces
,
, which approximate the functions
and satisfy the following properties [
25].
The continuous wavelet transform of the function
is defined as:
where
is an orthonormal basis for
,
is the mother wavelet, and
are the translation and dilation parameters (scale).
Its discrete counterpart in practical applications can replace the continuous wavelet transform.
Restricting the dilation (
) and translation (
) parameters in Equation (1) to discrete values so that
and
with
and
varying over
and
and
fixed [
26], the wavelet function is rewritten as:
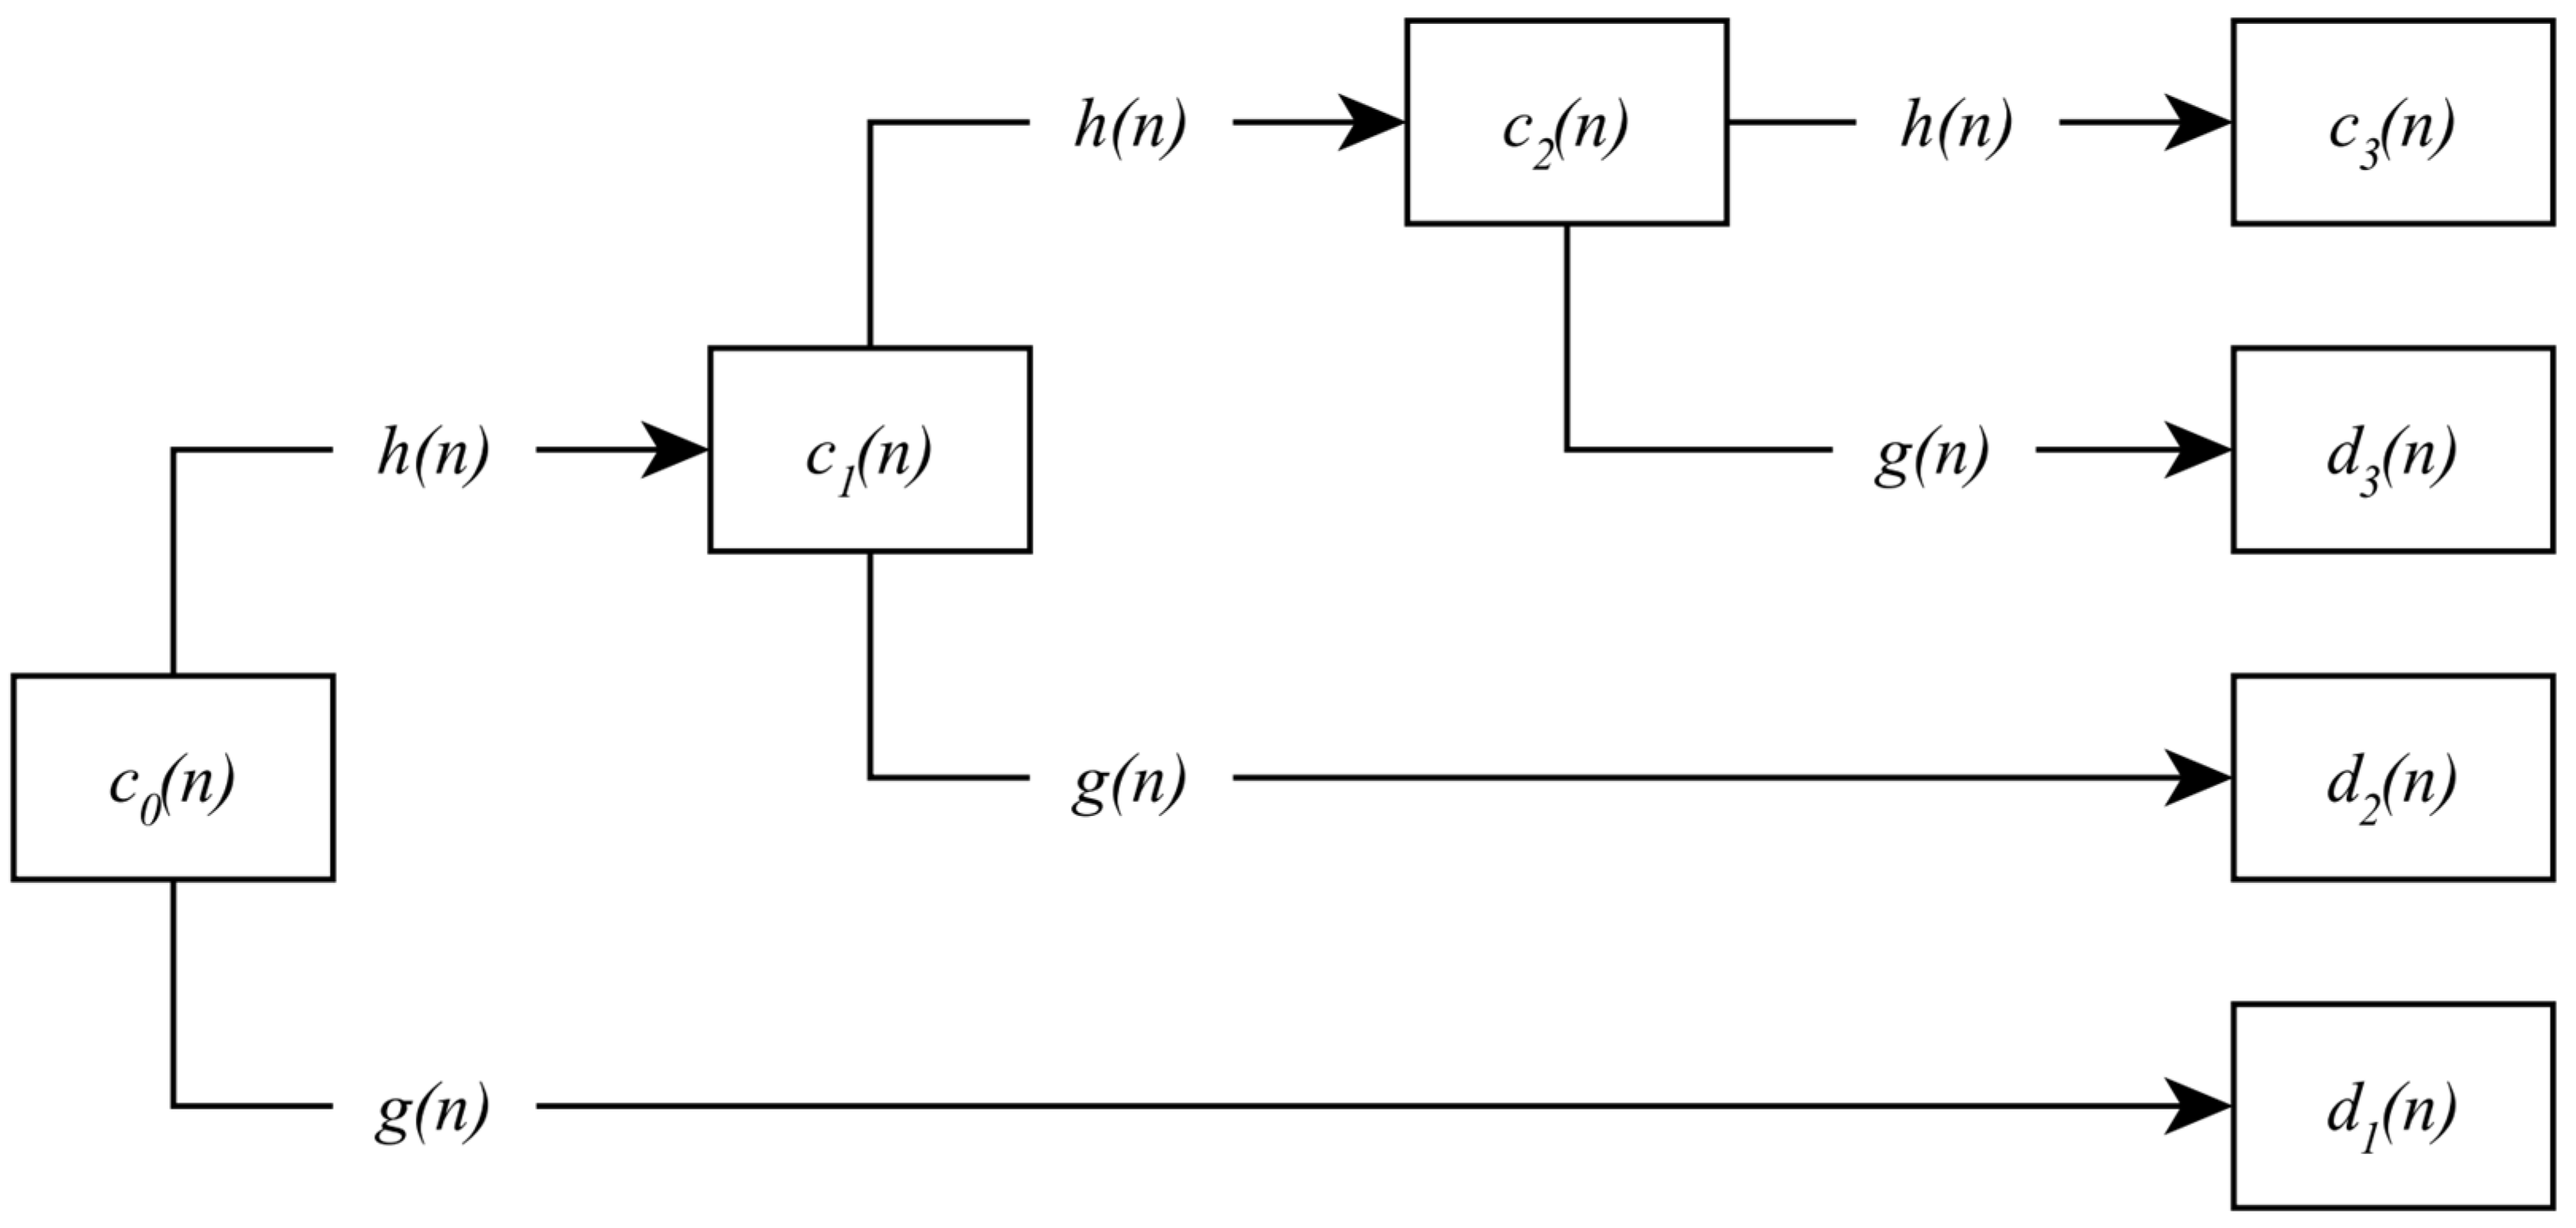
The signal decomposition is performed at different resolution levels with a low-pass filter
and a high-pass filter
. The approximation and detail coefficients are given by Equations (5) and (6), respectively.
Figure 3 shows the decomposition of a signal into three levels of resolution.
6. Results and Discussion
The system for diagnosing power quality disturbances in the medium-voltage distribution system is used to detect and classify eight different types of voltage anomalies: interruption (outage), harmonic distortion (total harmonic distortion—THD), voltage swell (swell), and voltage sag (sag) (with and without the presence of harmonics), oscillatory transients, and flicker (flicker). The results presented in this section refer to only phase A of the electrical system. However, the responses expressed in this text reflect what also occurs in the other phases of the electrical system regarding the tool’s capability to detect and classify disturbances.
6.1. Training and Testing Database
The database consists of 6000 samples for each of the nine operating conditions (one regular and eight types of disturbances), distributed in one of the three phases of the system, totaling 54,000 samples. As mentioned previously, the results discussed in this work refer to phase A of a fictitious three-phase power distribution system. Therefore, only a third of the samples produced are listed in this paper; more precisely, 18,052 simulations. The data were generated at a sampling rate of 256 samples per cycle (15.36 kHz) over seven cycles, with disturbances occurring during three of these cycles. The large number of operating conditions in the database ensures the visualization of the intrinsic dynamics of the power system. The database produced was divided into two groups. Approximately 27% of the samples were used for training (censoring stage), and another set of roughly 73% was used in the testing stage (monitoring stage). It is essential to highlight that all the data used in this study were obtained from simulations in MATLAB R2018b, 64-bit software using the equations in
Table 1. It should be noted that using mathematical models to produce the database has two goals: to solve the problem of accessing real data and to explore a wide range of simulations with varied parameters.
The simulated data were generated pseudo-randomly, producing a specific anomaly in one or more phases of the circuit. The randomization accounts for the variation of all the relevant parameters in
Table 1. It is worth noting that, following the guidelines of Normative Resolution No. 1000 [
28], the normal operating conditions (self) include a
5% variation of the nominal voltage (
Figure 5).
It is worth noting that normal conditions when considering a variation parameter seeking to meet regulatory requirements directly affect the system’s diagnostic capacity; e.g., sag-, swell-, and flicker-type disturbances can easily fill the “normality” spectrum.
6.2. Wavelet Transform
The versatility of the classifier system regarding the self/non-self (SNS) paradigm is optimized using Equation (8) to determine the partial match between points of an antigen chain and an antibody chain, with different tolerances adopted for the training phase (
3%) and the diagnostic phase (
12%). However, this flexibility can lead to the generation of inadequate antibodies that produce high compatibility between self and non-self signals. This fact can be easily observed in
Figure 6, which compares the signal under normal operating conditions with the flicker-type defect.
The primary advantage of wavelet transforms when used in signal processing, specifically when applied to detecting and classifying voltage disturbances in power systems, lies in the ability to analyze signals at multiple resolutions. Time–frequency localization provides a more effective capture of transient events localized in time, such as voltage spikes and dips. The wavelet transforms when forming an antibody, allowing the signal characteristics to become more pronounced and, consequently, increasing the robustness and discernment capability of the classifier system, which mitigates the chances of high compatibility between self and non-self. The proposed tool adopts the Daubechies wavelet family with a sixth-order filter (db6). It uses the first-order detail coefficients to form the detector chains, a strategy that enhances the contrast between the categories involved in the problem. The distinction effect produced by signal feature extraction via the wavelet transform can be seen in
Figure 7.
6.3. Disturbance Detection
The formation of a detector, according to the affinity criterion, occurs when the calculated compatibility is below the established affinity threshold, i.e.,
. The affinity threshold (
) adopted in the design process of the detector collection is 80%. Furthermore, artificial immune systems must ensure the diversity of the immunological repertoire, i.e., the ability of a single antibody to identify mutations of the same invading agent. Therefore, the number and diversity of detectors are directly related to the effectiveness of the classifier system. On the other hand, an extensive set of detectors implies the low efficiency of the tool. Thus, the repertoire should consist of the minimum necessary quantity that still represents the heterogeneity of invading agents. The set of detectors is formed by approximately 30% of the simulations performed for each type of disturbance, representing an estimated average of 600 detectors for each type of irregularity. The exact number of detectors per disturbance type is shown in
Table 2.
Despite the multivalence achieved with the relaxation of the matching function, complications can arise concerning the protected chains. One of the most severe consequences is the occurrence of false positives (FPs), i.e., defective signals classified as normal operating conditions. This error in detecting system failures perpetuates the irregularity, potentially causing damage to components of the power distribution system. Another effect is related to episodes of false negatives (FNs), i.e., situations where normal operating conditions are identified as anomalous. This phenomenon can cause the improper activation of protection devices, interrupting the power supply and unnecessarily dispatching maintenance teams.
Several studies using the artificial immune system (AIS), e.g., [
6,
29,
30,
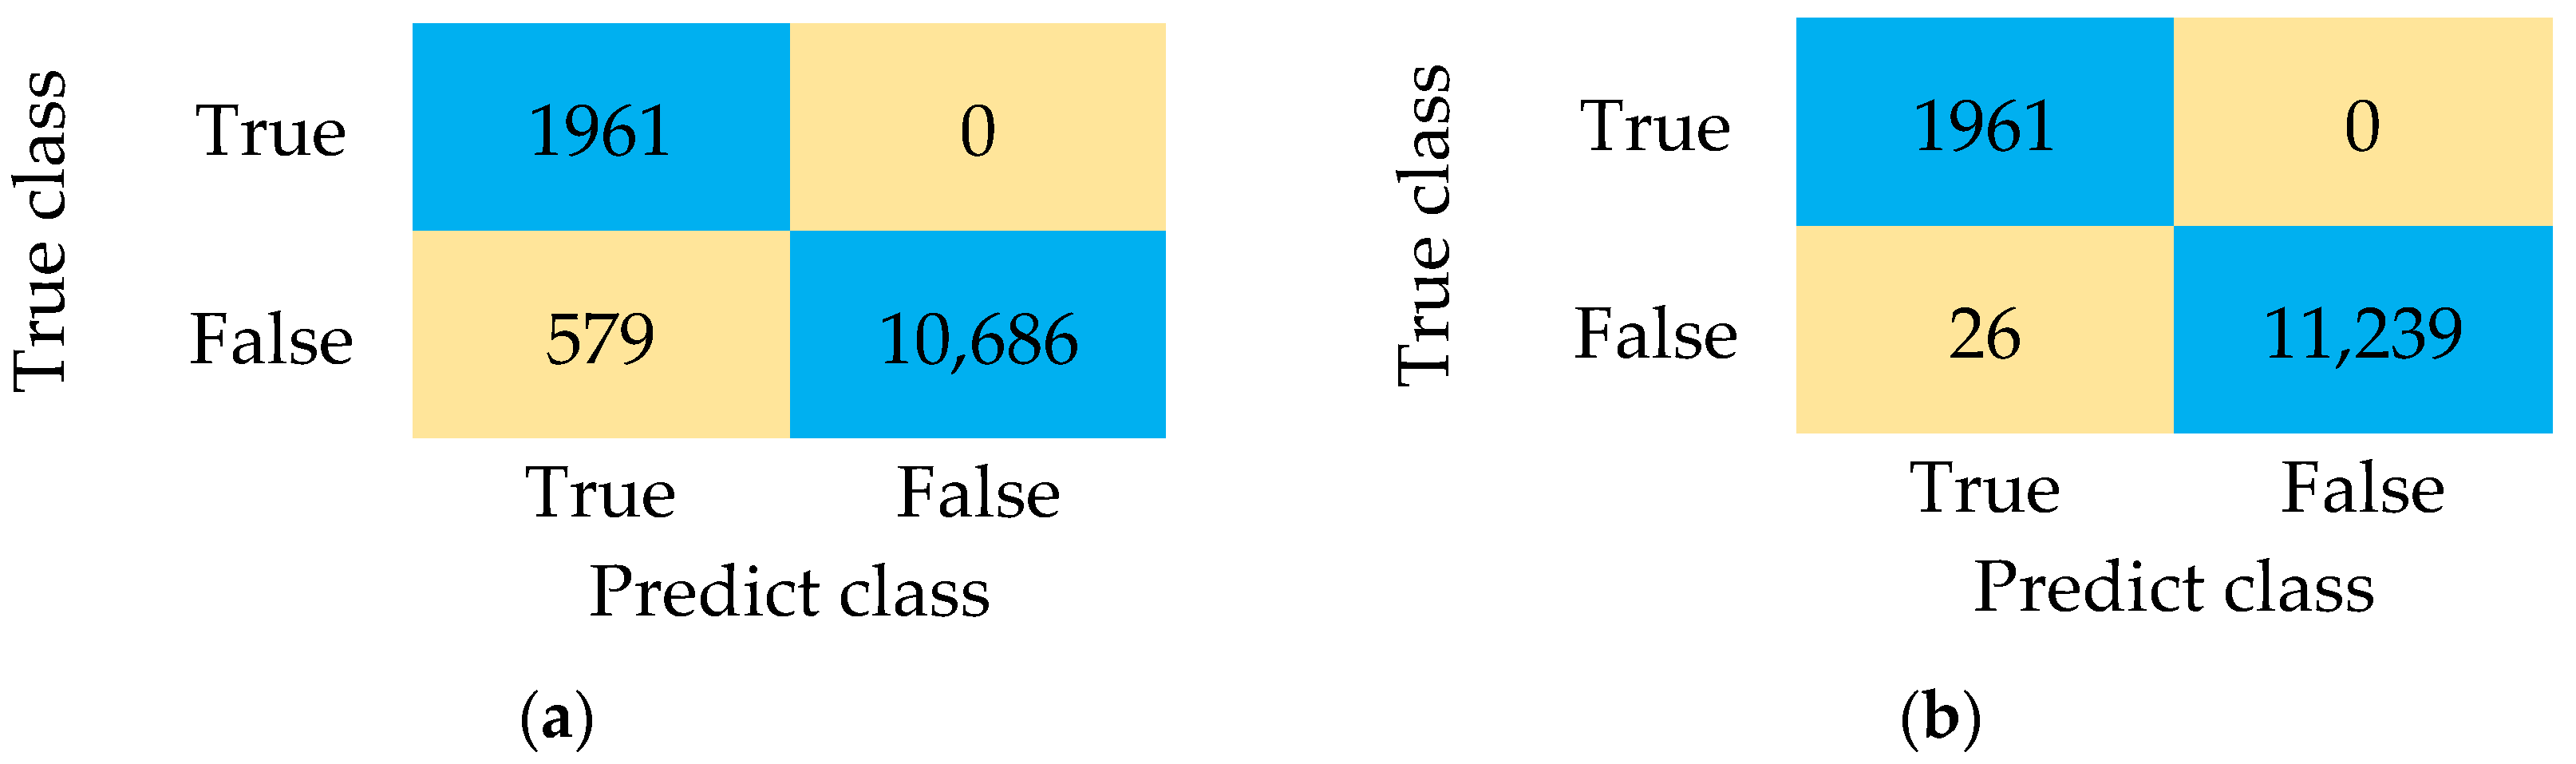
31], have demonstrated it to be a robust anomaly detection and classification tool. However, the specificities of specific problems can make the classification of certain patterns complex. The wide range of possible variations in defect conditions highlights such specificities and complexities in the detection and classification process. The detector module evaluation used 13,226 signals, of which 11,265 were distorted samples. However, the system had difficulties recognizing certain anomalies with the traditional NSA, failing to detect 579 defective samples.
On the other hand, the proposed model (NSWA) is significantly improved, reducing the number of false positives. The detector module recognized 11,239 of the 11,265 abnormal conditions, going from 579 to 26 detection errors, demonstrating the high reliability of the system in preventing the deterioration of electrical network elements. One of the most comprehensive ways to represent the result of evaluating binary classification is using confusion matrices [
32]. The confusion matrices presented in
Figure 8 demonstrate the improvement in the detection process and consequent reduction in false positives using the NSWA compared to the NSA.
Flicker, sag, swell, and oscillatory transient disturbances are events misclassified as normal operation. These disturbances have significant consequences for both the electrical system and consumers. They can cause everything from visual discomfort and production stoppages to damage to equipment and system components, highlighting the importance of effective monitoring and mitigation strategies to ensure the stability and reliability of the electrical grid. The main consequences of each type of disturbance are shown in
Table 3.
6.4. Disturbance Classification
In addition to detecting deformities in waveforms, complete diagnosis, i.e., detection and classification, is essential. The correct identification of irregularities preserves the components of the electrical power system. It ensures that problems related to the quality of the energy supplied to the consumer are quickly corrected, avoiding discomfort and losses. In this sense, the superiority of the proposed method (NSWA) compared to the conventional NSA is notable. The confusion matrix in
Figure 9 demonstrates that despite a significant accuracy rate (92%), the system faces difficulties classifying exceedingly similar patterns. A brief analysis of
Figure 9 allows the repercussions of the similarity between signals in the classification process to be easily visualized, even with a significant repertoire of detectors, e.g., the high interlacing between signals considered normal and flicker-type disturbances.
As already proven in the defect detection process, using a tool designed for signal processing combined with intelligent systems is a powerful strategy for addressing pattern recognition problems. The combination of multiresolution analysis with the negative selection algorithm significantly improved the ability to identify voltage disturbances. The confusion matrix shown in
Figure 10 demonstrates this significant improvement in the overall accuracy rate, jumping from 92% to 97%.
The negative selection wavelet algorithm presents promising results, especially considering the immense variation in the evaluated signals.
Table 4 allows for a comparative analysis of the classifier system’s performance without and using multiresolution analysis. Despite the negative selection algorithm (NSA)’s performance, incorporating the wavelet transform makes the system considerably more capable of more accurate diagnostics, reducing the overall error rate from 7.78% to 2.8%. An individual inspection by the type of fault, specifically flickers and oscillatory transients, highlights the superiority of the negative selection wavelet algorithm (NSWA) over the NSA in distinguishing between self and non-self and recognizing signal specificities. This performance gain demonstrates the system’s ability to mitigate incorrect power system functioning.
Due to the subtlety that may exist in the formation of the disturbance, it is known that disturbances such as flicker and oscillatory transient are more complex in the recognition stage. However, the proposed method drastically reduced the number of false positives and improved the ability to distinguish between normal signals and oscillations and transient oscillatory disturbances. It is relevant to note that the introduction of multiresolution analysis (MRA) caused incredible difficulty in recognizing disturbances of the type (sag/THD), confusing 21% of the samples with the disturbance type (swell/THD). However, from an operational perspective, fault sensitivity is still ensured. This characteristic is worrying since sags and swells are disturbances that represent two opposites regarding voltage levels. However, the presented tool guarantees more excellent reliability because, despite the relevant error, a defect is still signaled in the system, reducing the exposure time to the deterioration condition.
The evaluation metrics shown in
Table 5 provide a more generalized assessment of the proposed classifier model. Notably, all the performance indicators of the NSWA surpass those of the NSA. Although the NSA presents good precision responses, the proposed model’s precision, sensitivity, and harmonic mean show significant improvement.
Evaluating models using metrics such as the accuracy, precision, recall, specificity, and F1-score provides a comprehensive understanding of their performance and highlights areas for improvement. Accuracy indicates the overall correctness of the model by measuring the ratio of correctly predicted instances to the total instances, with the negative selection algorithm (NSA) achieving 98.3% and the negative selection wavelet algorithm (NSWA) improving to 99.3%. Precision measures the proportion of true positive predictions to the total predicted positives, reflecting the relevance of the positive predictions, with the NSA at 93.7% and the NSWA improving to 97.1%. Recall, or sensitivity, assesses the ability of the model to identify all the relevant instances (true positives) and shows the capability of the model to capture actual disturbances, with the NSA at 91.7% and the NSWA advancing to 96.7%. Specificity measures the proportion of true negative predictions to the total actual negatives. This is crucial for understanding the model’s ability to correctly identify non-disturbances, with the NSA at 99% and the NSWA at a higher 99.6%. The F1-score, the harmonic mean of the precision and recall, balances the two metrics to provide a single measure of the model’s accuracy in handling imbalanced datasets, with the NSA scoring 92.2% and the NSWA significantly improving to 96.9%. These metrics demonstrate that the NSWA outperforms the NSA in all aspects, providing a more reliable and precise tool for detecting and classifying voltage disturbances in power systems.
6.5. Assessment of the Generalization of the Proposed Model
It is essential to use tools to assess the generalization capacity of pattern classification tools. K-fold cross-validation provides a robust and reliable estimate of model performance on unseen data. By dividing the dataset into multiple subsets, or “folds”, and training the model on different combinations of these subsets while testing on the remainder, cross-validation mitigates the risk of overfitting and underfitting. This process ensures that the model is not just adjusting to the training set’s peculiarities but learning patterns that can be generalized to new data. Furthermore, cross-validation maximizes the available data, making the evaluation more efficient and representative of the model’s performance in real-world situations.
K-fold cross-validation is widely recognized as a practical methodology for evaluating the generalizability of pattern classification techniques. However, for the proposed method, especially when used in evaluation (training/testing), the alternation of data between training and testing predicted by the k-fold method must be adjusted to the specific problem under analysis. It is observed that the data used in the training and diagnostic phases of the proposed classifier system correspond to 27% and 73%, respectively. This differs from approaches commonly used in other classification tools, e.g., artificial neural networks, where approximately 75% of the data are intended for training and 25% for testing. In the present study, the system performs training with significantly smaller data than the testing stage. However, it is recognized that this distribution alone is insufficient to mitigate the risk of overfitting. Thus, pseudo-random variations (randomization of input variables) were introduced into the dataset before its presentation to the classifier system.
Table 6 presents the percentages of success for seven different simulations.
The results presented in the table indicate the evaluation of the generalization capacity of a proposed model for detecting and classifying voltage disturbances in the electrical power system. The data show consistently high performance for most disorder categories. Specifically, the ratings for flicker, normal, outage, sag, swell, swell/THD, harmonics, and oscillatory transient disturbances remain above 95%, with some categories, such as normal and harmonics, reaching 100% across multiple ratings. However, the sag/THD detection and classification have relatively lower accuracy, ranging between 77.90% and 81.40%, indicating a possible area for improvement of the model. Overall, the model demonstrates significant robustness in its ability to generalize to most voltage disturbances, which suggests promising effectiveness in practical applications in monitoring and controlling electrical power quality.
6.6. Computational Efficiency and Potential Impact of Implementation
The tool presented in this paper was developed and evaluated with MATLAB R2018b, 64-bit software. The hardware used was an Intel(R) Core(TM) i7-6700k 4.00 GHz equipped with 32 GB RAM. It is noteworthy that part of the code developed uses parallel programming concepts, when applicable, using the four cores available in the processor. The time for the detection and classification of each sample is shown in
Table 7.
In addition to the improvements in disturbance detection and classification, the reduction in the computational cost required in the disturbance detection and classification process using the negative selection wavelet algorithm is notable. This is due to the excellent information aggregation capacity of multiresolution analysis. However, it is essential to highlight that the proposed tool works as a prelude to a commercial device; factors such as the adopted programming language directly interfere with the system’s performance.
Implementation has a minimal potential impact and requires minimal resources. The elements necessary for the insertion of the negative selection wavelet algorithm classifier system focus on the implementation of the software linked to the substation monitoring system since the data acquisition system is present in this type of installation. Unlike monitoring systems based on the smart grid concept, in which sensors and meters are installed at strategic points in the electrical energy system, the NSWA uses existing elements in substations.
The voltage disturbance detection and classification system based on the association of the negative selection algorithm and the wavelet transform (negative selection wavelet algorithm) is a powerful support tool for power substation operators. The methodology offers greater precision and speed in identifying anomalies, allowing a more agile and effective response to potential problems, which reduces the downtime and increases the reliability of the energy supply. Furthermore, the combined approach improves the system’s ability to continuously adapt and learn in the face of new disturbances, resulting in a more robust and resilient operation. Finally, implementing such a system can optimize operational costs, minimize the need for emergency maintenance, and extend the useful life of substation equipment.


