1. Introduction
1.1. Findings from Part A: Isotropic Materials
In the first installment of this two-part series, we introduced a novel concept in wind turbine technology: a flexible wind turbine blade designed for passive control, aimed at enhancing aerodynamic performance and operational safety. The flexible blade concept is particularly suited for small Wind Energy Conversion Systems (WECSs) because their presence would reduce the cost of an active electromechanical control system [
1].
This innovative approach utilizes inherent blade elasticity to allow for bend–twist deformation around its longitudinal axis under bending loads. This deformation is critical for the blade’s ability to self-regulate in response to varying wind conditions, thereby optimizing its power profile without the need for electrical or hydraulic control systems.
The philosophy of passive control in wind energy systems is based on the turbine’s ability to respond to excitation loads and the blade’s capacity to function as a feedback mechanism, adapting to operational conditions to meet design criteria. The primary design objectives include maximizing power yield, minimizing operational loads, and optimizing control within the WECS. Implementing a passive pitch control philosophy can drastically reduce blade aerodynamic loads and overall structural stress. Turbines equipped with passive pitch-controlled blades could potentially eliminate the need for complex, moving parts found in actively controlled variable-pitch blades. Instead, these blades adjust their geometry in response to aerodynamic loads, combining the benefits of variable-pitch blades—such as responsiveness, maximization of energy yield, and eventually reduced energy cost—with the simplicity of manufacturing akin to fixed-pitch blades. An additional advantage of passive pitch control blades is their quicker response time, presenting a viable solution for enhancing the feasibility of small WECS.
Our initial findings, presented in the first paper, demonstrated several key advantages of this flexible blade design over conventional straight blades. The study highlighted that the flexible blades could cap their maximum rotational speed and mechanical power output at high wind speeds, exhibiting a controlled and sustainable energy production model. Notably, these blades began generating power at lower wind speeds and maintained a stable power output even as conditions became less favorable, showcasing their efficiency and the effectiveness of the passive control mechanisms integrated into the design.
However, the study also uncovered certain challenges. The passive control mechanisms did not activate at the intended wind speeds, revealing a significant gap between design expectations and actual performance. This misalignment, along with observations of a ‘hook-like’ feature in the Power Coefficient (Cp) versus Tip–Speed Ratio (TSR) behavior under high wind conditions, suggested areas for further refinement.
As we move into the second part of this series, our focus will shift to addressing these challenges through advanced material usage, design optimization, and enhanced testing procedures. We aim to build on the promising foundation laid by the initial study, refining our designs and methodologies to fully realize the potential of passive control in wind turbine blades. This next phase will explore in depth the opportunities from integration of GFPR-composite-layered orientation to improve blade flexibility and performance.
1.2. Literature Review
The literature on the development of wind turbine blades, particularly those crafted from fiber-reinforced polymers such as GFRP, highlights a significant focus on enhancing blade performance through passive control mechanisms. This review underscores the role of composite layup orientations in achieving desired aerodynamic responses and structural efficiencies, particularly through the implementation of bend–twist coupling.
Liebst [
2] in 1986 pioneered studies in this area by examining the effects of wind gusts on curved blades. He noted that such blades could autonomously adjust their geometry, specifically by reducing their pitch angle, thus mitigating aerodynamic loads significantly. This early work set the stage for further exploration into blades that could passively adapt to varying wind conditions. Subsequently, Infield and Feuchtwang in 1995 [
3] and in 1999 [
4] introduced the concept of “stretch–twist coupled” blades, which were designed to control rotor behavior in runaway scenarios. Their innovative use of a helical layup incorporating both glass and carbon fibers proved effective, as demonstrated by their experimental results aligning closely with predictive models.
Furthering this research, Lobitz and Veers [
5,
6] conducted studies throughout the late 1990s, focusing on how twist–bend coupling could enhance annual energy production and ensure stability in utility-sized rotors. Their findings revealed that even minor blade twists could result in significant increases in energy output and provided insights into managing common stability issues like flutter and divergence. Similarly, Eisler and Veers [
7] examined adaptive blades on a 26 m diameter variable speed rotor.
The ability of bending twist-coupled blades to attenuate (or exacerbate) the cyclic loading has been investigated by Lobitz and Laino [
8], in 1999, and Lobitz, Veers, and Laino [
9] in 2000 for a 33 m diameter rotor employing three different control strategies: constant speed stall-controlled, variable speed stall-controlled, and variable speed pitch-controlled. Results for the constant speed stall-controlled case indicate that twist-coupling toward stall produces significant increases in fatigue damage, and for a range of wind speeds in the stall regime apparent stall flutter behavior is observed.
The early 2000s saw continued advancements with researchers like Zuteck [
10] exploring the passive control capabilities of bend–twist coupling in larger blades. His work emphasized the necessity of reducing torsional stiffness to enable sufficient blade twisting, suggesting that such designs could also support larger rotor diameters and thus lower energy costs. This line of inquiry was extended by Larwood and Zuteck [
11], who compared backward-swept blades to traditional designs, finding improvements in energy capture without additional mechanical strain on the turbine.
Sandia National Laboratories [
12] further built on these concepts with their sweep-twist adaptive rotor (STAR) technology, which aimed to enhance rotor efficiency by incorporating passive twisting in blade designs. Their findings demonstrated notable increases in energy capture without exacerbating blade root bending moments, marking a significant step forward in rotor design.
Moreover, the research community has persistently explored optimizing composite ply structures to maximize the mechanical coupling effects. Earlier studies [
13,
14] and more recent analyses [
15] have investigated optimal configurations of bidirectional layups that balance structural integrity with dynamic performance. Tsai and Ong [
16] specifically addressed the optimal angular orientation of fibers to maximize bend–twist coupling, pinpointing a 20-degree orientation relative to the span-wise axis as the most effective for certain blade cross-sections.
These collective efforts in the literature underscore a continuous strive towards refining wind turbine blade designs through innovative material use and structural strategies, setting a firm foundation for further advancements in this field. This historical context serves as a critical backdrop for the current study, which aims to push the boundaries of wind turbine blade technology by exploring the integration of GFRP in non-traditional blade configurations, assessing their viability and performance in modern wind energy applications.
1.3. Scope
This second installment of our study series delves deeper into the exploration of novel wind turbine blade designs by examining a curved blade with a rectangular cross-section made from layered Glass-Fiber-Reinforced Polymer (GFRP) in preferential orientation. This design is a departure from the first installment, which focused on a curved blade with a conventional NACA 4415 airfoil cross-section crafted from isotropic materials. The use of a simple, non-airfoil, rectangular shape cut directly from a sheet of composite material signifies a shift towards more practical and cost-effective manufacturing processes within a research laboratory setting.
The decision to utilize a rectangular cross-section arises from the necessity (recognized from the previous installment) to enhance blade flexibility and is driven by the limitations of our current simulation tools, which are not yet capable of accurately predicting the aerodynamic behavior of complex curved shapes with oriented GFRP layers. This simpler shape allows for investigation of the strategic orientation of GFRP layers without the need for creating multiple molds for shaping and curing, significantly reducing both the complexity and the cost of blade production. Such an approach facilitates rapid iterations and modifications, crucial for advancing blade technology through experimental research.
While adopting a non-airfoil shape inevitably leads to certain performance trade-offs, such as reduced aerodynamic efficiency and altered lift-to-drag ratios, this study primarily focuses on evaluating the mechanical performance of the blade under operational conditions. We aim to assess whether the increased mechanical flexibility, achieved through the preferential orientation of GFRP layers, can be tailored in order to meet specific design goals: achieving a tailored startup at lower wind speeds, maintaining stable power output between nominal and cutoff speeds, and safely stopping the turbine when wind speeds exceed operational thresholds.
The overarching goal of this research is to provide preliminary findings on the effectiveness of using layered GFRP composites in enhancing the flexibility of wind turbine blades. By exploring these non-traditional design and material choices, we hope to offer insights that could benefit small-scale wind turbines or other applications where the ease and cost of manufacturing are more critical than maximizing energy output at an affordable cost. Ultimately, the results from this investigation may open new avenues for future studies into unconventional blade shapes and materials, potentially broadening the scope of design strategies in small wind turbine converter systems and supporting the evolution towards more sustainable and adaptable energy solutions.
2. Methodology
2.1. Overview
In this study, we aim to explore the potential of tailoring the orientation of layered Glass-Fiber-Reinforced Polymer (GFRP) materials to influence the bend–twist deformation of a wind turbine blade, thereby tailoring its aerodynamic performance. This paper presents wind tunnel results for a single curved layered GFRP blade with a rectangular cross-section, selected as the optimal from a series of specimens. The focus of our analysis is on the power versus wind speed tests and the Coefficient of Power (Cp) versus Tip–Speed Ratio (λ). The objectives are threefold: to achieve nominal power output at nominal wind speed, maintain this output between nominal and cutoff speeds, and halt the blade operation when wind speeds exceed safe operational thresholds.
To this end, several blade specimens with varying layer counts and dimensions were fabricated. Of these, we present results from the specimen designated as number 010, identified as the optimal design based on preliminary tests. This specimen measures approximately 155 mm in length, and when mounted on the rotor hub—which has a diameter of approximately 55 mm—the tip’s radius extends to 172.5 mm.
The methodology section of this paper will provide a comprehensive overview of the experimental approach undertaken to evaluate the aerodynamic performance of the optimized blade. Although a detailed discussion of the Blade Geometry Algorithm is beyond the scope of this paper, as it will be covered extensively in a subsequent study, we direct the interested reader to the first part of this series which provides an overview. This will set the stage for a deeper understanding of the blade design principles under investigation.
Furthermore, we will detail the test campaign executed for these blades, emphasizing the experimental setups and key findings. This includes a thorough description of the measurement apparatus and the configuration of the wind tunnel used during the tests. By presenting these methodologies, this paper aims to provide clear insights into the experimental procedures and the rationale behind the design choices, supporting the validity of the results obtained from this innovative study.
2.2. Blade Geometry Algorithm
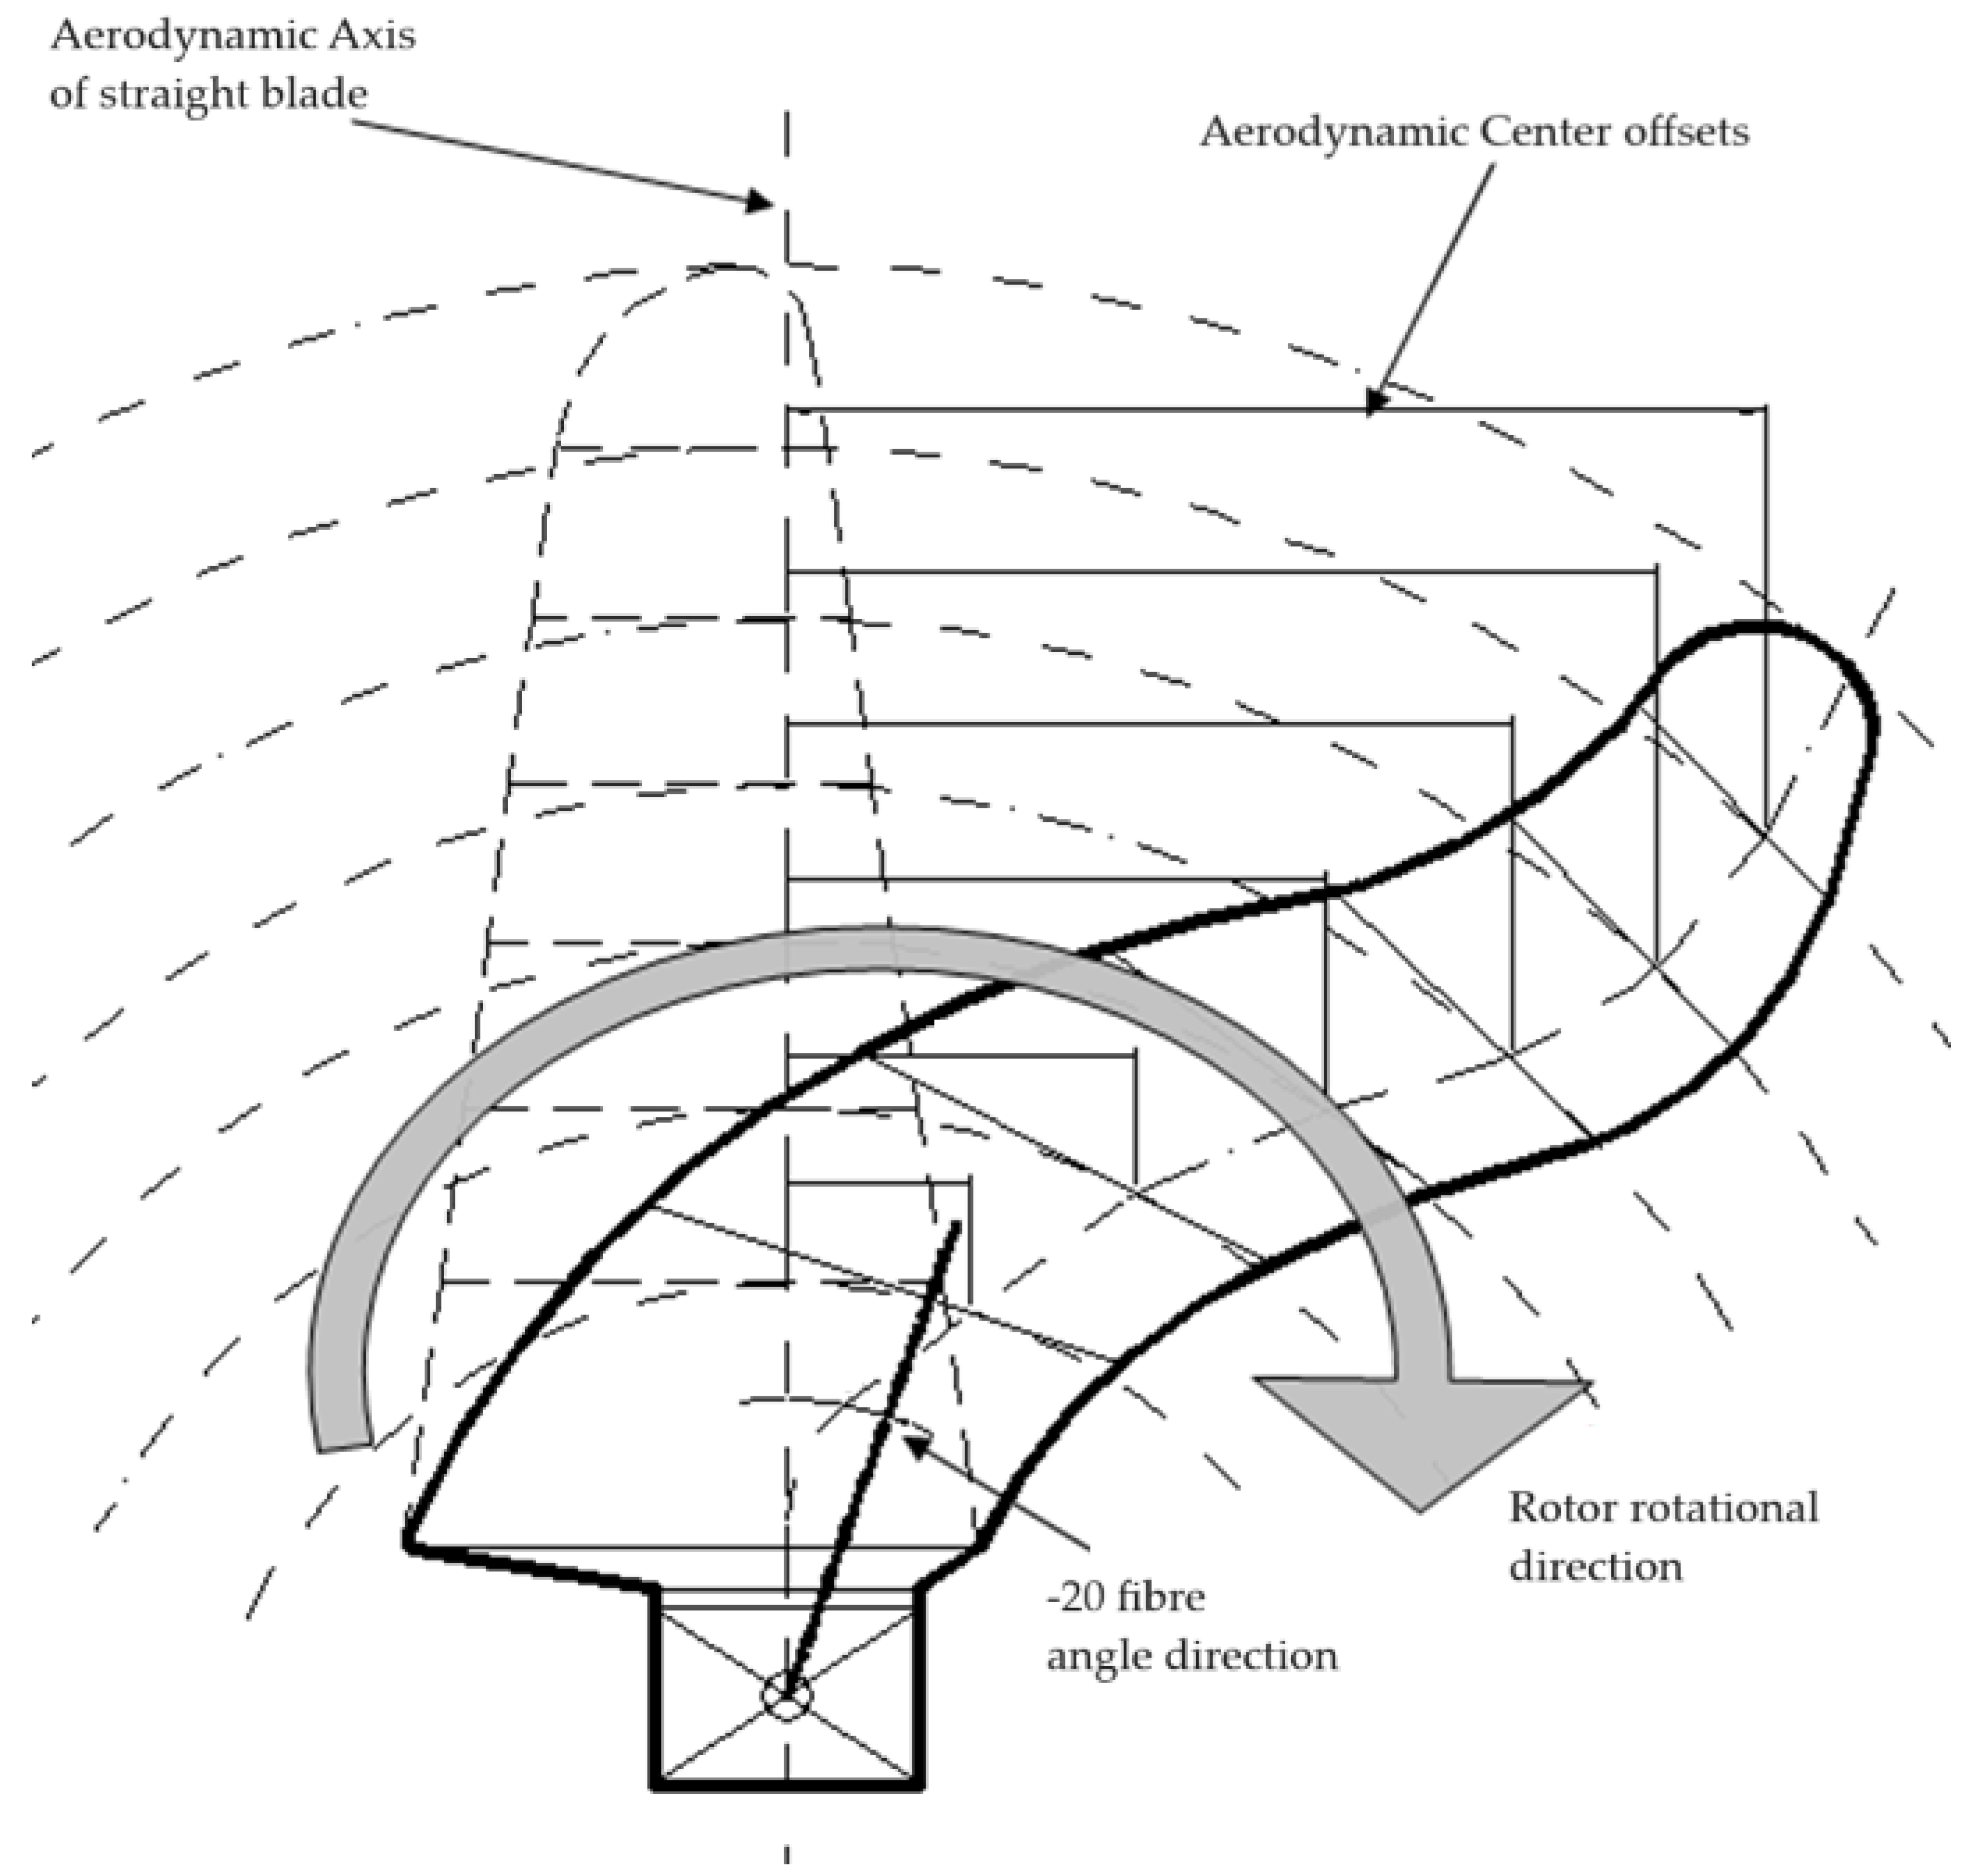
Figure 1 introduces the core concept by comparing straight and curved blades. The curved blade is divided into three sections: the root section, the control section, and the tip section. The root section, which constitutes 25% of the blade length, is engineered for high rigidity to ensure stability. The control section, making up 50% of the blade length, is designed for necessary elasticity to facilitate aerodynamic control. The tip section, comprising the remaining 25% of the blade length, is optimized for enhanced elasticity to respond quickly to wind changes. This segmentation ensures that each part of the blade performs optimally under varying operational conditions.
The curved blade uses the same aerodynamic cross-sectional profiles as the straight blade, but the profiles for the curved blade are offset by specific angles at different radii. This introduces torsional deformation without altering the chord length or other geometric characteristics, maintaining consistent aerodynamic properties. The offset induces bend–twist coupling under aerodynamic loads, affecting the torsional response of the curved blade.
Part A of this series [
17] provided a detailed examination of the aerodynamic behavior of wind turbine blades under various conditions utilizing the NACA4415 airfoil profile. It highlighted how blade geometry interacts with wind conditions to achieve specific aerodynamic responses. For instance, entering aerodynamic stall under high wind speeds helps prevent damage and maintain efficiency. Key design criteria include quick startup to respond to changing wind conditions, achieving nominal power output at nominal wind speeds, maintaining stable power output from nominal to cutoff speeds, and initiating stalling mechanisms at high wind speeds to prevent damage.
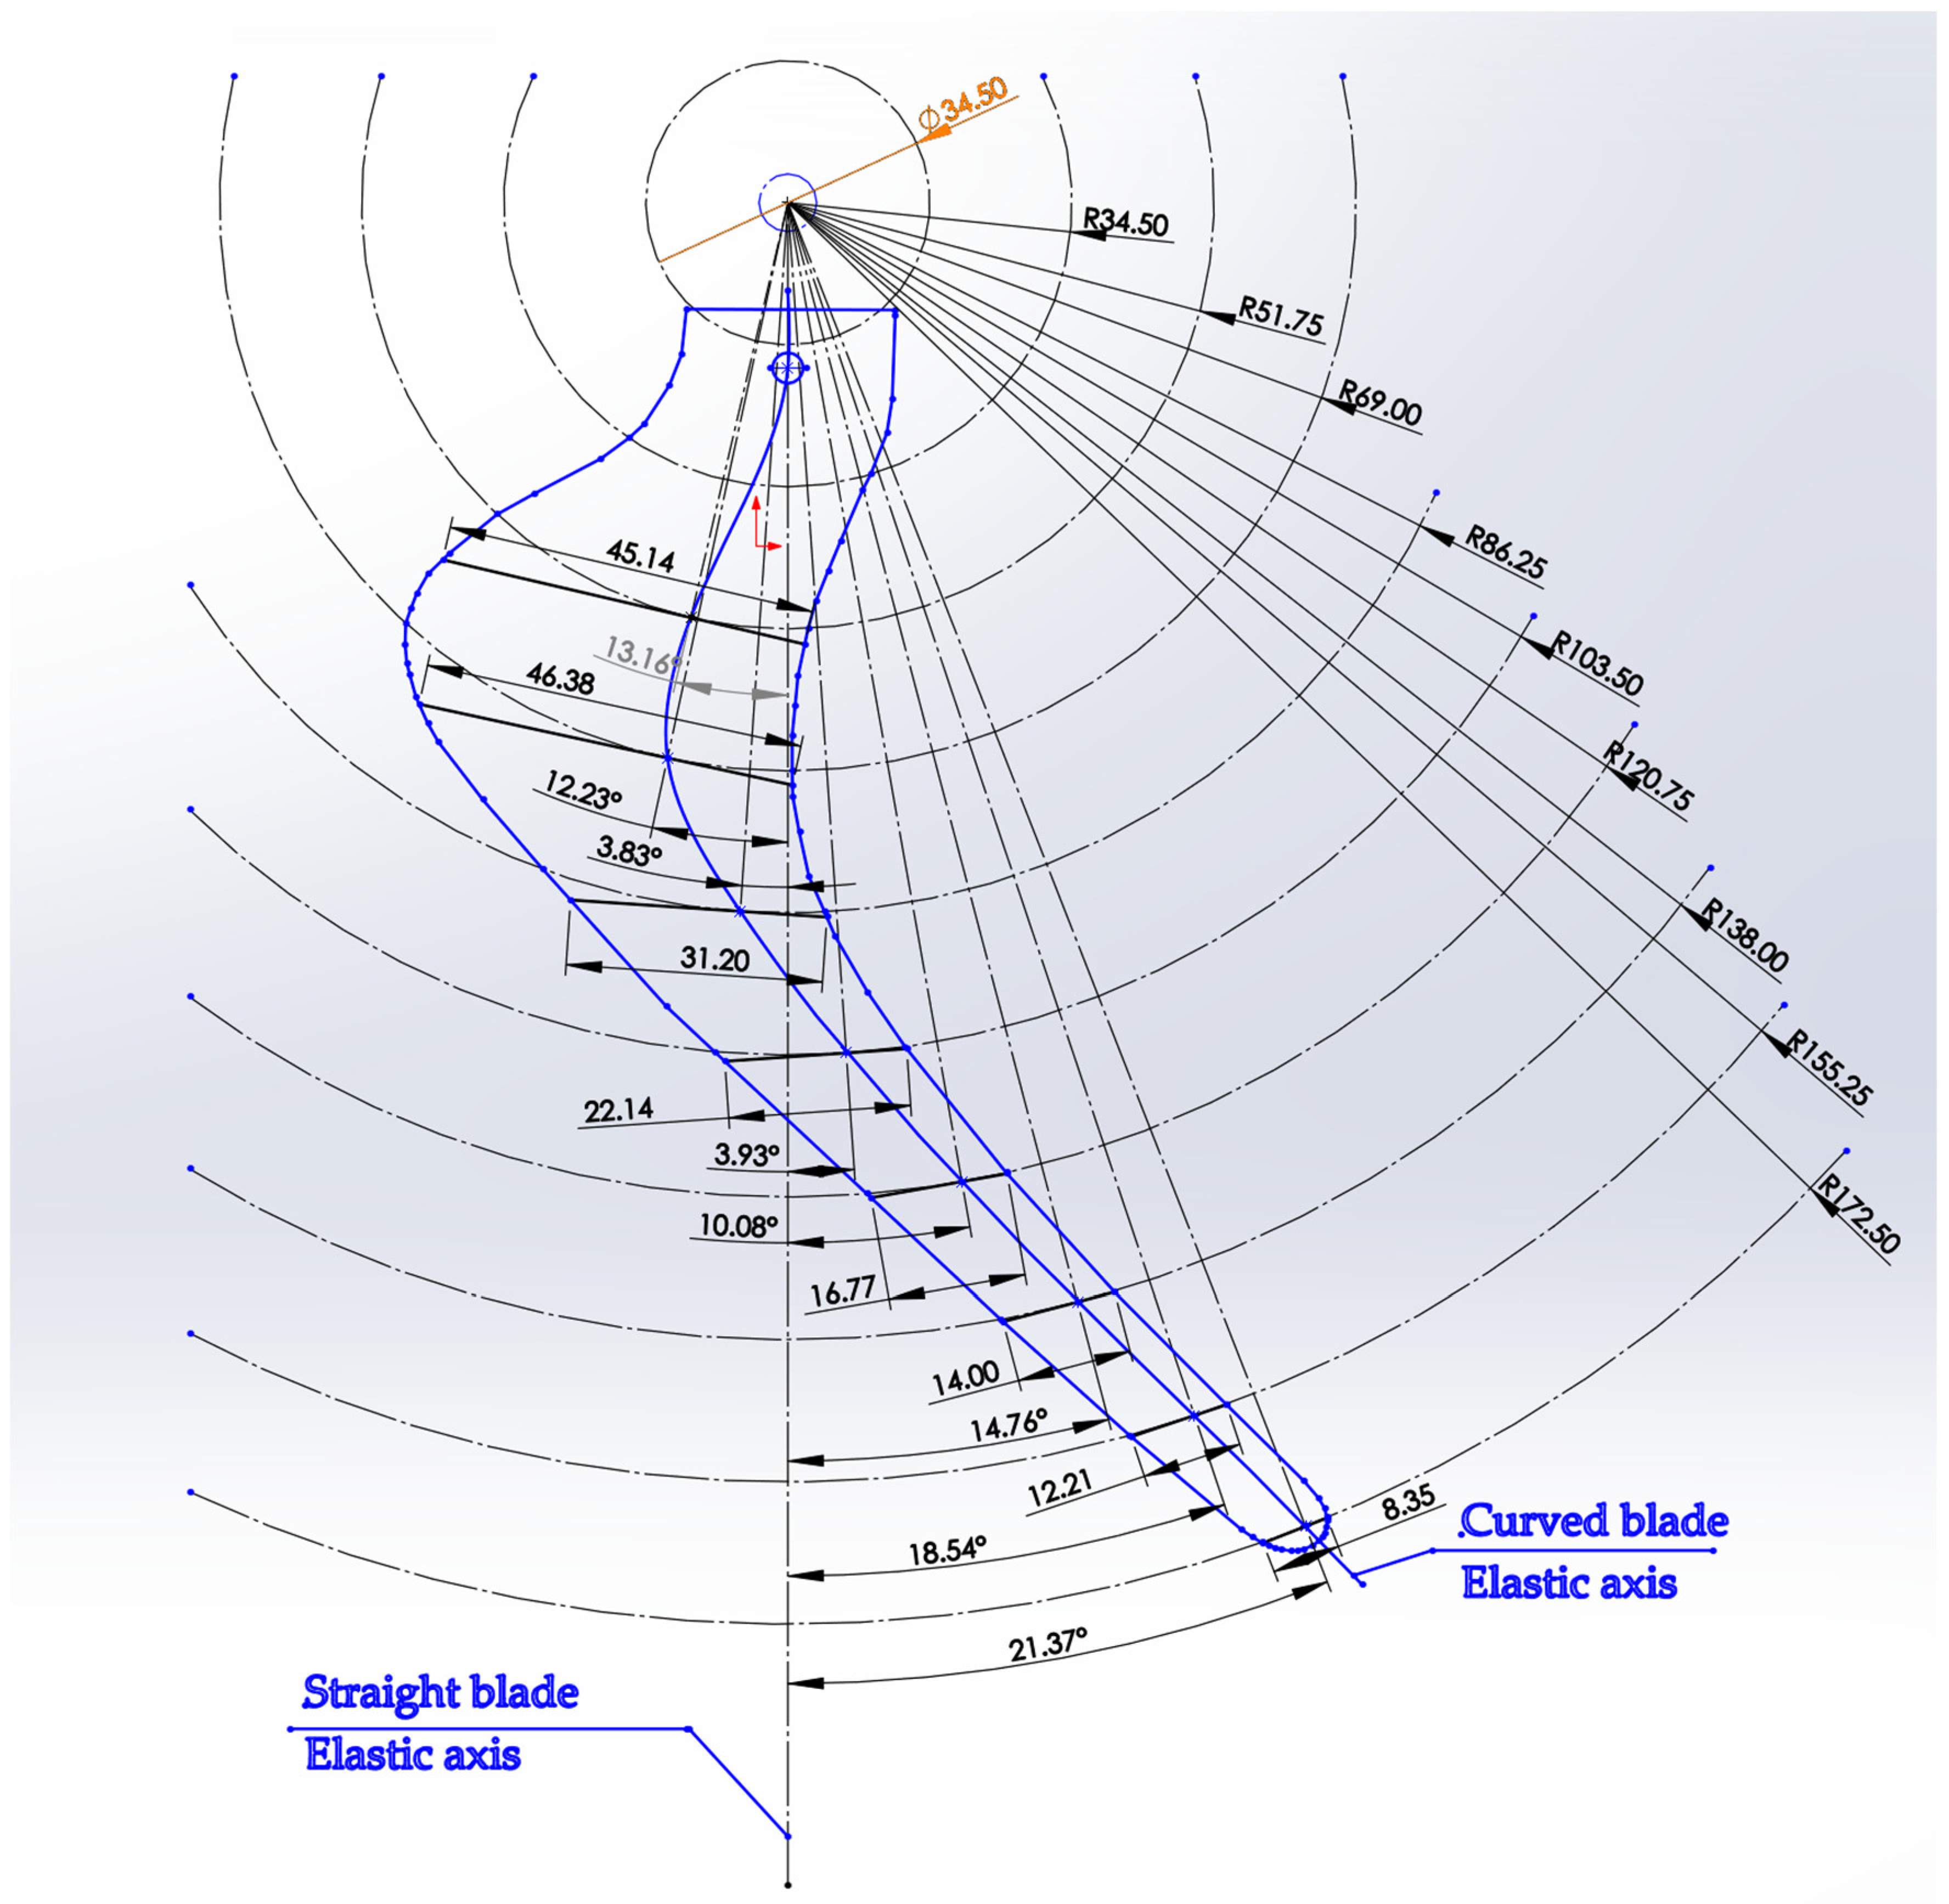
Figure 2 provides an overview of the curved blade geometry derivation algorithm and the various steps involved. Initially, a straight/rigid blade is designed using geometry derived from an aerodynamic code. This code incorporates the Larsen, Frandsen, Soeresen, and Courtney [
18] theoretical framework for aerodynamic behavior modeling. Additionally, it utilizes enhancements based on Glauert’s theory for airfoils and airscrews as described in Désiré Le Gouriérès’s “Les Éoliennes” [
19] and incorporates aspects of the Hansen Blade Element Momentum method [
20]. Key parameters include nominal power, wind speed, radial chord length distribution, and pitch angle distribution, with adjustments possible to enhance algorithm precision. The curved blade geometry builds on these parameters with the addition of eccentricity, which increases torsional loads and rotations. The process involves modifying profile segments based on initial eccentricity assumptions, calculating bending-torsional deformation using finite element analysis, and optimizing blade geometry in CAD software (Solidworks 2020).
Structural analysis in Dassault Solidworks involves fixing the blade edge to the hub, applying aerodynamic loads, and measuring deformation. The blade edge attached to the hub is fixed in all degrees of freedom, while the opposite edge remains entirely free, without any rotational or translational constraints. Load modeling reflects the dynamic pressure of the wind, adopting an inverse triangular thrust distribution. This load distribution assumes zero pressure load at the blade root and maximum pressure load at the tip, representative of typical operational thrust distribution near rated power. The optimization of eccentricity and chord length is based on experience and expertise. Prototypes are manufactured and tested, followed by iterative improvements.
For a more detailed presentation of the wind blade design algorithm, the interested reader should refer to Part A of this series [
17].
2.3. GFRP Blade Materials, Fabrication, and Rotor Assembly
In the development of Glass-Fiber-Reinforced Polymer (GFRP) blades, the design extends beyond just the curved planform geometry to also include the orientation of the composite material layers. Given the complexities of constructing a real model with varying fiber orientations across each section of the blade, a uniform fiber orientation was adopted across the span of the micro model blade. However, incorporating different angle orientations throughout the span could potentially provide additional flexibility tailoring.
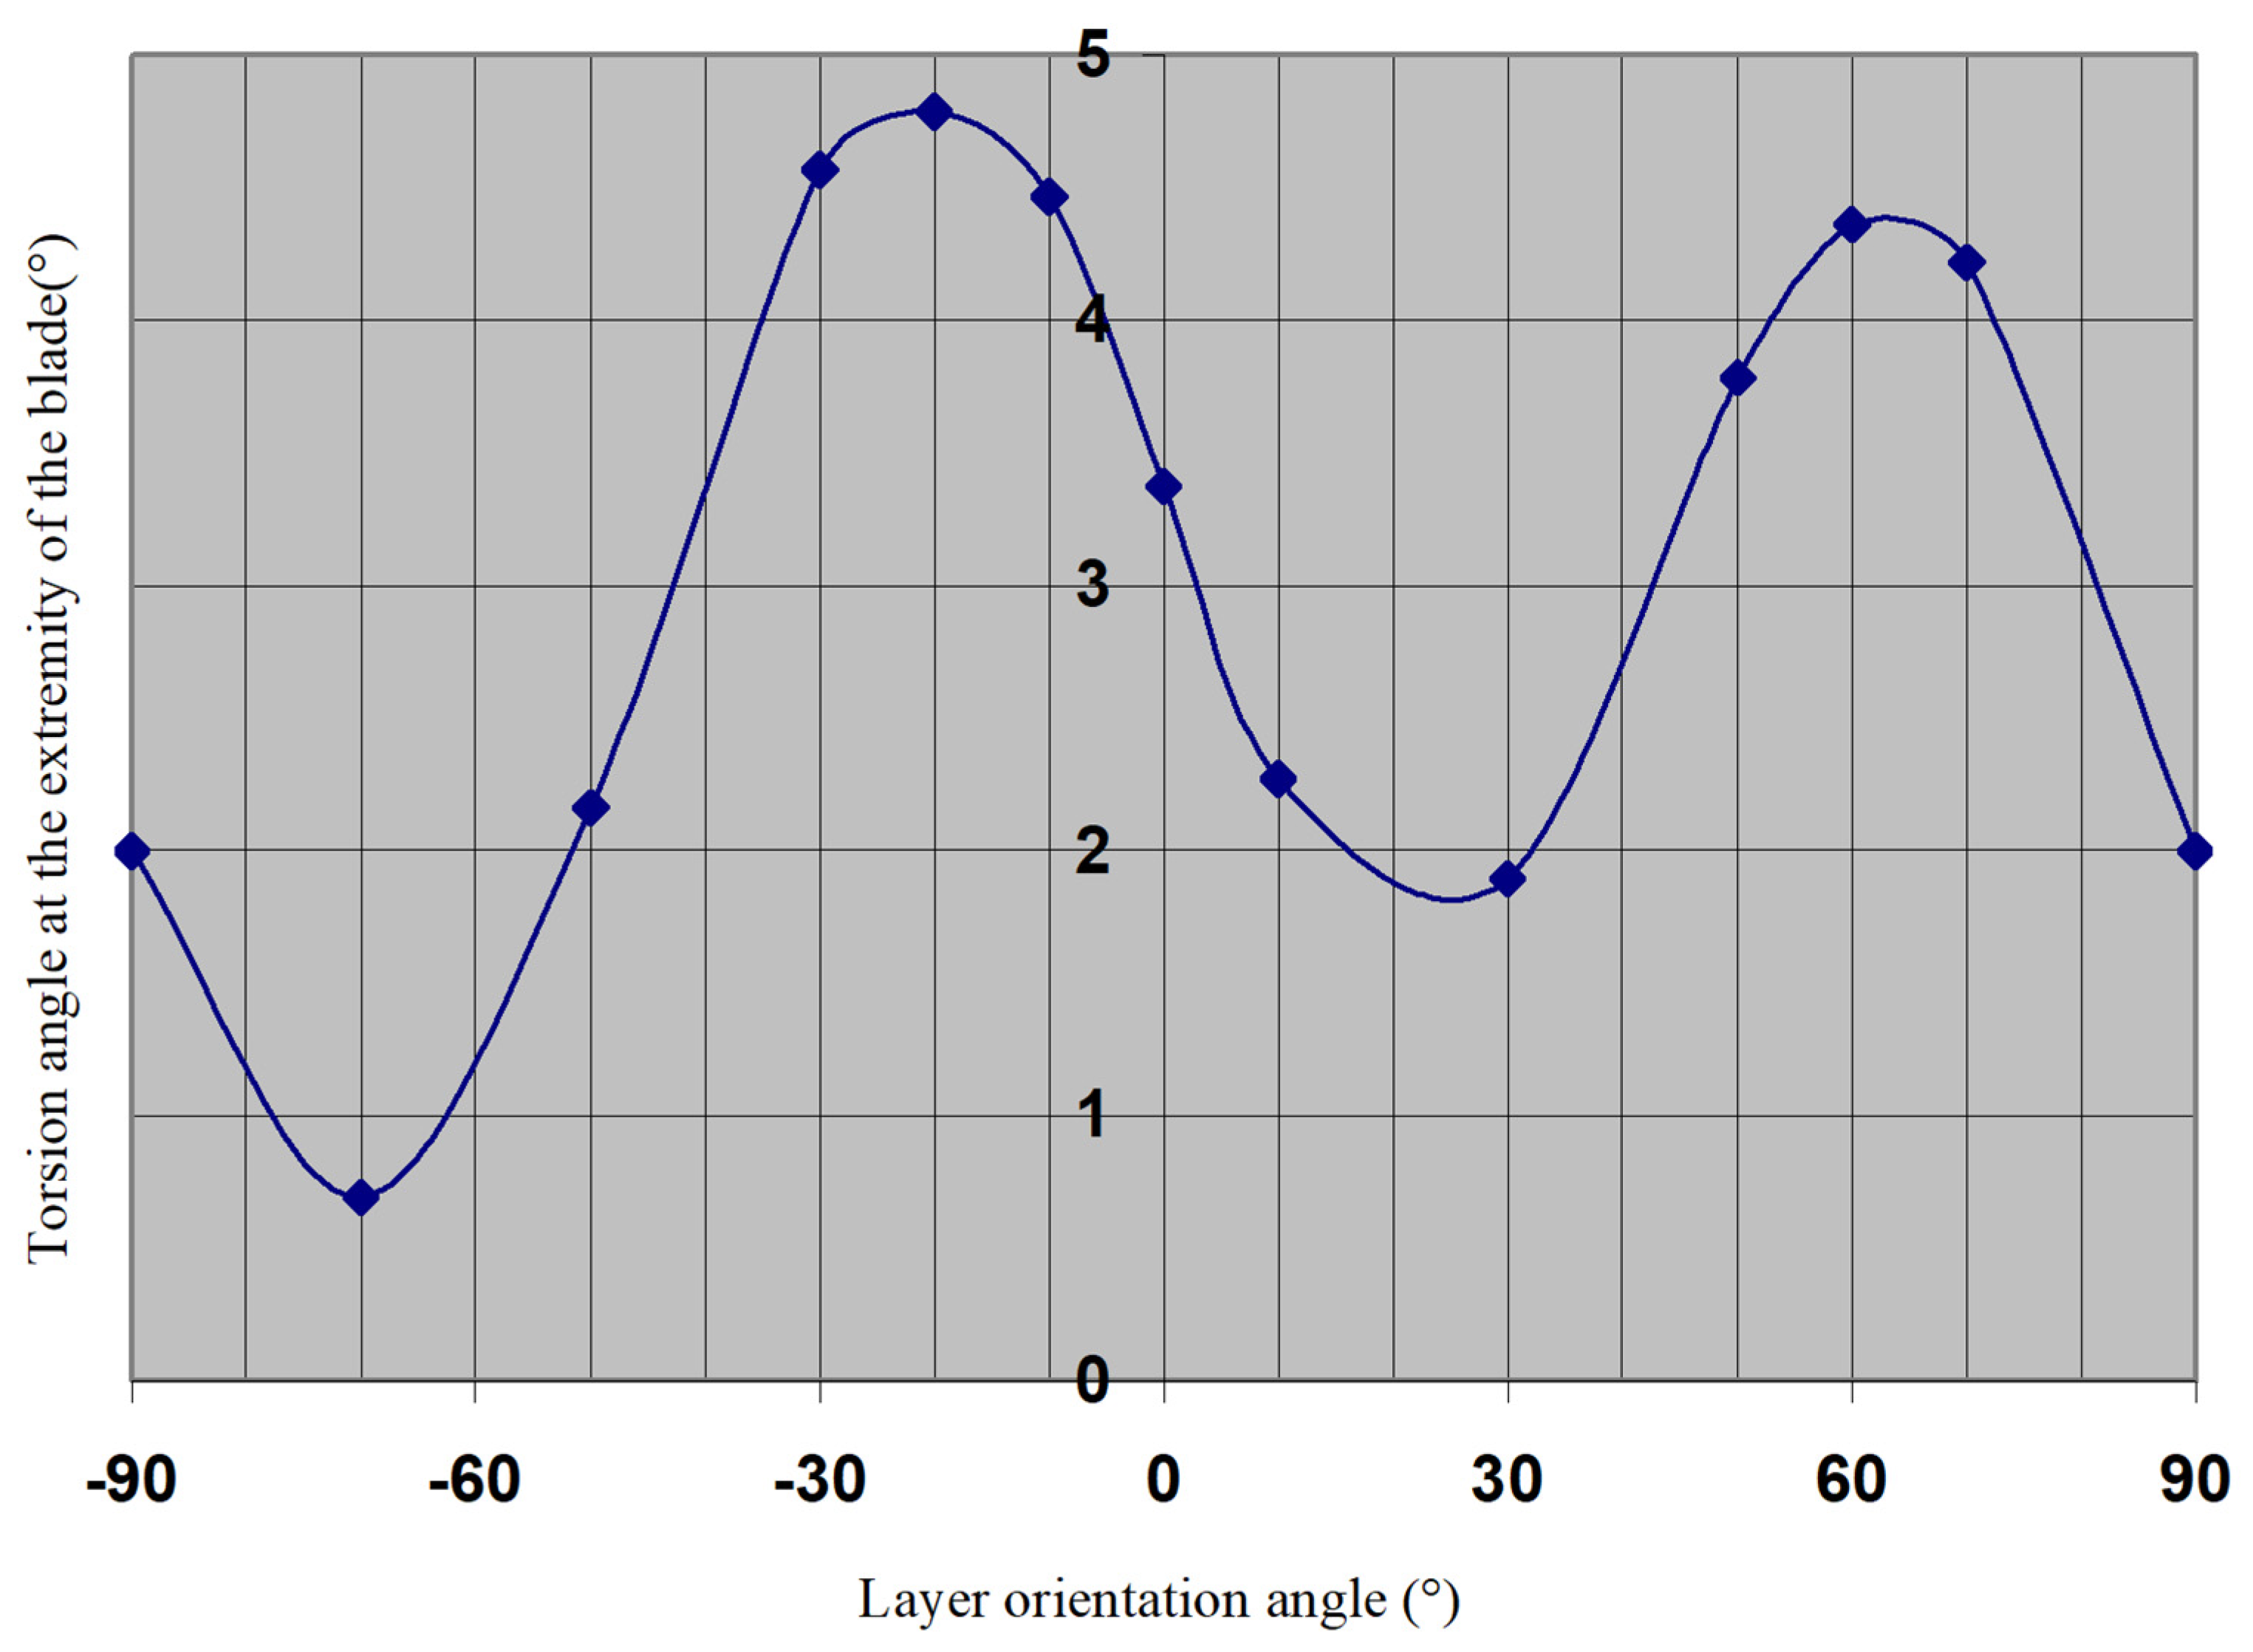
The fiber orientation is optimized specifically to maximize torsional blade deformation. As illustrated in
Figure 3, the graph demonstrates the relationship between the tip torsional deformation angle and the blade material layer fiber orientation angle. The fiber orientation angle is defined as the angle between the elastic axis of the uncurved blade and the fiber axis.
Figure 3 presents the torsional deformation angle versus the layer fiber orientation angle. Simulation results indicate that fiber orientation significantly affects torsional deformation. From −90° to −70°, as well as from −20° to +25° and from 60° to 90°, the torsion angle at the blade’s extremity decreases as the layer orientation angle increases. Conversely, from −70° to −20° and from 25° to 60°, the torsion angle increases with an increase in the layer orientation angle. This results in two local minima at angles of −70° and 25° and two local maxima at angles of −20° and approximately 60°. The global maximum occurs at a layer orientation angle of −20°; at this angle, the torsion angle at the blade’s extremity reaches 4.79°, correlating with aerodynamic loads at a wind speed of 12 m/s, a finding consistent with other studies [
13,
14].
For the construction of the GFRP blades in this study, the blades were fabricated from a balanced standard E-glass fabric with a warp/weft ratio of 60/40, weighing 202 gr/m
2, and bonded with an epoxy resin. The construction utilized three layers, though it is important to note that variations in the number of layers can significantly influence both the bending and torsional behavior of the blades. The layers were oriented at 20°, which aligns with the identified optimal orientation for achieving desired mechanical properties and torsional responses. This orientation results in the following orthotropic mechanical properties:
To complete the rotor assembly, three blades were fabricated and mounted onto the rotor hub. Due to the manufacturing method—cutting the blades from a sheet of GFRP—it was not feasible to integrate a non-zero pitch angle directly into the blades themselves. Consequently, it was determined that the rotor hub would be designed to incorporate a constant 5-degree pitch angle, thereby ensuring that each blade maintained the necessary angle throughout its length. This design approach effectively compensated for the fabrication constraints, allowing for aerodynamic functionality despite the blades’ flat profile.
2.4. Measurement Campaign
2.4.1. Types of Measurements
Two distinct types of measurements were employed during the testing phase, categorized based on the wind velocity conditions: constant velocity (internally denoted as “rr”) and increasing velocity (“vv”).
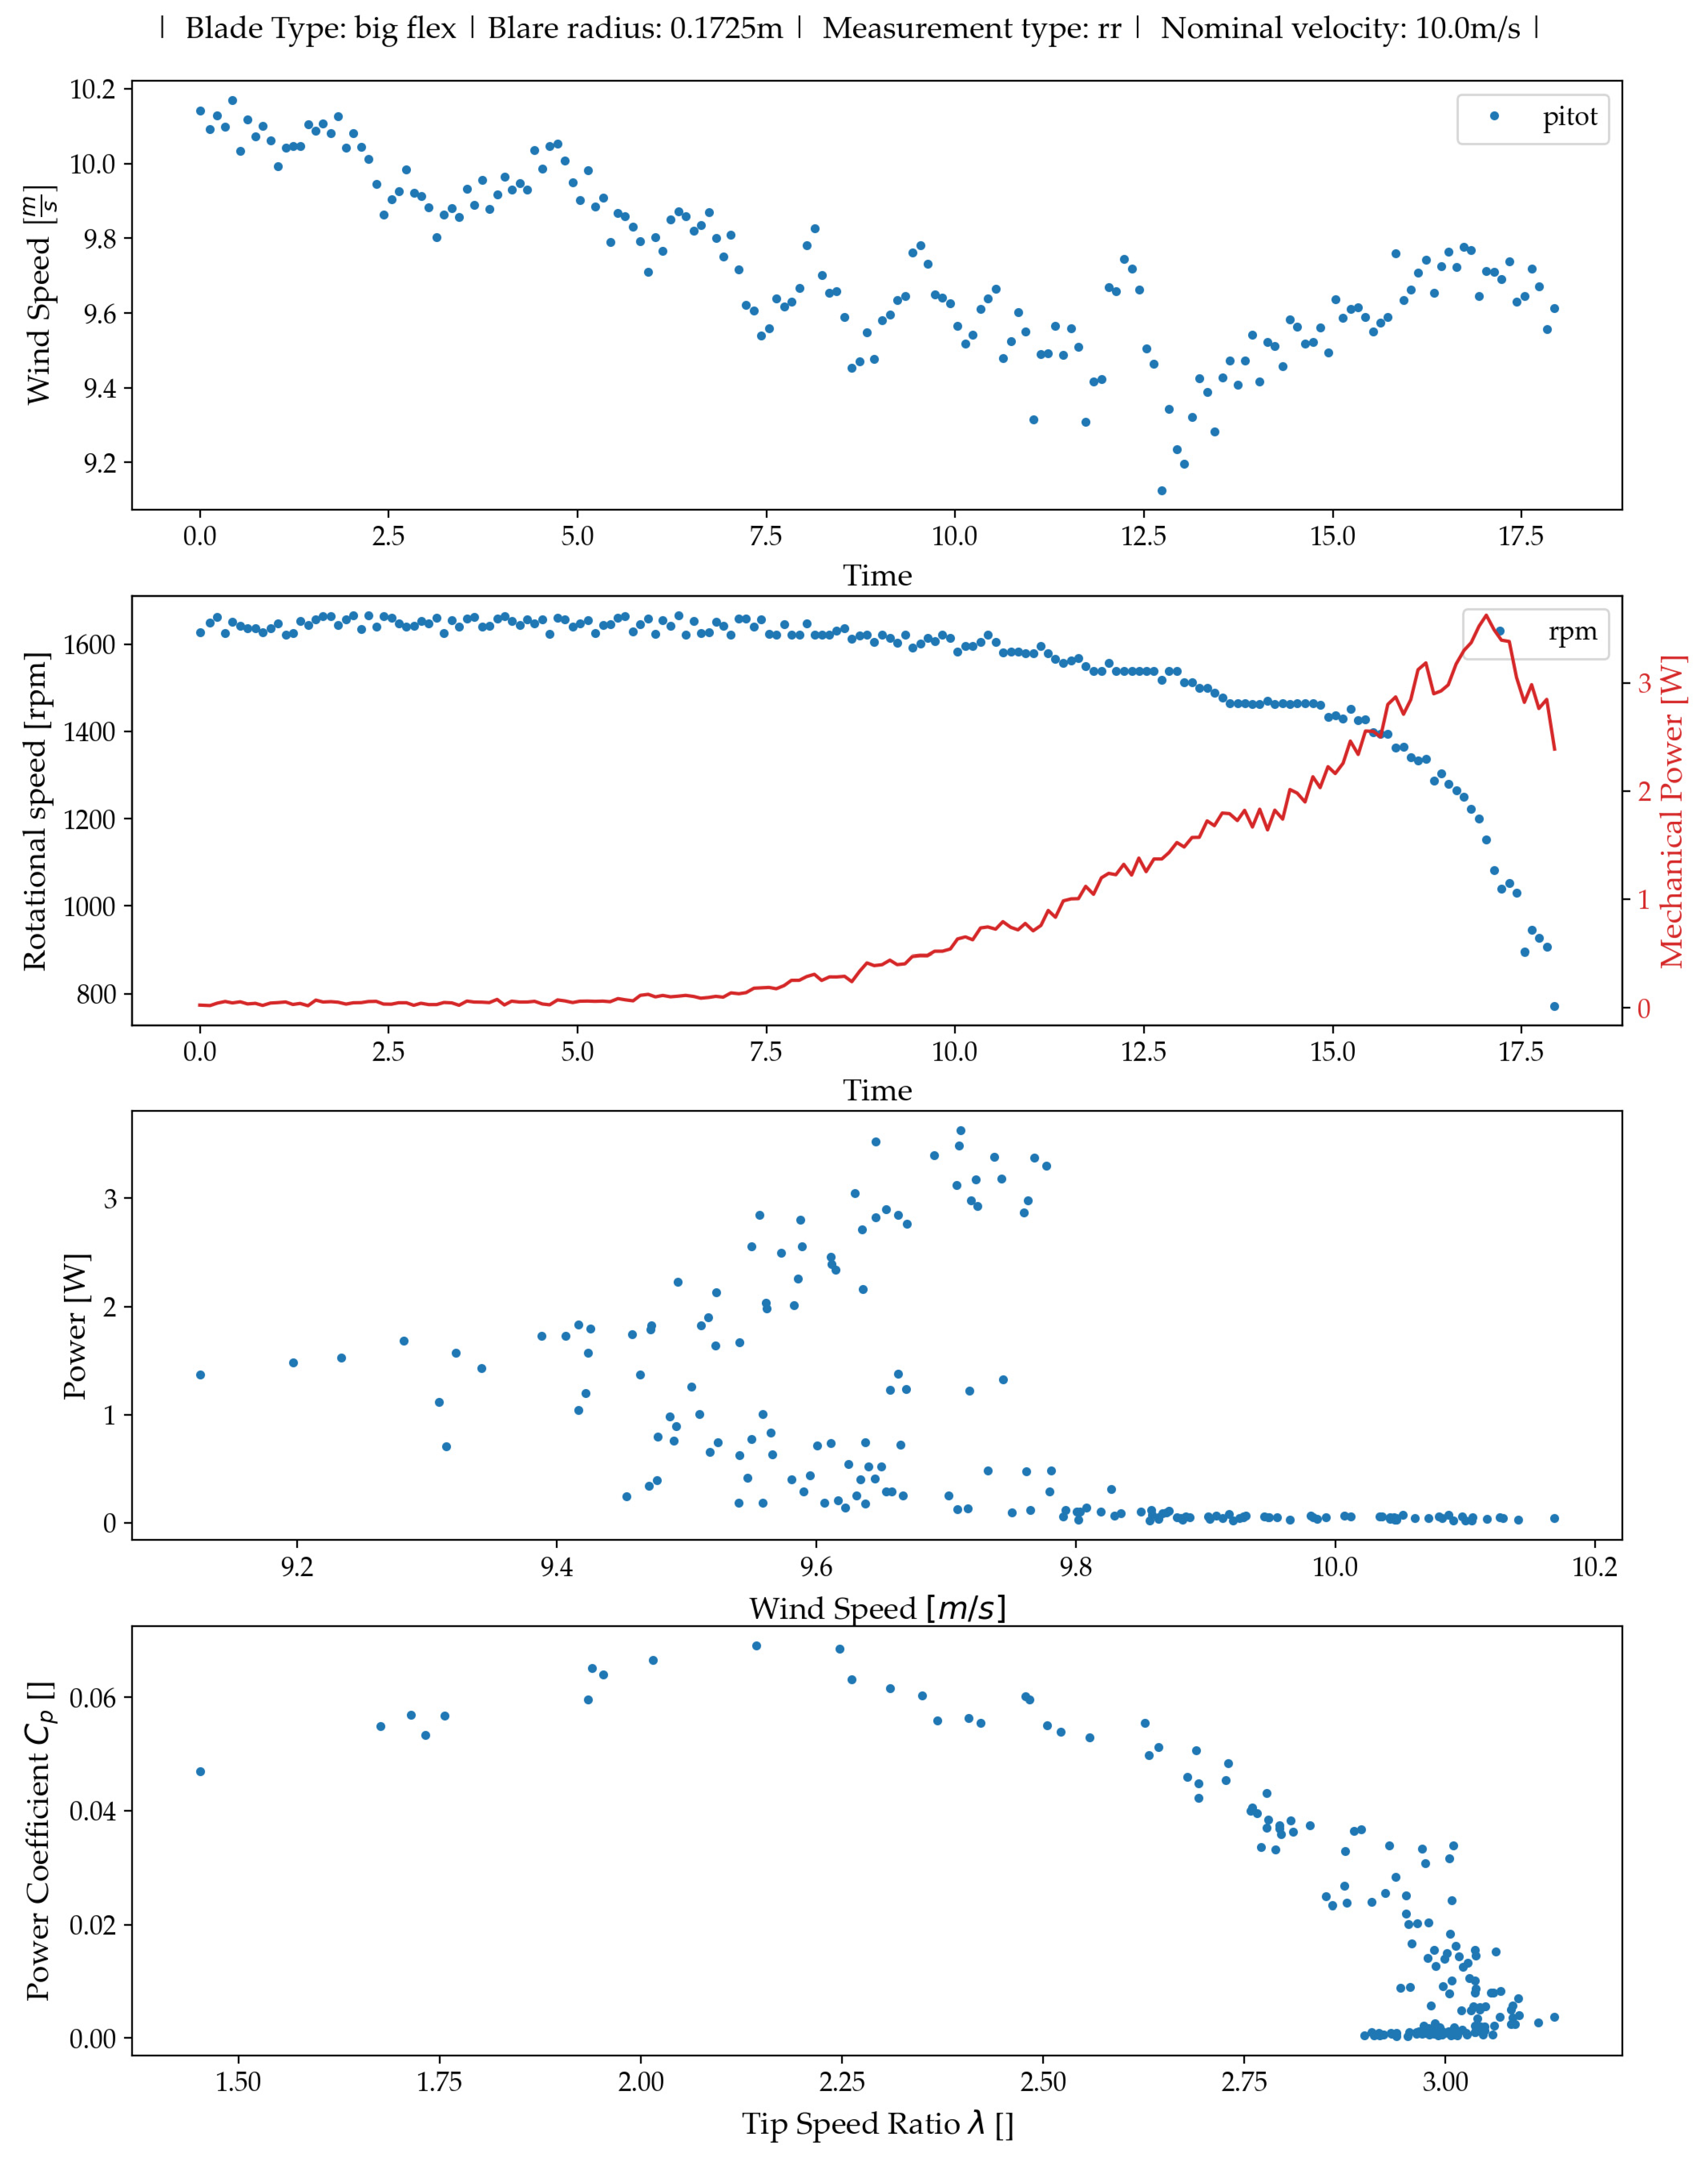
Constant Wind Velocity Test: In the constant wind velocity test, the wind blade is exposed to a steady wind until the revolutions per minute (rpm) of the blade stabilize at an equilibrium. Following this stabilization, an external load is gradually applied to the wind blade shaft, either mechanically (or electrically if the rotor is connected to a generator). This test format is commonly used to characterize wind energy blade performance, particularly for calculating the Power Coefficient (Cp) versus Tip–Speed Ratio (TSR or λ). It is important to note that the magnitude of the load significantly influences the Power Coefficient. Specifically, an excessively high load can stall the blade, while an insufficiently light load may prevent the blade from slowing sufficiently to observe the desired effects. During these tests, the braking load is gradually increased to a point where the blade decelerates enough to eventually stop.
Increasing Velocity Test: Contrastingly, the increasing velocity test is designed to characterize the performance of the wind blade across a broader range of wind speeds and may include the application of braking loads. Although not as typical for standard characterization, these tests are crucial in this context as they highlight the benefits of the passively controlled wind energy converter system. This approach allows for an assessment of the blade’s adaptability and performance under varying operational conditions.
2.4.2. Measurement Campaign for GFPR Blades (Curved)
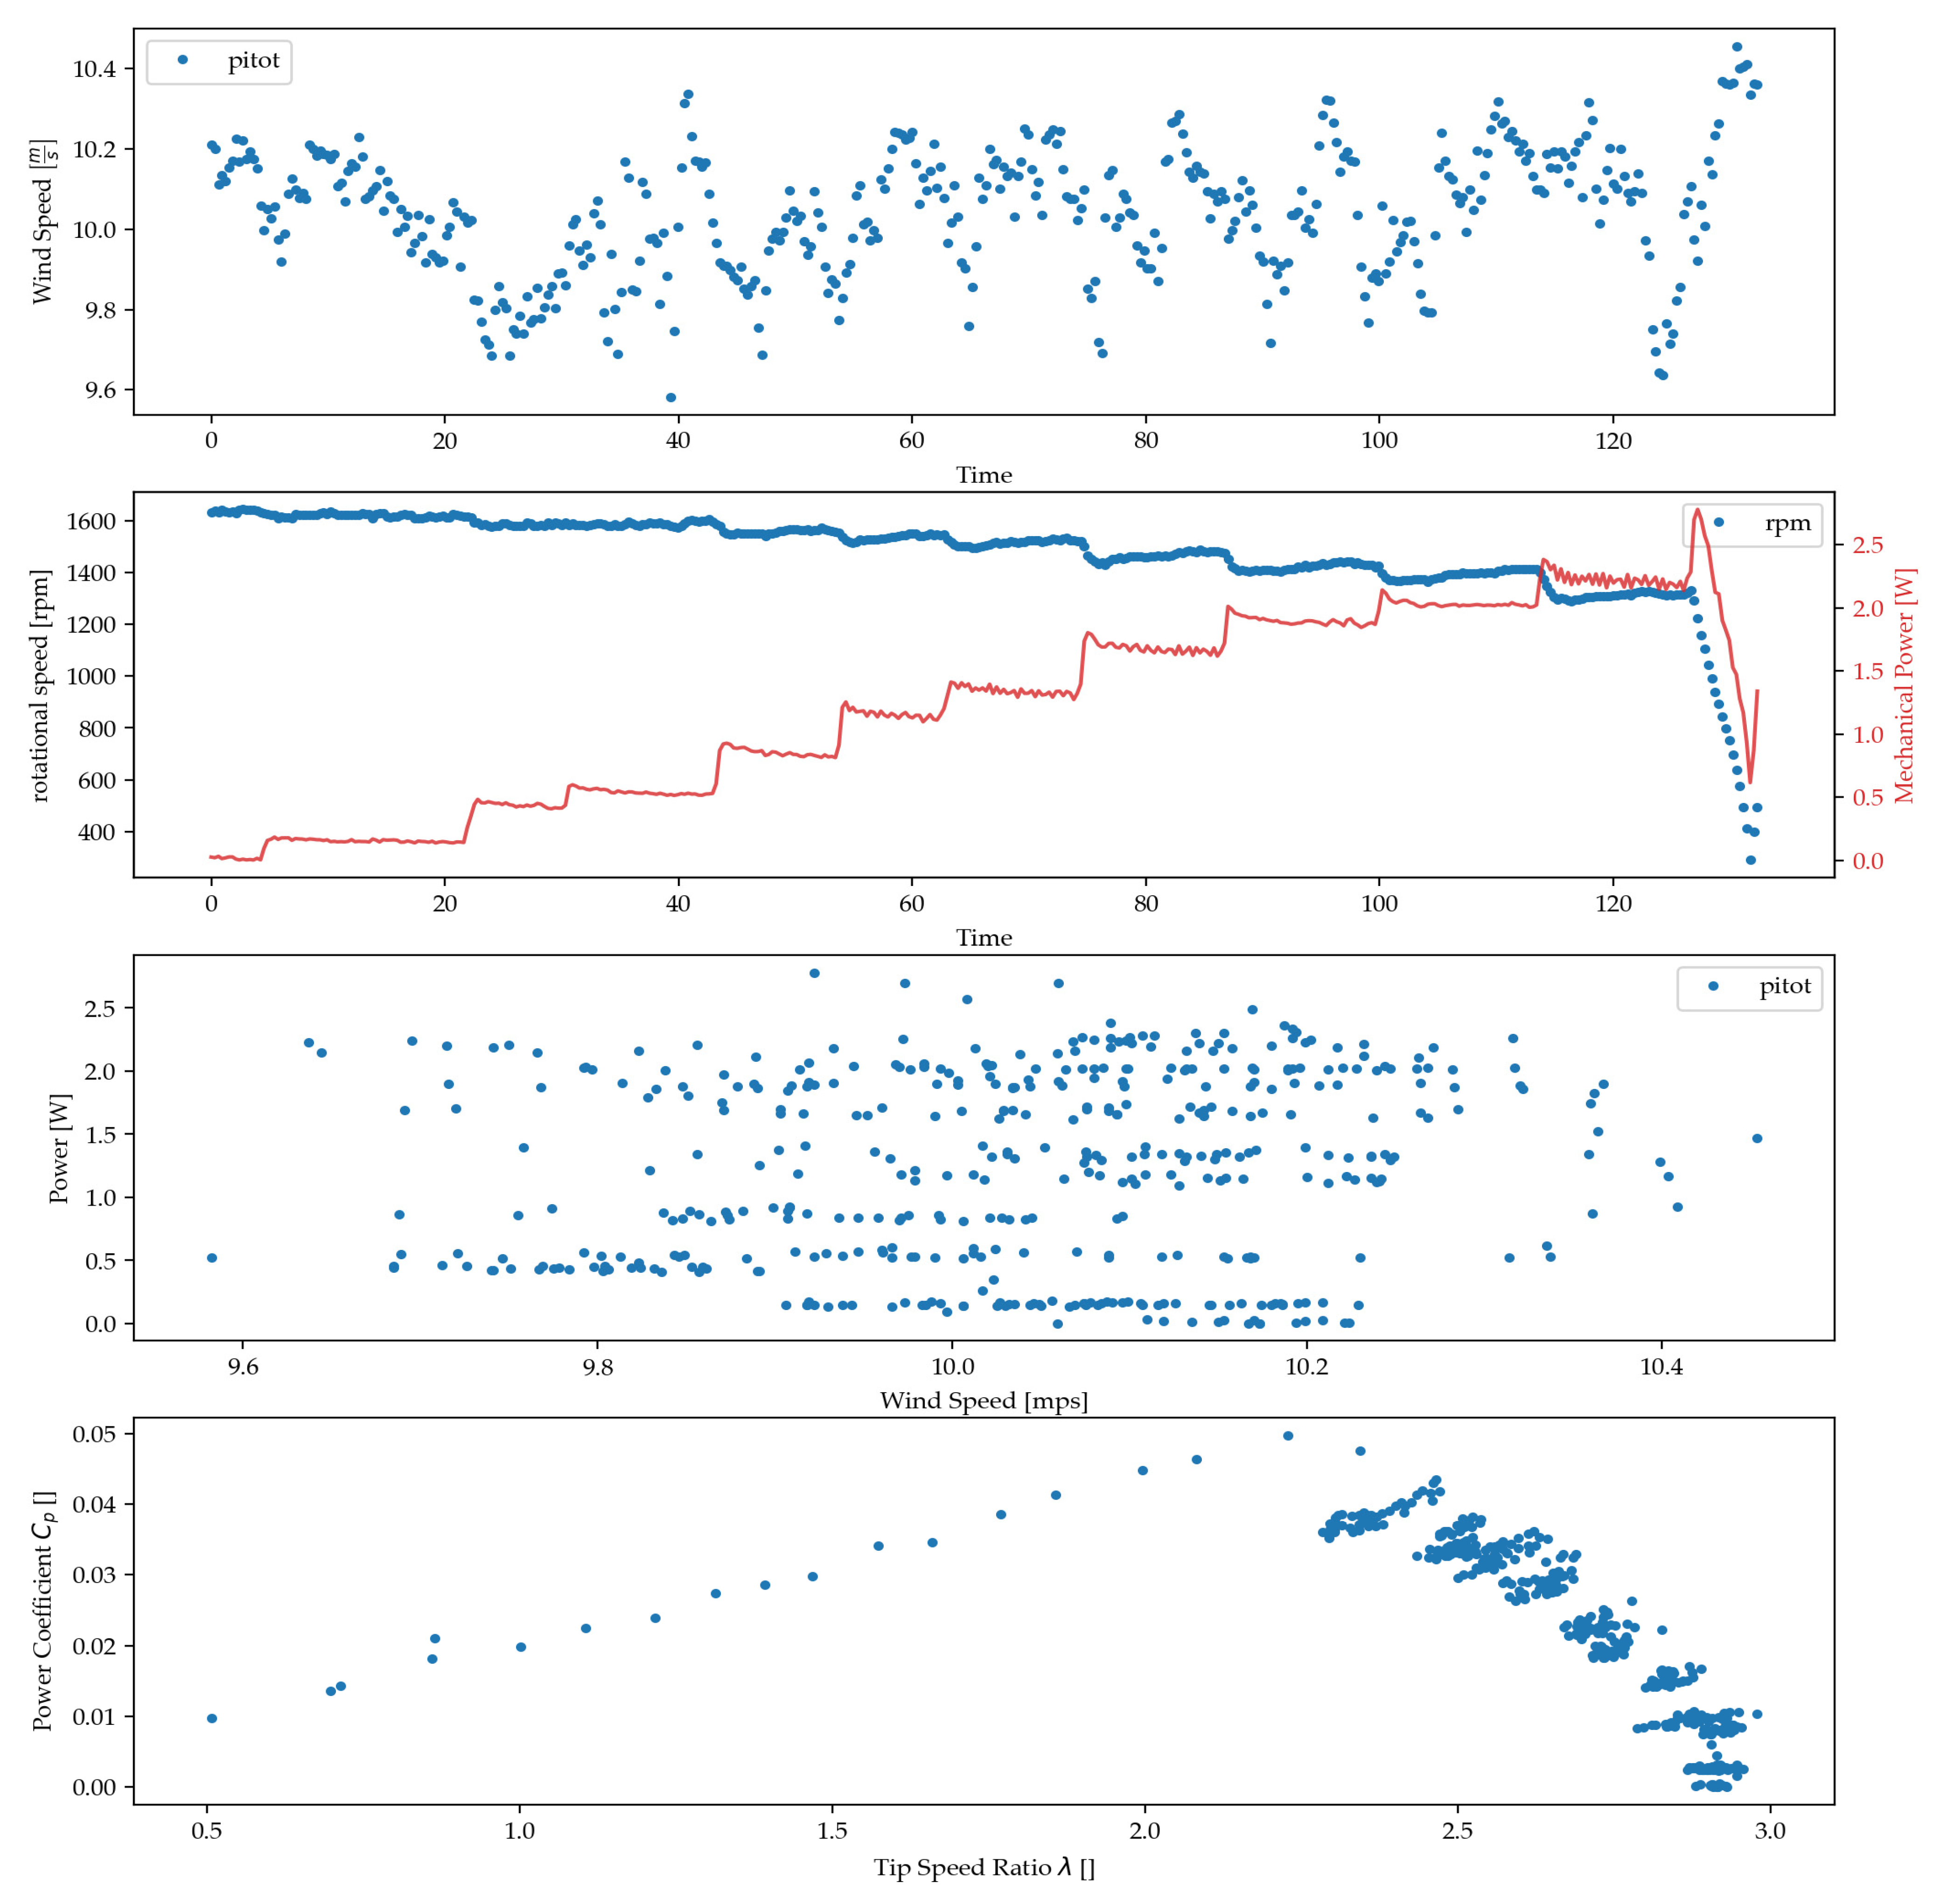
Table 1 outlines the key parameters for the measurements of the curved GFRP blade under conditions of increasing velocity. This work reports on four different load settings. Load settings higher than 10 Ohms were excluded from consideration because, under those conditions, the blade failed to initiate rotation. Each test scenario was conducted with a single repetition. During these tests, the wind tunnel velocity was manually adjusted by the operator at a rate of approximately 1 m/s every 10 s, allowing for controlled variations in wind speed.
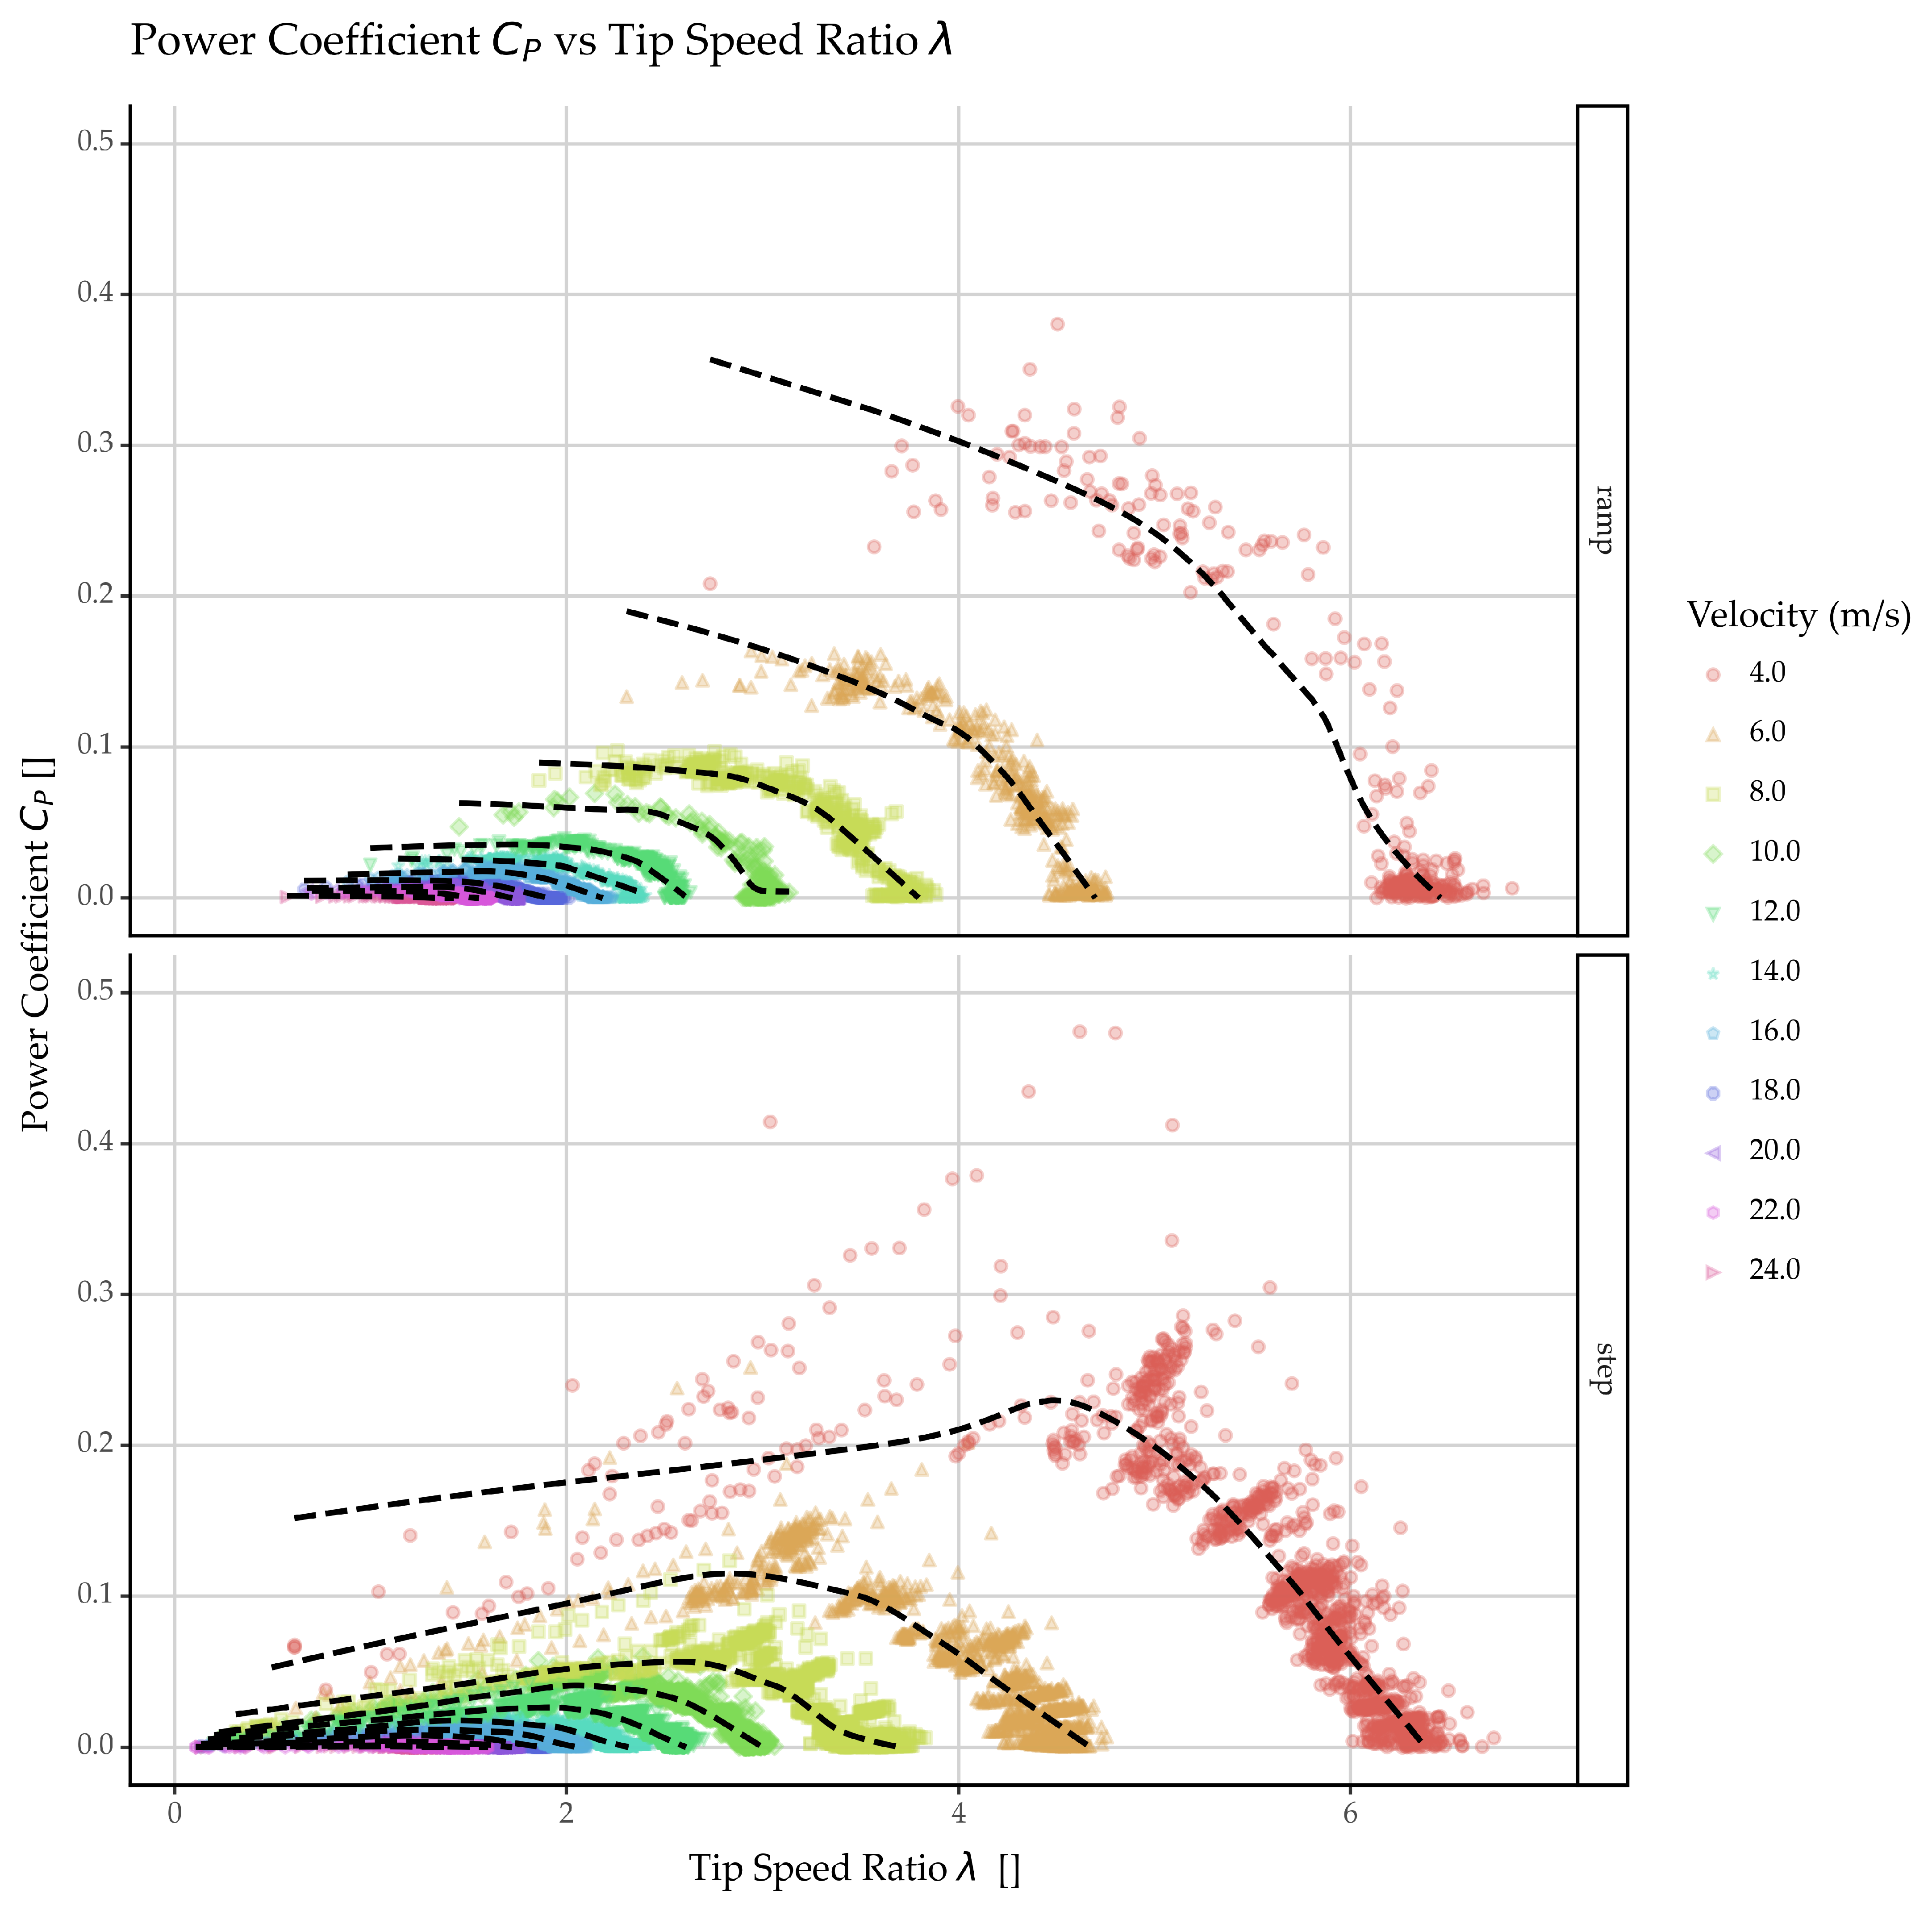
Table 2 presents the salient parameters for the measurements conducted under constant velocity and constant load conditions using the curved GFRP blade. The tests spanned wind speeds from 4 m/s up to and including 24 m/s, in 2 m/s increments. Two distinct loading methods were employed during these tests.
The first method involved a ramp load, where the resistive load started at zero and was continuously adjusted upward. This method is referred to as “ramp load”, and the corresponding experiment IDs are listed in the second column of the table. The second method, known as “step load”, involved incrementally increasing arbitrarily the resistive load in discrete steps and then allowing the rotor hub to stabilize at the new rpm equilibrium. This step-loading method was favored for repeated measurements as it provided more consistent and representative data, capturing the rotor’s behavior as it settled into each new load condition.
2.5. Experimental Apparatus
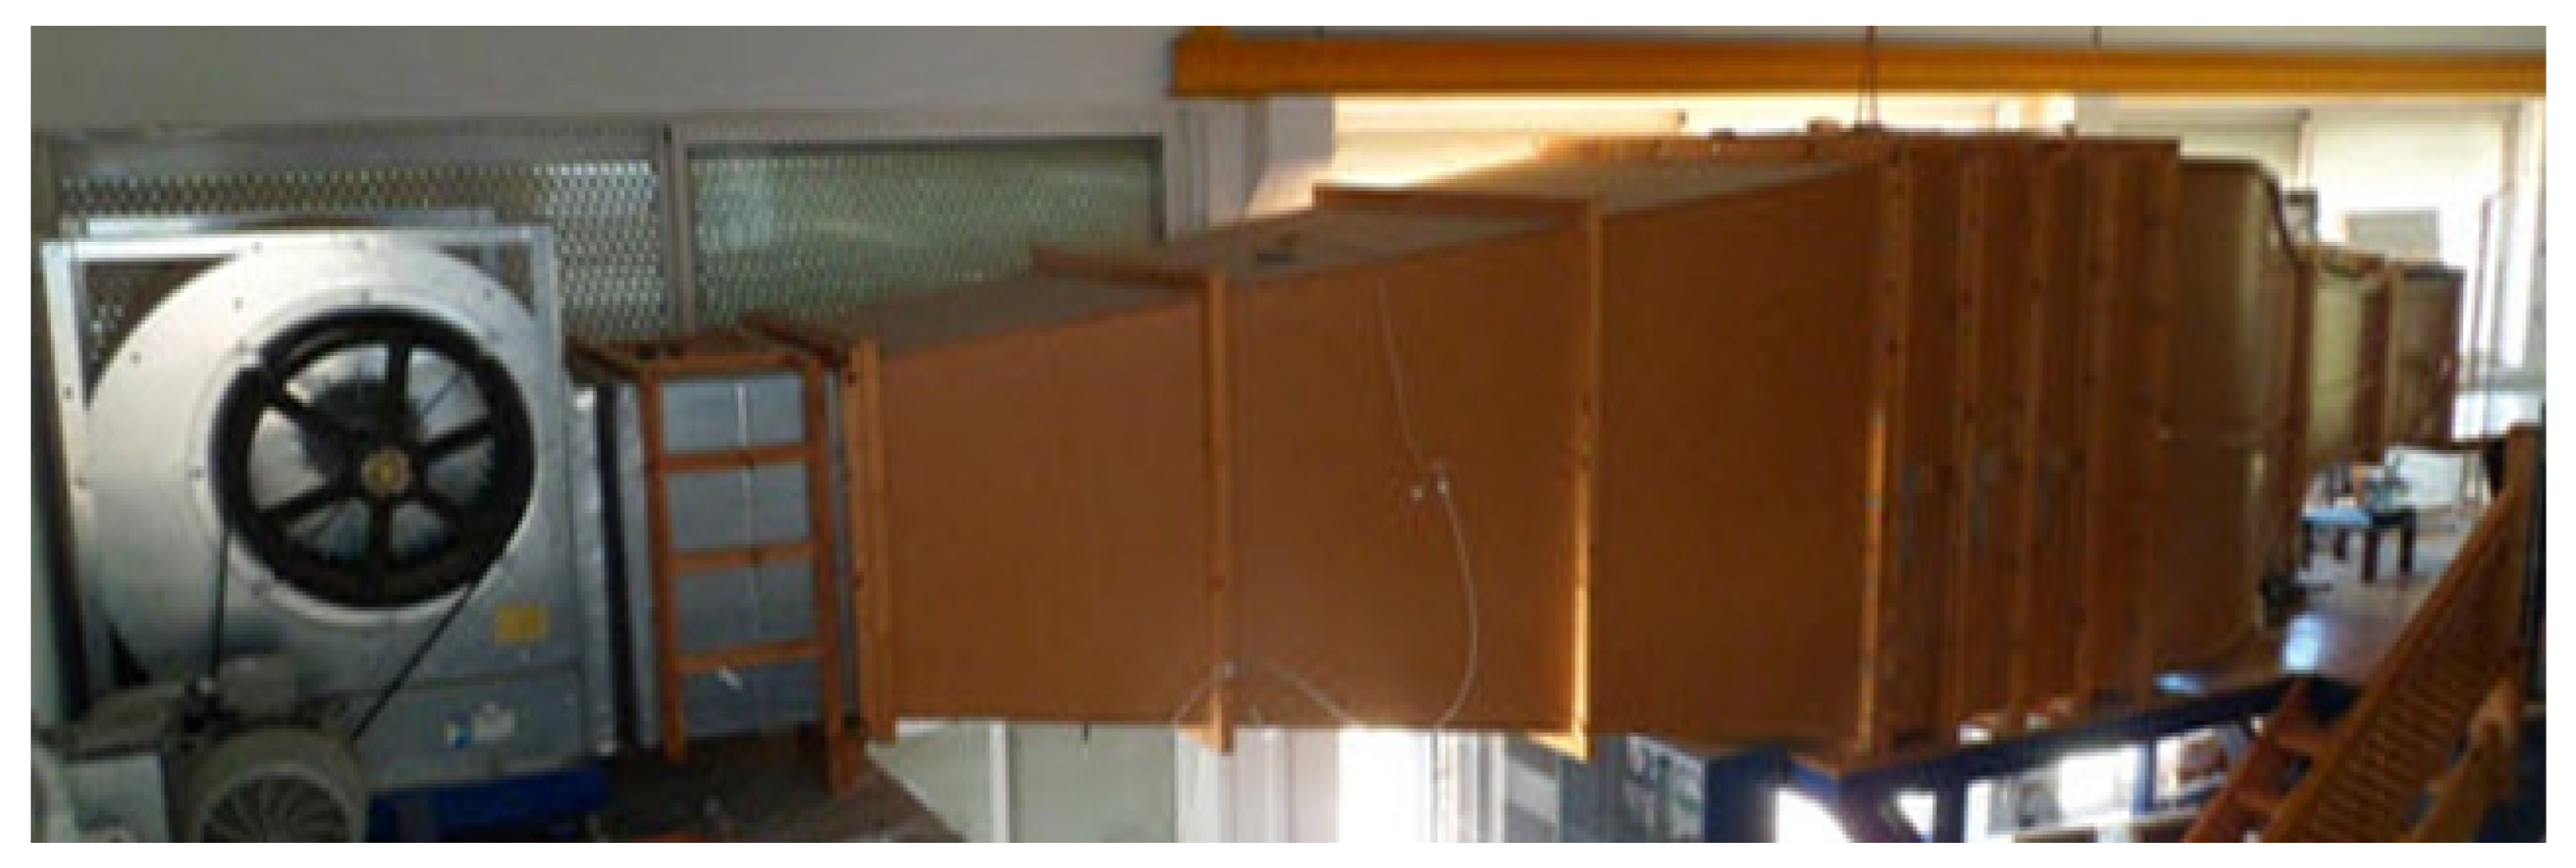
The testing facility for this series of experiments was conducted at the Hellenic Mediterranean University’s Wind Energy Lab in a 600 × 600 mm wind tunnel, presented in
Figure 4, largely maintaining the setup used in the first part of this series. Despite the similarities in the papers of this two-part series, notable modifications were introduced to address limitations observed in the previously employed braking methods.
The wind tunnel facilitated measurements of various parameters, including wind speed, rotor thrust (T), rotor torque (Q), and rotor speed (N).
Table 3 presents manufacturing companies and models of the Measurement apparatus. Wind speed measurements at the tunnel outlet were accurately captured using a Pitot–Prandtl tube coupled with a Delta Ohm HD408T differential pressure transducer, calibrated against an externally calibrated hotwire anemometer to ensure precision. The rotor’s axis was connected to a SCAIME DR2112L Rotating Torquemeter, which measured torque and revolutions per minute (rpm). Thrust (or drag) data were collected via an HBM SP4MC6MR load cell interfaced with an ADAM 3016 isolated strain gauge input module. Data acquisition was managed through a National Instruments NI-USB-6353 card, using a custom LabVIEW application developed on the LabVIEW 2014 Development System. This setup allowed data capture at a sampling rate of 1000 Hz for each channel, including measurements for two wind speeds, drag, torque, and rpm, with data segmented into 0.1 s intervals and averaged across each interval.
A significant change in the setup involved the rotor shaft’s connection to a small generator, which was linked to a Vishay wirewound rheostat ranging from 0 to 1 k Ohm. This new configuration served as a load on the generator wires, effectively acting as an electromagnetic brake. This modification enabled easy adjustments of the braking load applied to the rotor, facilitating detailed investigations into the generator’s performance under varied load conditions.
To ensure that our experimental setup remained robust and reliable and the measurements accurate, each measurement device underwent annual calibration. The calibration procedures involved:
- -
An externally calibrated hotwire anemometer for wind speeds (already mentioned before).
- -
Known weights for calibrating the load cell used for measuring drag.
- -
Standard weights for torque calibration.
- -
A tachometer to verify the rpm measurements.
4. Discussion
4.1. General Performance of the GFRP Blade Concept
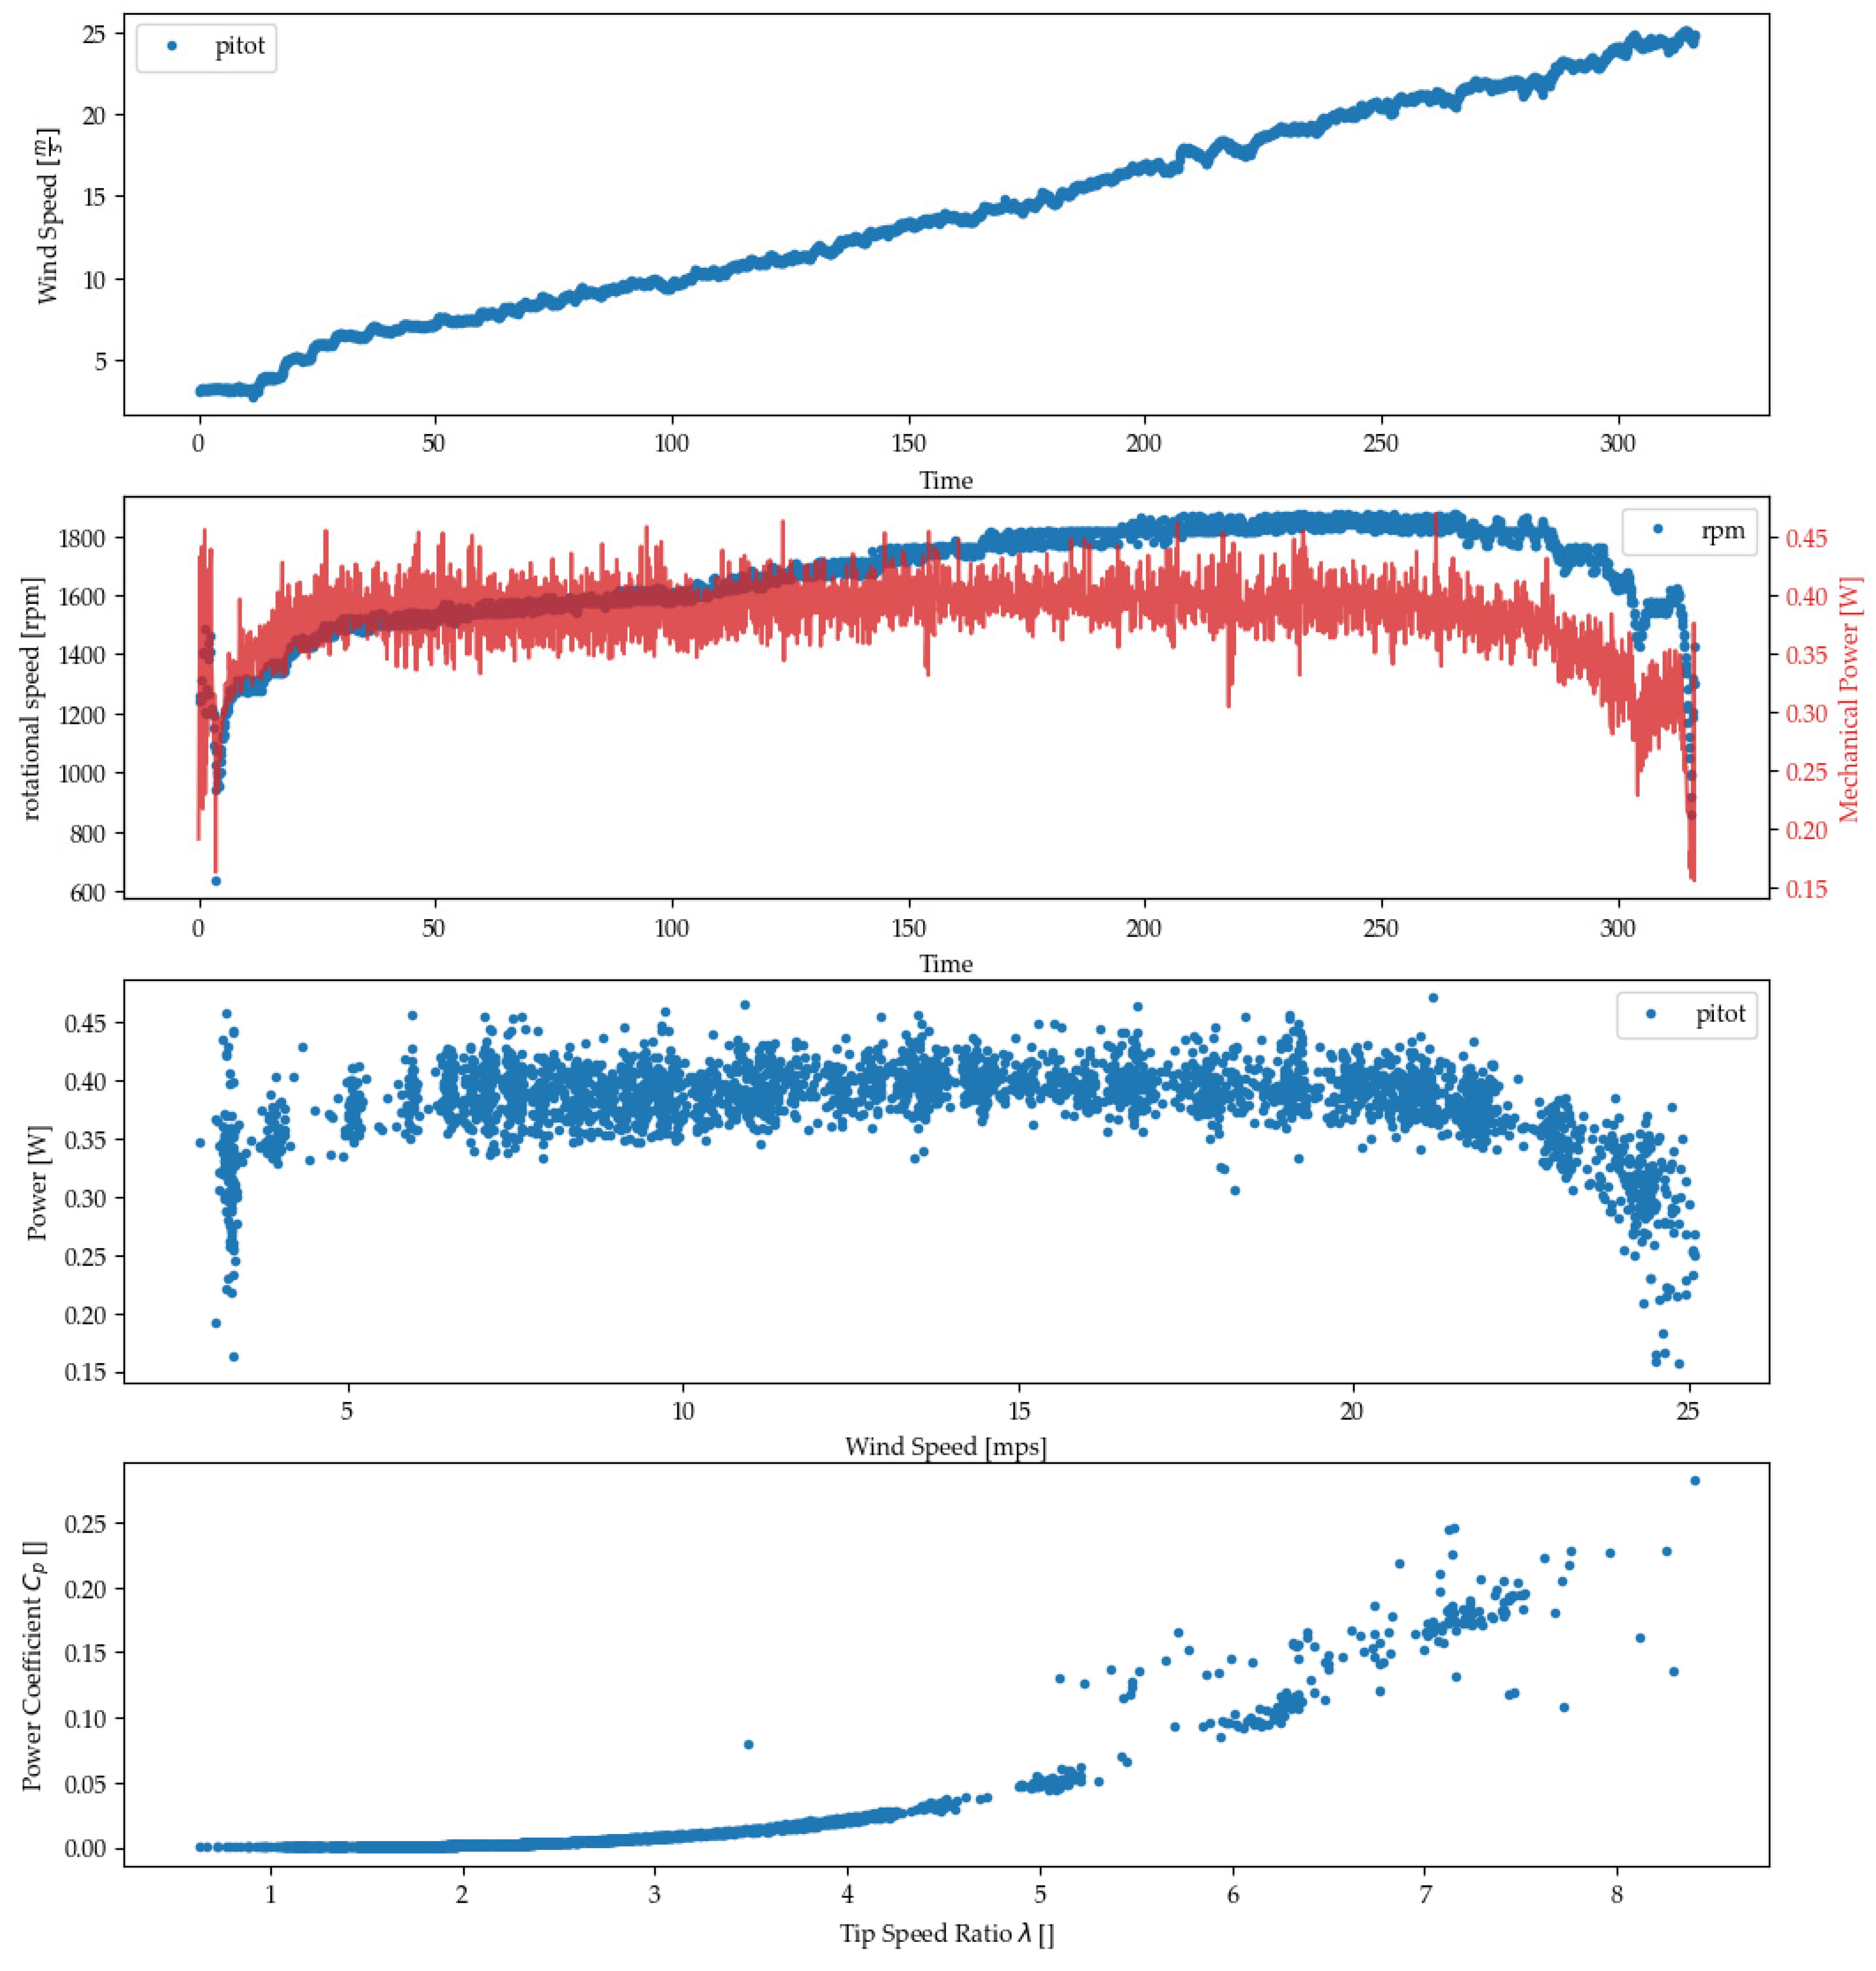
The performance of the curved, passively controlled GFRP blades developed in this study under a wide range of wind speeds is presented in
Figure 15. Three distinct operational regions can be observed: (a) Initial (Buildup) Region, (b) the Second (Plateau) Region, and (c) the Tertiary (Braking) Region.
The Initial (Buildup) Region as depicted in
Figure 15 spans from 0 to 4 m/s. The curve showing power output versus wind speed begins at zero and rises sharply. The minimal twisting deformations during the early phase are crucial for maximizing torque, which aids in initiating blade rotation. As the curve approaches nominal wind speeds (around 5 m/s in this test), there is a noticeable stabilization in power output. This corresponds to the blade’s design feature where the twisting deformation starts to self-regulate. The gradual change in pitch, influenced by the material’s elastic properties and blade geometry, modulates the power effectively, preventing any abrupt spikes or drops in energy production as the blade transitions to higher operational speeds. This illustrates how the curved GFRP material and blade design contribute to a controlled and efficient ramp-up in power, aligning with the design criteria for quick startup and efficient energy capture at nominal speeds.
Second (Plateau) Region: This region extends from the nominal wind velocity (5 m/s) to near the cutoff wind velocity (20 m/s). Here, the pitch angle adjusts in response to increases in wind velocity. As the wind velocity exceeds a desirable level, the pitch angle decreases to deepen the blade’s entry into the stall region, thereby reducing power yield. If the power output falls below the nominal level, the pitch angle increases to raise the incidence angle, allowing the blade to gradually exit the stall region. This mechanism is designed to maintain a stable, flat power output curve, which can be observed in the figure.
Tertiary (Braking) Region: Beyond the cutoff wind velocity, this region aims to safely halt the turbine rotation. When the wind velocity exceeds the cutoff threshold, the pitch angle changes significantly, forcing the blade into a deep stall. This action effectively reduces the turbine’s rotation until it stops completely. Conversely, if the wind velocity drops below the cutoff threshold, the pitch angle increases, which raises the incidence angle and transitions the blade back into the Second (Plateau) Region to optimize power output.
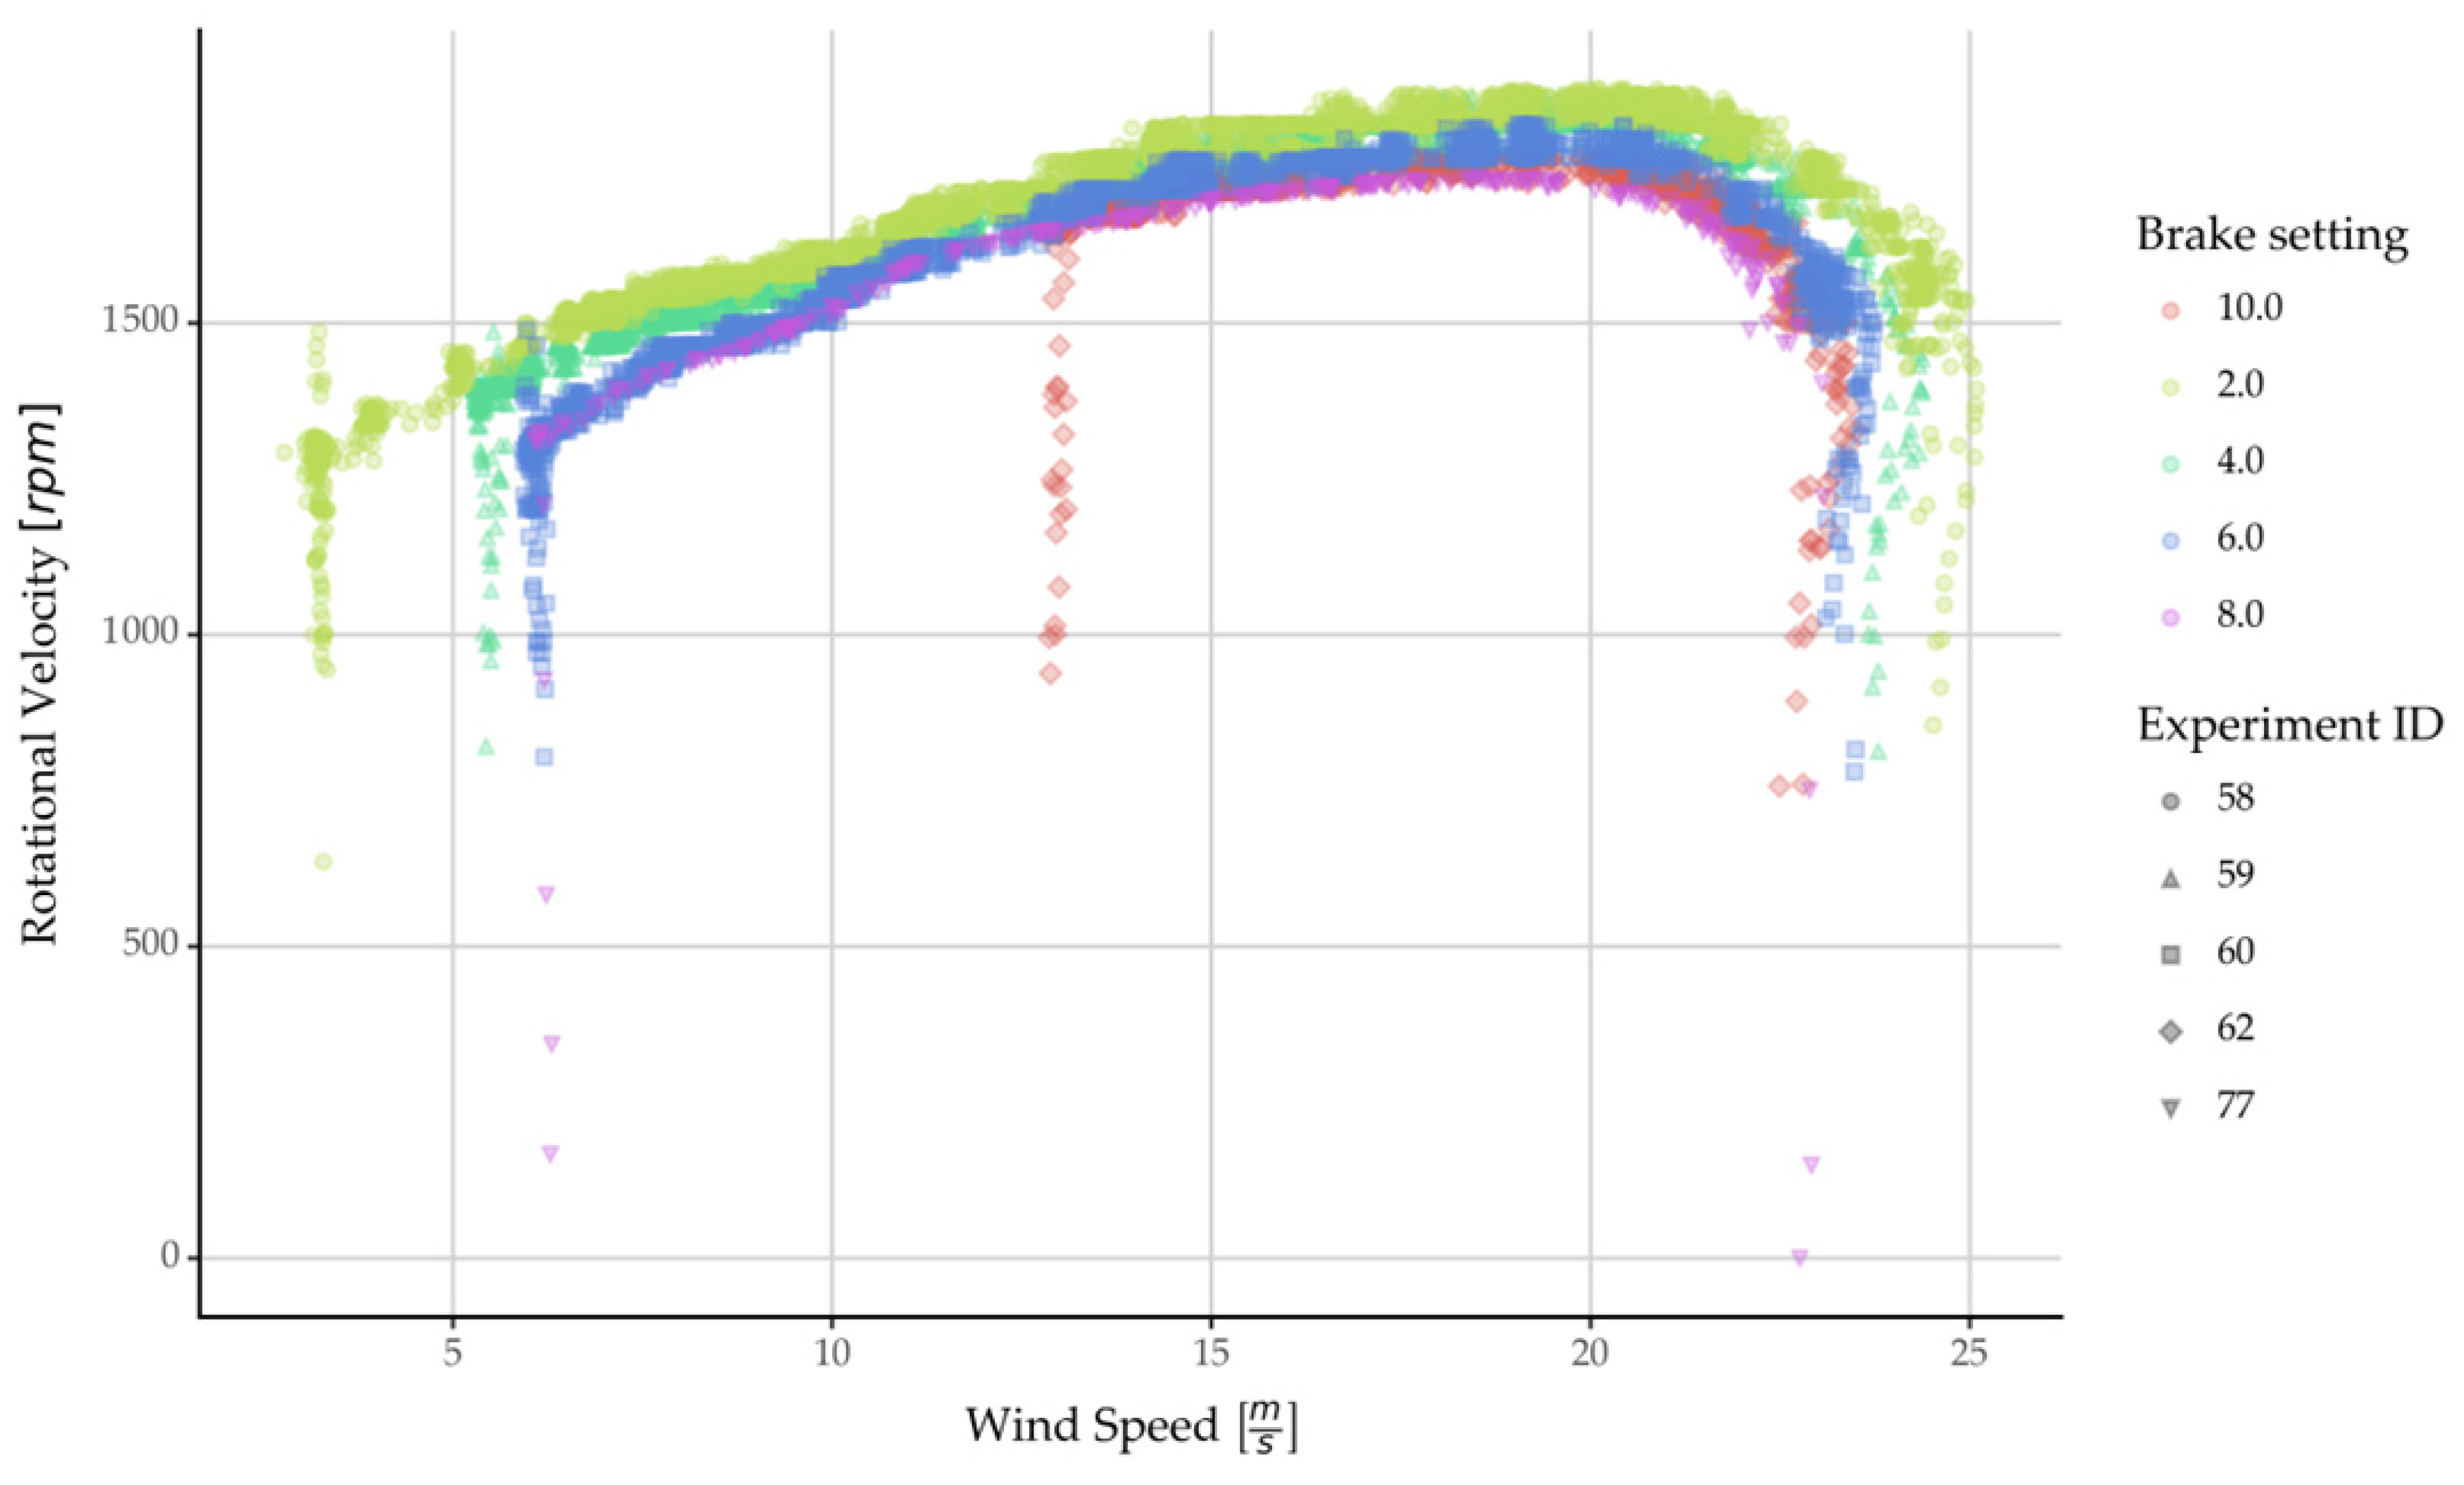
It should be noted that the actual power output values are dependent on the load setting, as can be seen in
Figure 8.
The analysis confirmed that the curved GFRP blade design, despite its simple planar geometry, successfully met all the established design criteria: quick start-up and rapid achievement of nominal power, maintenance of stable power output between nominal and cutoff velocities, and secure shutdown beyond cutoff speeds. This demonstration affirms the curved concept’s full capability to meet the functional criteria outlined earlier. This success underscores the viability of designing and manufacturing passively controlled wind turbine blades that could potentially incorporate all the advantages of active pitch and stall control systems found in Wind Energy Converter Systems but with the added benefits of simplicity and cost efficiency inherent in passive systems. While the initial results are promising, there are several considerations for scaling up, which could affect the dynamics and forces involved.
4.2. Resistive Load Setup
To address the limitations identified with the mechanical brake system in the initial study—specifically, its non-linear response characteristics and slow adjustment times which hindered effective power optimization—this study introduced a new approach for applying load to the wind turbine rotor. By integrating a generator connected to a resistive load via a rheostat, we aimed to refine the wind turbine blade testing methodology. The mechanical brake previously used had settings that did not correspond to measurable physical quantities that could be adjusted rapidly, making it challenging to track the optimal power point effectively. The shift to a resistive load was driven by the need for a method that offered more linear and swiftly adjustable load application. Although this innovative approach enhanced the clarity of load-response relationships, the setup still encountered several challenges that affected its capacity to precisely achieve optimal power tracking.
Firstly, the resistive load setup allowed for quick adjustments but did not support real-time digital control, crucial for tracing optimal power values dynamically as wind conditions change. This limitation persisted despite the shift from a mechanical braking system, indicating that further enhancements are necessary to fully capitalize on the potential of this new method.
The load was applied using two distinct methods: a continuous, gradual increase (ramp) and discrete, incremental steps (step). The step-wise method proved particularly effective, as it facilitated more consistent stabilization of the rotor hub’s rotational velocity, enhancing data reliability, especially at lower Tip–Speed Ratio (TSR) values. This method also enabled more precise control over experimental conditions, allowing for detailed performance analysis across a broad operational range.
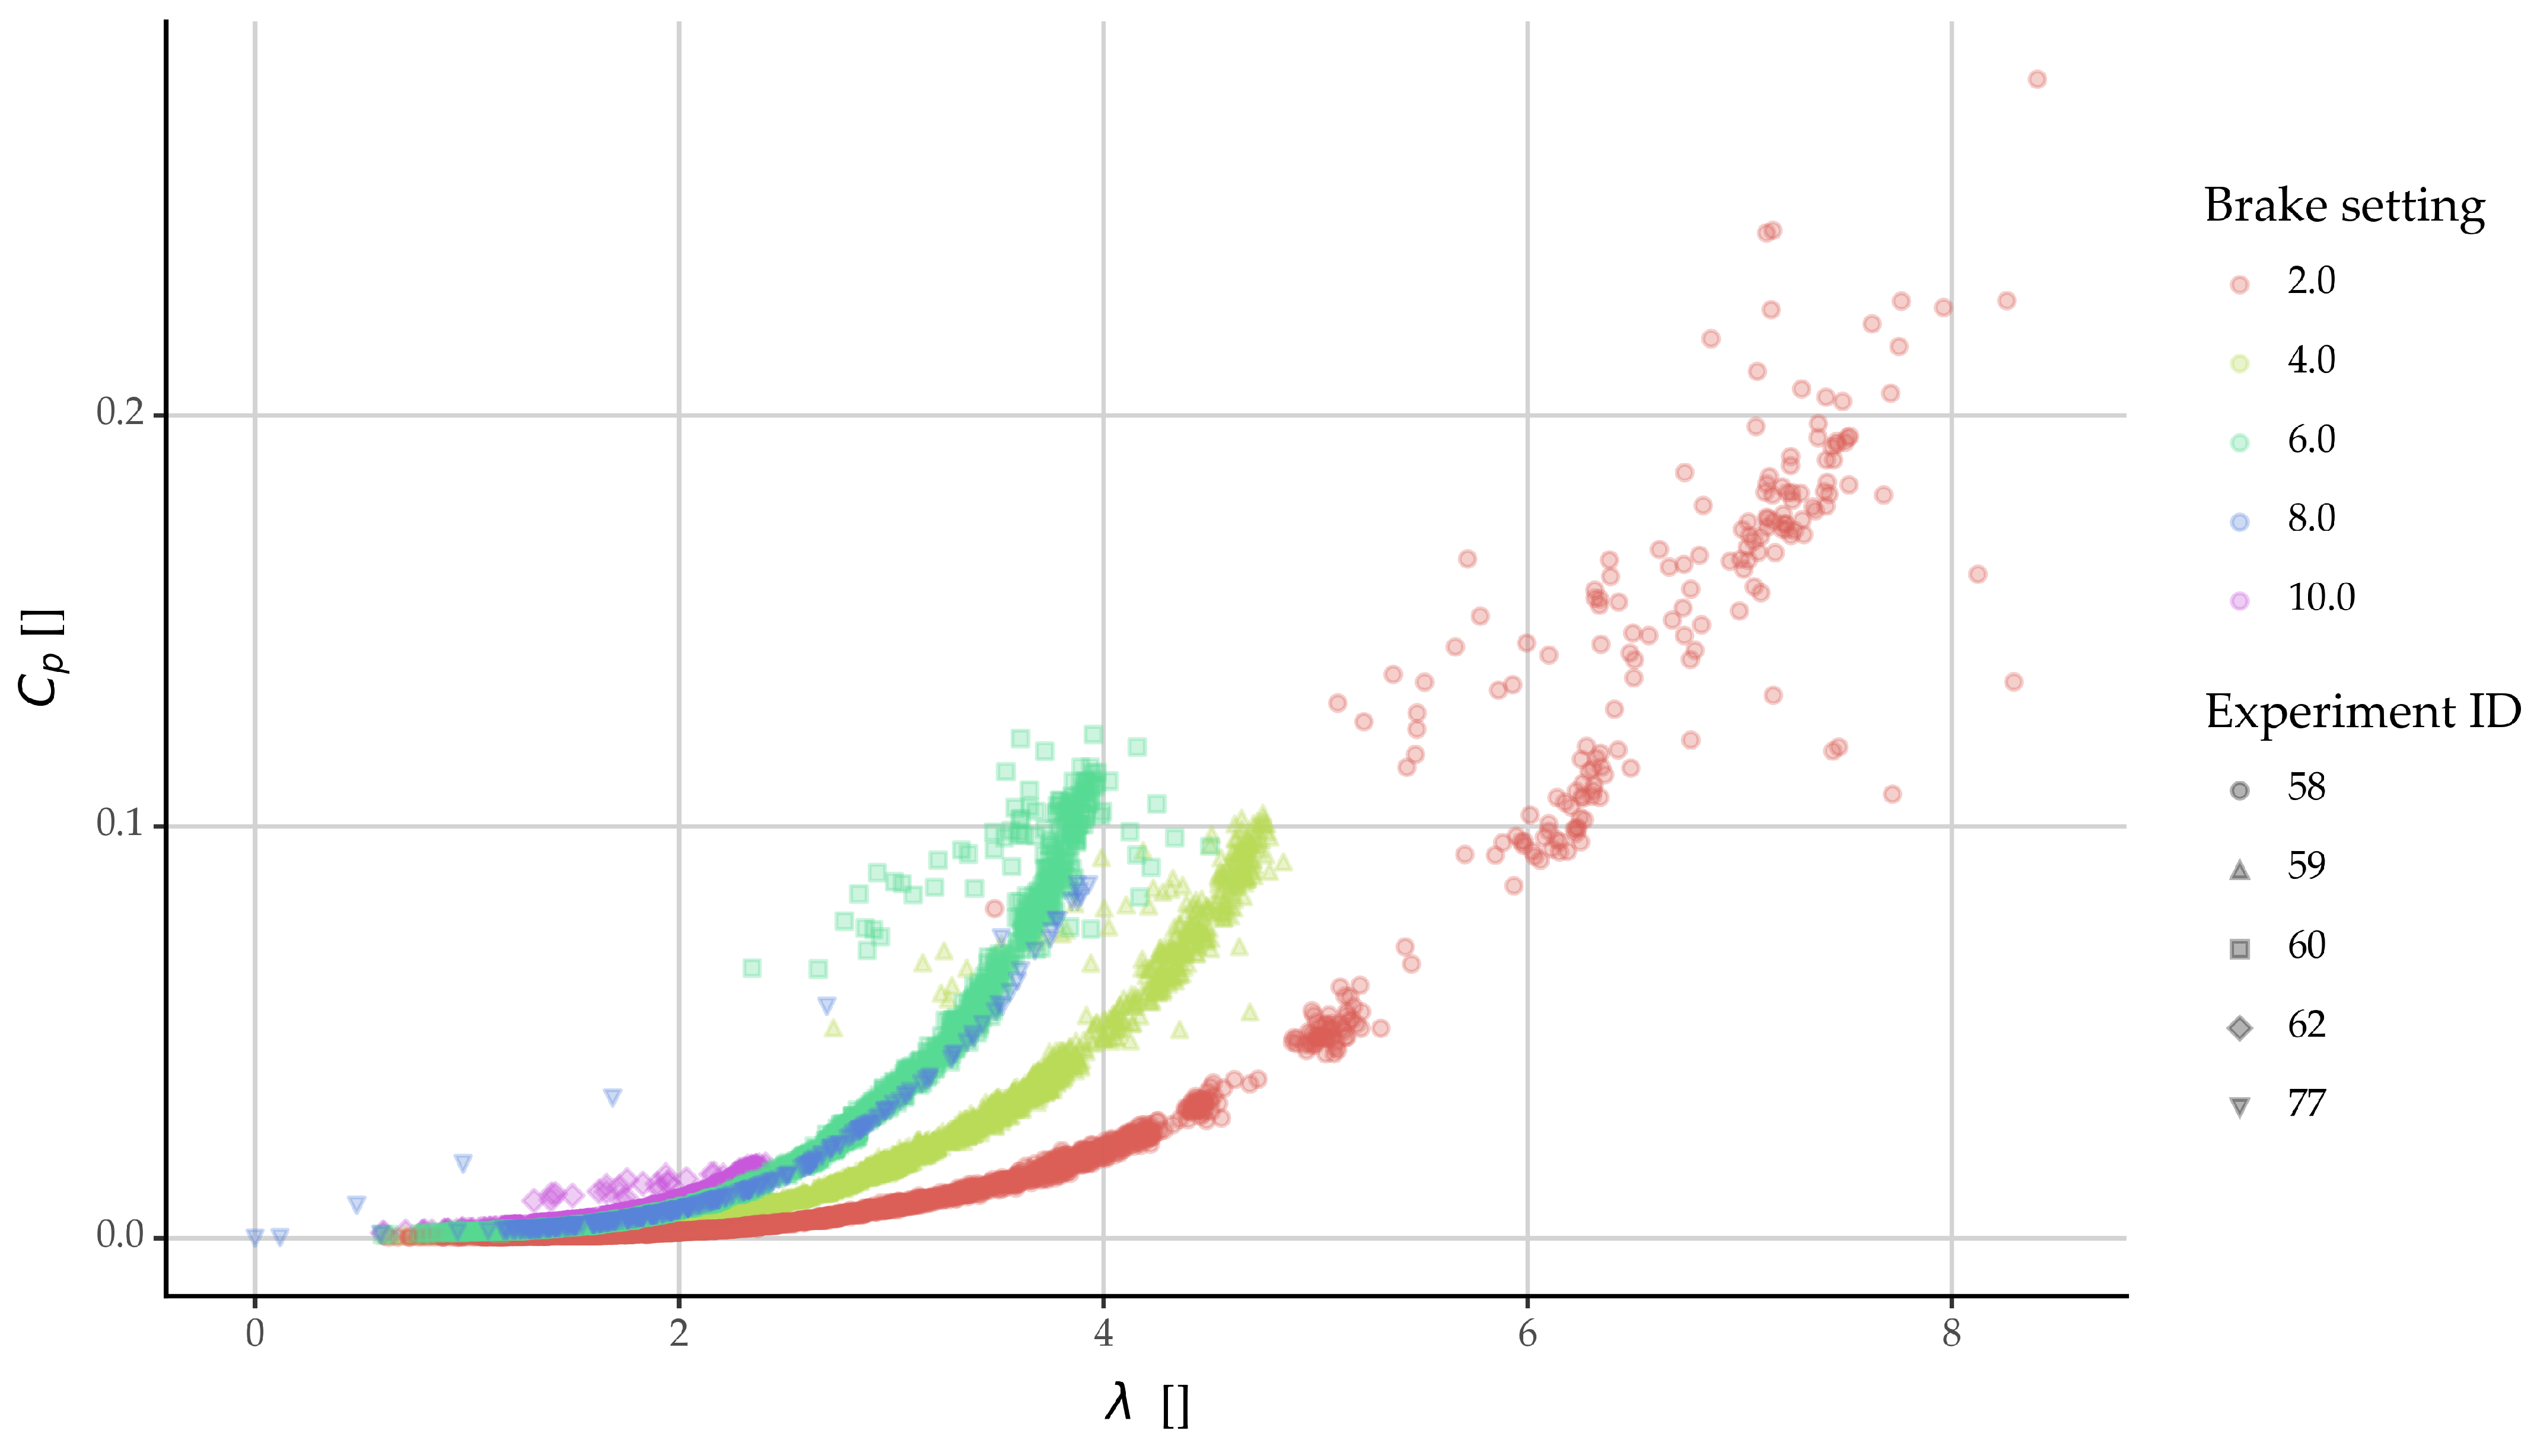
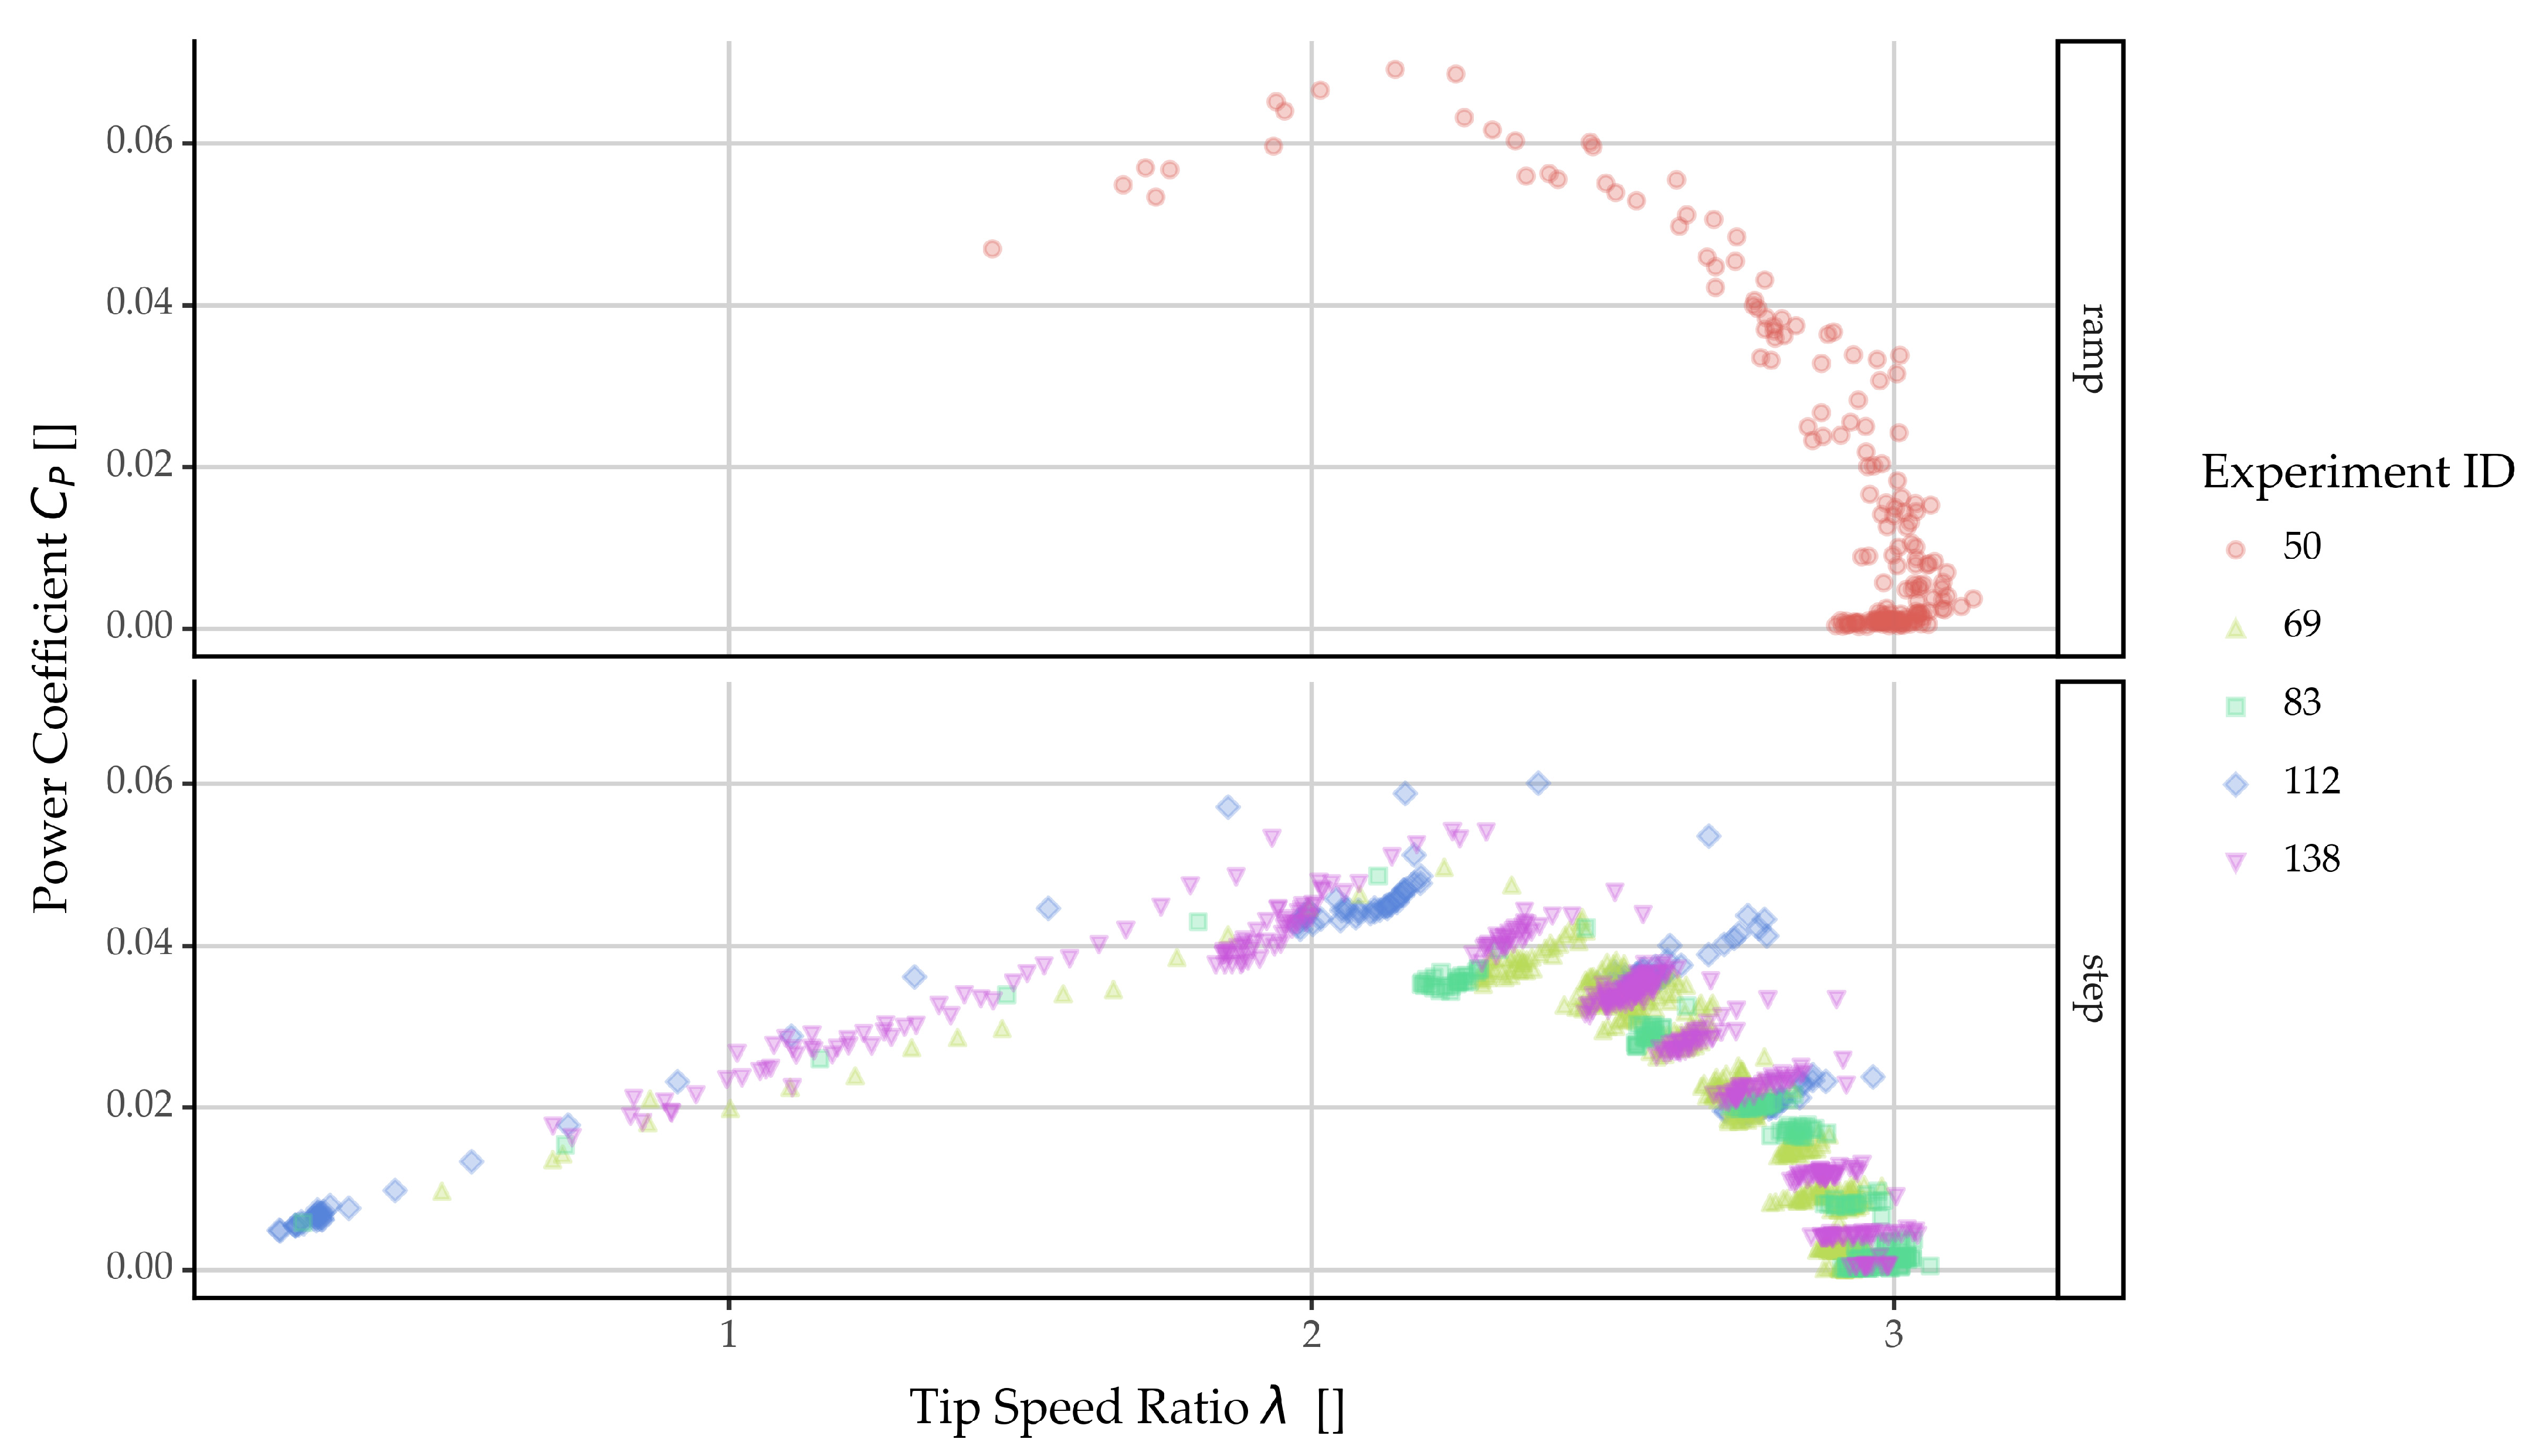
Despite these advancements, the method of manually adjusting the stepped increases by an operator introduced potential variability. However, the results demonstrated commendable repeatability across different testing days, which reinforces the reliability of the findings despite the lack of a strictly defined protocol. Comparatively, the step load conditions typically showed slightly lower C
p values for the same TSR values in the higher TSR range (see
Figure 14); however, it offered a richer depiction of behavior in the lower TSR range due to a greater number of measurements.
Moreover, while the Cp values obtained under ramped load conditions were generally higher, the clarity and control provided by the step approach made it more favorable for consistent data collection. This suggests that while the new loading method has significantly improved the experimental setup, ongoing adjustments and development are required to optimize this system for real-time power optimization and to further enhance the fidelity of data collection for wind turbine performance assessments.
5. Conclusions
This paper is the second installment in a two-part series investigating a novel flexible curved blade concept for wind turbines. In the first part, we fabricated and tested straight and curved blades with NACA4415 airfoil profiles using isotropic polymeric materials. Although the curved isotropic blades demonstrated some desirable control characteristics like fast starting, keeping power output from increasing uncontrollably and ultimately a power plateau beyond critical wind speeds, they fell short of meeting all design criteria. Notably, the nominal power was reached well beyond the nominal velocity, and the blades failed to safely shutdown at or beyond the cutoff velocity. Furthermore, in the first part of the series, the influence of load settings on power measurements and the mechanical brake’s inability to track the maximum power point were identified as significant issues.
Building on these findings, this work aimed to explore the potential of adjusting the GFRP orientation to enhance the blade’s flexibility, tailor its aerodynamic performance, and meet specific design criteria: quick start-up and rise to nominal power, stable power output between nominal and cutoff velocities, and safe shutdown beyond cutoff speeds. A secondary goal was to explore a different measurement setup that might enable optimal power yield to be obtained at different operating conditions.
To this end, identical GFRP blades with three layers oriented at 20 degrees relative to the blade’s longitudinal axis were fabricated from flat sheets of resin-impregnated three-layered GFRP. Each blade measured approximately 155 mm in length and was assembled onto a rotor hub with a final diameter of 355 mm, set at a fixed pitch angle of 5 degrees. This setup was then tested in a wind tunnel.
The methodology employed in this study to arrive at the optimal geometry and layup was labor-intensive and largely intuitive, reflecting the developmental stage of our simulation tools. The process was iterative, with each test cycle refining the blade design and setup based on the previous results. These experiences underline the need for further development of our tools and methods, which will be covered in subsequent publications.
Among various GFRP blades with different geometries and curvatures that were fabricated and tested, results are reported here for blade number 010. The analysis demonstrated that the curved GFRP blade design successfully met all the prescribed design criteria, showcasing that the curved concept is capable of achieving in full the functional criteria that were reported earlier. This success underscores the feasibility of designing and manufacturing passively controlled wind turbine blades that could potentially offer all the benefits of active pitch and stall control Wind Energy Converter Systems but with the simplicity and cost-efficiency of passive systems.
Despite the positive outcomes, this work primarily involved planar geometry as the blade was flat, being cut from a GFRP sheet. The achievement of design criteria with this simple geometry suggests that similar results might be feasible with more aerodynamically efficient cross-sectional profiles, warranting further investigation.
Moreover, a new approach to load application was explored by connecting the rotor shaft to a generator and employing a resistive load via a rheostat. This method provided a clearer and more linear relationship to load application compared to the mechanical brake used previously. Although this approach facilitated quick load adjustments, it did not allow (at least in the first iteration of our setup) for real-time digital control necessary for optimal power point tracking.
Two methods for applying load were explored in this study: a ramp method, where load is increased continuously and gradually, and a step method, where load is applied in discrete increments. Notably, the step-wise method was found to be more effective than the ramped method. It allowed the rotor hub’s rotational velocity to stabilize more consistently, which significantly improved data collection, particularly at lower Tip–Speed Ratio (TSR) values. Finally, the Power Coefficient (CP) values obtained from the ramped approach were generally slightly higher than those from the step approach.
Future Work
Further work in this study will focus on several key areas to enhance the understanding and application of curved wind turbine blade technology. First, there is a need to develop and refine the computational code used for designing and simulating the blades. More detailed presentations of the code will be provided, alongside comparisons between predicted and actual performance metrics. Consideration will also be given to making the code open source, which would facilitate broader collaboration and innovation in the field.
The investigation will continue with an emphasis on the flexible curved blade concept using Glass-Fiber-Reinforced Polymer (GFRP)-oriented materials. Future studies will detail the manufacturing processes, material orientation techniques, and resultant aerodynamic performances of these blades. Comprehensive results from these investigations will be reported to assess the viability and efficiency of the GFRP blades in practical applications.
Another significant aspect of upcoming research will involve a thorough analysis of the thrust/drag forces and the dynamic loading on both the rotor and the blade. There is also an imperative to quantify the flutter and dynamic behavior of the blades under various operational conditions. Although preliminary data are available, detailed studies are required to fully understand these dynamics and implement necessary design adjustments.
Scaling up the design from laboratory or small-scale models to larger, potentially commercial-sized applications is another critical area of focus. This scaling will help in understanding the challenges and adjustments needed for larger turbine implementations.
Additionally, improvements in the experimental setup are planned, particularly the inclusion of a Maximum Power Point Tracking (MPPT) system. Integrating MPPT technology will enhance the capability to precisely find the optimal operational conditions for the turbine systems, thereby maximizing efficiency and output under varying environmental conditions.
Together, these efforts will not only deepen the understanding of flexible wind turbine blades but also push forward the boundaries of renewable energy technology, making it more adaptable, efficient, and applicable on a larger scale.
