Article

Study on the Applicability of Autothermic Pyrolysis In Situ Conversion Process for Low-Grade Oil Shale: A Case Study of Tongchuan, Ordos Basin, China

1
State Key Laboratory of Shale Oil and Gas Enrichment Mechanisms and Effective Development, Beijing 100083, China
2
State Center for Research and Development of Oil Shale Exploitation, Beijing 100083, China
3
Shaanxi Key Laboratory of Advanced Stimulation Technology for Oil & Gas Reservoirs, Xi’an Shiyou University, Xi’an 710065, China
4
School of Energy and Power Engineering, Xi’an Jiaotong University, Xi’an 710049, China
5
College of Construction Engineering, Jilin University, Changchun 130021, China
6
School of Engineering and Technology, China University of Geosciences, Beijing 100083, China
*
Authors to whom correspondence should be addressed.
Energies 2024, 17(13), 3225; https://doi.org/10.3390/en17133225
Submission received: 24 May 2024 / Revised: 24 June 2024 / Accepted: 28 June 2024 / Published: 30 June 2024
(This article belongs to the Special Issue Recent Advances in Oil Shale Conversion Technologies)

Abstract

:
The feasibility of the autothermic pyrolysis in situ conversion (ATS) process for low-grade oil shale (OS) has not been determined. In this research, the pyrolysis and combustion properties of Tongchuan OS, with a 4.04% oil yield, were systematically analyzed. The findings revealed that temperatures between 350 and 425 °C favored oil production, while temperatures from 450 to 520 °C resulted in a higher rate of gaseous generation. At 300 °C, the volume expansion and ignition coking caused by the large amount of bitumen generated resulted in severe pore plugging, which significantly increased the combustion activation energy of the residue, while the presence of substantial flammable bitumen also significantly decreased the ignition and combustion temperatures. From 300 to 520 °C, the combustion performance of residue decreases continuously. In addition, pyrolysis residues of Tongchuan exhibited a slightly higher calorific value, between 425 and 520 °C, owing to its higher fixed carbon content (10.79%). Based on the ideal temperature screening method outlined for Tongchuan OS, the recommended preheating temperature for Tongchuan OS was 425 °C, while the optimum temperature for the retorting zone should be 510 °C, considering a heat utilization rate of 40%. These findings contribute valuable insights for the application of the ATS process to low-grade OS.

1. Introduction

Oil shale (OS), a kind of sedimentary rock rich in macromolecular organic matter, represents a form of unconventional fossil energy [1,2]. With the current energy crisis and the depletion of conventional oil sources, OS has gained significant interest, given its substantial reserves and widespread distribution [3,4]. Typically composed predominantly of a substance known as kerogen, alongside an inorganic mineral framework, OS presents unique challenges for extraction [5,6]. While it is resistant to solvent extraction, the large kerogen molecules can be transformed into liquid shale oil and gaseous products through heating at 300–550 °C [7,8]. Possessing properties akin to petroleum, shale oil exhibits versatile applications across various sectors, including transportation, medicine, agriculture, and the chemical industry, making it a viable substitute for petroleum [9,10]. Globally, OS deposits have the potential to yield approximately 411.1 billion tons of shale oil reserves, with China ranking second worldwide with reserves estimated at 60.8 billion tons [11]. As such, OS has the potential to become a viable substitute for petroleum as a source of energy, and its development and utilization carry immense significance in mitigating the energy crisis [12,13,14].
China’s OS resources are primarily concentrated in the east, central, and west regions of the country, accounting for 62%, 17%, and 8% of the converted shale oil resources, respectively [15]. Moreover, most of China’s OS deposits exhibit oil yields ranging from 4% to 10%, with few basins exceeding 10% oil yield [11,15]. According to research conducted by Liu et al., OS resources with less than 10% oil yield make up 87% of China’s total resources [15]. Consequently, China’s OS resources are characterized by wide distribution and low-grade quality. The Ordos Basin, which includes eight OS-rich regions symbolized by Tongchuan, is host to the majority of central China’s OS resources. In the Ordos Basin, OS thickness generally ranges from 0.79 to 13.9 m, with an oil yield of 6.12% on average and 9.25% on maximum [15,16].
Currently, two major extraction technologies for OS are in use: surface retorting and underground in situ conversion [17,18]. Thanks to its cost-effectiveness, environmental friendliness, and ability to access deeper layers of OS without mining, the underground in situ conversion technology has emerged as a preferred method for extracting OS resources [19,20]. Over the past few years, numerous in situ OS conversion technologies have been developed [21]. In addition, the combination of in situ conversion with some EOR methods, such as catalysts, can facilitate the production of hydrocarbons, further increasing its application potential [22,23]. Among them, the autothermic pyrolysis in situ conversion (ATS) process represents one of the most promising techniques for OS extraction [24,25]. This method involves injecting oxygenated gas underground, utilizing the exothermic nature of residual carbon by-products in the pyrolysis residue to generate heat, heating subsequent layers to promote kerogen pyrolysis, and ultimately initiating an autothermic pyrolysis chain reaction in situ to produce hydrocarbons [26,27]. Successful field pilot experiments employing the ATS process have been conducted in Nong’an and Fuyu, Jilin, China, resulting in significant recoveries of shale oil and gas. These endeavors have conclusively demonstrated both the theoretical and technical feasibility of the ATS process [28,29].
The ATS process encompasses three main stages: preheating, initiation, and reaction, as shown in Figure 1 [30]. In the preheating stage, the targeted in situ layer is electrically heated to reach the desired temperature. Following this, oxygen-containing gas is injected to initiate the target layer, facilitating the oxidation reaction between oxygen, pyrolysis hydrocarbon products, residual kerogen, and residual carbon present in the residue. The resulting heat is then released to heat the subsequent layer, constituting the initiation stage. By controlling parameters such as oxygen concentration and gas flow rate, it becomes possible to completely consume the injected gas’s oxygen within the combustion zone, generating substantial amounts of CO2 and water products. Subsequently, a high-temperature gas mixture comprising injected nitrogen, produced CO2, and water vapor moves backward into the retorting zone. Hence, the oxidation reaction primarily occurs in the combustion zone, whereas anaerobic pyrolysis of organic matter takes place predominantly in the retorting zone. The combustion heat of residue in the combustion zone is transferred forward, heating the subsequent OS layers. The hydrocarbon products produced within the retorting zone continue to be delivered to the extraction well, as the entire reaction zone proceeds forward, forming an underground chain reaction—the reaction stage. In this stage, all the heat required for in situ production derives from combustion reactions of residual organic matter and residual carbon within the OS residue [30,31].
As mentioned above, the combustion characteristics of the residue in the reaction process and whether the residue combustion heat can satisfy the heat required for the pyrolysis of OS are the keys to the success of the implementation of the reaction stage during the ATS process. In recent years, several studies on the combustion properties of OS have now been reported [32,33,34,35,36,37,38]. The results of the ambient-pressure kinetic studies indicate that the atmosphere of 30% O2/70% CO2 is the preferred environment for the combustion of OS and that the combustion process consists of multiple reaction stages. Moreover, the variety of organic and mineral compositions in oil shale has considerable influence on the thermal behavior and kinetic characteristics of oil shale [32,33]. While at 5 MPa, OS was susceptible to significantly higher heat release in the low-temperature oxidation (LTO) region than in the high-temperature oxidation (HTO) region, shortening the oxidation induction time of the OS [34]. In addition, three reaction stages were observed during the oxidative reaction of bitumen, i.e., low-temperature oxidation, fuel deposition, and high-temperature oxidation. Whereas for kerogen, two major stages occurred, which were considered as fuel deposition and high-temperature oxidation [35,36]. Furthermore, the mineral matrix in oil shale has an obvious catalytic effect on the thermo-oxidative decomposition of kerogen [37,38].
In our prior work, we investigated the combustion characteristics of pyrolysis residues obtained from high-grade Huadian OS samples (oil yield is 14.91%), as well as the heat supply-demand relationship during the reaction process, determining the optimal temperature parameters for the reaction. Results demonstrated that residues obtained from the pyrolysis of high oil yield samples still fulfill the required combustion heat supply during the reaction stage while achieving higher oil and gas yields. However, as mentioned earlier, much of China’s OS is low-grade. Compared to high-grade OS samples, pyrolysis residues from low-grade OS contain fewer residual organic matter and residual carbon by-products. Consequently, the potential residual heat in these residues is significantly lower, leaving uncertainty regarding their ability to meet the production requirements of the ATS process. Present research on ATS primarily focuses on high-grade OS, with limited attention given to its low-grade counterparts. Therefore, it is of utmost importance to explore the combustion characteristics and the heat supply-demand relationship of low-grade OS and its pyrolysis residues during the ATS process in order to expand the technology’s applicability and assist in the extraction of low-grade OS.
This study presents an investigation into the combustion activation energy, combustion properties, and product release characteristics of Tongchuan OS samples obtained from the Ordos Basin in China, which has an oil yield of 4.04%. The aim is to systematically explore the heat supply-demand relationship of low-grade OS and its pyrolysis residues during the reaction stage of the ATS process. By comparing the results with those of high oil yield Huadian OS, the feasibility of applying the ATS process to low-grade OS and the influencing factors are discussed. The findings contribute to the understanding of utilizing the ATS process for the extraction of low-grade OS, offering insights for in situ extraction efforts targeting low-grade OS in China and worldwide.

2. Materials and Methods

2.1. Materials

The raw OS used in this study was obtained from Tongchuan, Ordos Basin, China. The proximate, ultimate, and Fischer assay analyses of the raw OS are presented in Table 1. The proximate analysis of the samples was carried out according to GB/T 212-2008 [39]. A vario MICRO cube elemental analyzer (Elementer, Frankfurt, Germany) was utilized for the ultimate analysis. The working temperature inside the combustion furnace was 960 °C, while the pressure of O2 was 0.20 MPa. Fischer analysis was carried out with reference to SH/T 0508-1992 [40]. These analyses were conducted in triplicate, and the average values were used. Prior to the experiment, the OS samples were crushed and screened to achieve particles sized between 0.4 and 1.7 mm. Subsequently, before conducting further experiments, it was thoroughly mixed and dried for ten hours at 80 °C in the oven.

2.2. Experiments

The experimental apparatus used in this study is depicted in Figure 2, and the experimental procedure followed is as described in our previous study [30]. Initially, 20 grams of OS sample was positioned within a quartz retort fitted with a wire mesh to facilitate the purging of nitrogen, enabling the extraction of oil and gas products. Subsequently, the OS specimens underwent gradual heating from room temperature (20 °C) to target temperatures (300, 325, 350, 375, 400, 425, 450, 475, and 520 °C) at a heating rate of 10 °C/min using an external heating system in N2. Upon reaching the desired temperature, the samples were subjected to a 2 h holding period to ensure thorough pyrolysis. A consistent nitrogen flow of 50 mL/min was maintained through a flow controller to ensure efficient extraction of oil and gas products from the retort, and to prevent temperature fluctuations caused by heat absorption.
Throughout the experimental process, the generated liquid products were condensed and recovered in a condensation vessel maintained at −10 °C, employing an aqueous solution of ethylene glycol. As the device had cooled to room temperature after the experiment, the liquid by-products and OS residues were collected and weighed. The oil-water mixture was weighed and subsequently separated using a toluene-water azeotrope to determine their respective yields, with the gas yield computed differentially. To ensure reliability and consistency, each experiment was replicated a minimum of three times under identical conditions. Yields deviating by less than 5% across the repetitions were retained, and the average values were designated as the final results.
The original Tongchuan OS was denoted as Sraw, with the resulting residues at distinct pyrolysis temperatures labeled as SR300, SR325, SR350, SR375, SR400, SR425, SR450, SR475, and SR520, correspondingly. The prefix “R” was indicative of residues from pyrolysis, whereas the succeeding number represented the pyrolysis temperature.

2.3. Analytical Methods

Thermal analyses, encompassing thermogravimetric (TG) and differential scanning calorimetry (DSC), were executed using an STA 449F3 thermal analyzer from Netzsch, Bavaria, Germany. Nitrogen assumed the role of the protective gas at a flow rate of 20 mL/min, with N2 or air operated as carrier gases at a flow rate of 80 mL/min. Heating rates of 2, 5, and 10 °C/min were applied. Approximately 20 mg of powdered sample was utilized in each test to mitigate temperature gradients and heat and mass transfer distortions. Preceding the TG/DSC analysis, the OS sample was finely pulverized and mixed to ensure sample uniformity. To guarantee precision and reproducibility, duplicate trials were conducted, with discrepancies in mass loss and temperature maintained below 0.5 wt% and 1 °C, respectively.

3. Results and Discussion

3.1. The Pyrolysis Behavior of Tongchuan OS

3.1.1. Yields of Pyrolysis Products

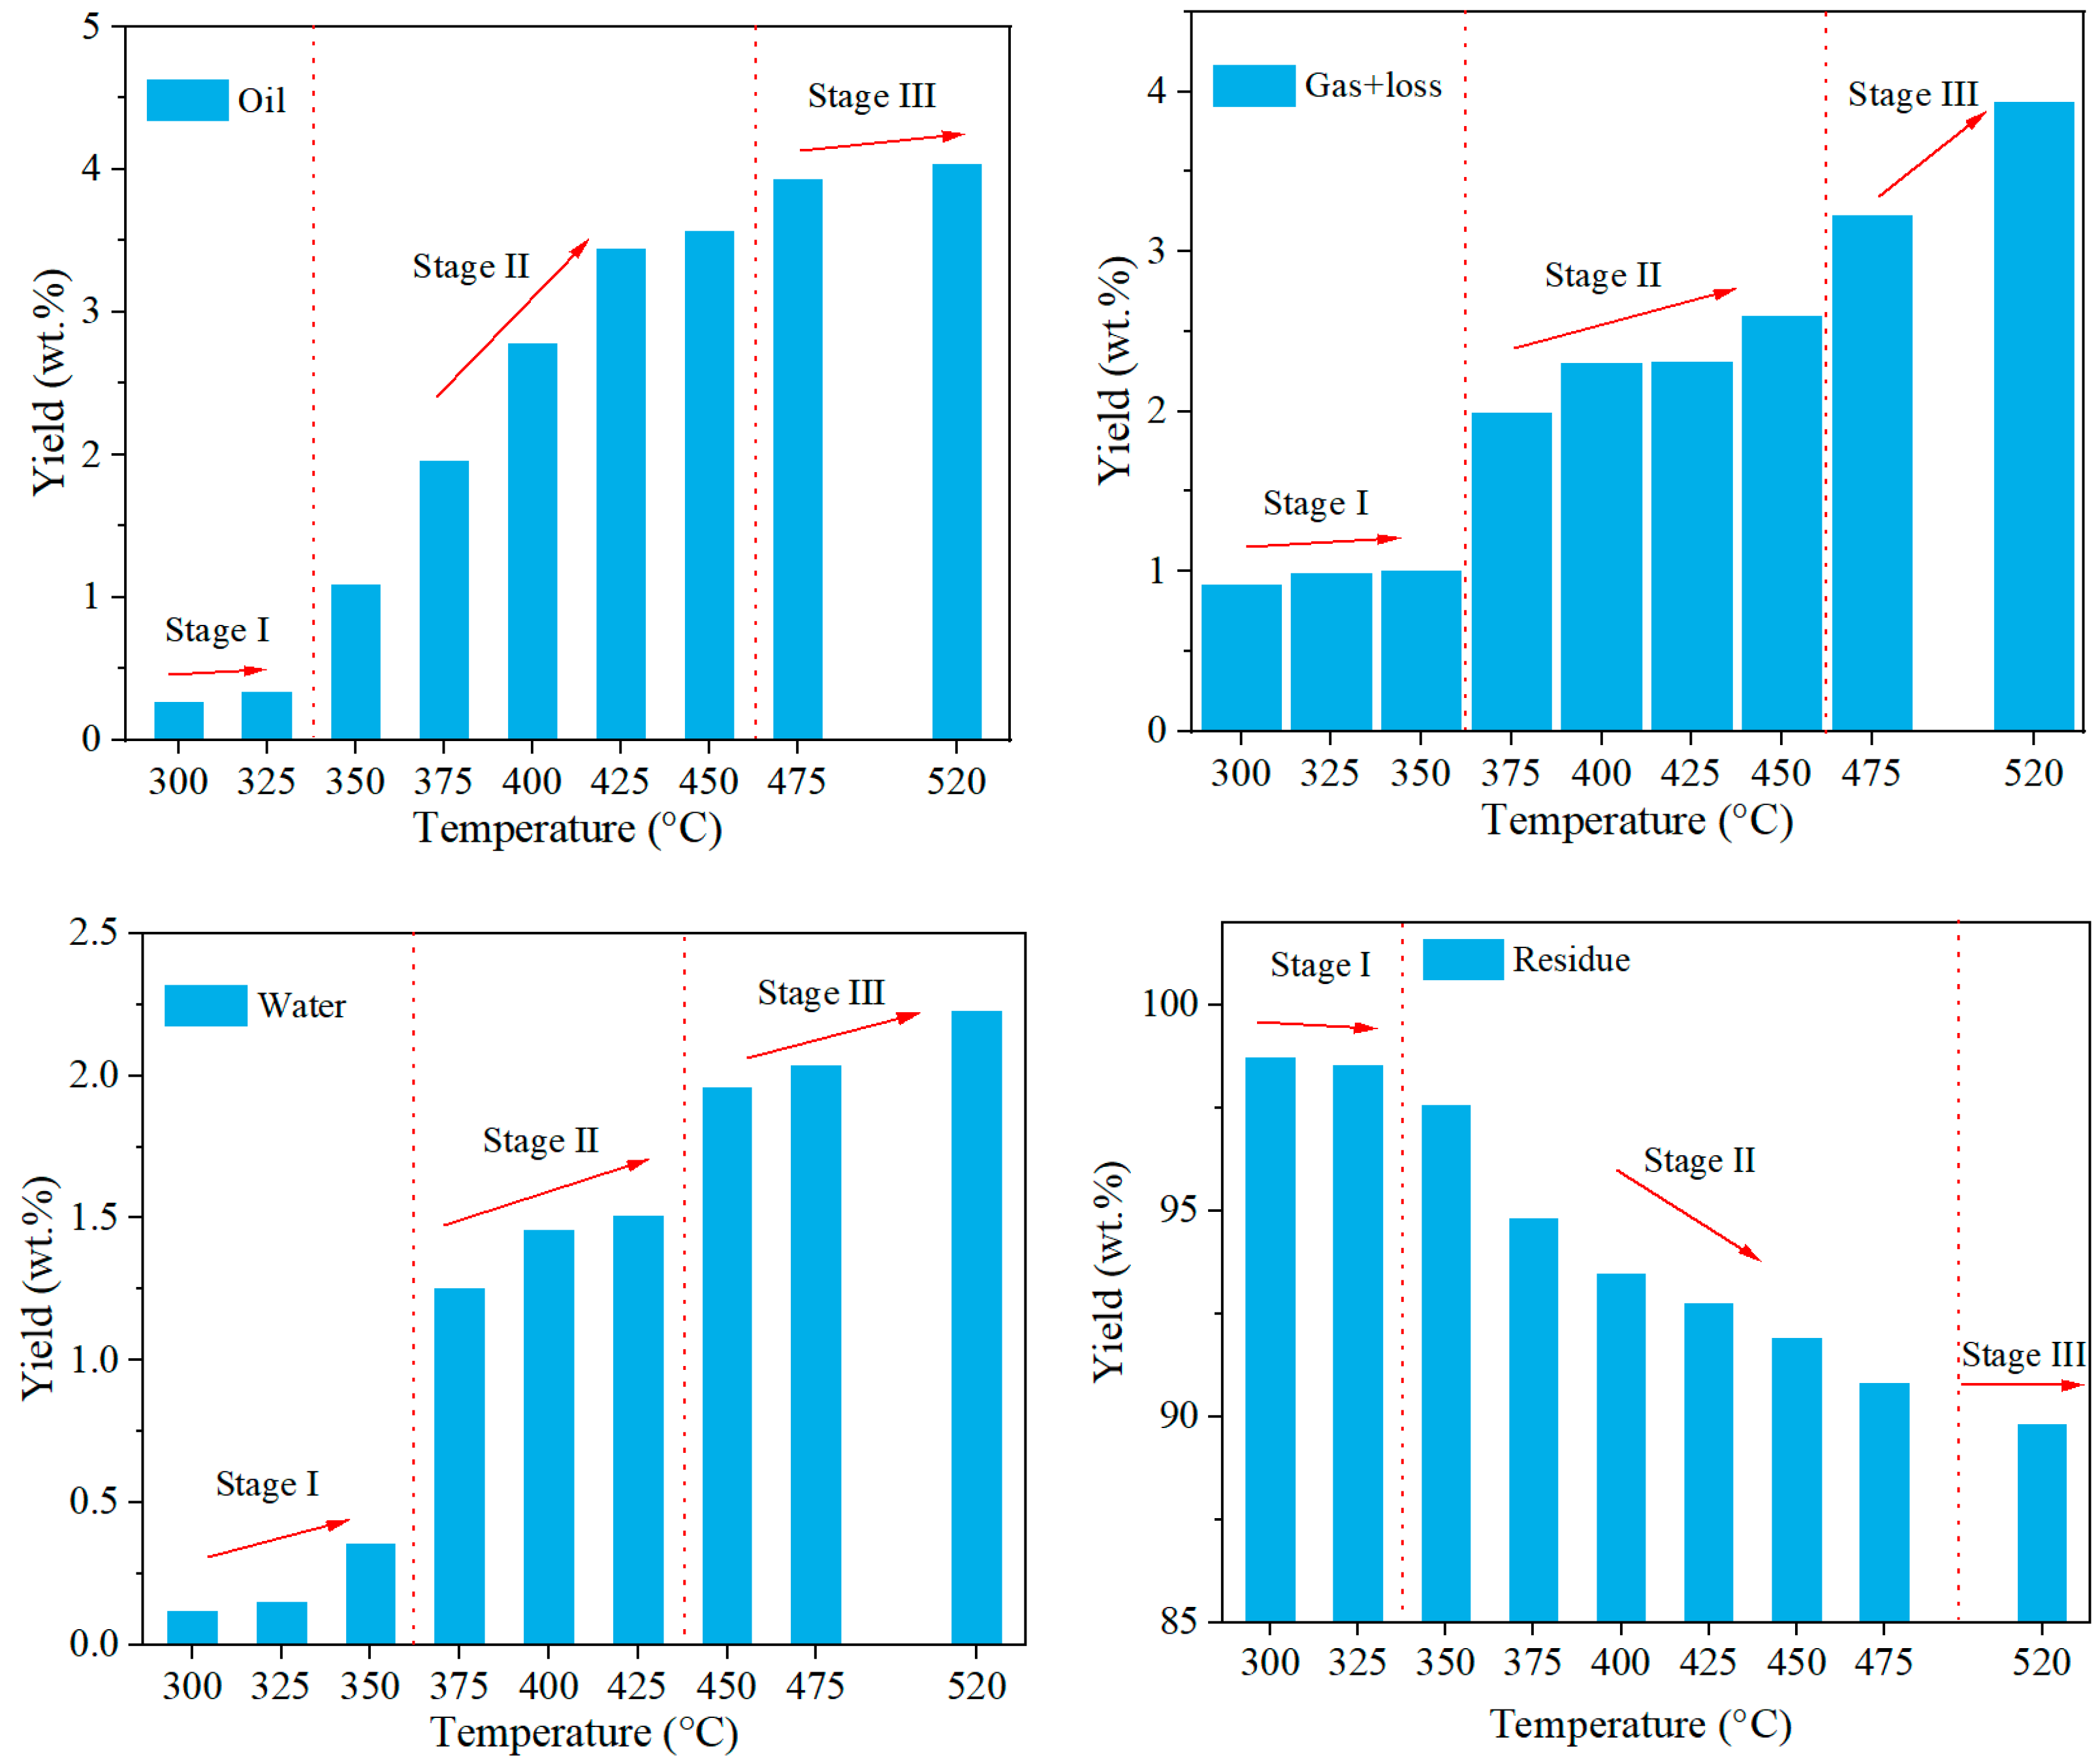
Figure 3 illustrates the yields of different pyrolysis products obtained from Tongchuan OS at varying temperatures. The results demonstrate a consistent increase in the yields of oil, gas, and water with higher pyrolysis temperatures, while the yield of residue exhibits a decline. The distribution of product yields exhibits a distinct three-stage pattern, and the corresponding temperature intervals for each stage are summarized in Table 2.
Typically, the kerogen in OS is first converted to bitumen, after which the bitumen continues to crack to produce hydrocarbon products [8,14]. Table 2 reveals that during Stage I, the oil yield ranges from 0.27% to 0.34%, corresponding to a temperature range of 300–325 °C. Simultaneously, the gas yield falls between 0.91% and 1.00%, within the temperature range of 300–350 °C. At these lower temperatures, only a portion of the free bitumen in the OS is released. The temperature in Stage I does not reach the pyrolysis temperature of kerogen, preventing its cracking and subsequent hydrocarbon production, leading to low oil and gas yields. In Stage II, which spans the temperature interval of 350–425 °C, the oil yield ranges from 1.09% to 3.44%, while the gas yield stands at 1.25–1.51%. During this stage, the pyrolysis temperature prompts kerogen cracking and the consequent generation of a considerable amount of oil and gas. The rapid increase in oil yield compared to the slower increase in gas yield suggests that kerogen tends to crack and produce oil to a greater extent within this temperature range. In Stage III (450–520 °C), the oil yield ranges from 3.56% to 4.04%, while the gas yield falls within the range of 3.22–3.93%. This stage indicates that the pyrolysis of kerogen within the OS has reached completion, and the primary reaction involves a secondary cracking of residual heavy hydrocarbons in the matrix to generate gaseous products, with relatively slower oil production but faster gas production rates.
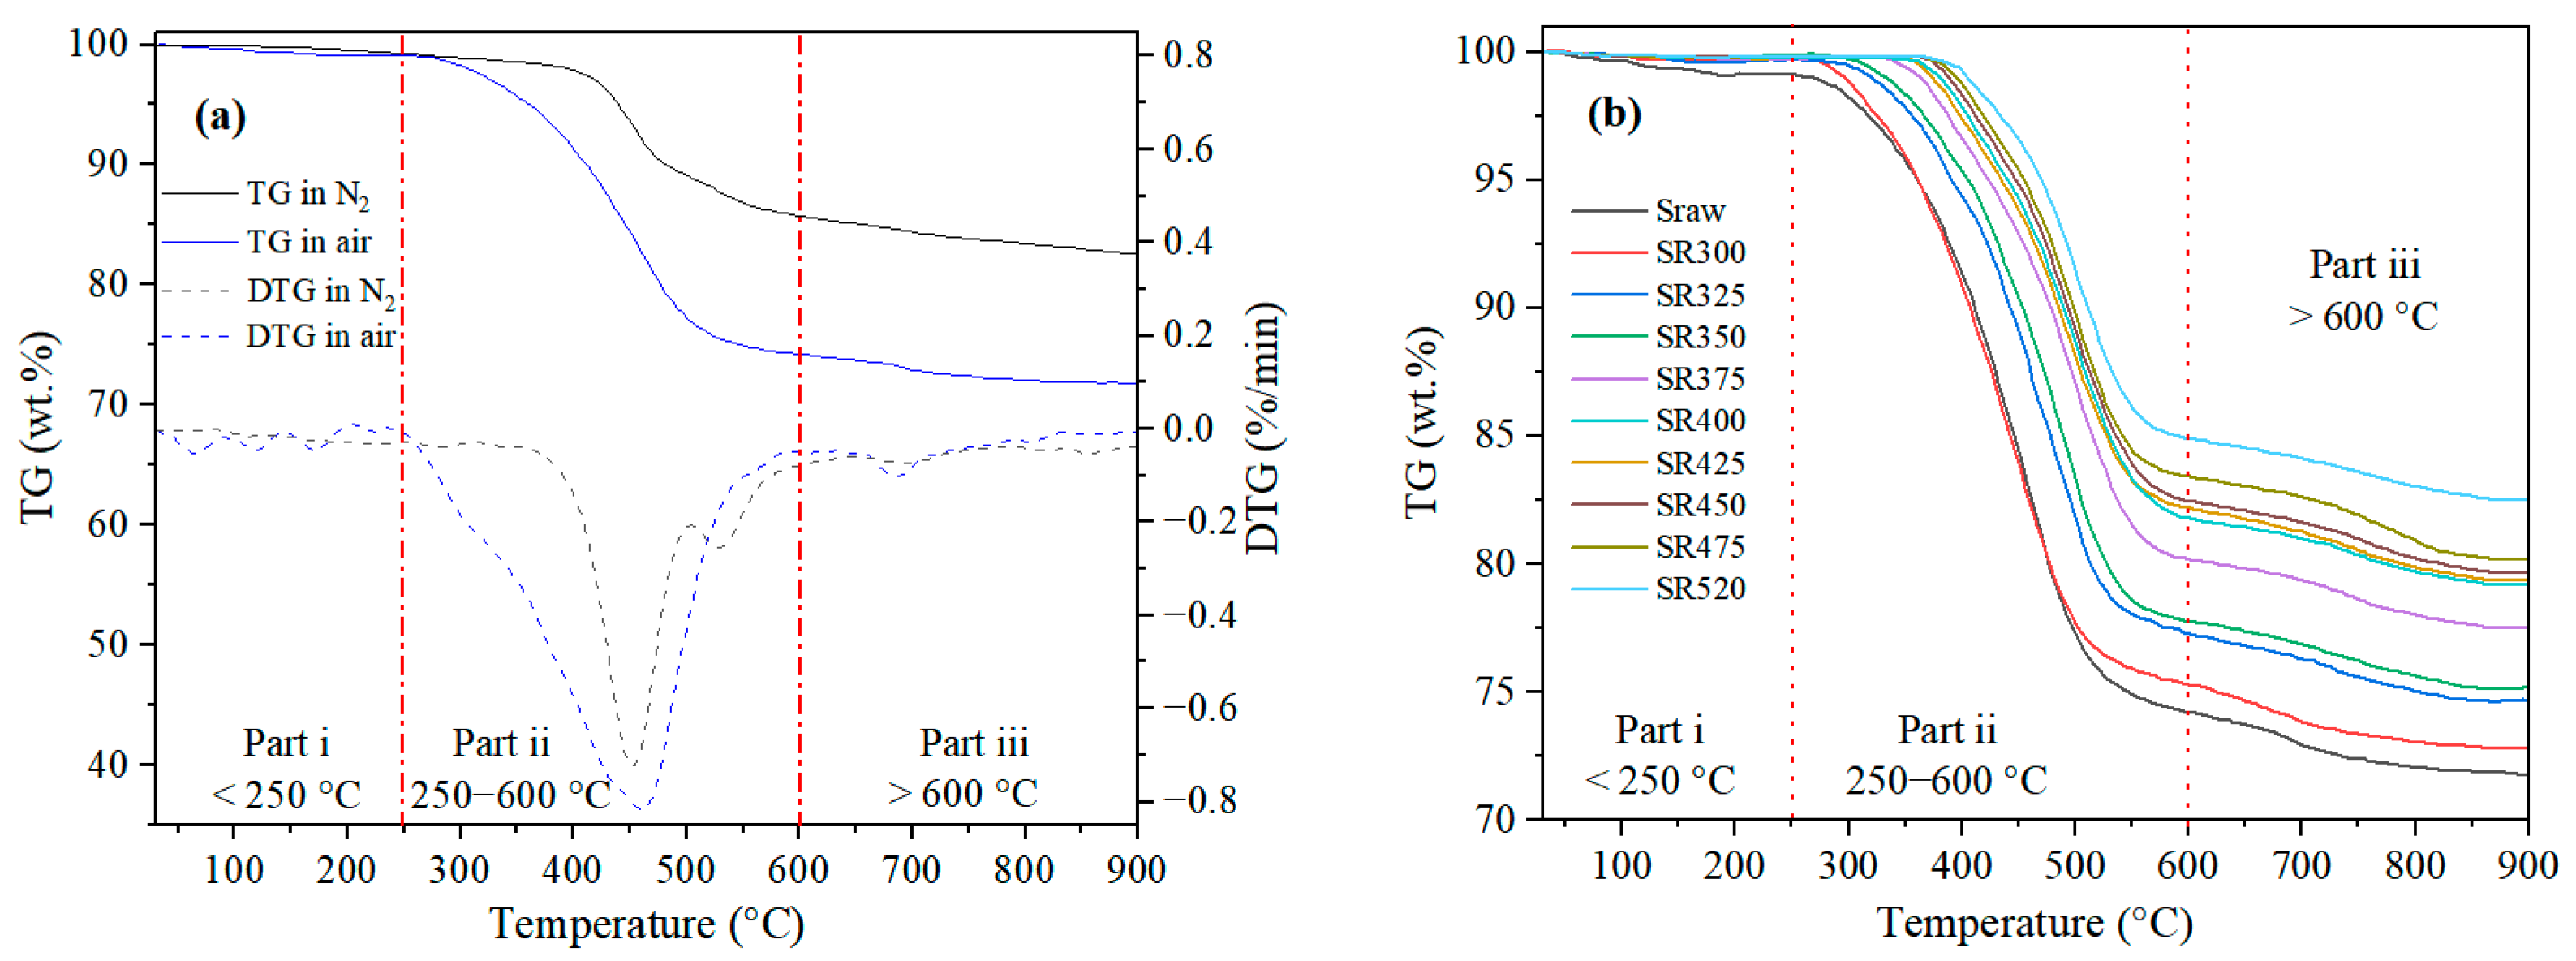
Additionally, the water yield shows a continuous increase with temperature, exhibiting three distinct stages: low, medium, and high. The water yield is lower in Stage I, higher in Stage II, and reaches its peak in Stage III. Generally, water primarily originates from interlayer and bound water within clay minerals. The observed phenomenon suggests that the evaporation of water from clay minerals exhibits three distinct stages corresponding to temperature variations. Moreover, the yield of residue gradually decreases with increasing temperature. The decline is gradual in Stage I (300–325 °C), faster in Stage II (325–520 °C), and stabilizes near Stage III (520 °C). This trend can also be observed in the TG curve depicted in Figure 4a.

3.1.2. Residual Organic Matter in Residues

Figure 4a presents the TG/DTG curves of Tongchuan OS under different atmospheres with increasing temperatures, while Figure 4b displays the TG curves of OS and pyrolysis residue in air at different temperatures. The TG/DTG curves can be categorized into three parts: (i) below 250 °C, mainly representing the evaporation of free bitumen and water, including interlayer water from clay minerals; (ii) ranging from 250 to 600 °C, primarily attributed to kerogen pyrolysis and the oxidative reaction between organic matter and residual carbon; and (iii) above 600 °C, associated with clay minerals and carbonate decomposition. In this case, the weight loss in part ii under nitrogen denotes the hydrocarbon generation potential of kerogen within the OS, while the weight loss under air represents the content of organic matter and residual carbon in both the OS and residue. The weight losses of the OS and pyrolysis residue in part ii were calculated, and the results are illustrated in Figure 5.
As depicted in Figure 5, the weight loss of Tongchuan OS in part ii of the TG curve under nitrogen is 13.51%. However, when exposed to air, the weight loss increases to 24.92%, indicating an 11.41% difference compared to nitrogen. This discrepancy can be attributed to the oxidation of heavy hydrocarbon components and residual carbon present in the OS matrix after kerogen pyrolysis. The oxidation process in air consumes these components, leading to a higher weight loss. Moreover, as the pyrolysis temperature rises, the weight loss of the pyrolysis residue in part ii decreases due to the release of significant hydrocarbon products. At a pyrolysis temperature of 520 °C, the residue still contains substantial amounts of residual carbon and heavy hydrocarbon components, indicating its high heat potential.

3.2. Analysis of Reaction Activation Energy

3.2.1. Kinetic Model

In order to investigate the kinetic properties of Sraw and different residues, kinetic analysis and calculations were performed on the TG results. The rate equation for the reaction based on the Arrhenius equation was employed to analyze and calculate the reaction kinetics, as follows [14,33]:
d α / d t = A exp ( E α / R T ) f ( α ) ,
where α is the conversion rate; t is time, min; A is the pre-exponential factor, s−1; Eα denotes the apparent activation energy, kJ/mol; R is the universal gas constant, 8.314 J·mol−1·K−1; T is the reaction temperature, K; f(α) is a reaction model function that specifies the reaction rate’s dependency on the extent of the reaction.
The conversion rate α can be expressed as [14,33]:
α = ( m 0 m t ) / ( m 0 m ) ,
where m0 denotes the sample’s initial mass, mt denotes the sample mass at t, and m denotes the sample’s final mass.
The heating rate, β, is defined as:
β = d T / d t
The parameters E, A, and f(α) of the kinetic triplet are determined by the following three methods in this study [14,30]. The Flynn-Wall-Ozawa (FWO) method is described in Equation (4):
ln β = ln A E R g ( α ) 5.331 1.052 E R T
Friedman’s method is a type of differential method, as shown in the following equation:
ln ( β d α d T ) = ln A f ( α ) E R T
The following expression is used in the Kissinger-Akahira-Sunose (KAS) method:
ln β T 2 = ln A R E g ( α ) E R T
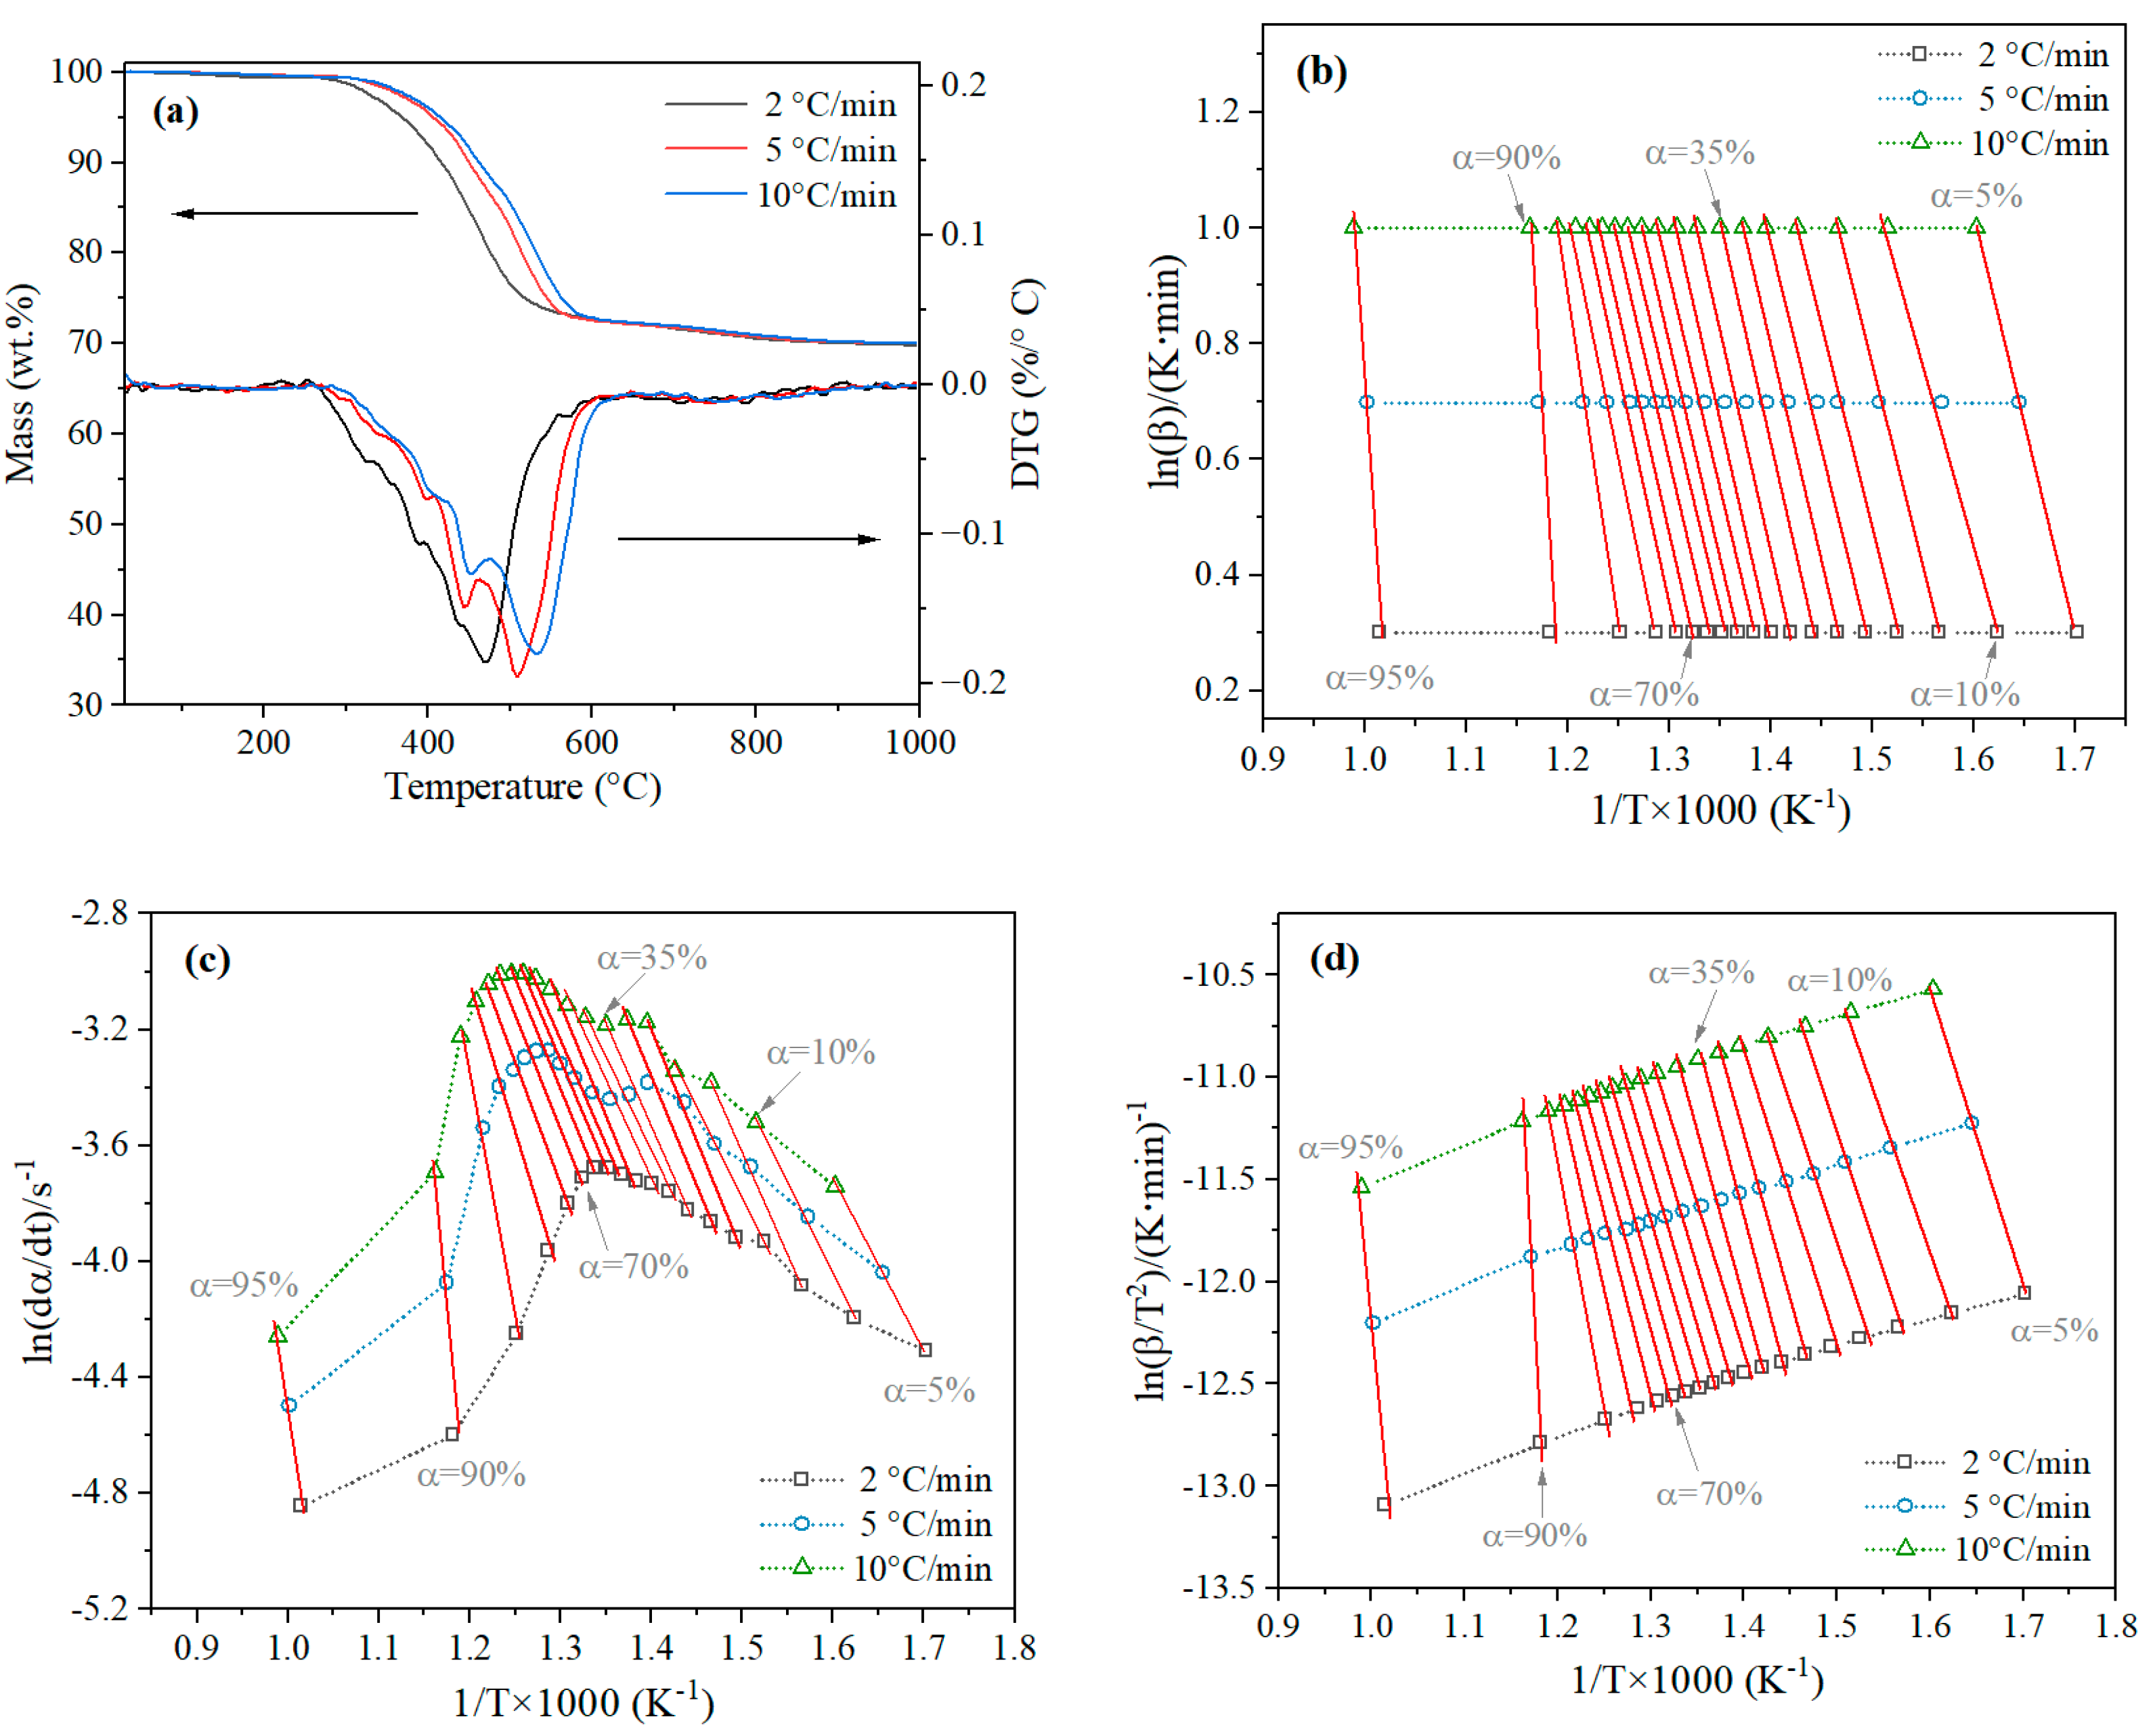
where g(α) is a similar reaction model to f(α). The slope under the same conversion at various heating rates yields the estimations of E based on each conversion degree. The FWO method’s lnβ vs. 1/T, the Friedman method’s ln[β(dα/dt)] vs. 1/T, and the KAS method’s ln(β/T2) vs. 1/T are the regression lines [14,33]. The FWO, Friedman, and KAS methods are all common modeless function methods. In general, Friedman is considered to be the most accurate method, but it is very sensitive to experimental noise, meaning that the results are often unstable. Doyle’s approximation is often used in FWO, but its accuracy has been questioned, and it is generally considered to be credible when 32 < E/RT < 45 is satisfied. The KAS method adopts the Murray-White approximation, which is used in the range of 20 < E/RT < 50. Usually, the KAS method calculates more accurate results than FWO [41,42,43,44]. The TG data therefore yielded the corresponding kinetic parameters, as shown in Figure 6b–d.

3.2.2. Reaction Activation Energy

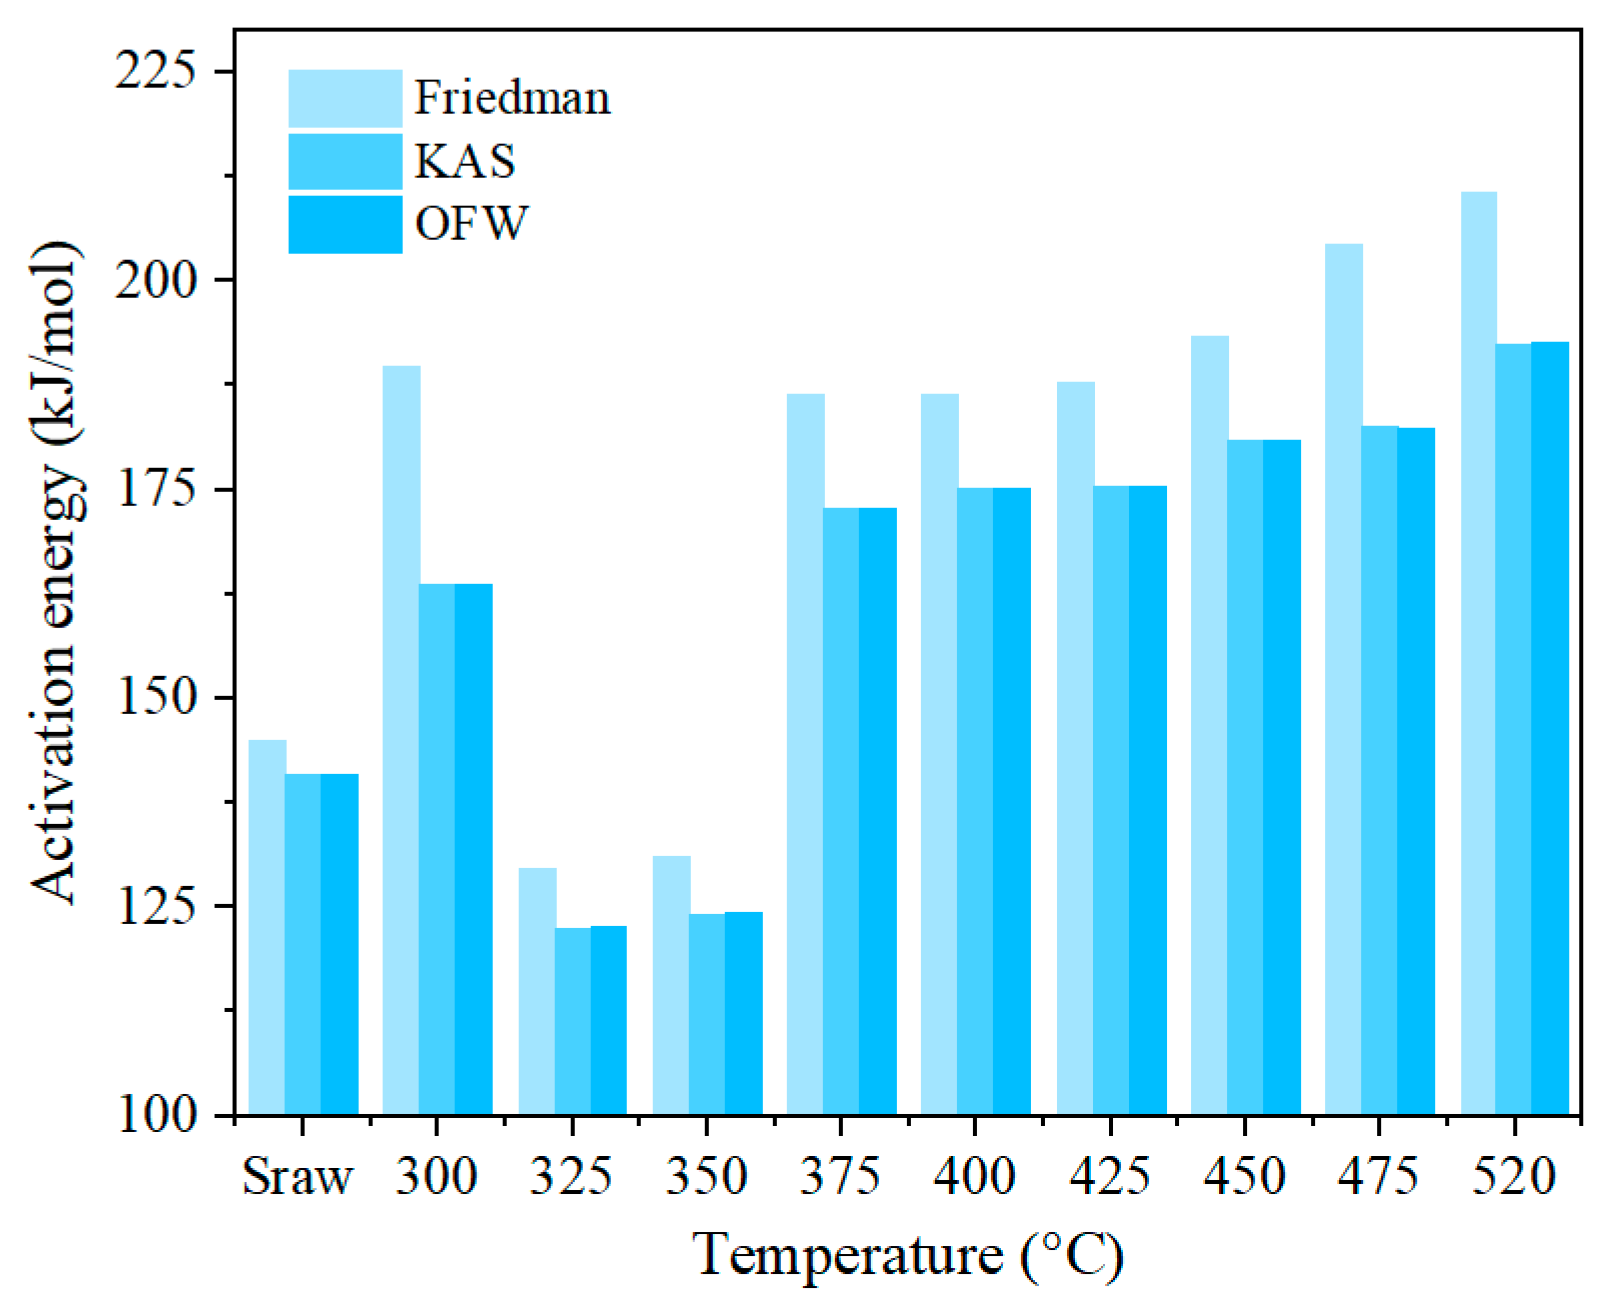
Figure 7 displays the combustion activation energies of Sraw and pyrolysis residues at different temperatures by the three methods. The activation energies obtained from all three methods exhibit consistent trends. It is observed that SR300 exhibits a significant increase in combustion activation energy compared to Sraw. At 300 °C, the solid kerogen inside the oil shale begins to crack to form liquid bitumen. The organic matter expands in volume as a result, clogging the pores [11,19]. In addition, the bitumen tends to coke during ignition, further clogging the pores [45,46]. Severe pore clogging due to volume expansion and bitumen coking can negatively affect the ignition characteristics of the residue and raise the combustion activation energy. This phenomenon aligns with previous studies conducted by our group [30].

3.3. Analysis of Combustion Properties

3.3.1. Parameter Acquisition and Calculation

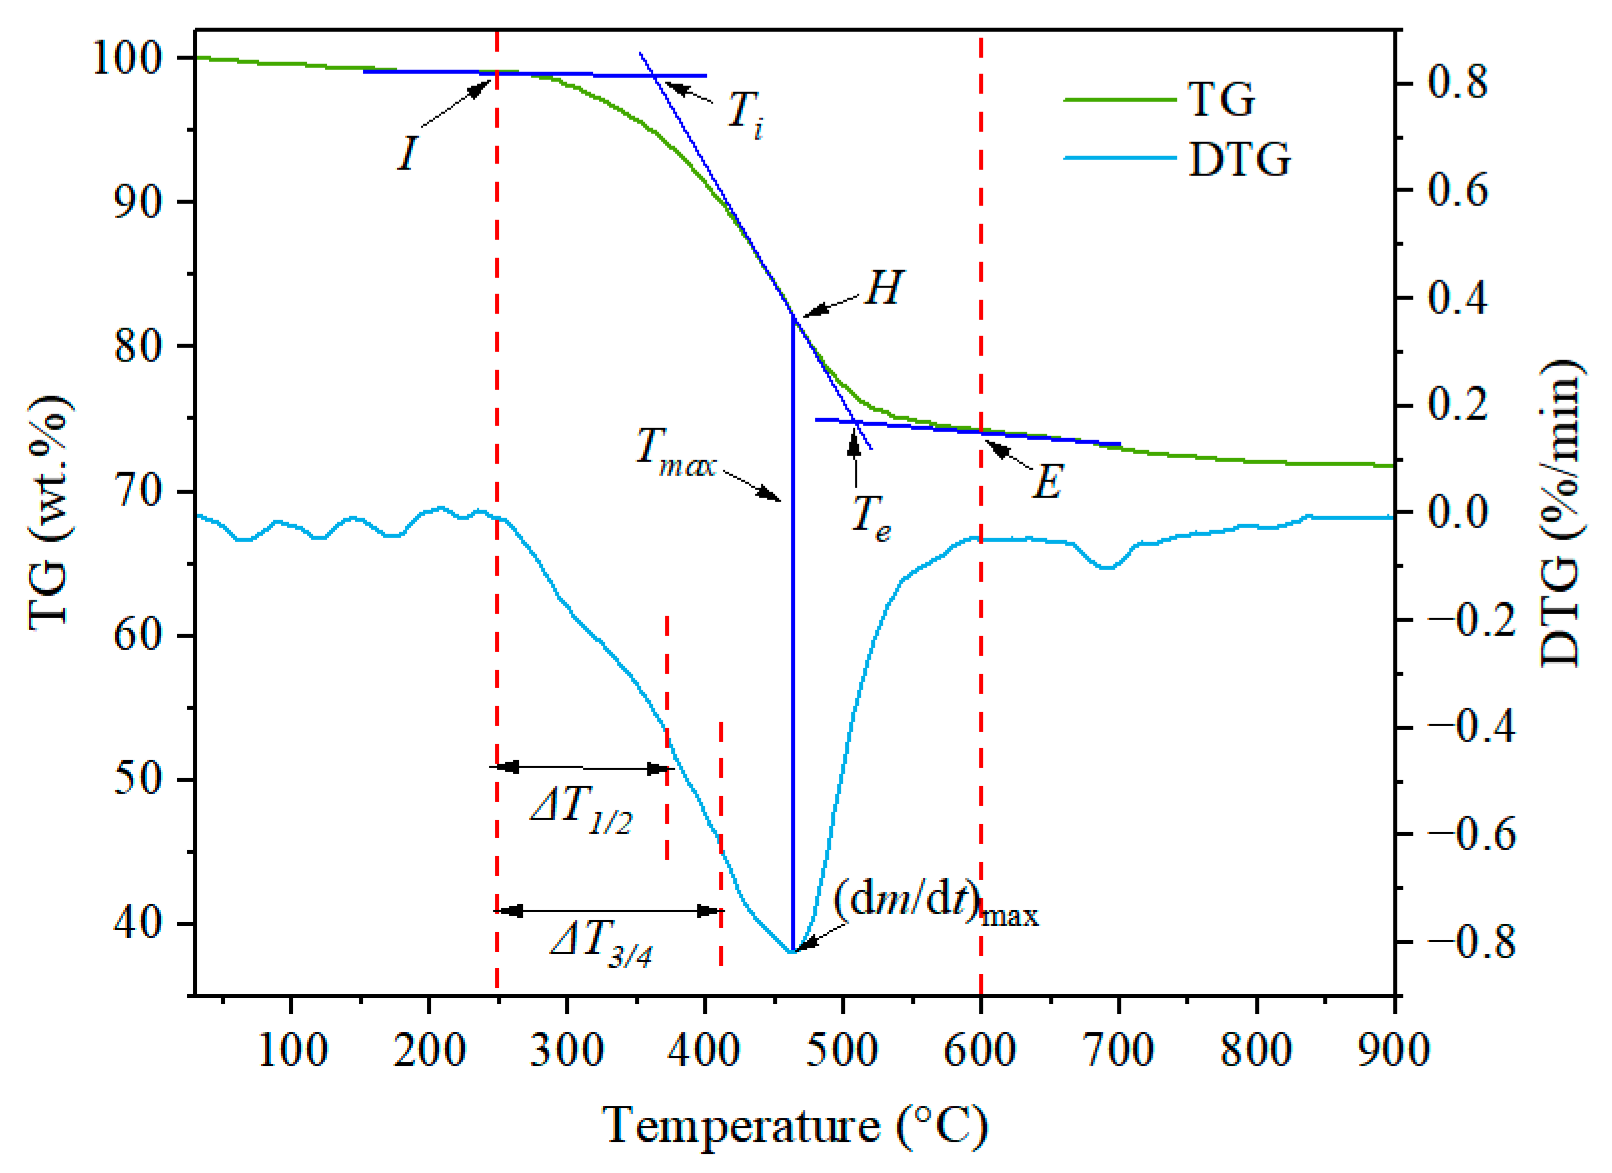
In evaluating the combustion property parameters of Sraw and its various residues, the TG-DTG extrapolation approach from references [30] was applied, employing a series of procedural steps. In Figure 8, an initial action involves drawing a vertical line through the peak weight loss rate point on the DTG curve to intersect with point H on the TG curve. Subsequently, the temperature associated with this intersection, denoted as Ti, serves as the ignition temperature of the sample. This temperature is identified as the tangent line originating from point H, intersecting the baseline extension at the initial absent point I within part ii of the TG curve. The weight loss eventually begins to decrease steadily at point E, which is near the end of part ii within the TG curve. The burnout temperature of the sample, Te, is determined by the meeting point of the tangent line passing through point H and the extension from point E at this junction.

3.3.2. Combustion Property Parameters

Table 3 presents the combustion property parameters of various samples at different temperatures. It is observed that SR300 experiences a significant reduction in Ti and Te compared to Sraw. This reduction is due to the large amount of flammable bitumen generated during heat treatment at 300 °C. However, other combustion property parameters remain relatively unchanged, since the total organic matter of SR300 is essentially equivalent to that of Sraw.
As the pyrolysis temperature increases from SR300 to SR520, Ti, Te, and Tmax gradually increase, while ΔT, (dm/dt)max, and (dm/dt)mean continuously decrease. The increase in temperature leads to the cracking of organic matter into bitumen, which subsequently converts into oil and gas products that escape the system. As a result, the remaining organic matter within the residue decreases, while the proportion of heavy products and residual carbon by-products increases. These changes deteriorate the combustion behavior of the residue and alter the combustion process from homogeneous to non-homogeneous.

3.3.3. Combustion Property Indices Analysis

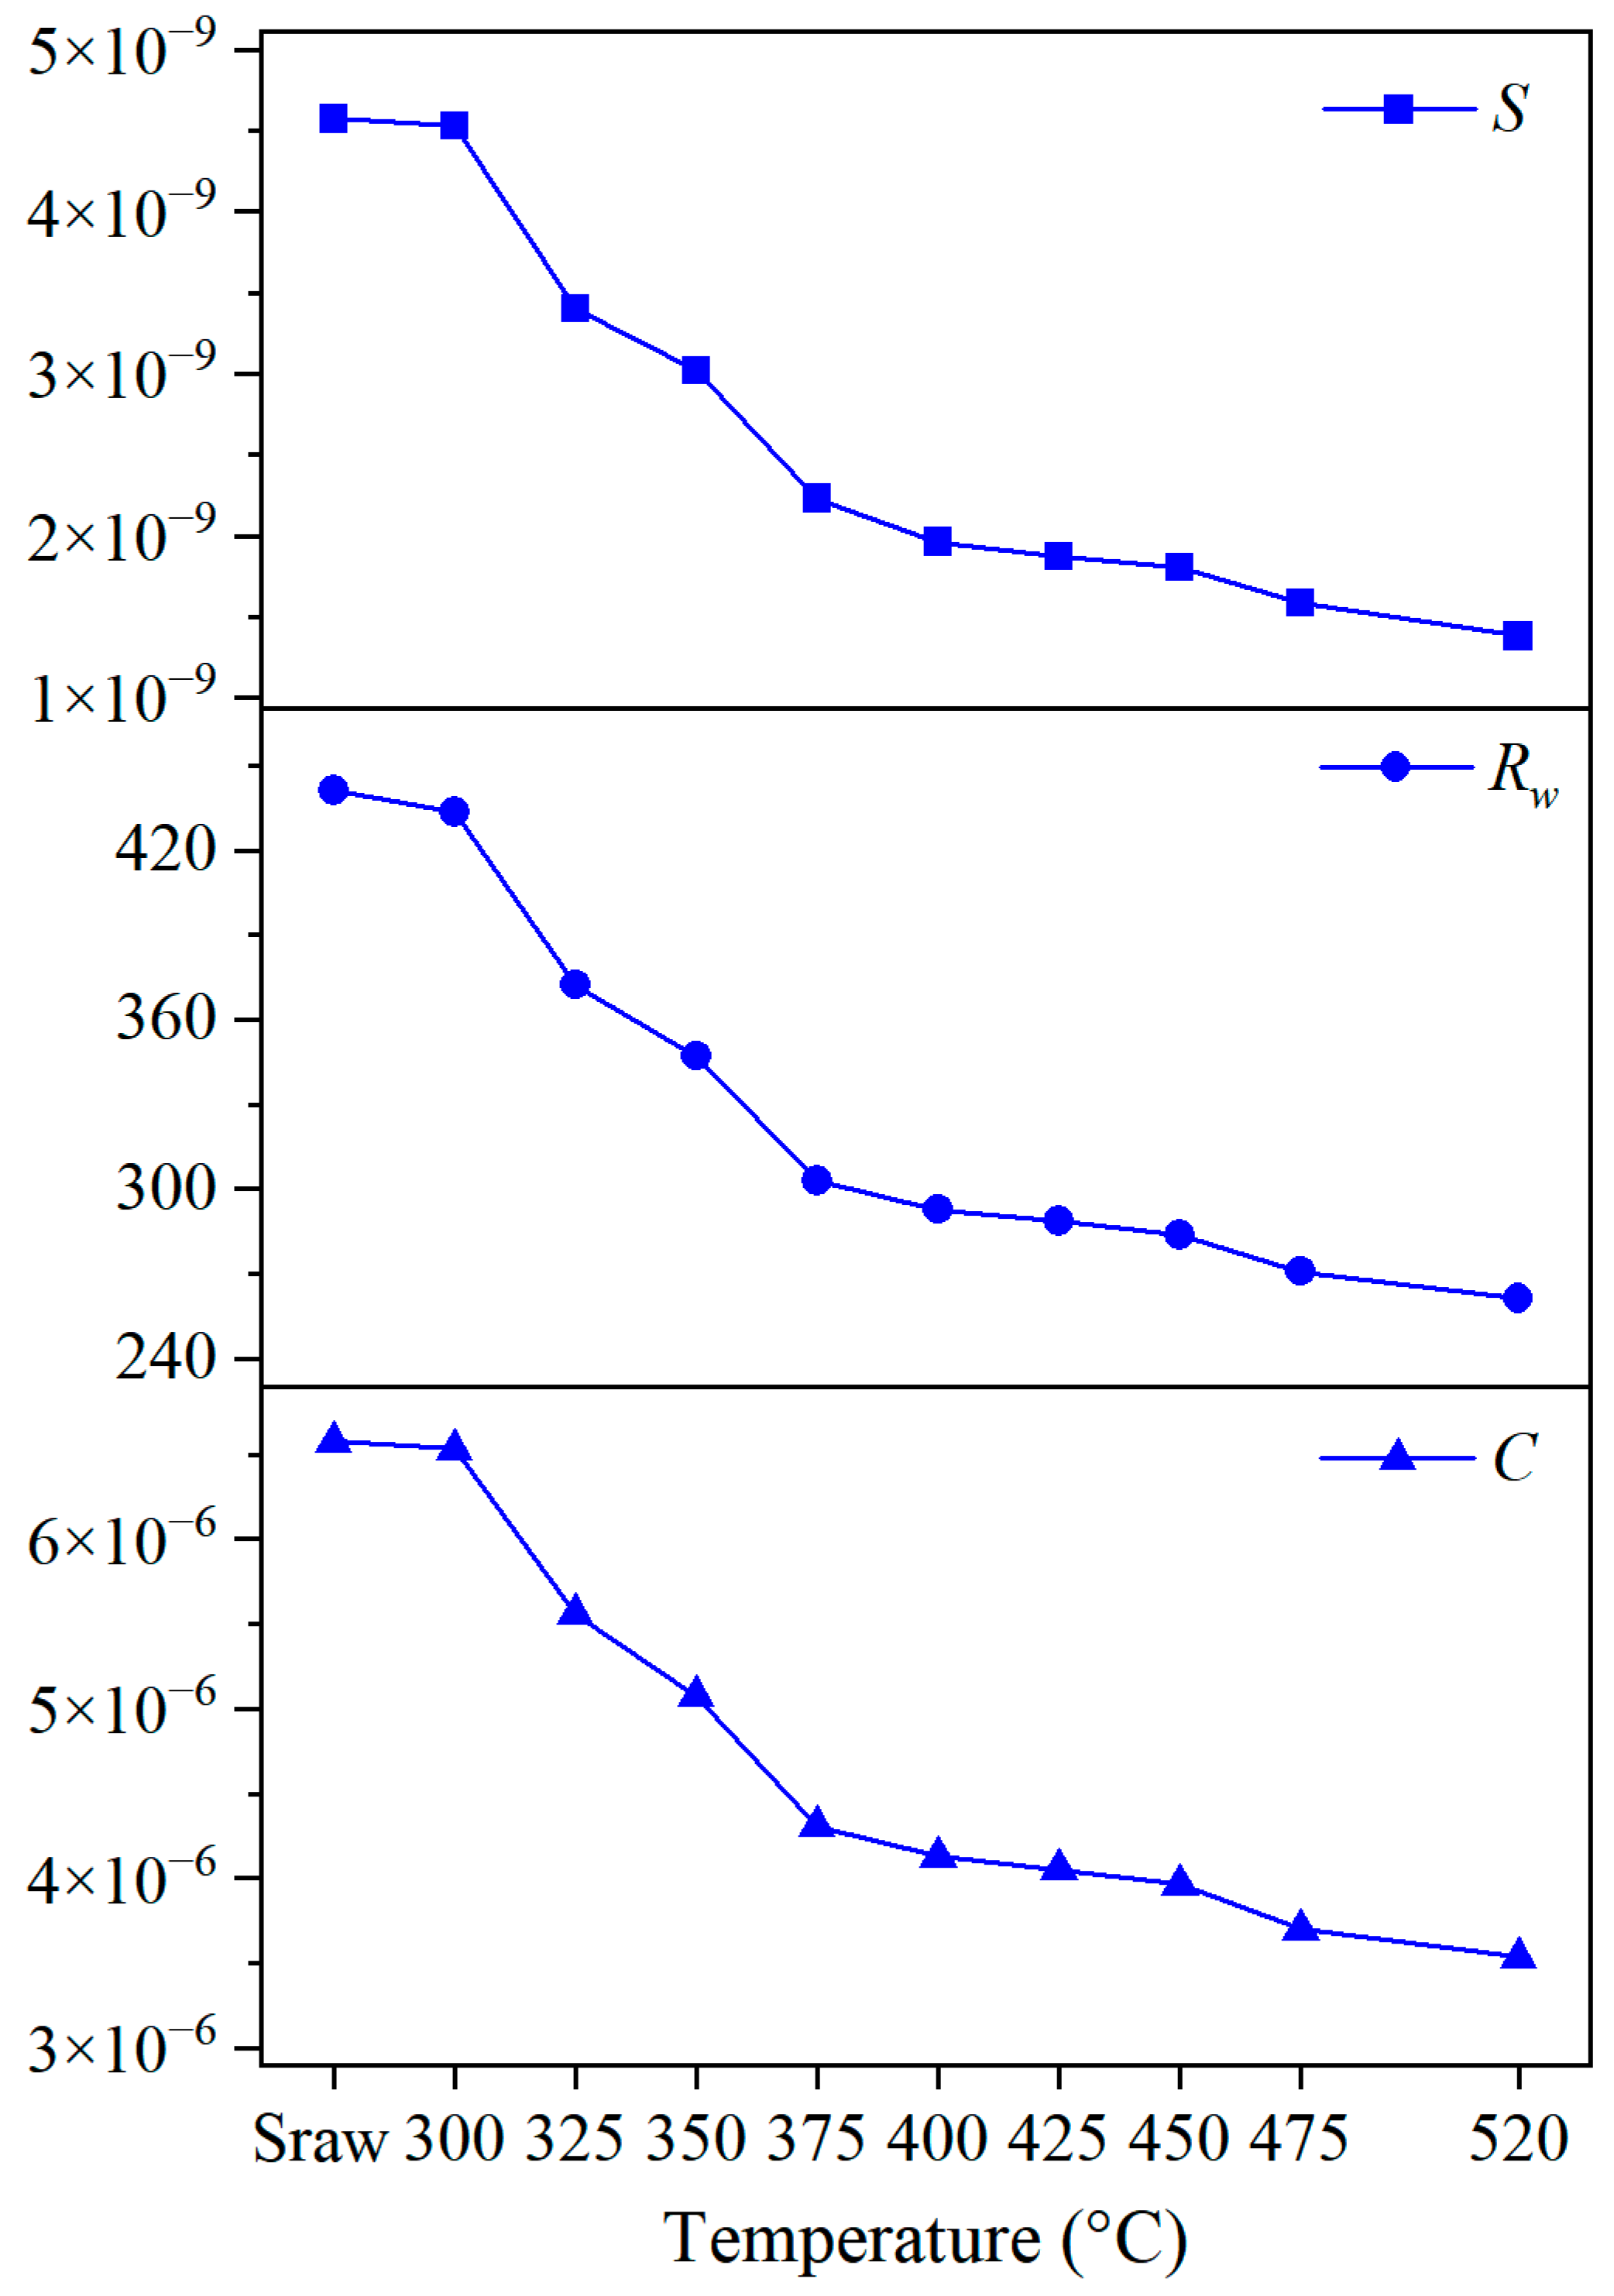
Based on the TG/DTG results, the combustion index C, the combustion stability index Rw, and the comprehensive combustion index S are utilized to deeper evaluate the combustion properties of different samples [30].
The initial phase of combustion is reflected by the combustion index C, which is defined as follows:
C = ( d m / d t ) max T i 2
where Ti, and (dm/dt)max have meanings consistent with Table 3. The higher the C, the better the sample’s combustibility.
Rw stands for the combustion process’s stability, which is defined as:
R w = 655 T i × 763 T max × ( d m / d t ) max 0.00582
where 655 is the ignition point of pure carbon, °C; 763 is the temperature corresponding to the maximum weight loss rate (0.00582) of pure carbon, °C; Ti and Tmax have meanings consistent with Table 3. As Rw rises, the samples’ combustion stability gets better.
The S index can assess the ignition, combustion, and burnout characteristics of the sample, calculated as follows:
S = ( d m / d t ) max ( d m / d t ) m e a n T 2 i T c
d m d t = m 2 m 1 t 2 t 1
where (dm/dt)max, (dm/dt)mean, and Tc have meanings consistent with Table 3. The sample’s reaction performance is preferred when S is higher.
Figure 9 displays the results of these indices at different heat treatment temperatures. It is observed that all three combustion property indices exhibit a similar trend as the heat treatment temperature increases. From Sraw to SR300, a small decrease occurs in all three indices. The generation of a significant amount of bitumen within the residue at 300 °C lowers the ignition point of SR300, but the resulting pore plugging (due to volume expansion and coking) adversely affects the combustion properties. Pore plugging dominates over the generation of bitumen, which causes a minor reduction in combustion properties. Subsequently, with the heating temperature increases, the continuous cracking of organic matter into oil and gas products reduces the residual organic matter content and increases the content of heavy oil and residual carbon. These changes lead to a decrease in the combustion properties of the residue.

3.3.4. Release Characteristics Analysis of Combustion Products

In addition, the release characteristics of combustion products and reaction rates were analyzed using the product release index r. With reaction rates of 50% and 75% in part ii, the index r could be calculated as follows [30]:
r 1 / 2 = ( d m / d t ) max T max T i Δ T 1 / 2
Δ T 1 / 2 d m / d t ( d m / d t ) max = 1 2
r 3 / 4 = ( d m / d t ) max T max T i Δ T 3 / 4
Δ T 3 / 4 d m / d t ( d m / d t ) max = 3 4
where Ti, (dm/dt)max, and Tmax have a similar definition as the one stated previously; ΔT1/2 is the temperature width at (dm/dt)/(dm/dt)max=1/2; ΔT3/4 is the temperature width at (dm/dt)/(dm/dt)max = 3/4. They both show the Sraw or residual combustion product release concentration. The OS or residues’ combustion characteristics improve with increasing r.
The r1/2 and r3/4 indices for Sraw and various residues are shown in Figure 10. The findings indicate that the product release characteristics follow a similar pattern as the combustion property indices. From Sraw to SR300, there is a slight decrease in the product release characteristics, followed by a continuous decrease as the heat treatment temperature increases. These trends correspond to the phenomena described in Section 3.3.3.

3.4. Optimization of Extraction Temperature Parameters

3.4.1. Heat Absorption for OS Pyrolysis

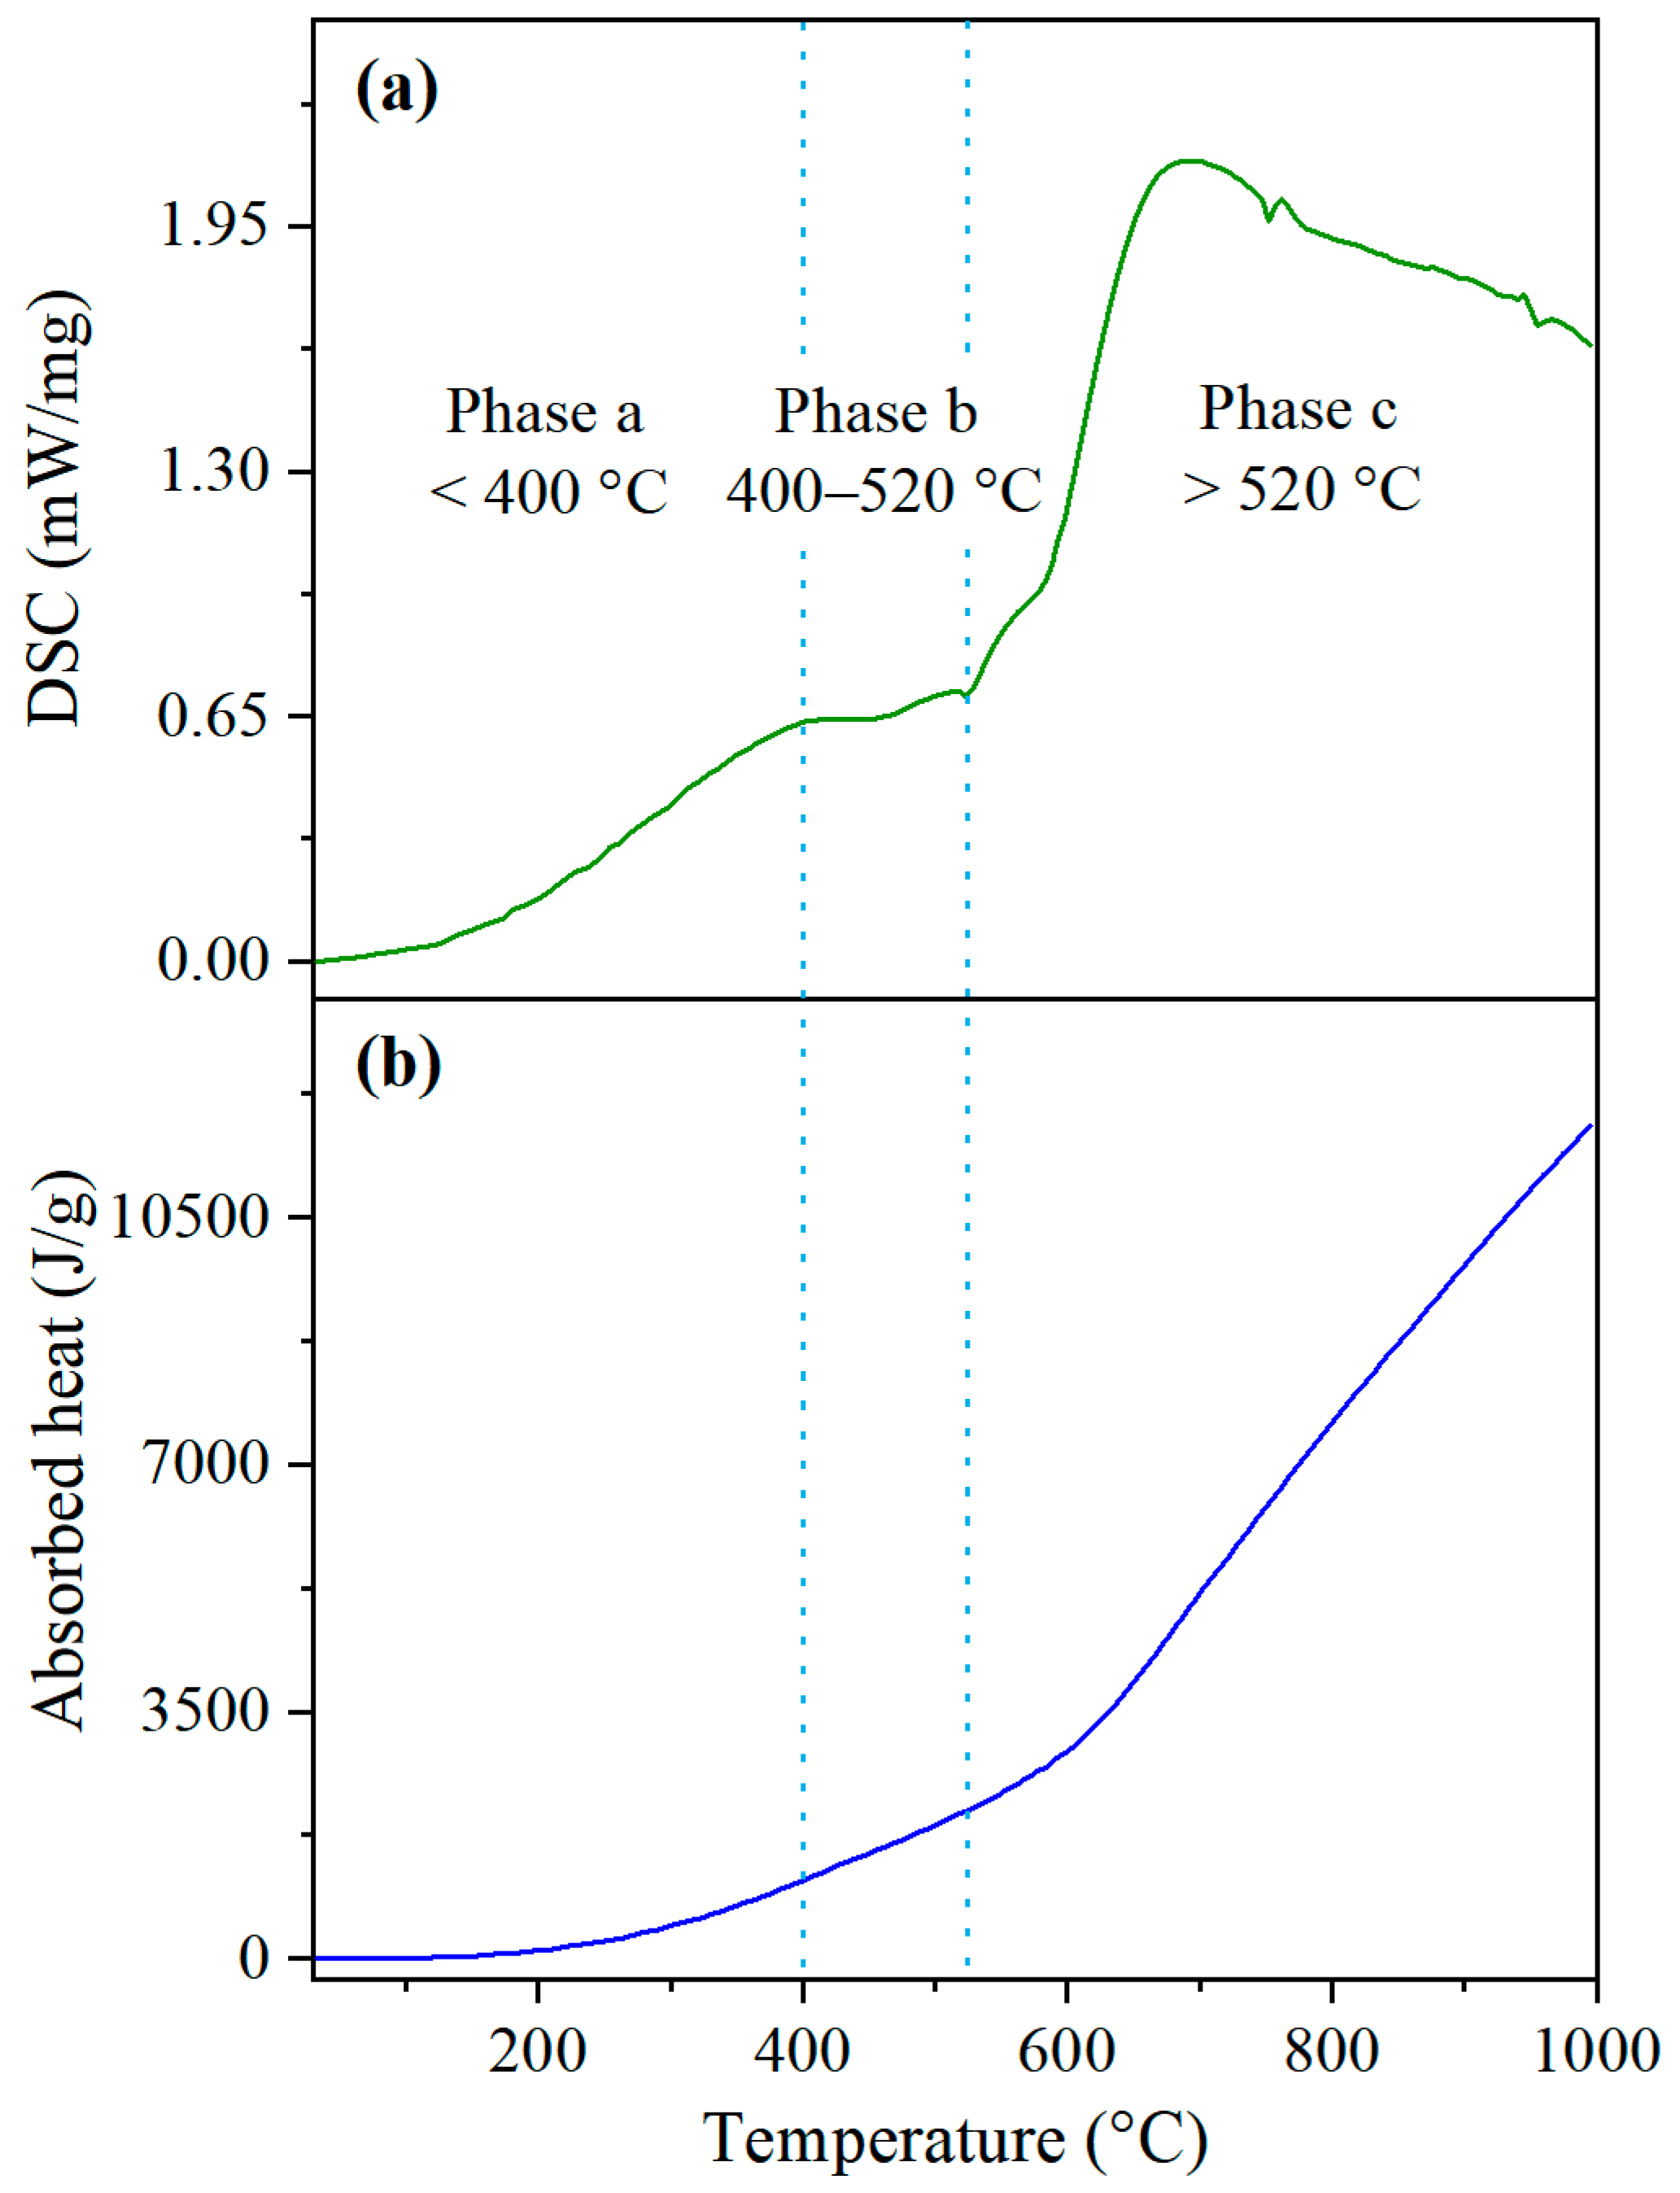
Figure 11a depicts the DSC curve of Sraw under a nitrogen atmosphere. The curve showcases a distinct three-phase variation. In phase a (<400 °C), a linear increase is observed, suggesting that heat is absorbed for the evaporation of interlayer water, the internal energy boost of OS, and the kerogen cracking. Subsequently, phase b (400–520 °C) displays a stabilizing trend, indicating that kerogen pyrolysis is almost at its peak and that a substantial quantity of heat is removed by the produced hydrocarbon products. The DSC curve increases quickly, achieves its maximum value, and then starts to drop, while staying at a higher level in phase c (>520 °C). The decomposition of carbonate and clay minerals absorbs heat, which accounts for this behavior [20,23].
Moreover, integrating the DSC curve allows for the examination of heat absorption variation from 30 °C to different target temperatures, as presented in Figure 11b. It should be noted that the experimental result of 5 °C/min was selected for integration to obtain the variation of heat absorption of Tongchuan OS with temperature. This heating rate is slow enough to allow the temperature of the sample to rise steadily according to a predetermined procedure, which reduces the effect of temperature hysteresis in the sample during rapid heating. In addition, the use of powdered samples in the tests also reduces the effect of heat transfer within the particles. As a result, a more accurate heat absorption curve for Tongchuan OS can be obtained. It is evident that heat absorption increases with temperature, with a slower rate at lower temperatures and a faster rate at higher temperatures. Notably, Tongchuan OS, characterized as low-grade, exhibits a significantly lower heat absorption rate and overall heat absorption compared to the high-grade Huadian OS. Additionally, the initial temperature, ending temperature, and temperature interval of phase b in the DSC curve are notably lower for Tongchuan OS. Table 1 explains this difference as a result of lower organic matter content and discrepancies in mineral fractions, including a higher concentration of pyrite, within the Tongchuan OS.

3.4.2. Combustion Heat of the Residue

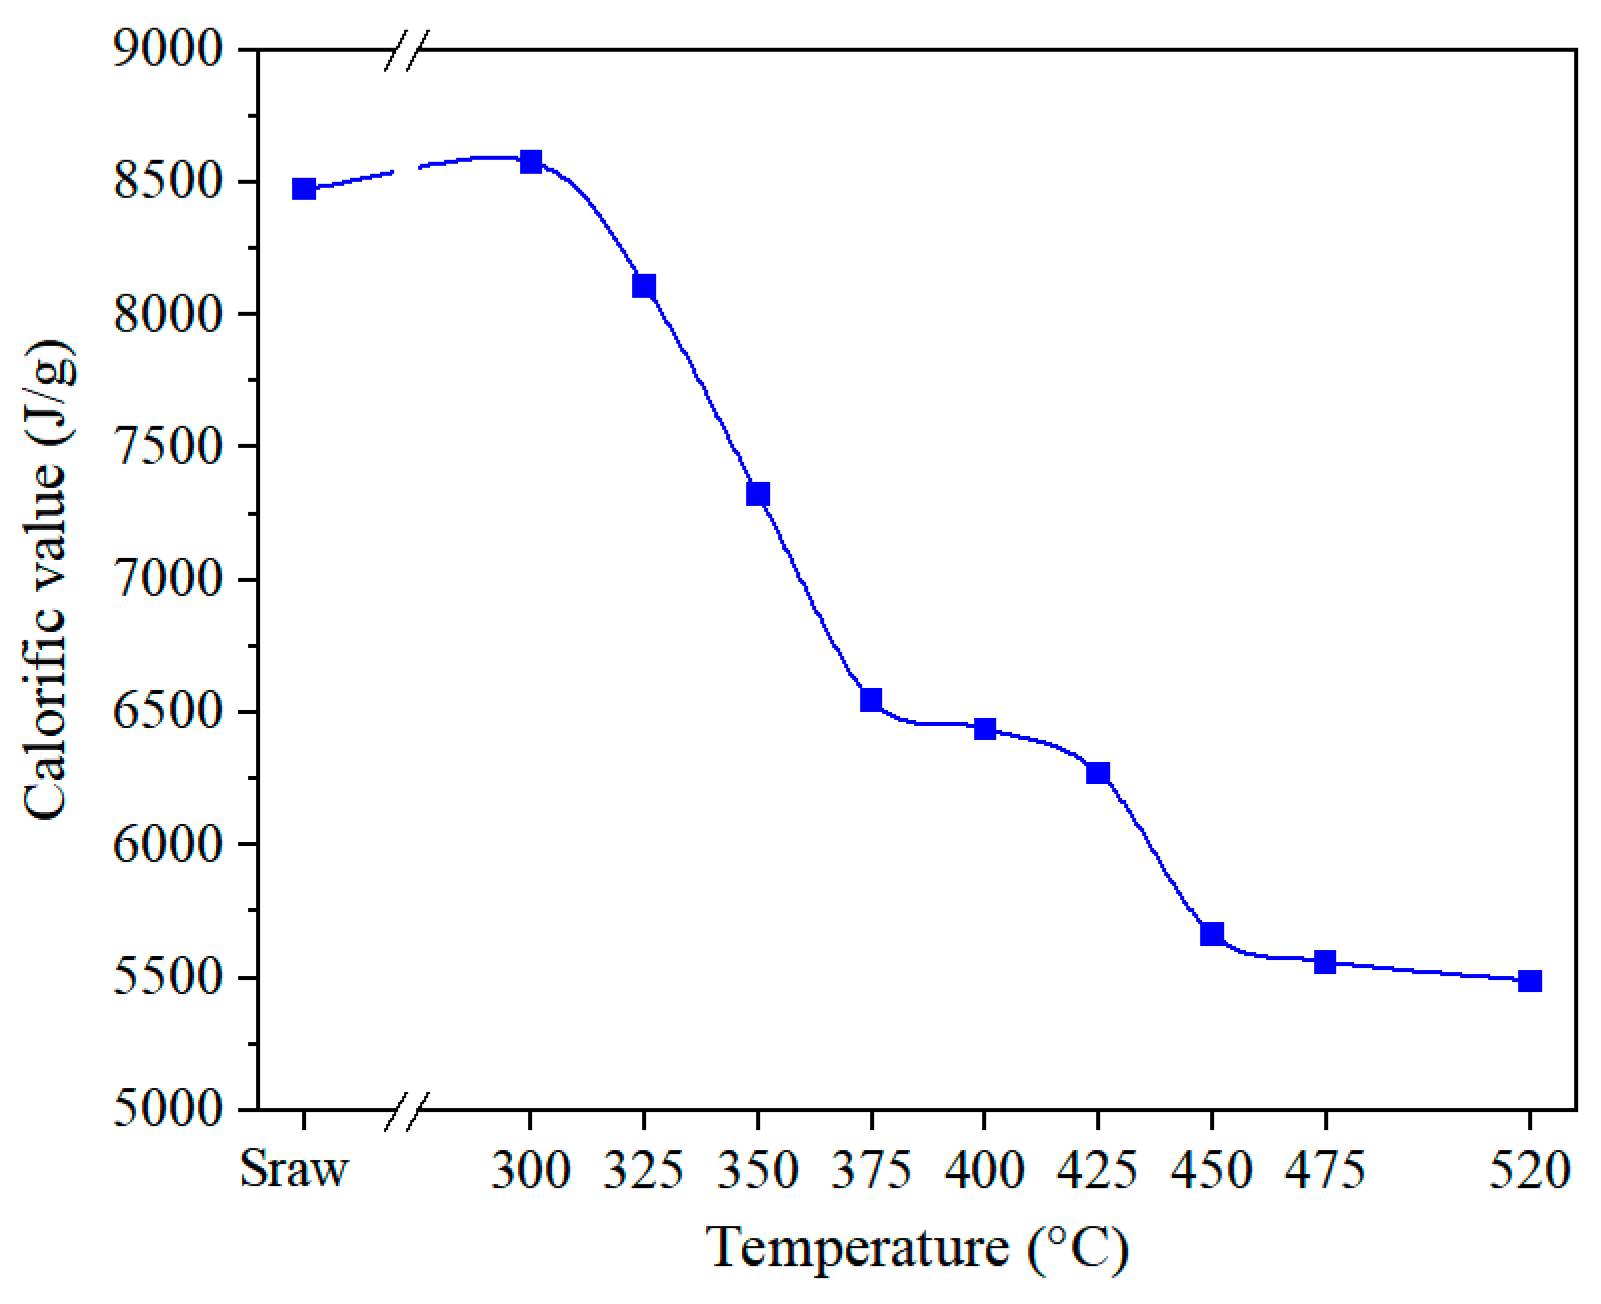
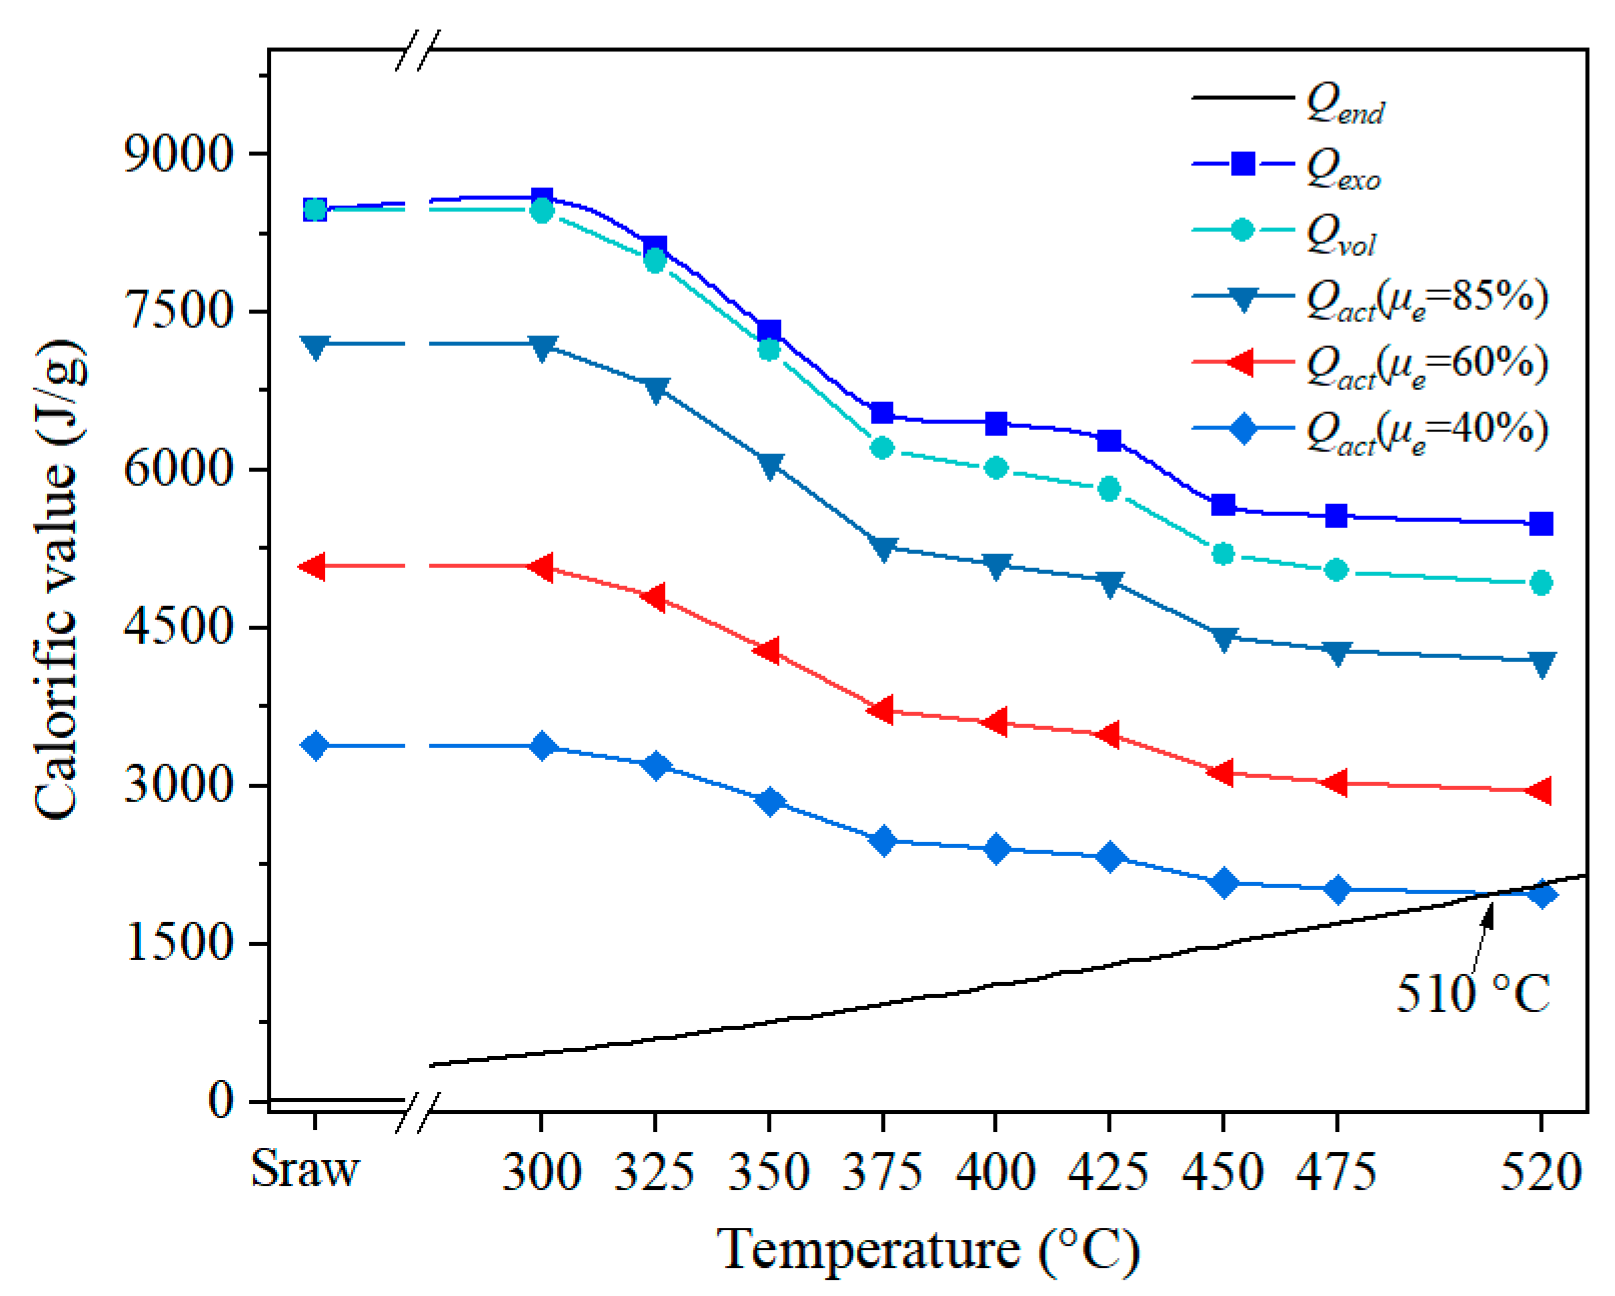
By integrating the DSC curves corresponding to the region before part iii of TG (<600 °C) under air, the calorific values of Sraw and various residues were identified, as illustrated in Figure 12. The findings reveal that the residue’s calorific value increases a little at 300 °C, followed by a rapid decrease from 300 to 450 °C, and eventually stabilizes after 450 °C. This observation suggests that at 300 °C, heat is absorbed by the OS, causing the conversion of internal kerogen into pyrolytic bitumen. However, further hydrocarbon production does not occur. The calorific value of SR300 experiences a slight increase compared to Sraw as the potential heat within the OS rises. Subsequently, the pyrolysis bitumen undergoes further pyrolysis, resulting in the generation and escape of oil and gas. This leads to a significant decrease in the heat content of the residue. After 450 °C, as depicted in Figure 3, the pyrolysis product output stabilizes, leaving behind a substantial amount of residual carbon and by-products such as heavy bitumen within the residue. These components act as the primary sources of heat generation for the pyrolysis residue after 450 °C. The trend observed for low-grade Tongchuan OS aligns with our prior study on high-grade Huadian OS with an oil yield of 14.91%. However, Tongchuan OS exhibits the highest calorific value at a lower temperature range (300 °C) compared to Huadian OS (330 °C) due to lower kerogen content and different properties. Additionally, the calorific value of Huadian OS residue surpasses that of Tongchuan OS until 425 °C, while Tongchuan OS residue exhibits a slightly higher calorific value between 425 and 520 °C. Table 1 indicates that Tongchuan OS contains a higher proportion of fixed carbon (10.79%), whereas Huadian OS exhibits low fixed carbon content (3.32%). From the TG curves under nitrogen and air (Figure 5), it can be seen that the total residual carbon content from the pyrolysis of Tongchuan OS is significantly higher than that of Huadian OS. The weight loss of Tongchuan OS in part ii under air is 11.41% higher compared to nitrogen, while the corresponding increase is 7.72% for Huadian OS. Consequently, this disparity results in a substantially higher calorific value for the residue of Tongchuan OS than that of Huadian after 425 °C.

3.4.3. Analysis of Heat Supply and Demand

During the ATS process, the continuous chain reaction occurs as the residue in the combustion zone continually ignites to supply heat for the OS in the retorting zone. This leads to the continuous pyrolysis of OS, resulting in the production of hydrocarbons and new residues. As depicted in Figure 1, except for the preheating stage, the ensuing initiation and reaction stages require no external energy input. Thus, ensuring the combustion of residues in the combustion zone generates adequate heat to elevate the OS temperature in the retorting zone to the designated level is vital. This sustains a continuous reaction, fostering significant product yields. To elaborate on the energy dynamics within the ATS process, three energy concepts were previously outlined [30]:
Q e n d ( O S ) = { Q e x o ( S C ) , Q v o l ( S C ) = μ y Q e x o ( S C ) , Q a c t ( S C ) = μ e μ y Q e x o ( S C ) ,   T = T m a s T = T v o l T = T a c t
The endothermic quantity (Qend(OS)) delineates the heat necessary to elevate the OS temperature from 30 °C to the specified level (T) per unit mass, quantified in J/g by analyzing the OS DSC curve under nitrogen. On the other hand, the exothermic quantity (Qexo(SC)) signifies the heat liberated from the complete combustion of residue per unit mass post full pyrolysis at T, determined in J/g through scrutinizing the Sraw and various residues’ DSC curves in air. Furthermore, the exothermic quantity (Qvol(SC)) embodies the heat emanating from the complete combustion of an equivalent mass of residue derived from OS pyrolysis at T, measured in J/g. The yield coefficient (μy) characterizes the residue yield at T (refer to Figure 3). Utilizing the combustion heat of the corresponding residue mass to heat the OS in the retorting zone engenders the actual heat (Qact(SC)) in J/g. The energy efficiency coefficient (μe) gauges the efficient utilization level of the combustion heat from residues. The temperatures Tmas, Tvol, and Tact mark the points where Qexo(SC) equals Qend(OS), Qvol(SC) hits Qend(OS), and Qact(SC) intersects with Qend(OS).
In light of Equation (15), upon reaching Tmas, the combustion heat generated by a unit mass of residue produced at Tmas precisely meets the requirement for elevating a unit mass of OS from 30 °C to Tmas. The lack of intersection between the Qexo(SC) curve and Qend(OS) curve prior to 520 °C signifies a Tmas surpassing 520 °C. Post-pyrolysis, the reduced mass and volume of OS yield a diminished heat value per unit volume compared to the initial OS. For instance, following pyrolysis at 520 °C, the residue mass from 1 g of Tongchuan OS amounts to 0.8981 g, as depicted in Figure 3. As such, the yield coefficient (μy) is pivotal in adjusting the Qexo(SC) curve to derive the heat production curve per unit volume of residue throughout the in situ conversion process, termed Qvol(SC). The temperature where Qvol(SC) intersects with Qend(OS) is denoted as the volume equilibrium temperature of heat, Tvol.
In addition, a variety of factors hinder the utilization of combustion heat and reduce the efficiency of heat exchange in practical applications. Heat losses to the upper and lower caprocks within the operational OS layer, lower injected gas temperatures compared to the combustion zone, substantial heat carried by the exhaust gas, and uneven pore and fracture distribution could lead to inadequate combustion in certain zones, resulting in diminished combustion heat output.
Hence, due to these influencing factors, the full calorific value of residues remains unrealized. Therefore, a heat utilization efficiency coefficient (μe) is formulated as the ratio of the available combustion heat from residues for OS pyrolysis in the retorting zone. The heat accessible for OS pyrolysis in the retorting zone, among the heat from complete combustion of a unit volume of residue in the combustion zone, is identified as the product of Qexo(SC), μy, and μe, termed as Qact(SC). When Qact(SC) aligns with Qend(OS), the corresponding temperature designates Tact. In engineering applications, ensuring the highest retorting zone temperature reaches Tact preserves the energy equilibrium for the self-sustaining chain reaction during the ATS process. As demonstrated in Figure 13, when μe ranges from 85% to 60%, the absence of intersection between Qexo(SC) and Qend(OS) before 520 °C positions Tact at 510 °C when μe amounts to 40%.

3.4.4. Optimization for Temperature Parameters

As described above and in our previous studies [30], to determine the optimal temperature parameters, an ideal temperature screening method is formulated, taking into account the reaction characteristics and regulatory requirements at different stages of the ATS process. Given the complexities involved, some foundational assumptions are imperative:
  • Homogeneity in the layer’s regions concerning OS properties such as oil yield and density;
  • OS distribution, as illustrated in Figure 1, uniformly spreads in the horizontal plane;
  • The targeted OS layer has undergone reservoir stimulation pre-exploitation, nullifying the impact of large fractures and subsurface water, ensuring the ATS process normalcy.
With the method below, the results above, and the stated assumptions accounted for, optimal temperature parameters can be ascertained. During the ATS process’s preheating stage, a critical temperature (T0) is selected to transit effectively from preheating to initiation stages, necessitating substantial external energy input into the target layer to raise the OS temperature. In the early initiation stage, residual oil and gas products remaining within the OS layer, when ignited alongside residue post oxygen introduction, release heat exploitable for OS pyrolysis in the retorting zone, resulting in an actual temperature above T0. Essential conditions for T0 include:
  • Exceeding the residue’s ignition temperature after OS pyrolysis at T0;
  • Residue obtained at T0 has a lower activation energy;
  • Residue obtained at T0 has better combustion performance;
  • Residue obtained at T0 has better product release characteristics;
  • T0 does not have to be lower than Tact.
Based on prior analyses, the optimal T0 for Tongchuan OS is established at 425 °C.
The pivotal element in the ATS process’s reaction stage is raising oil and gas yields while sustaining autothermic pyrolysis below ground. Thus, regulating the maximum temperature (T1) in the retorting zone during the reaction stage becomes paramount. Ideally, T1 should meet certain benchmarks:
  • Residue obtained at T1 has a lower activation energy;
  • Residue obtained at T1 has better combustion performance;
  • Residue obtained at T1 has better product release characteristics;
  • T1 should be less or equal to Tact.
Notably, the most preferable T1 value appears aligned with Tact, influenced by μe. Illustrated in Figure 13, with μe values spanning 85% to 60%, the absence of Qexo(SC) and Qend(OS) intersection before 520 °C places Tact at 510 °C for μe of 40%. At 422 °C, oil yield stands at 13.42%, with gas yield at 5.01%, accounting for 89.89% and 68.25% of the total oil and gas yield, respectively. This underscores the ATS process’s capacity to extract oil and gas even with meager combustion heat utilization, reinforcing the viability of employing the ATS process for low-grade OS in in situ extraction efforts.
In summary, the ATS process in low-grade Tongchuan OS can still meet the energy supply and demand requirements during the underground chain reaction process, while ensuring high oil and gas recovery rates. Compared to Huadian OS with an oil yield of 14.09%, Tongchuan OS, with lower kerogen content, produces less oil yield (4.04%) during the pyrolysis process. However, its own low heat absorption during pyrolysis and high fixed carbon content resulted in a higher calorific value of the residue obtained from pyrolysis at high temperatures (>425 °C), which could meet the demand for in situ production. Throughout the world, the OS samples in the Estonian and Green River Basin of the United States have high volatile matter and oil yield, which is better than the Huadian OS in China [46,47], whereas in some areas, such as Mongolia and North Korea, low-grade OS similar to Tongchuan are widely distributed. Similar to the Tongchuan OS, these OSs also have a high fixed carbon content within them, about twice the oil yield [48]. Therefore, ATS technology has a large potential for application in these regions. However, before the actual application, the method in this paper should be used to explore whether it meets the heat demand in the extraction process of ATS technology.
For the implementation of the ATS process in low-grade OS, this study offers initial recommendations and support. In the actual production process, factors such as the complex and variable distribution of the subsurface temperature field, preheating time, layer conditions, and changes in stratum stress and thermal stress during construction also need to be considered to ensure the successful implementation of the project [49,50,51,52,53].

4. Conclusions

To investigate the feasibility of applying the ATS process to low-grade OS and determine the optimal temperature process parameters, extensive analysis was conducted on the pyrolysis and combustion properties of Tongchuan OS and its pyrolysis residues. The key findings can be summarized as follows:
  • The product yield distribution during Tongchuan OS pyrolysis exhibited a three-stage pattern. Temperatures ranging from 350 to 425 °C favored oil production by facilitating kerogen pyrolysis, while temperatures from 450 to 520 °C resulted in a higher rate of gaseous product generation.
  • The pyrolysis residue of Tongchuan OS displayed significantly increased combustion activation energy at 300 °C. This result can be attributed to pore plugging caused by bitumen volume expansion and bitumen coking during ignition. These effects negatively impact the residue’s ignition characteristics, thus elevating its combustion activation energy.
  • The presence of substantial flammable bitumen, generated during heat treatment at 300 °C, led to significantly lowered ignition and burnout temperatures of the pyrolysis residue. As the pyrolysis temperature increased from 300 to 520 °C, the amount of organic matter residue decreased while the proportion of heavy products and residual carbon by-products increased. These changes adversely affected the combustion behavior, leading to a transition from homogeneous to non-homogeneous combustion.
  • Tongchuan OS exhibited a slightly higher calorific value between 425 and 520 °C compared to Huadian OS, owing to its higher fixed carbon content (10.79%).
  • The recommended preheating temperature for Tongchuan OS was found to be 425 °C, based on the ideal temperature screening method described in this study, and the ideal control temperature for the retorting zone was found to be 510 °C when taking a 40% heat utilization rate into account.
These findings contribute valuable insights for the application of the ATS process to low-grade oil shale. They serve as a reference for optimizing extraction efforts and guiding the utilization of ATS technology in the context of low-grade oil shale resources.

Author Contributions

Conceptualization, S.X.; methodology, Z.W.; software, S.W.; validation, S.X., Z.W. and D.R.; formal analysis, H.Z.; investigation, D.R. and H.W.; writing—original draft preparation, D.R.; writing—review and editing, S.X. and Z.W.; supervision, S.X., F.Y., C.L., Z.W. and H.W.; funding acquisition, S.X. All authors have read and agreed to the published version of the manuscript.

Funding

This work was supported by the China Postdoctoral Science Foundation, under grant number 2023M743305, the National Funding Program for Postdoctoral Fellows (GZC20232484), and the National key R&D Program of China (No. 2023YFE0120700).

Data Availability Statement

The original contributions presented in the study are included in the article. Further inquiries can be directed to the corresponding authors.

Conflicts of Interest

The authors declare no conflicts of interest.

References

  1. Zhai, Y.; Zhu, Y.; Cui, S.; Tao, Y.; Kai, X.; Yang, T. Study on the co-pyrolysis of oil shale and corn stalk: Pyrolysis characteristics, kinetic and gaseous product analysis. J. Anal. Appl. Pyrolysis 2022, 163, 105456. [Google Scholar] [CrossRef]
  2. Kang, S.; Zhang, S.; Wang, Z.; Li, S.; Zhao, F.; Yang, J.; Zhou, L.; Deng, Y.; Sun, G.; Yu, H. Highly efficient catalytic pyrolysis of oil shale by CaCl2 in subcritical water. Energy 2023, 274, 127343. [Google Scholar] [CrossRef]
  3. Hrayshat, E. Oil shale-an alternative energy source for Jordan. Energy Sources Part A Recovery Util. Environ. Eff. 2008, 30, 1915–1920. [Google Scholar] [CrossRef]
  4. Zhu, C.; Guo, W.; Sun, Y.; Li, Q.; Deng, S.; Wang, Y.; Cui, G. Reaction mechanism and reservoir simulation study of the high-temperature nitrogen injection in-situ oil shale process: A case study in Songliao Basin, China. Fuel 2022, 316, 123164. [Google Scholar] [CrossRef]
  5. Li, J.; Shan, X.; Song, X.; He, W. Evaluation of the organic matter product of Huadian oil shale during pyrolysis using multiple approaches: Guidance for the in situ conversion of oil shale. J. Anal. Appl. Pyrolysis 2022, 167, 105656. [Google Scholar] [CrossRef]
  6. Xu, S.; Sun, Y.; Lü, X.; Yang, Q.; Li, Q.; Wang, Z.; Guo, M. Effects of composition and pore evolution on thermophysical properties of Huadian oil shale in retorting and oxidizing pyrolysis. Fuel 2021, 305, 121565. [Google Scholar] [CrossRef]
  7. Amer, M.; Alhesan, J.; Marshall, M.; Fei, Y.; Jackson, W.; Chaffee, A. Energy efficient method of supercritical extraction of oil from oil shale. Energy Convers. Manag. 2022, 252, 115108. [Google Scholar] [CrossRef]
  8. Sun, Y.; Kang, S.; Wang, S.; He, L.; Guo, W.; Li, Q.; Deng, S. Subcritical water extraction of Huadian oil shale at 300 °C. Energy Fuels 2019, 33, 2106–2114. [Google Scholar] [CrossRef]
  9. Guo, W.; Zhang, X.; Deng, S.; Sun, Y.; Han, J.; Bai, F.; Kang, S.; He, W. Enhanced pyrolysis of Huadian oil shale at high temperature in the presence of water and air atmosphere. J. Pet. Sci. Eng. 2022, 215, 110623. [Google Scholar] [CrossRef]
  10. Sun, Y.; Xu, S.; Yang, Q.; Lai, C.; Guo, M. Oxidizing pyrolysis of Huadian oil shale and its product distribution. J. China Univ. Pet. (Ed. Nat. Sci.) 2021, 45, 149–156. [Google Scholar]
  11. Dyni, J. Geology and resources of some world oil shale deposits. Oil Shale 2003, 20, 193–252. [Google Scholar] [CrossRef]
  12. Bai, F.; Zhao, J.; Liu, Y. An investigation into the characteristics and kinetics of oil shale oxy-fuel combustion by thermogravimetric analysis. Oil Shale 2019, 36, 1–18. [Google Scholar] [CrossRef]
  13. Jaber, T.; Apostolos, K. A comprehensive review of microwave application on the oil shale: Prospects for shale oil production. Fuel 2021, 305, 121519. [Google Scholar]
  14. He, W.; Sun, Y.; Shan, X. Organic matter evolution in pyrolysis experiments of oil shale under high pressure: Guidance for in situ conversion of oil shale in the Songliao Basin. J. Anal. Appl. Pyrolysis 2021, 155, 105091. [Google Scholar] [CrossRef]
  15. Liu, Z.; Meng, Q.; Dong, Q.; Zhu, J.; Guo, W.; Ye, S.; Liu, R.; Jia, J. Characteristics and resource potential of oil shale in China. Oil Shale 2017, 34, 15–41. [Google Scholar] [CrossRef]
  16. Sun, P.; Li, W.; Liu, Z.; Niu, D.; Wu, X.; Tao, L.; Wang, Z.; Luan, Z. Selection of favourable targets for the in-situ conversion of continental oil shale in China. Oil Shale 2023, 40, 177–193. [Google Scholar] [CrossRef]
  17. Guo, H.; Peng, S.; Lin, J.; Chang, J.; Lei, S.; Fan, T.; Liu, Y. Retorting oil shale by a self-heating route. Energy Fuels 2013, 27, 2445–2451. [Google Scholar] [CrossRef]
  18. Guo, W.; Yang, Q.; Sun, Y.; Xu, S.; Kang, S.; Lai, C.; Guo, M. Characteristics of low temperature co-current oxidizing pyrolysis of Huadian oil shale. J. Anal. Appl. Pyrolysis 2020, 146, 104759. [Google Scholar] [CrossRef]
  19. Guo, W.; Yang, Q.; Zhang, X.; Xu, S.; Deng, S.; Li, Q. Thermal behavior of oil shale pyrolysis under low-temperature co-current oxidizing conditions. ACS Omega 2021, 6, 18074–18083. [Google Scholar] [CrossRef]
  20. Xu, S.; Sun, Y.; Yang, Q.; Wang, H.; Kang, S.; Guo, W.; Shan, X.; He, W. Product migration and regional reaction characteristics in the autothermic pyrolysis in-situ conversion process of low-permeability Huadian oil shale core. Energy 2023, 283, 128525. [Google Scholar] [CrossRef]
  21. Kang, Z.; Zhao, Y.; Yang, D. Review of oil shale in-situ conversion technology. Appl. Energy 2020, 269, 115121. [Google Scholar] [CrossRef]
  22. Vakhin, A.V.; Khelkhal, M.A.; Tajik, A.; Ignashev, N.E.; Krapivnitskaya, T.O.; Peskov, N.Y.; Glyavin, M.Y.; Bulanova, S.A.; Slavkina, O.V.; Schekoldin, K.A. Microwave radiation impact on heavy oil upgrading from carbonate deposits in the presence of nano-sized magnetite. Processes 2021, 9, 2021. [Google Scholar] [CrossRef]
  23. Djimasbe, R.; Ilyasov, I.R.; Kwofie, M.; Khelkhal, M.A.; Emelianov, D.A.; Al-Muntaser, A.A.; Suwaid, M.A.; Varfolomeev, M.A. Direct hydrogen production from extra-heavy crude oil under supercritical water conditions using a catalytic (ni-co/al2o3) upgrading process. Catalysts 2022, 12, 1183. [Google Scholar] [CrossRef]
  24. Yang, Q.; Guo, W.; Xu, S.; Zhu, C. The autothermic pyrolysis in-situ conversion process for oil shale recovery: Effect of gas injection parameters. Energy 2023, 283, 129134. [Google Scholar] [CrossRef]
  25. Guo, W.; Li, Q.; Deng, S.; Wang, Y.; Zhu, C. Mechanism and reservoir simulation study of the autothermic pyrolysis in-situ conversion process for oil shale recovery. Pet. Sci. 2022, 20, 1053–1067. [Google Scholar] [CrossRef]
  26. Yang, Q.; Zhang, X.; Xu, S.; Wang, Z.; Guo, W. Low-temperature co-current oxidizing pyrolysis of oil shale: Study on the physicochemical properties, reactivity and exothermic characters of residue as heat generation donor. J. Pet. Sci. Eng. 2022, 216, 110726. [Google Scholar] [CrossRef]
  27. Xu, S.; Sun, Y.; Guo, W.; Yang, Q.; Li, Q.; Guo, M.; Bai, F.; Zhu, C.; Deng, S. Regulating the oxidative assisted pyrolysis of Huadian oil shale by preheating temperature and oxygen flow rate. Energy 2023, 262, 125602. [Google Scholar] [CrossRef]
  28. Sun, Y.; Guo, W.; Deng, S. The status and development trend of in-situ conversion and drilling exploitation technology for oil shale. Explor. Eng. (Rock Soil Drill. Tunneling) 2021, 48, 57–67. [Google Scholar]
  29. He, W.; Sun, Y.; Guo, W.; Shan, X. Controlling the in-situ conversion process of oil shale via geochemical methods: A case study on the Fuyu oil shale, China. Fuel Process. Technol. 2021, 219, 106876. [Google Scholar] [CrossRef]
  30. Xu, S.; Lü, X.; Sun, Y.; Guo, W.; Li, Q.; Liu, L.; Kang, S.; Deng, S. Optimization of temperature parameters for the autothermic pyrolysis in-situ conversion process of oil shale. Energy 2023, 264, 126309. [Google Scholar] [CrossRef]
  31. Guo, W.; Yang, Q.; Deng, S.; Li, Q.; Sun, Y.; Su, J.; Zhu, C. Experimental study of the autothermic pyrolysis in-situ conversion process (ATS) for oil shale recovery. Energy 2022, 258, 124878. [Google Scholar] [CrossRef]
  32. Bai, F.; Sun, Y.; Liu, Y. Thermogravimetric analysis of Huadian oil shale combustion at different oxygen concentrations. Energy Fuels 2016, 30, 4450–4456. [Google Scholar] [CrossRef]
  33. Bai, F.; Sun, Y.; Liu, Y.; Li, Q.; Guo, M. Thermal and kinetic characteristics of pyrolysis and combustion of three oil shales. Energy Convers. Manag. 2015, 97, 374–381. [Google Scholar] [CrossRef]
  34. Zhao, S.; Pu, W.; Varfolomeev, M.; Yuan, C.; Xu, C. Influence of water on thermo-oxidative behavior and kinetic triplets of shale oil during combustion. Fuel 2022, 318, 123690. [Google Scholar] [CrossRef]
  35. Ifticene, M.; Yuan, C.; Al-Muntaser, A.; Onishchenko, Y.; Emelianov, D.; Varfolomeev, M. Behavior and kinetics of the conversion/combustion of oil shale and its components under air condition. Fuel 2022, 324, 124597. [Google Scholar] [CrossRef]
  36. Bolotov, A.; Yuan, C.; Varfolomeev, M.; Taura, U.; Al-Wahaibi, Y.; Minkhanov, I.; Derevyanko, V.; Al-Bahry, S.; Joshi, S.; Tazeev, A.; et al. In-situ combustion technique for developing fractured low permeable oil shale: Experimental evidence for synthetic oil generation and successful propagation of combustion front. Fuel 2023, 344, 127995. [Google Scholar] [CrossRef]
  37. Yang, Q.; Guo, M.; Guo, W. Effects of associated minerals on the co-current oxidizing pyrolysis of oil shale in a low-temperature stage. ACS Omega 2021, 6, 23988–23997. [Google Scholar] [CrossRef] [PubMed]
  38. Pan, L.; Dai, F.; Huang, J.; Liu, S.; Li, G. Study of the effect of mineral matters on the thermal decomposition of Jimsar oil shale using TG-MS. Thermochim. Acta 2016, 627, 31–38. [Google Scholar] [CrossRef]
  39. GB/T 212-2008; Proximate Analysis of Coal. Standard Press of China: Beijing, China, 2008.
  40. SH/T 0508-1992; Determination of Oil Content of Oil Shale (Low Temperature Retorting Method). Petrochemical Industry Standard of the People’s Republic of China, Fushun Petrochemical Research Institute: Fushun, China, 1992.
  41. Vyazovkin, S.; Burnham, A.K.; Criado, J.M.; Pérez-Maqueda, L.A.; Popescu, C.; Sbirrazzuoli, N. ICTAC Kinetics Committee recommendations for performing kinetic computations on thermal analysis data. Thermochim. Acta 2011, 520, 1–19. [Google Scholar] [CrossRef]
  42. Simon, P. Isoconversional methods. J. Therm. Anal. Calorim. 2004, 76, 123–132. [Google Scholar] [CrossRef]
  43. Flynn, J. The isoconversional method for determination of energy of activation at constant heating rates. J. Therm. Anal. Calorim. 1983, 27, 95–102. [Google Scholar] [CrossRef]
  44. Burnham, A.K.; Dinh, L. A comparison of isoconversional and model-fitting approaches to kinetic parameter estimation and application predictions. J. Therm. Anal. Calorim. 2007, 89, 479–490. [Google Scholar] [CrossRef]
  45. Han, X.; Jiang, X.; Yan, J.; Liu, J. Effects of retorting factors on combustion properties of shale char. 2. pore structure. Energy Fuels 2011, 25, 97–102. [Google Scholar] [CrossRef]
  46. James, L.; Thomas, H.; Mark, S.; Ronald, J. Characterization of macromolecular structure of pyrolysis products from a colorado green river oil shale. Ind. Eng. Chem. Res. 2013, 52, 15522–15532. [Google Scholar]
  47. Olga, P.; Vladimir, K.; Julia, K.; Allan, N.; Andres, S. Co-pyrolysis of estonian oil shale with polymer wastes. ACS Omega 2021, 6, 31658–31666. [Google Scholar]
  48. Han, J.; Sun, Y.; Guo, W.; Deng, S.; Hou, C.; Qu, L.; Li, Q. Non-isothermal thermogravimetric analysis of pyrolysis kinetics of four oil shales using Sestak-Berggren method. J. Therm. Anal. Calorim. 2019, 135, 2287–2296. [Google Scholar] [CrossRef]
  49. Zhan, H.; Qin, F.; Chen, S.; Chen, R.; Meng, Z.; Miao, X.; Zhao, K. Two-step pyrolysis degradation mechanism of oil shale through comprehensive analysis of pyrolysis semi-cokes and pyrolytic gases. Energy 2022, 241, 122871. [Google Scholar] [CrossRef]
  50. Xu, Y.; Lun, Z.; Wang, H.; Zhou, X.; Zhao, C.; Zhang, G.; Zhang, D. Influences of controlled microwave field irradiation on occurrence space and state of shale oil: Implications for shale oil production. J. Pet. Sci. Eng. 2022, 219, 111067. [Google Scholar] [CrossRef]
  51. Yang, D.; Wang, G.; Kang, Z.; Zhao, J.; Lv, Y. Experimental investigation of anisotropic thermal deformation of oil shale under high temperature and triaxial stress based on mineral and micro-fracture characteristics. Nat. Resour. Res. 2020, 29, 3987–4002. [Google Scholar] [CrossRef]
  52. Wang, J.; Liu, Y.; Yang, C.; Jiang, W.; Li, Y.; Xiong, Y.; Peng, P. Evolution of mechanical properties of kerogen with thermal maturity. Mar. Pet. Geol. 2022, 145, 105906. [Google Scholar] [CrossRef]
  53. Wang, Z.; Guo, X.; Zheng, G.; Yu, P.; Wang, W.; Jin, Y.; Chen, G. Effects of parent well spacing on the poroelastic behaviors in the infill zone in shale oil reservoirs: A case study in Jimsar shale oil, China. Energy Sci. Eng. 2022, 10, 1043–1054. [Google Scholar] [CrossRef]
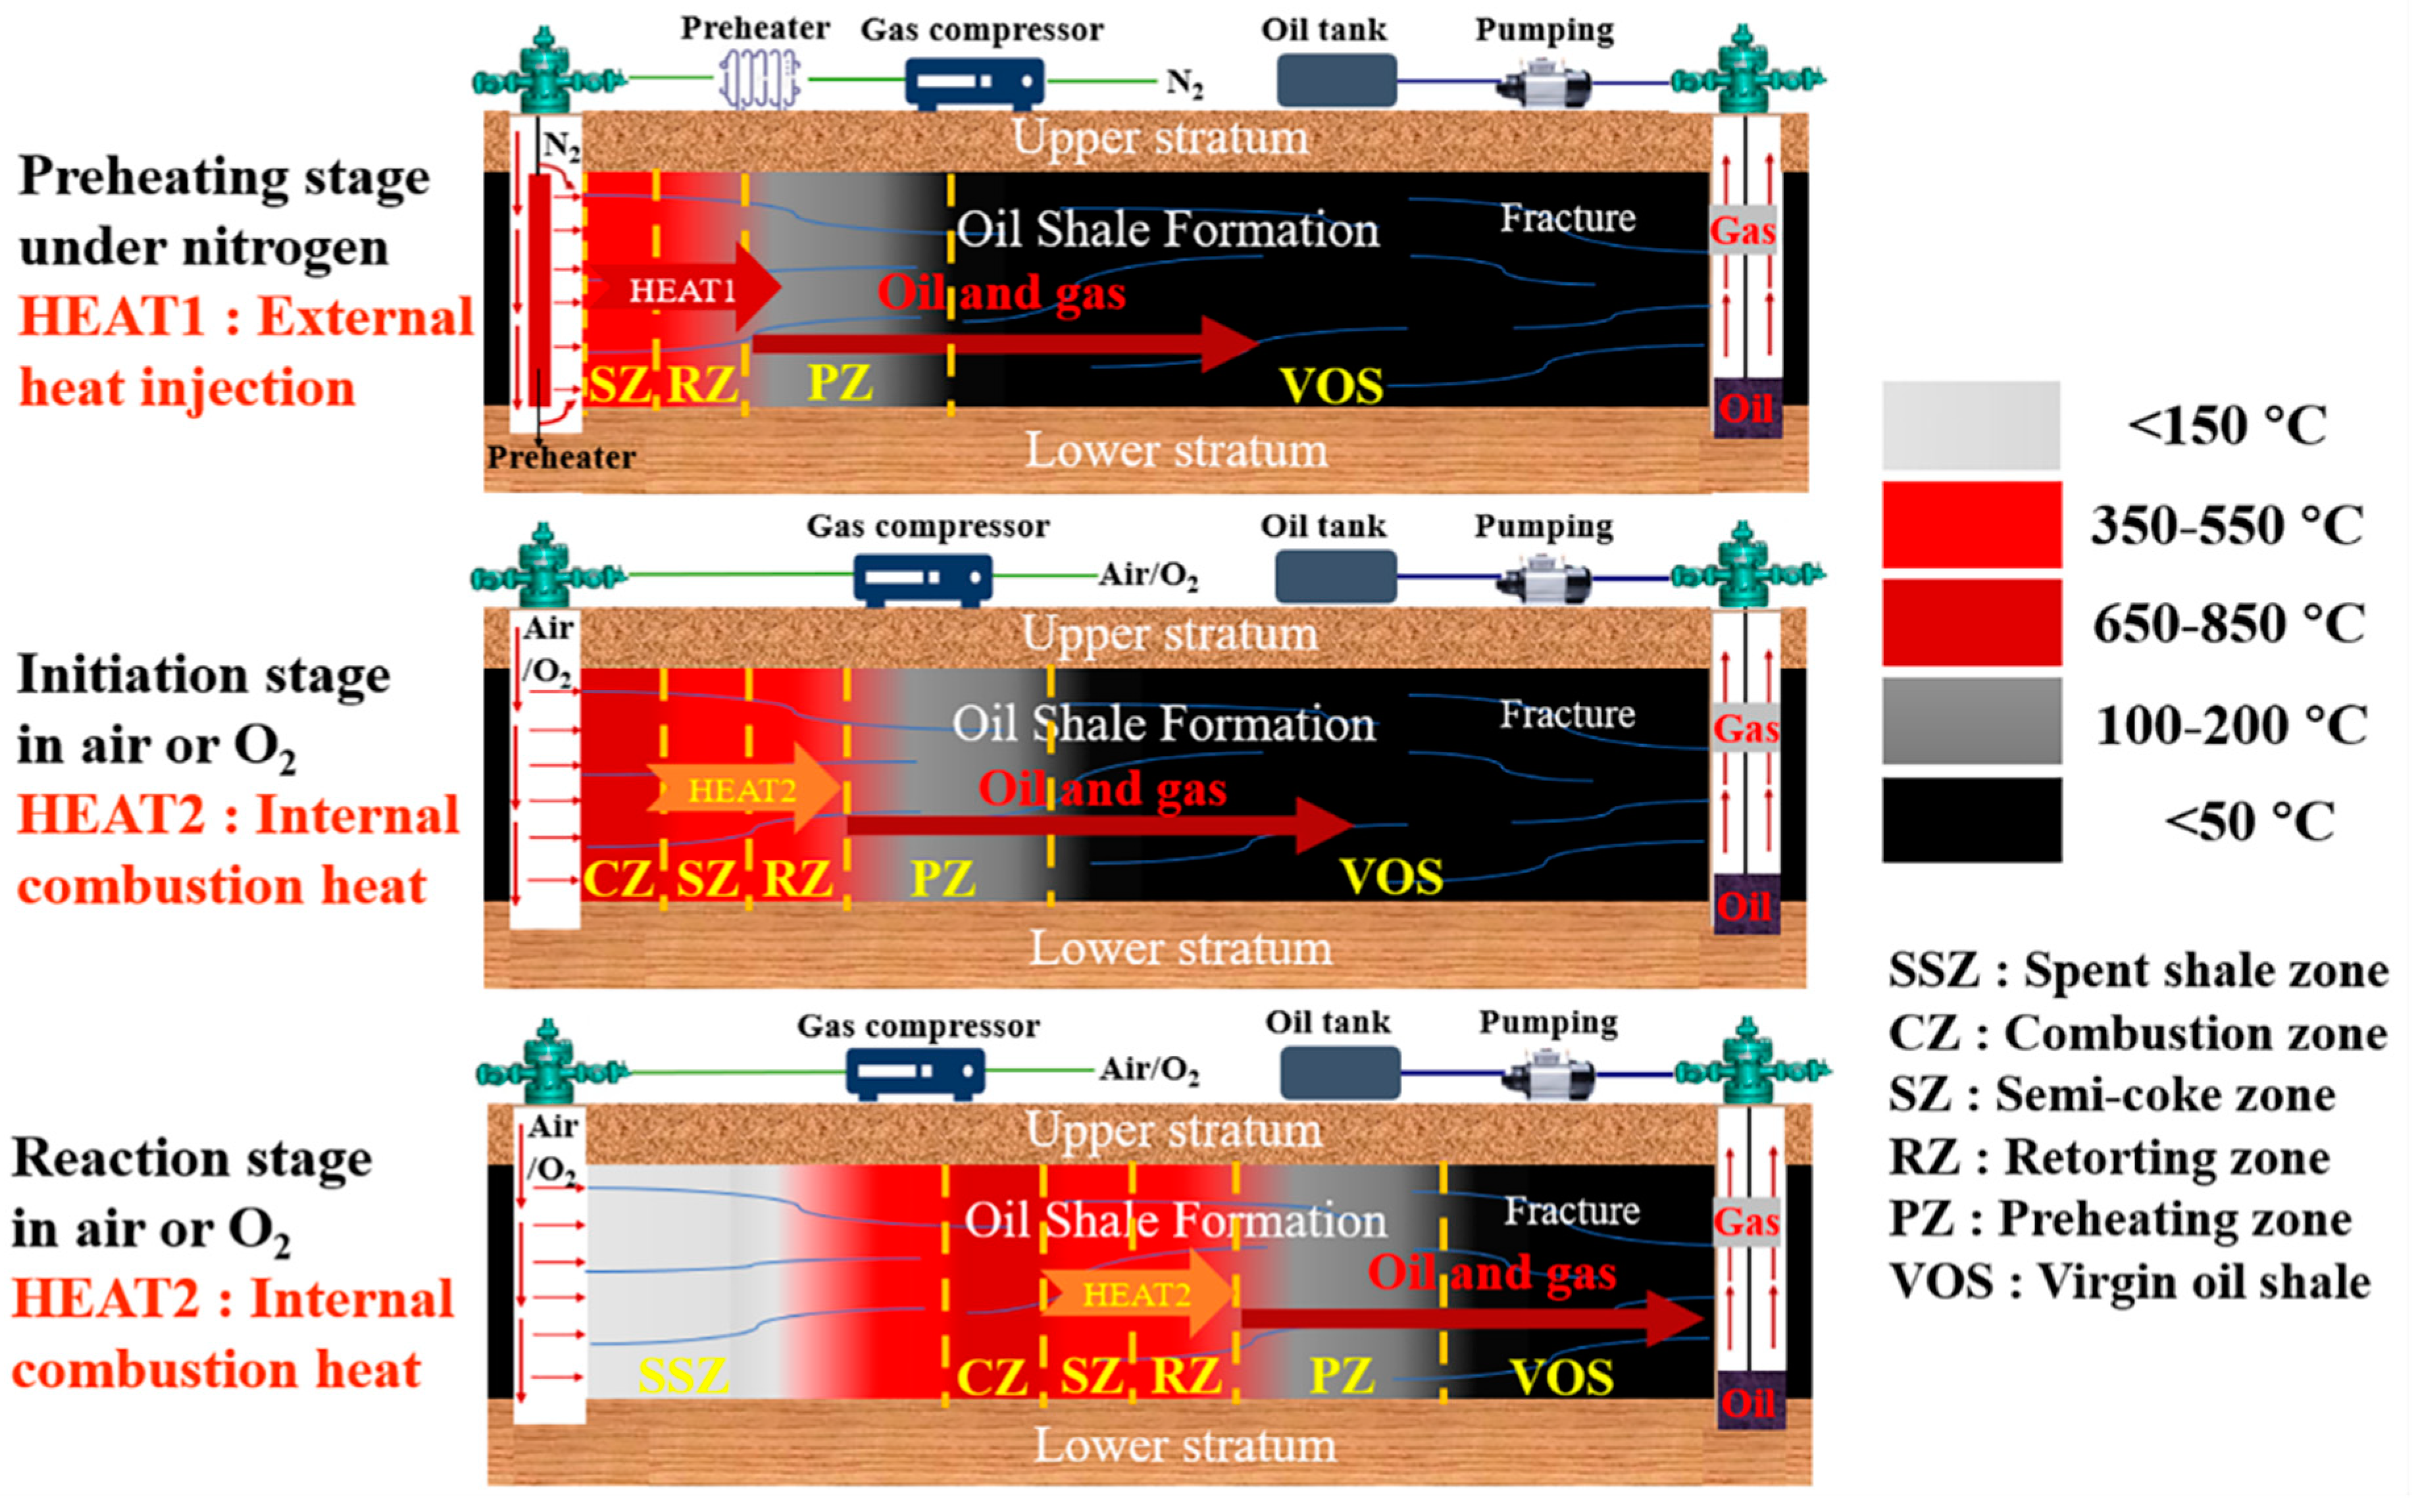
Figure 1. Schematic diagram of the different stages in the construction of the ATS process [28].
Energies 17 03225 g001
Figure 2. Schematic diagram of the device used for the Tongchuan oil shale pyrolysis experiments.
Energies 17 03225 g002
Figure 3. The yields of different pyrolysis products of Tongchuan OS at different temperatures.
Energies 17 03225 g003
Figure 4. (a) TG/DTG curves of Sraw in N2/air and (b) TG curves of pyrolysis residues at different temperatures in air.
Energies 17 03225 g004
Figure 5. The weight losses in part ii of TG curves in N2 and air for Tongchuan OS and residues obtained at different temperatures.
Energies 17 03225 g005
Figure 6. (a) The TG/DTG curves of Tongchuan OS at different heating rates and the calculation procedures via the (b) FWO, (c) Friedman, and (d) KAS methods.
Energies 17 03225 g006
Figure 7. Combustion activation energy variations of samples via the Friedmann, FWO, and KAS methods.
Energies 17 03225 g007
Figure 8. The determination process of the combustion property parameters of Tongchuan OS based on the TG curve at 5 °C/min.
Energies 17 03225 g008
Figure 9. Variation in C, S, and Rw for different samples.
Energies 17 03225 g009
Figure 10. The product release indices r1/2 and r3/4 of Sraw and various residues.
Energies 17 03225 g010
Figure 11. (a) The DSC curve of Sraw in N2 and (b) variation of absorbed heat vs. temperature derived from integration.
Energies 17 03225 g011
Figure 12. Calorific values of Sraw and different residues by integrating the DSC curves up to 600 °C.
Energies 17 03225 g012
Figure 13. Relationship between heat absorption by OS pyrolysis and heat release by residue combustion.
Energies 17 03225 g013
Table 1. The physical properties of Tongchuan OS samples.
Proximate Analysis (wt.%) aSd bUltimate Analysis (wt.%) cSd b
Moisture 0.780.01C16.830.13
Volatile matter16.100.02H1.670.04
Ash72.330.14N1.420.03
Fixed carbon10.790.14O7.970.04
S6.610.17
Fischer Assay Analysis (wt.%) a
Shale oil4.040.06
Water2.220.06
Residue89.810.11
Gases + loss3.930.07
Note: a air-dried; b standard deviation; c dried.
Table 2. Temperature intervals corresponding to the different yield stages of various pyrolysis products of Tongchuan OS.
ProductsStage IStage IIStage III
Yield (wt.%)Temp. (°C)Yield (wt.%)Temp. (°C)Yield (wt.%)Temp. (°C)
Oil0.27–0.34300–3250.34–3.56325–4753.56–4.04475–520
Gas + loss0.91–1.00300–3501.00–3.22375–4503.22–3.93475–520
Water0.12–0.36300–3500.36–1.96375–4251.96–2.22450–520
Residue98.70–98.53300–32598.53–89.81325–52089.81520
Table 3. Sraw and different residues’ combustion property parameters.
SampleTi (°C)Te (°C)ΔT a (°C)Tmax b (°C)(dm/dt)max c (%/min)(dm/dt)mean d (%/min)
Sraw e3615121514620.81690.3560
SR3003484981504510.80570.3509
SR3253795231444860.79850.3199
SR3503955311364960.79180.3161
SR3754075401334970.71340.2796
SR4004115411304980.69780.2567
SR4254145421284990.69440.2506
SR4504175441275000.68940.2477
SR4754275451185010.67480.2339
SR5204365461105070.67250.2130
a ΔT= TeTi; b Tmax is the temperature that corresponds to the greatest weight loss rate, °C; c (dm/dt)max is the greatest weight loss rate, %/min; d (dm/dt)mean is the mean weight loss rate during the second stage, %/min; e dry basis.
Disclaimer/Publisher’s Note: The statements, opinions and data contained in all publications are solely those of the individual author(s) and contributor(s) and not of MDPI and/or the editor(s). MDPI and/or the editor(s) disclaim responsibility for any injury to people or property resulting from any ideas, methods, instructions or products referred to in the content.