Abstract
Changes in weather conditions directly impact the output of wind power, photovoltaic systems, and other forms of uncontrollable power generation. During extreme weather events, the output from wind and photovoltaic sources is typically reduced. In light of this, this paper proposes a two-stage operational strategy for energy storage, under scenarios of extreme-heat-with-low-wind-speed, in power systems. Firstly, historical data on wind and solar power, along with weather characteristics, are collected to analyze the power output during multi-day periods of extreme heat and low wind speed. Then, Monte Carlo simulations are employed to generate multi-day load curves with inherent uncertainties, based on regional load characteristics of the power system. Finally, a two-stage operation strategy for energy storage charging and discharging is established. In the first stage, normal operations are conducted to identify periods of power shortage across various types of loads. In the second stage, based on the identified moments of power shortage from the first stage, charging and discharging constraints are applied to the energy storage systems. The feasibility and effectiveness of this two-stage operational strategy are then validated through simulations, using historical data to generate scenarios of multi-day extreme-heat-and-low-wind-speed conditions.
1. Introduction
As power systems undergo fundamental structural changes to their generation portfolios, the proportion of installed renewable energy sources like wind and solar is gradually increasing. There are concerted efforts underway to improve the utilization rates of these clean but intermittent generation technologies that have reached high levels of technological maturity [1,2,3]. Specifically for China, it is projected that by 2025, non-fossil energy sources will account for about 20% of total energy consumption and approximately 39% of electricity production [4,5].
However, the inherent variability and uncertainty associated with renewable generator outputs like photovoltaic and wind power present significant operational risks and challenges to grid operators [6]. Since weather conditions directly influence the power output from these uncontrollable renewable sources, with lower production levels during extreme weather events, proactive measures must be taken from a total system perspective to maintain the requisite supply–demand balance [7,8]. During such scenarios, actions like rational load shedding, optimal coordination of conventional generator schedules, and effective utilization of energy storage capabilities become paramount for ensuring reliable and economical grid operations.
The inherent intermittency and stochastic behavior of renewable generation sources give rise to significant fluctuations and imbalances between the available supply and consumer demand, necessitating active management strategies [9,10]. A failure to proactively address these supply–demand imbalances can precipitate severe consequences for power system operation, including deviations from the nominal grid frequency, overloading of transmission lines beyond their rated capacities, violations of mandated voltage limits, and, in the most extreme scenarios, the potential for widespread blackouts across the entire system [11,12]. Consequently, enhancing operational flexibility emerges as a paramount imperative, crucially enabling power systems to effectively compensate for the variability and uncertainty introduced by the increasing integration of renewable energy resources.
Previous research efforts have explored various methodologies to address load shedding and optimal dispatch problems. Reference [13] proposes a state enumeration method based on Lagrange multipliers, which directly obtains the optimal load shedding strategy for contingency states through a function derived from Lagrange multipliers. Both the referenced literature and this paper recognize the issue of load shedding. The referenced literature primarily addresses load shedding through state estimation in emergency situations, whereas this paper focuses on scheduling energy storage devices to reduce critical load shedding under extreme weather scenarios. Alternatively, Reference [14] introduces a data-driven multi-agent framework leveraging deep reinforcement learning algorithms to overcome computational challenges and scalability issues associated with accurate system models. Both the referenced literature and this paper recognize the issue of power system security. The referenced literature primarily addresses voltage issues caused by line outages during extreme weather, whereas this paper focuses on energy storage strategies in response to abnormal wind and solar power output scenarios under extreme weather conditions with a high penetration of renewable energy. In the realm of stochastic optimization, Reference [15] presents a data-driven agent model based on sparse polynomial chaotic expansions for a stochastic economic dispatch problem, accounting for uncertainties in wind power generation. Both the referenced literature and this paper recognize the issue of uncertainty in power systems. However, this paper primarily employs uncertainty scenario generation and reduction to achieve the expansion of typical scenarios. Reference [16] proposes a novel opportunity-constrained economic dispatch model that synergistically optimizes the generation of conventional units and the curtailment strategy for renewable energy sources, aiming to minimize total operating costs while limiting operational risk. Both the referenced literature and this paper recognize the issues related to renewable energy generation. The referenced literature focuses on curtailment of renewable energy under safety considerations, whereas this paper primarily address the issue of low renewable energy output under extreme weather scenarios. Despite these contributions, there is still a research gap in coordinating energy storage systems with load management strategies. The main work of the relevant literature focuses on solving the first-stage problem addressed in this paper [17]. Addressing this gap is crucial for achieving a seamless integration of storage resources and effective load prioritization, particularly in the context of power systems with high penetrations of renewable energy sources that are susceptible to variability and intermittency during extreme weather conditions.
Based on the related problems, this paper proposes the study of a two-phase operation strategy of energy storage in extreme-heat-with-low-wind-speed scenarios of a power system. Firstly, wind history curves and weather characteristics are collected to analyze the multi-day wind output characteristics of extreme heat and low wind speed. Then, the load characteristics based on the power system area are obtained, and a Monte Carlo simulation is used to generate the multi-day load curve with uncertainty. Finally, the load management strategy and the two-stage operation strategy of energy storage charging and discharging are established in this scenario. The feasibility and effectiveness of the model are verified through data simulation. Our contributions are as follows:
- (1)
- We have demonstrated the wind and solar output curves under extreme high temperature and low wind speed scenarios, addressing the uncertainty and scenario adaptability of typical load curves using Monte Carlo simulation and the K-means clustering algorithm;
- (2)
- Unlike current research that focuses on reducing overall load shedding in a single stage, we have established an energy storage model to reduce the shedding of critical loads;
- (3)
- We have developed a two-stage energy storage operation strategy under extreme high temperature and low wind speed scenarios, and quantitatively analyzed the impact of the two-stage energy storage model, showing that although total load shedding increased, the shedding of more critical loads decreased.
The remainder of this paper is organized as follows. Section 2 introduces wind power generation, photovoltaic power generation schemes, and load scenarios. Section 3 presents a two-stage energy storage operation strategy under extreme high temperature and low wind speed conditions. Section 4 validates the proposed method with relevant case studies. Finally, Section 5 provides the conclusion.
2. Wind Power, PV Scenarios, and Load Scenarios
Some studies and related phenomena show that there is a significant correlation between weather conditions and the power output of wind and photovoltaic generators [18,19]. Extreme weather events often exhibit unique weather patterns and characteristics, directly manifesting as abnormal renewable energy production curves in power systems [20,21,22]. By analyzing historical weather and corresponding wind farm data, the required extreme scenarios for research can be systematically identified and extracted. This paper focuses on the impact of extreme heat scenarios accompanied by low wind speeds on renewable energy output [23,24,25].
For the specific case of concurrent extreme-heat-and-low-wind-speed events, a multi-criteria screening approach can be employed. First, a maximum temperature threshold is set (e.g., 35 °C) to flag periods of extreme ambient heat, as defined by existing practices [26]. This temperature filter is combined with a second criterion that captures periods where average daily wind power output falls below a specified level, such as 20% of rated capacity. Applying these compound filters to historical meteorological and wind power production data allows representative extreme-heat-with-low-wind-speed scenarios to be isolated and studied further.
When analyzing net load curves during extreme events, it is crucial to account for the heterogeneity that exists across different customer classes and load types. Loads are typically stratified into distinct classes (e.g., Class I, II, III) based on factors like the load reduction methods that can be employed and the associated costs of curtailment [27].
where denotes all the loads in the region at time t, and , , denote one, two, and three classes of loads at time t, respectively.
Class I loads generally represent critical services and infrastructure for which any involuntary disconnection must be avoided due to public safety or economic consequences. Class III loads, on the other hand, are more amenable to load shedding as a last resort for balancing supply and demand. Class II loads fall somewhere in between in terms of their curtailment priority. Given these distinctions, an effective load characterization framework is to first disaggregate and classify the system’s aggregate load profile into the typical Class I, II, and III categories. This segregated representation allows for more judicious operational decisions during scarcity events by exploring load shedding alternatives primarily across the less-critical Class III and II loads before ever having to contemplate curtailments of the highest-priority Class I services.
Similarly, there are variations in typical scenario loads, and Monte Carlo methods are used to simulate scenarios with large uncertainties in generating loads.
where represents the load power prediction at the time t, and represents the load power prediction error at the time t. This paper takes = 10% to obey the standard normal distribution N(0, 1).
The K-means algorithm is utilized to cut down the required number of scenes which need to be analyzed for the Euclidean distance of each Monte Carlo generation scenario, which in turn is clustered by setting the number of k. The scene Euclidean distance calculation is as follows:
where and are the i-th generated scenario and j-th generated scenario, and is the Euclidean distance between the two scenarios.
In this form, the scenarios of wind power output under extreme heat with low wind speed in the region were screened, and the load scenarios were simulated and generated.
3. A Two-Stage Operation Strategy for Energy Storage in Extreme-Heat-with-Low-Wind-Speed Scenarios
3.1. First Stage: Power Balancing of Energy Storage by Minimum Load Reduction
Power balance constraints for the power system are necessary, which take into account wind turbines, photovoltaics, DC feed-in and thermal power units:
where , , , , denote the total power supply power, wind turbine power, photovoltaic power, DC feed-in power, and thermal power units output at time t, respectively.
In this case, thermal power has upper and lower bound constraints with upward and downward creeping constraints:
where , , , are the minimum value of thermal power output, maximum value of output, upward creepage limit, and downward creepage limit.
Load reduction is inevitable in the event of severe weather extremes. Therefore, the charging and discharging of the total power supply plus energy storage needs to be balanced against the load after load reduction:
where is the charging and discharging power of energy storage, and is the load reduction power.
Energy storage also needs to be modeled, and since it cannot be charged and discharged simultaneously, it is constrained using binary variables.
where denotes the charging and discharging power of the energy storage, denotes the charging state SOC of the energy storage, and , are the charging and discharging state coefficients, which are 0/1 variable.
The overall objective function of the model is to minimize load reduction:
where LR is the total power of the load reduction.
3.2. Second Stage: Power Balancing with Orderly Operation Strategies for Energy Storage
Given that energy storage systems are operated with the objective of minimizing curtailed load, there exists a potential risk of overlooking the relative importance of different load types in pursuit of this singular goal. To address this concern, this section outlines an enhanced energy storage operation strategy that prioritizes supplying power to critical Class I and Class II loads during extreme weather events characterized by extreme-heat-and-low-wind-speed conditions.
This improved strategy necessitates a two-stage analytical process. The first stage involves a predictive assessment to identify the specific times at which curtailment of Class I and Class II loads may occur under the constrained scenario. Crucially, the overarching objective function and other model constraints remain unchanged from the original formulation. However, to enact the prioritization of critical loads, additional storage constraints are incorporated into the model:
where t denotes the time when power shortage occurs due to extreme heat and low wind speed, denotes the determined time period when it occurs, denotes the capacity demand of energy storage at time t, and denotes the total power supply power at time t.
This constraint facilitates the minimization of load reduction for high-priority, critical loads by proactively curtailing lower-importance loads when the energy storage system’s predictive analysis foresees an impending scenario where shedding of essential loads would otherwise be necessary. Specifically, it ensures that the energy storage reserves are preserved and not prematurely discharged in situations where load reduction is anticipated to impact the vital Class I and Class II loads. By judiciously rationing the stored energy reserves, this strategy realizes the overarching goal of minimizing the curtailment experienced by the most essential consumer segments during supply shortfalls.
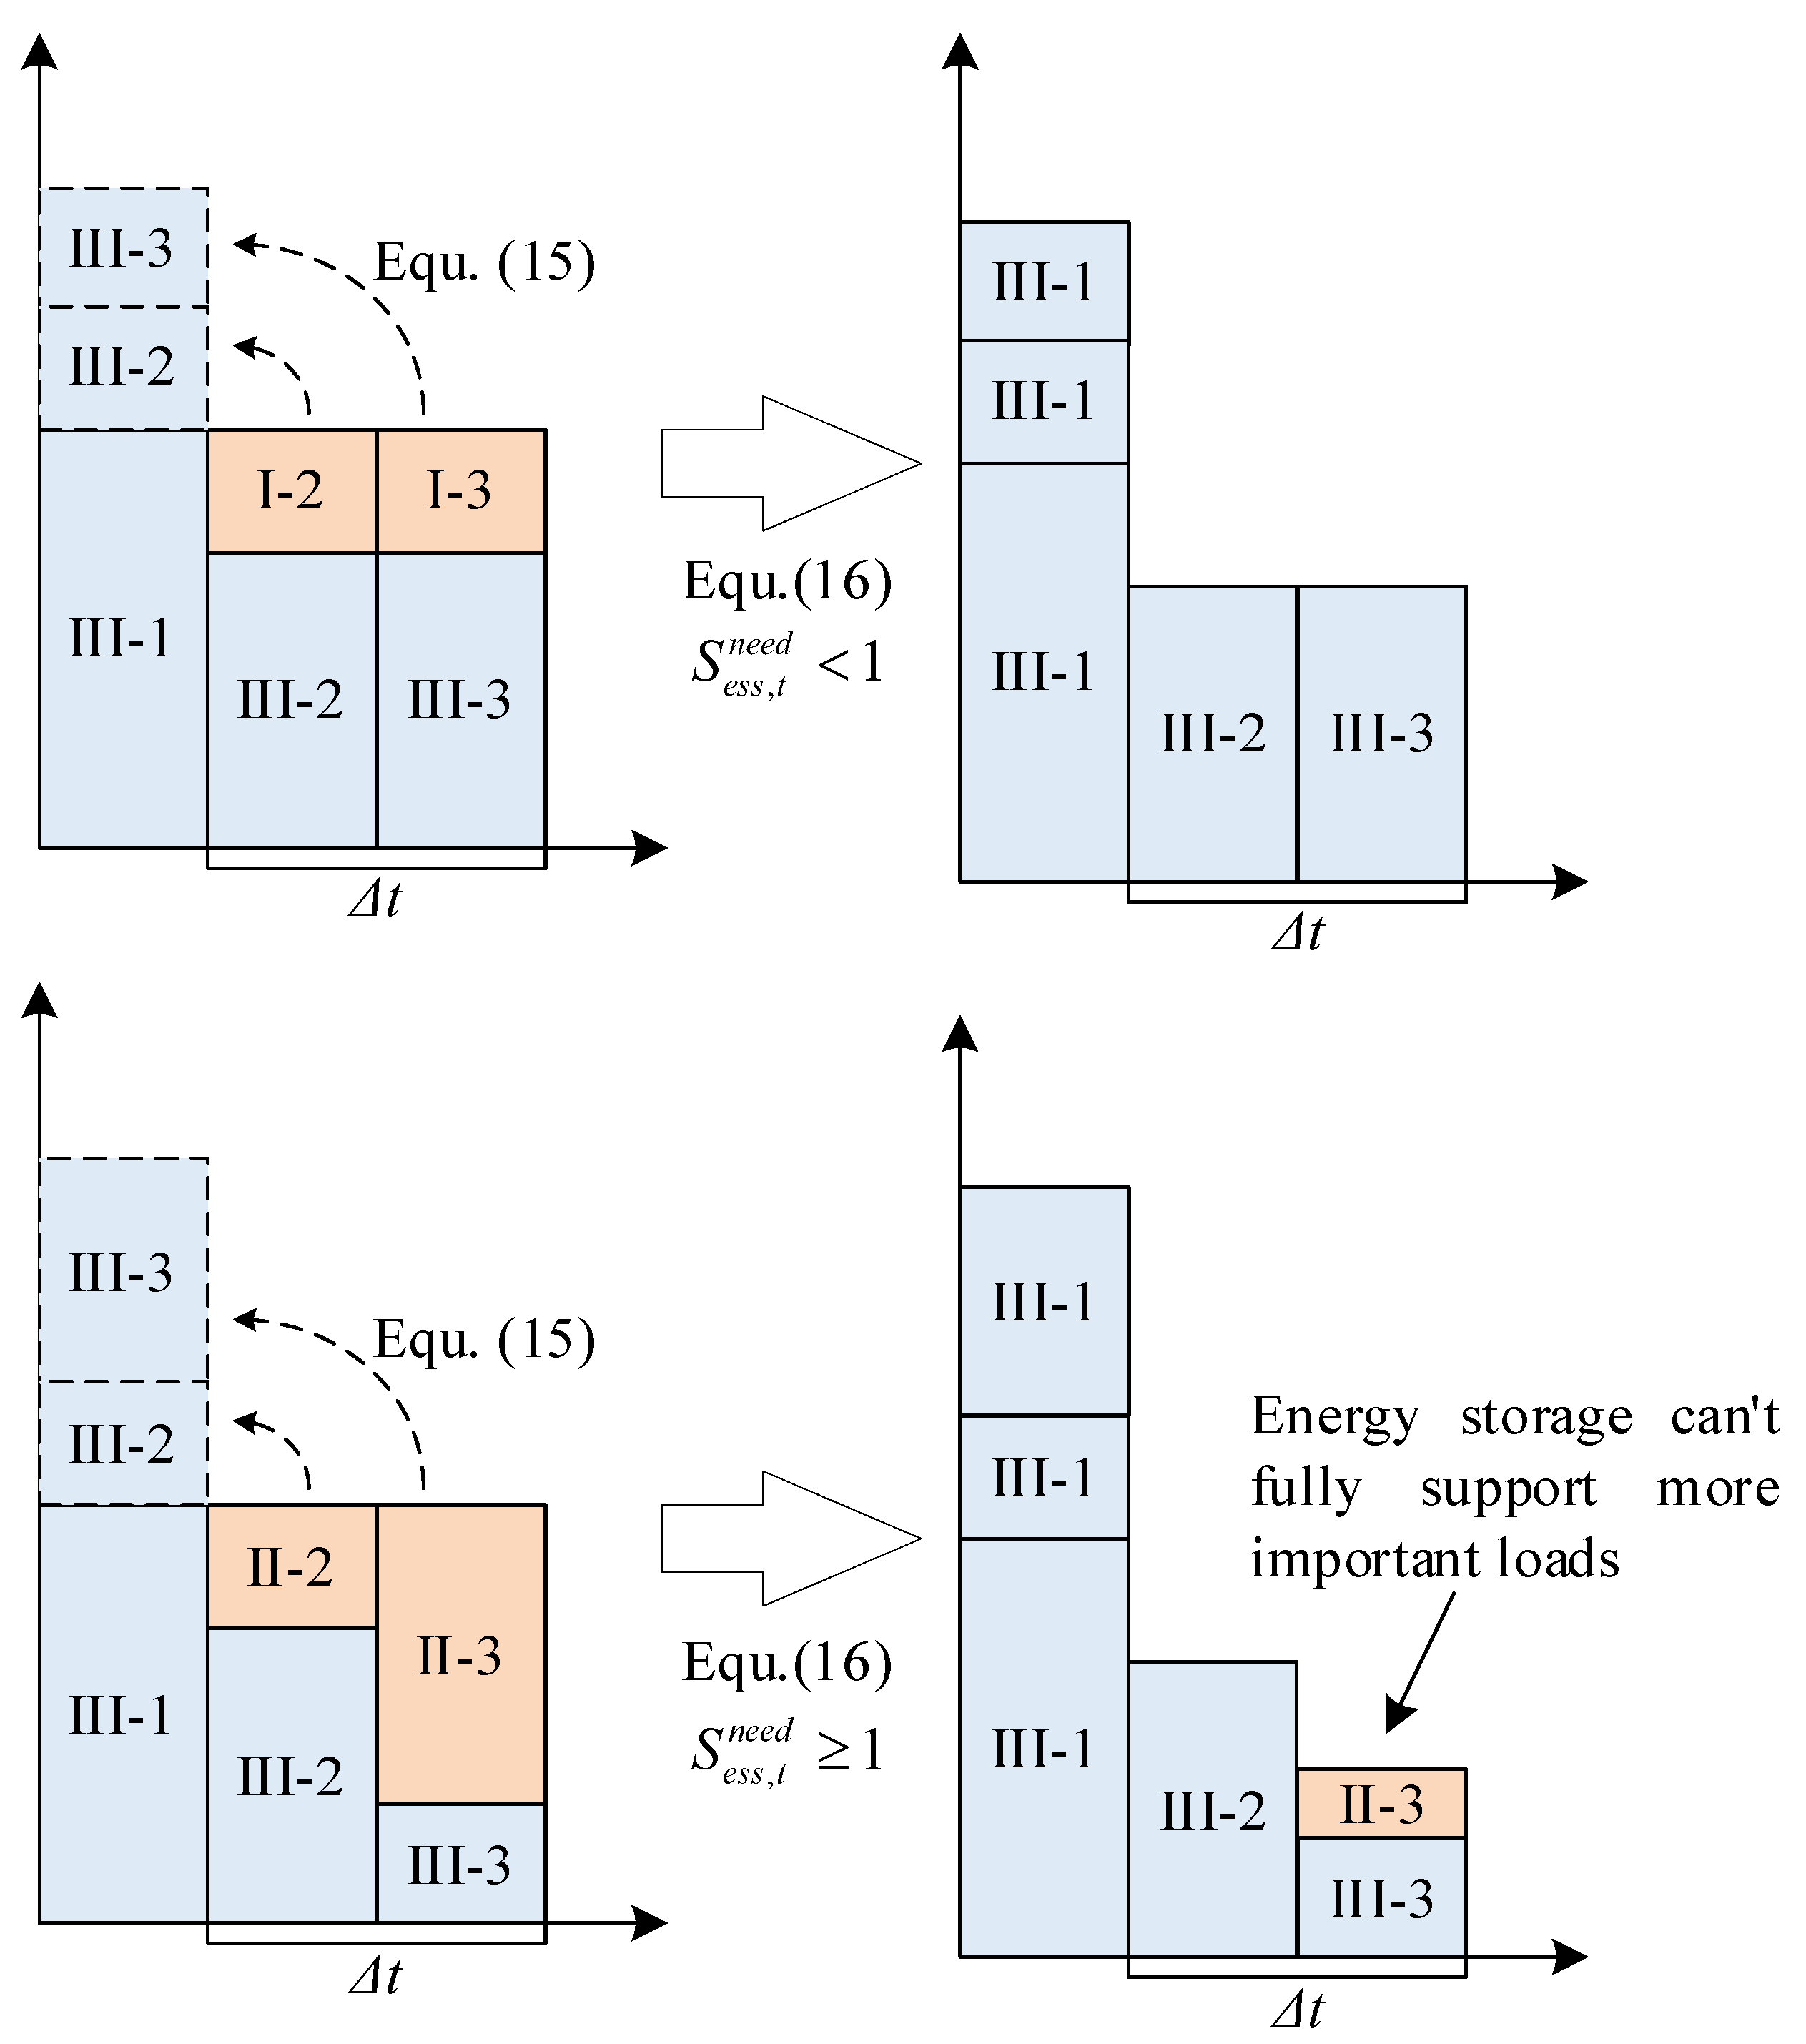
We created a load shedding diagram for different cases of Equation (16), as shown in Figure 1. Each block represents the amount of load shedding, with III-1 indicating the load shedding for three types of loads in period 1, and so on. The method of maintaining energy storage is used to transfer more critical load shedding. Equation (15) calculates the energy storage required to be maintained, and Equation (16) adjusts the energy storage. If the “” condition of Equation (16) is met, it is implemented directly. If the “” condition of Equation (16) is met, it indicates a situation where more critical load shedding must occur, requiring the energy storage to be fully charged.
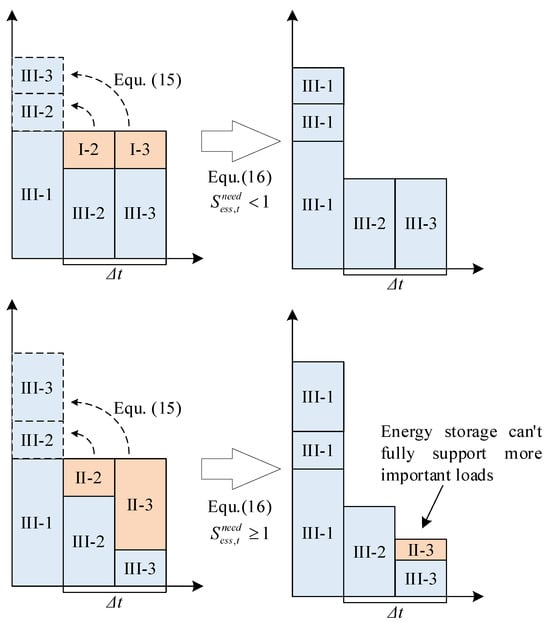
Figure 1.
Schematic diagram of two-stage load shedding with storage regulation.
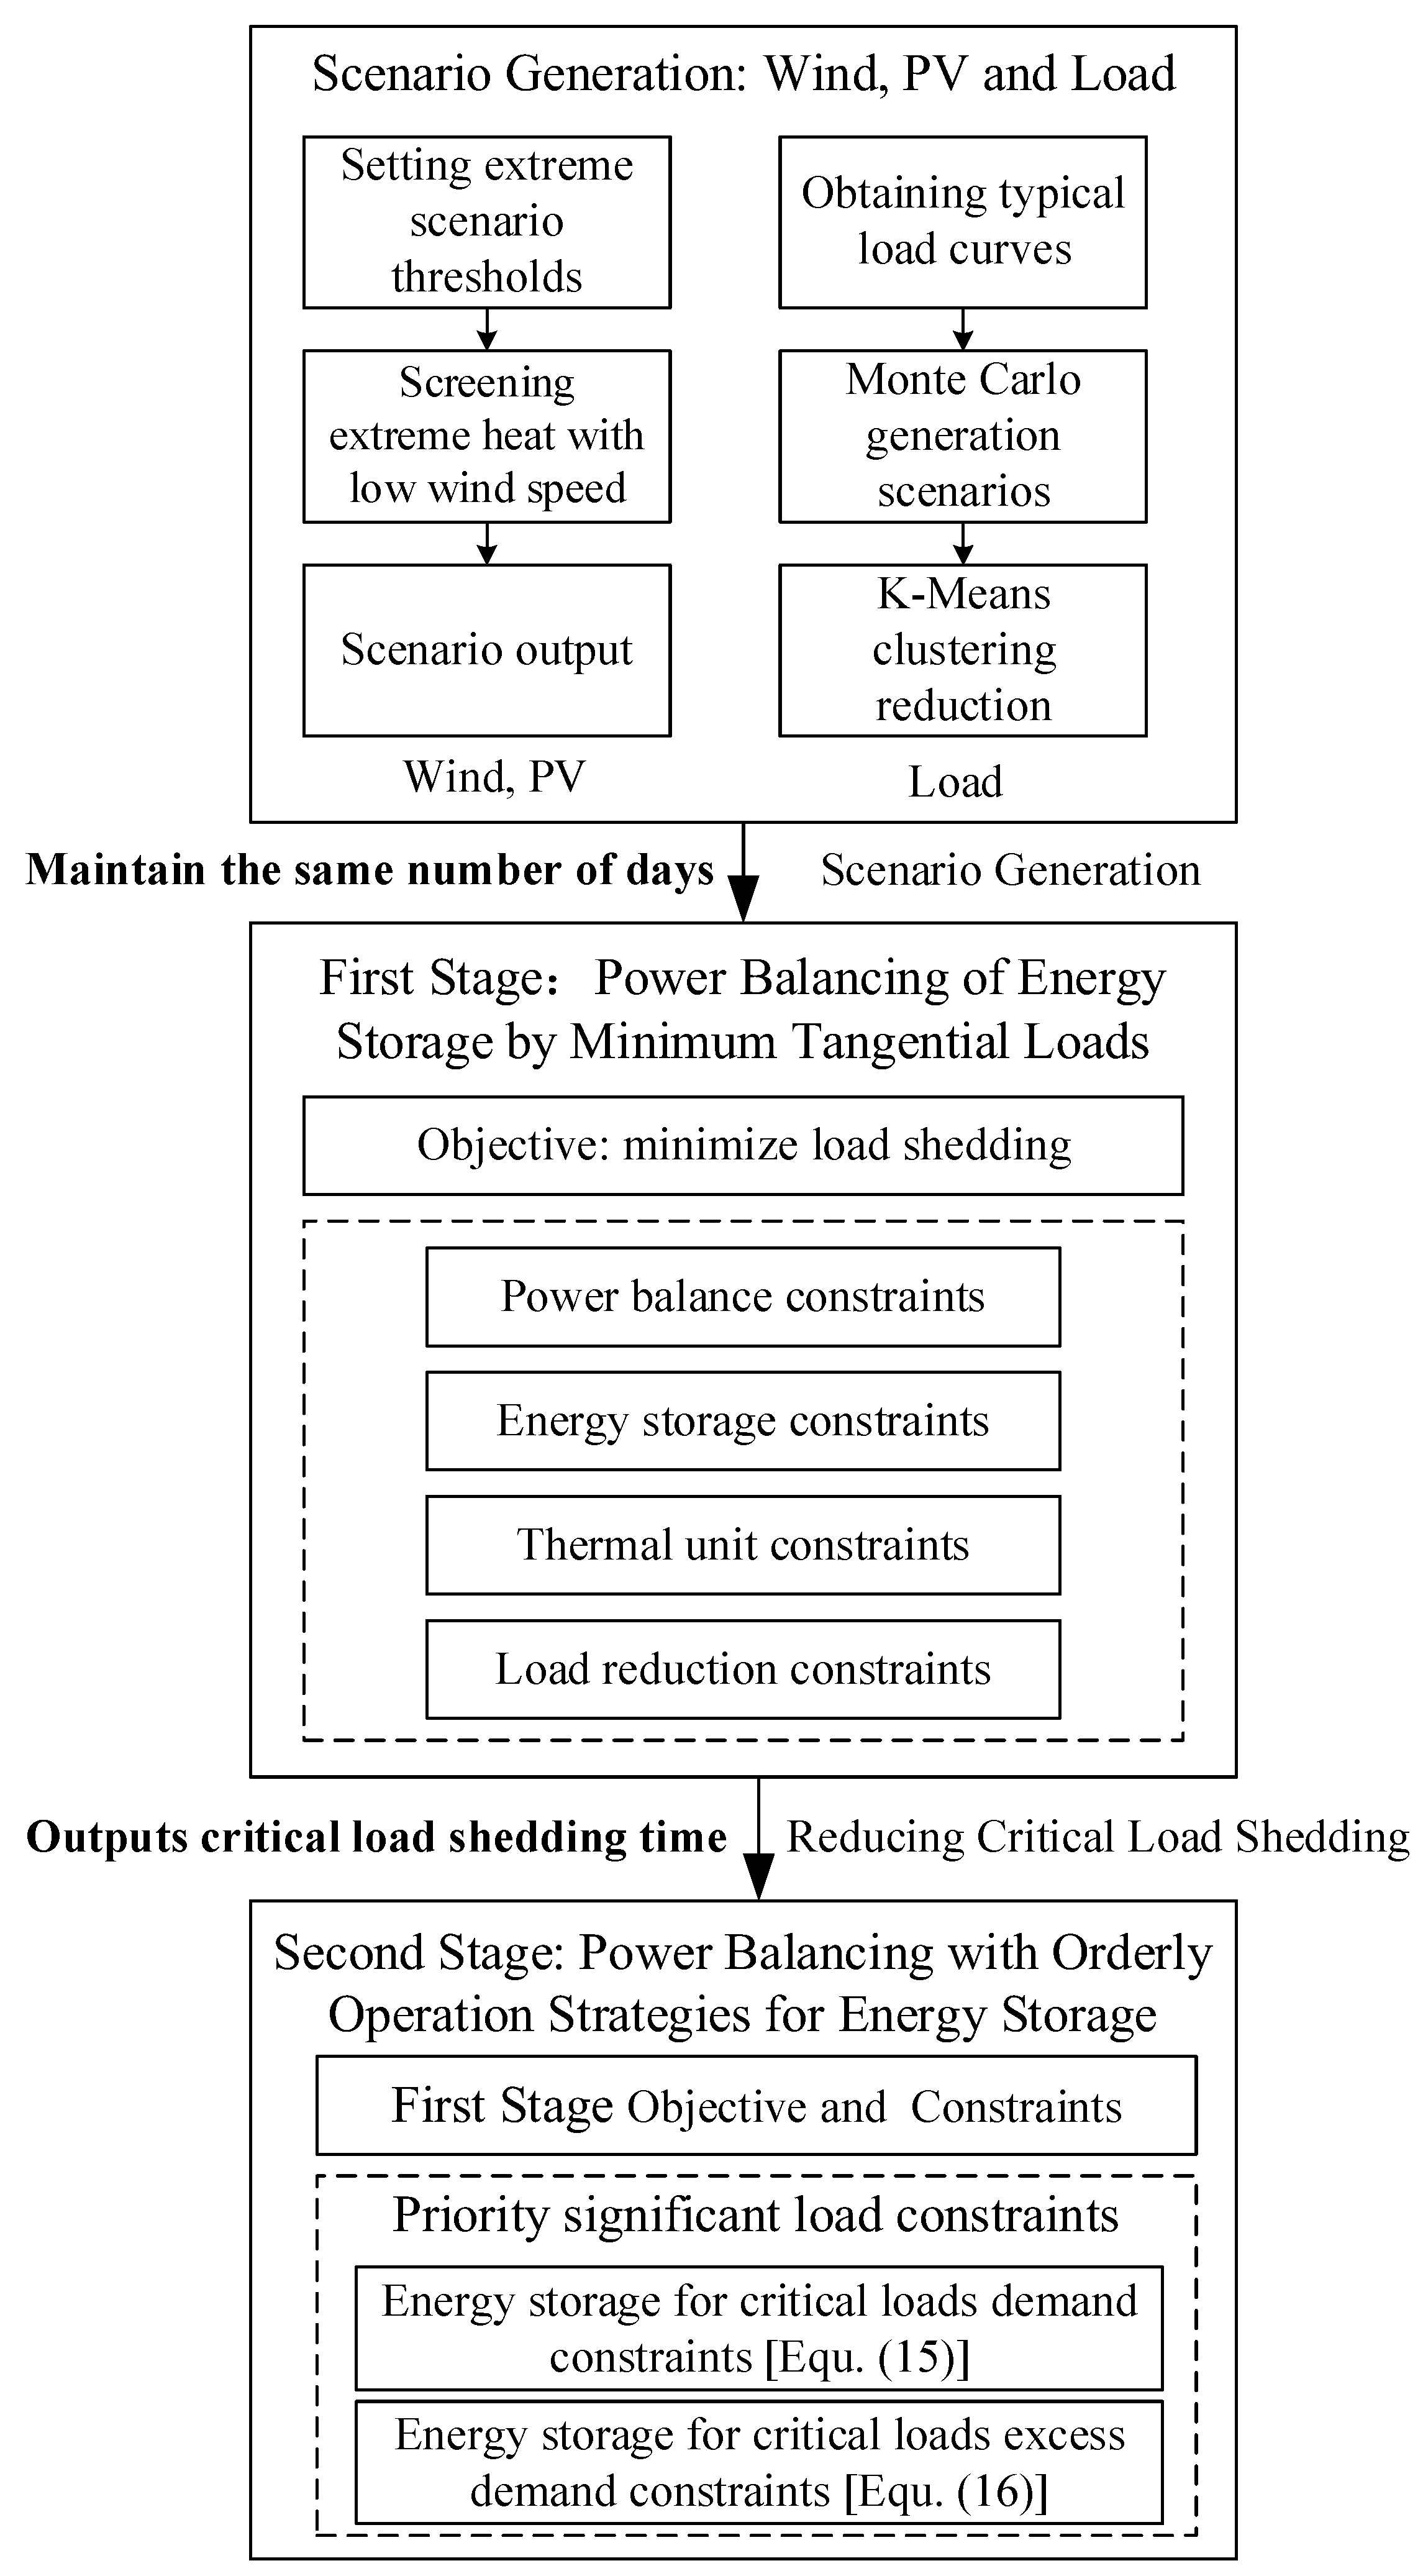
Ultimately, the flowchart of the two-stage operation strategy of energy storage for extreme-heat-with-low-wind-speed scenarios in the power system is shown in Figure 2.
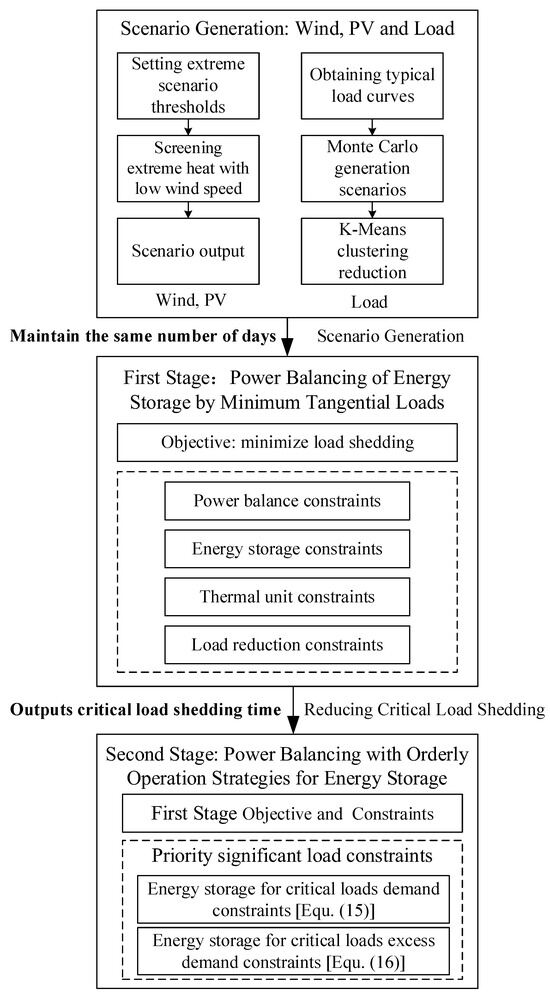
Figure 2.
A two-stage operation strategy for energy storage in extreme-heat-with-low-wind-speed scenarios of power system.
4. Case Analysis
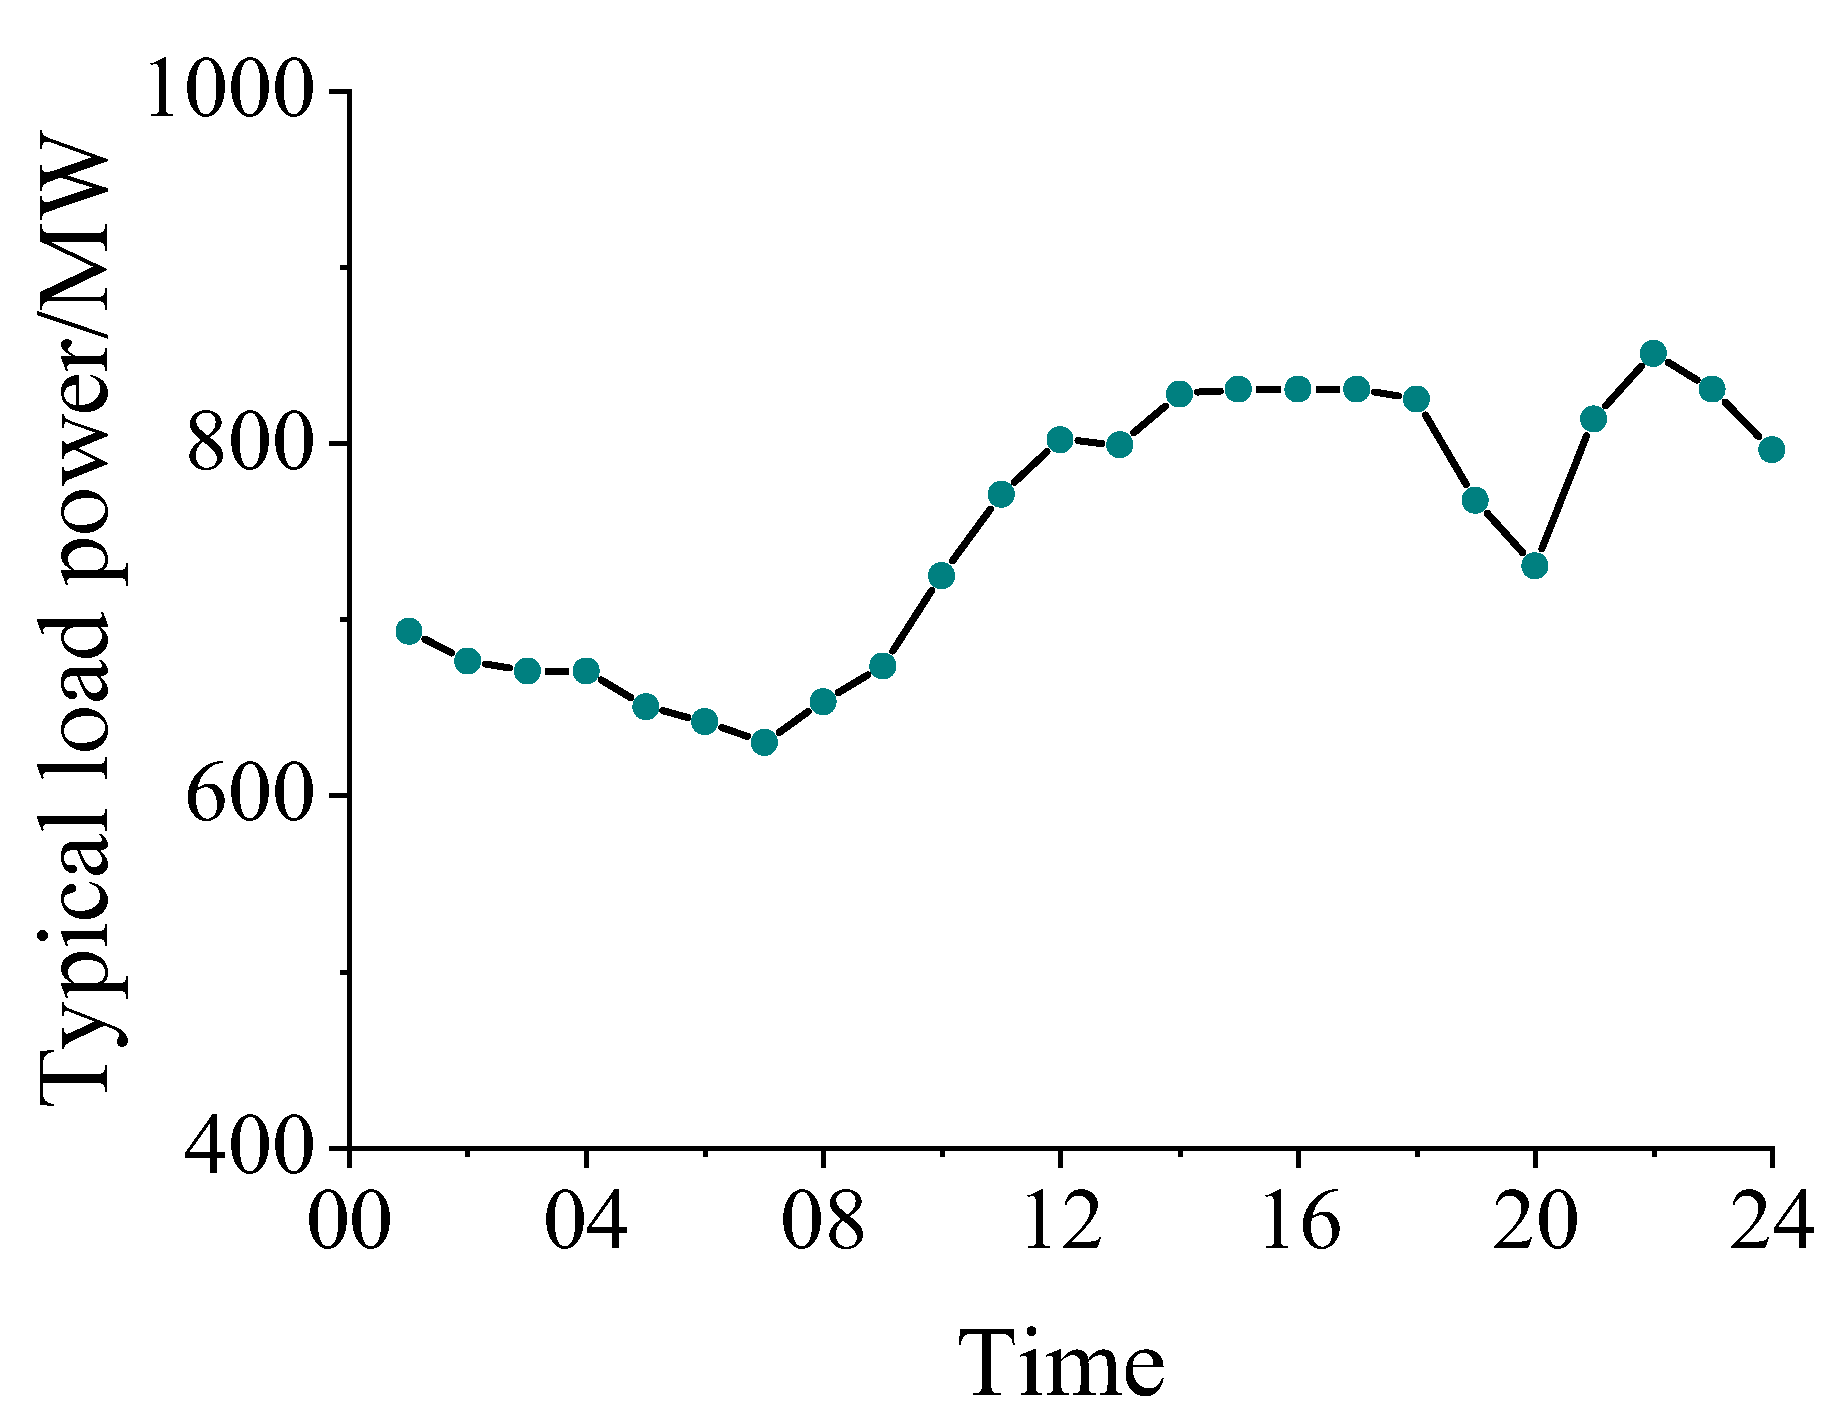
The historical typical load curve shown in Figure 3 is used as the base dataset in this paper. The load has characteristics of historical data that include typical scenarios, representing a typical load curve for a specific region in China [28].
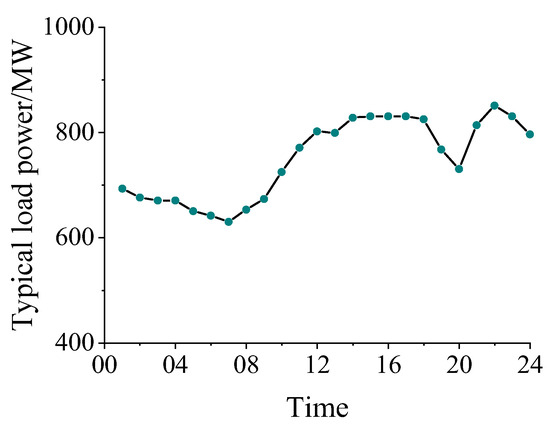
Figure 3.
Typical load power curve.
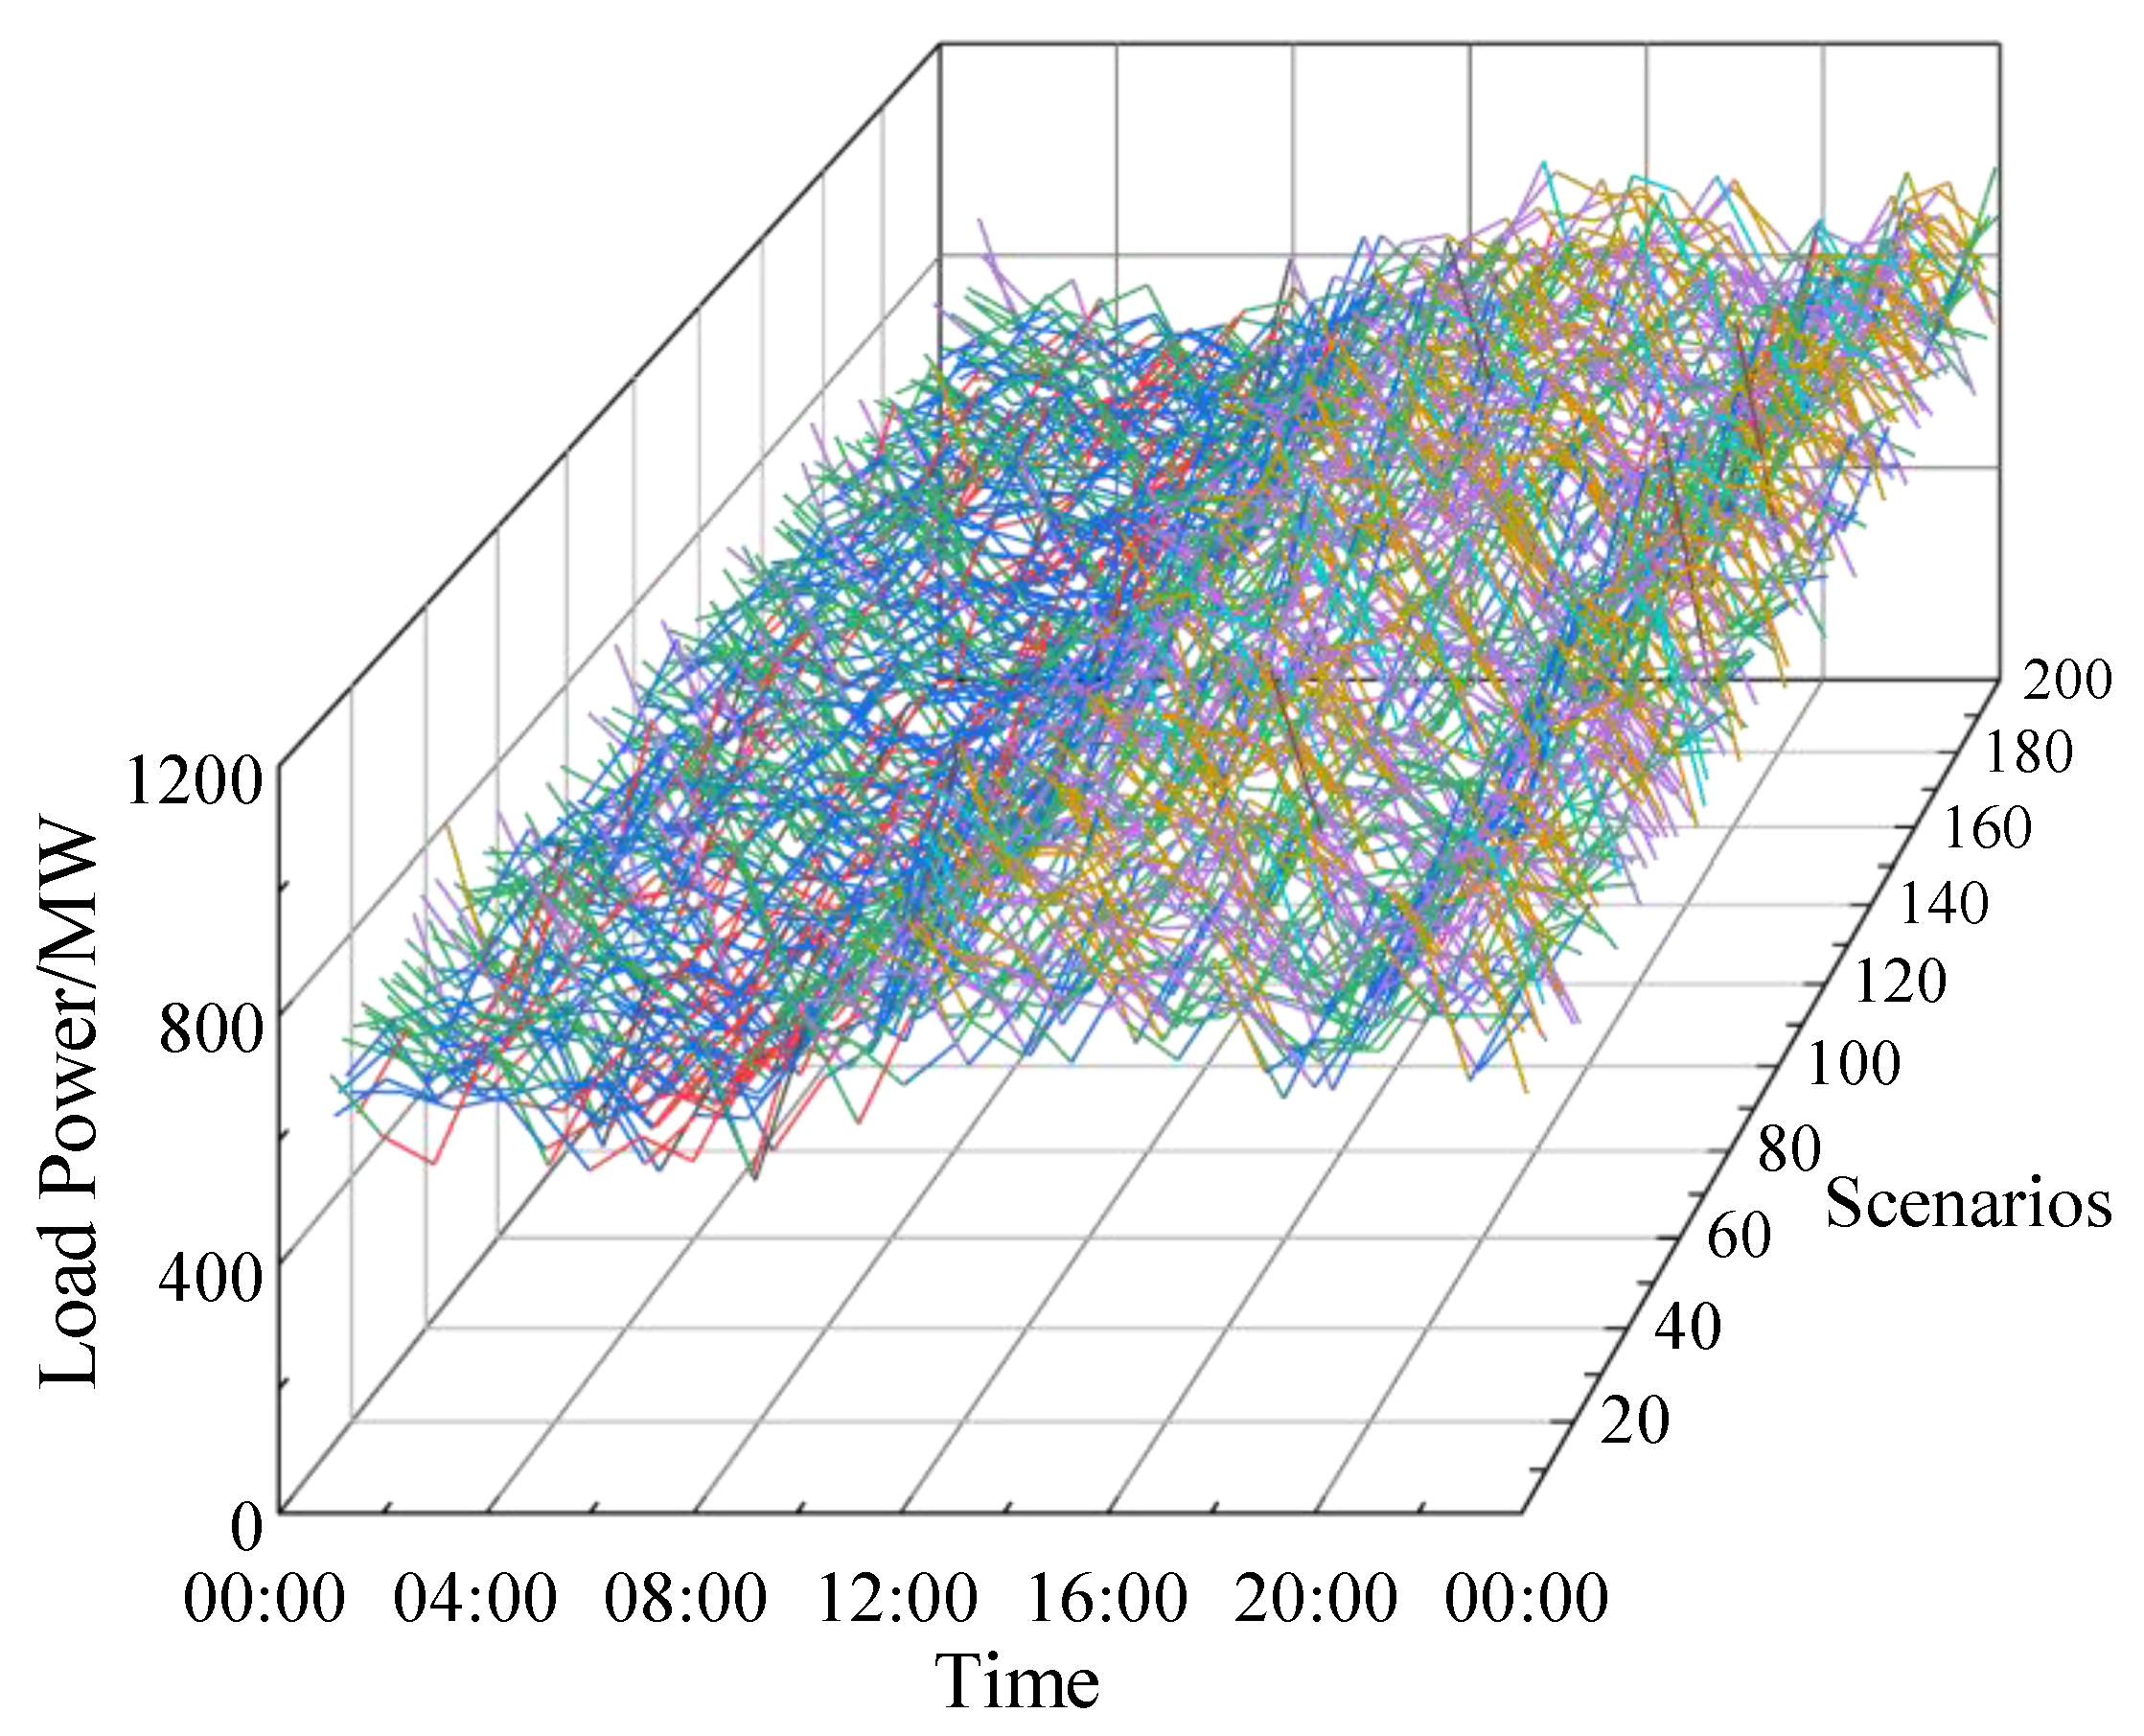
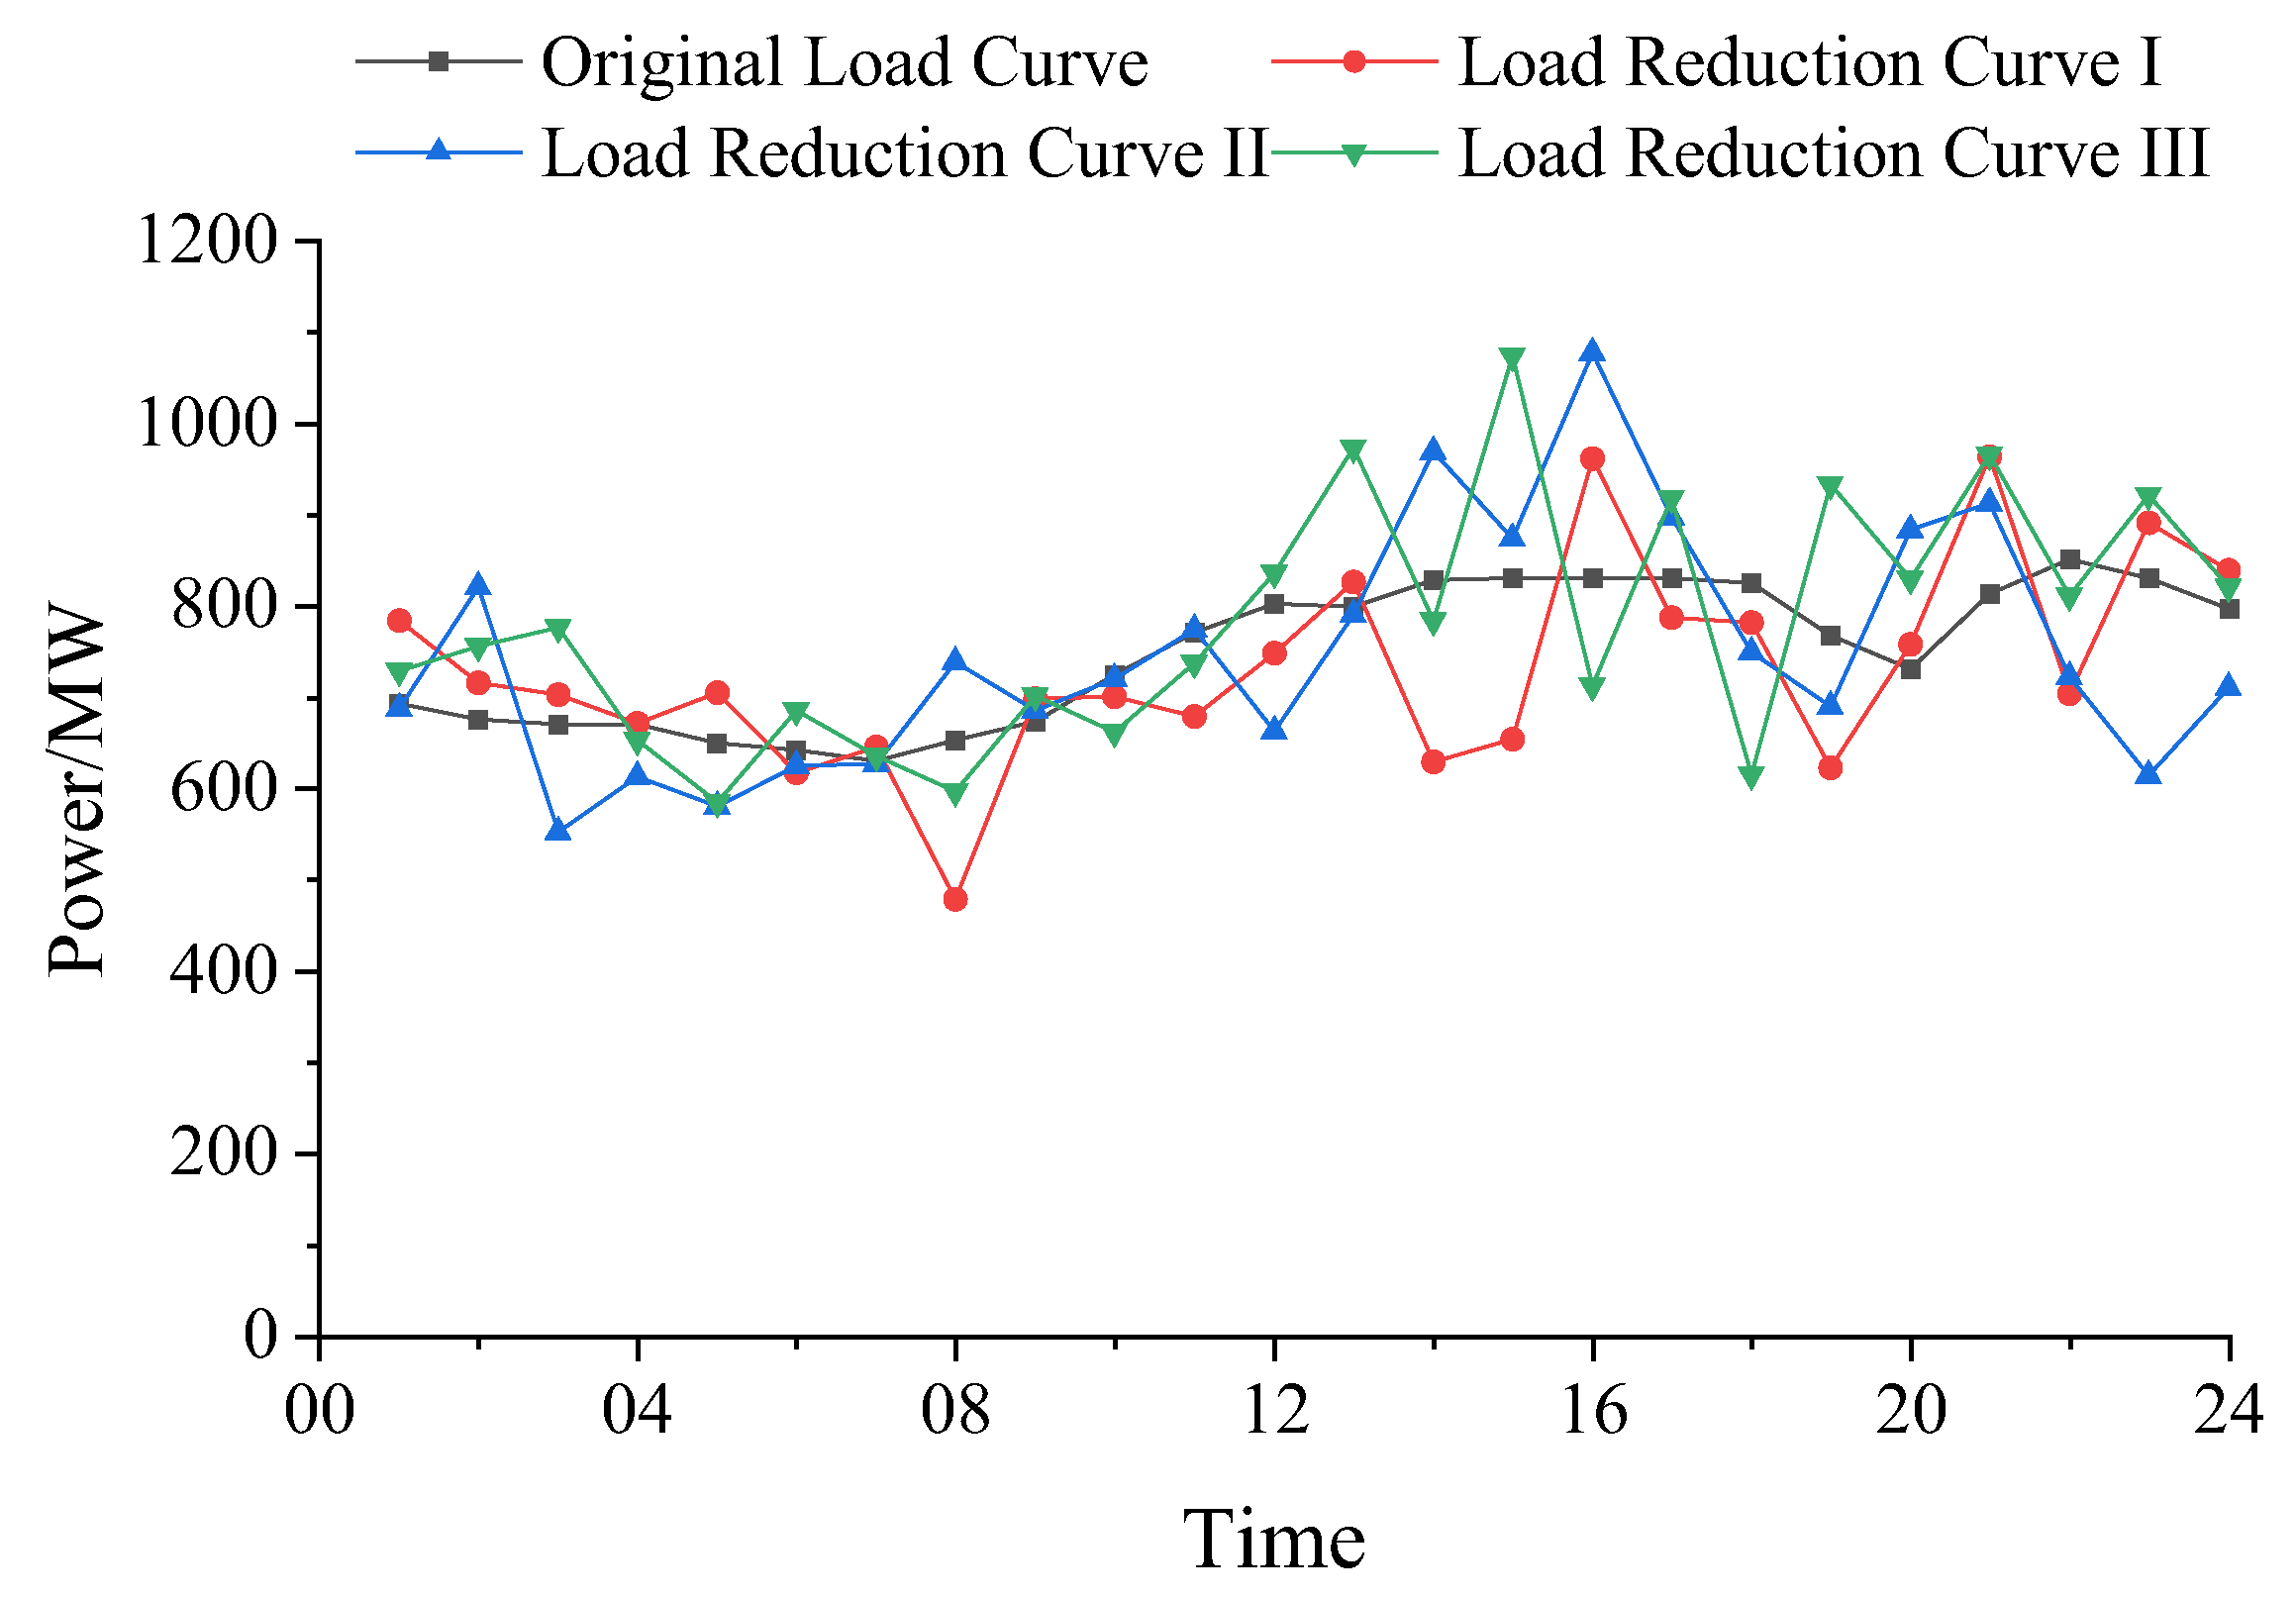
Subsequently, a Monte Carlo method is utilized to generate a vast array of synthetic load scenarios, visually represented in Figure 4. Following this scenario generation phase, a determination is made to select three representative days’ worth of load scenarios for further analysis. This selection process involves an iterative procedure that identifies the centroids of three distinct scenario classes in a manner that minimizes the average Euclidean distance between each scenario and its respective class centroid. The K-means clustering algorithm is then applied to identify the scenarios closest to these optimized class centers, thereby facilitating an effective scenario reduction technique, as illustrated in Figure 5. Ultimately, this method yields a compact yet representative subset of load scenarios that can be seamlessly integrated into subsequent analyses and modeling efforts.
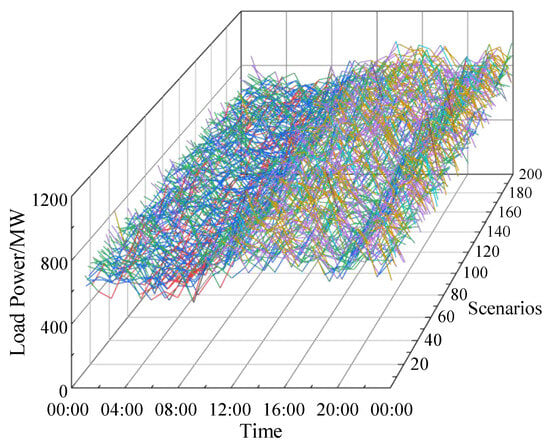
Figure 4.
Monte Carlo method to generate two hundred load scenarios.
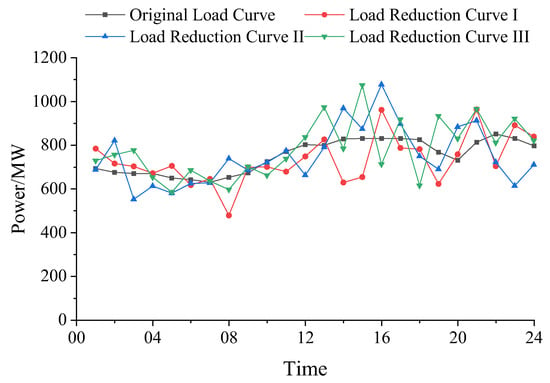
Figure 5.
Original load curve and load reduction curves.
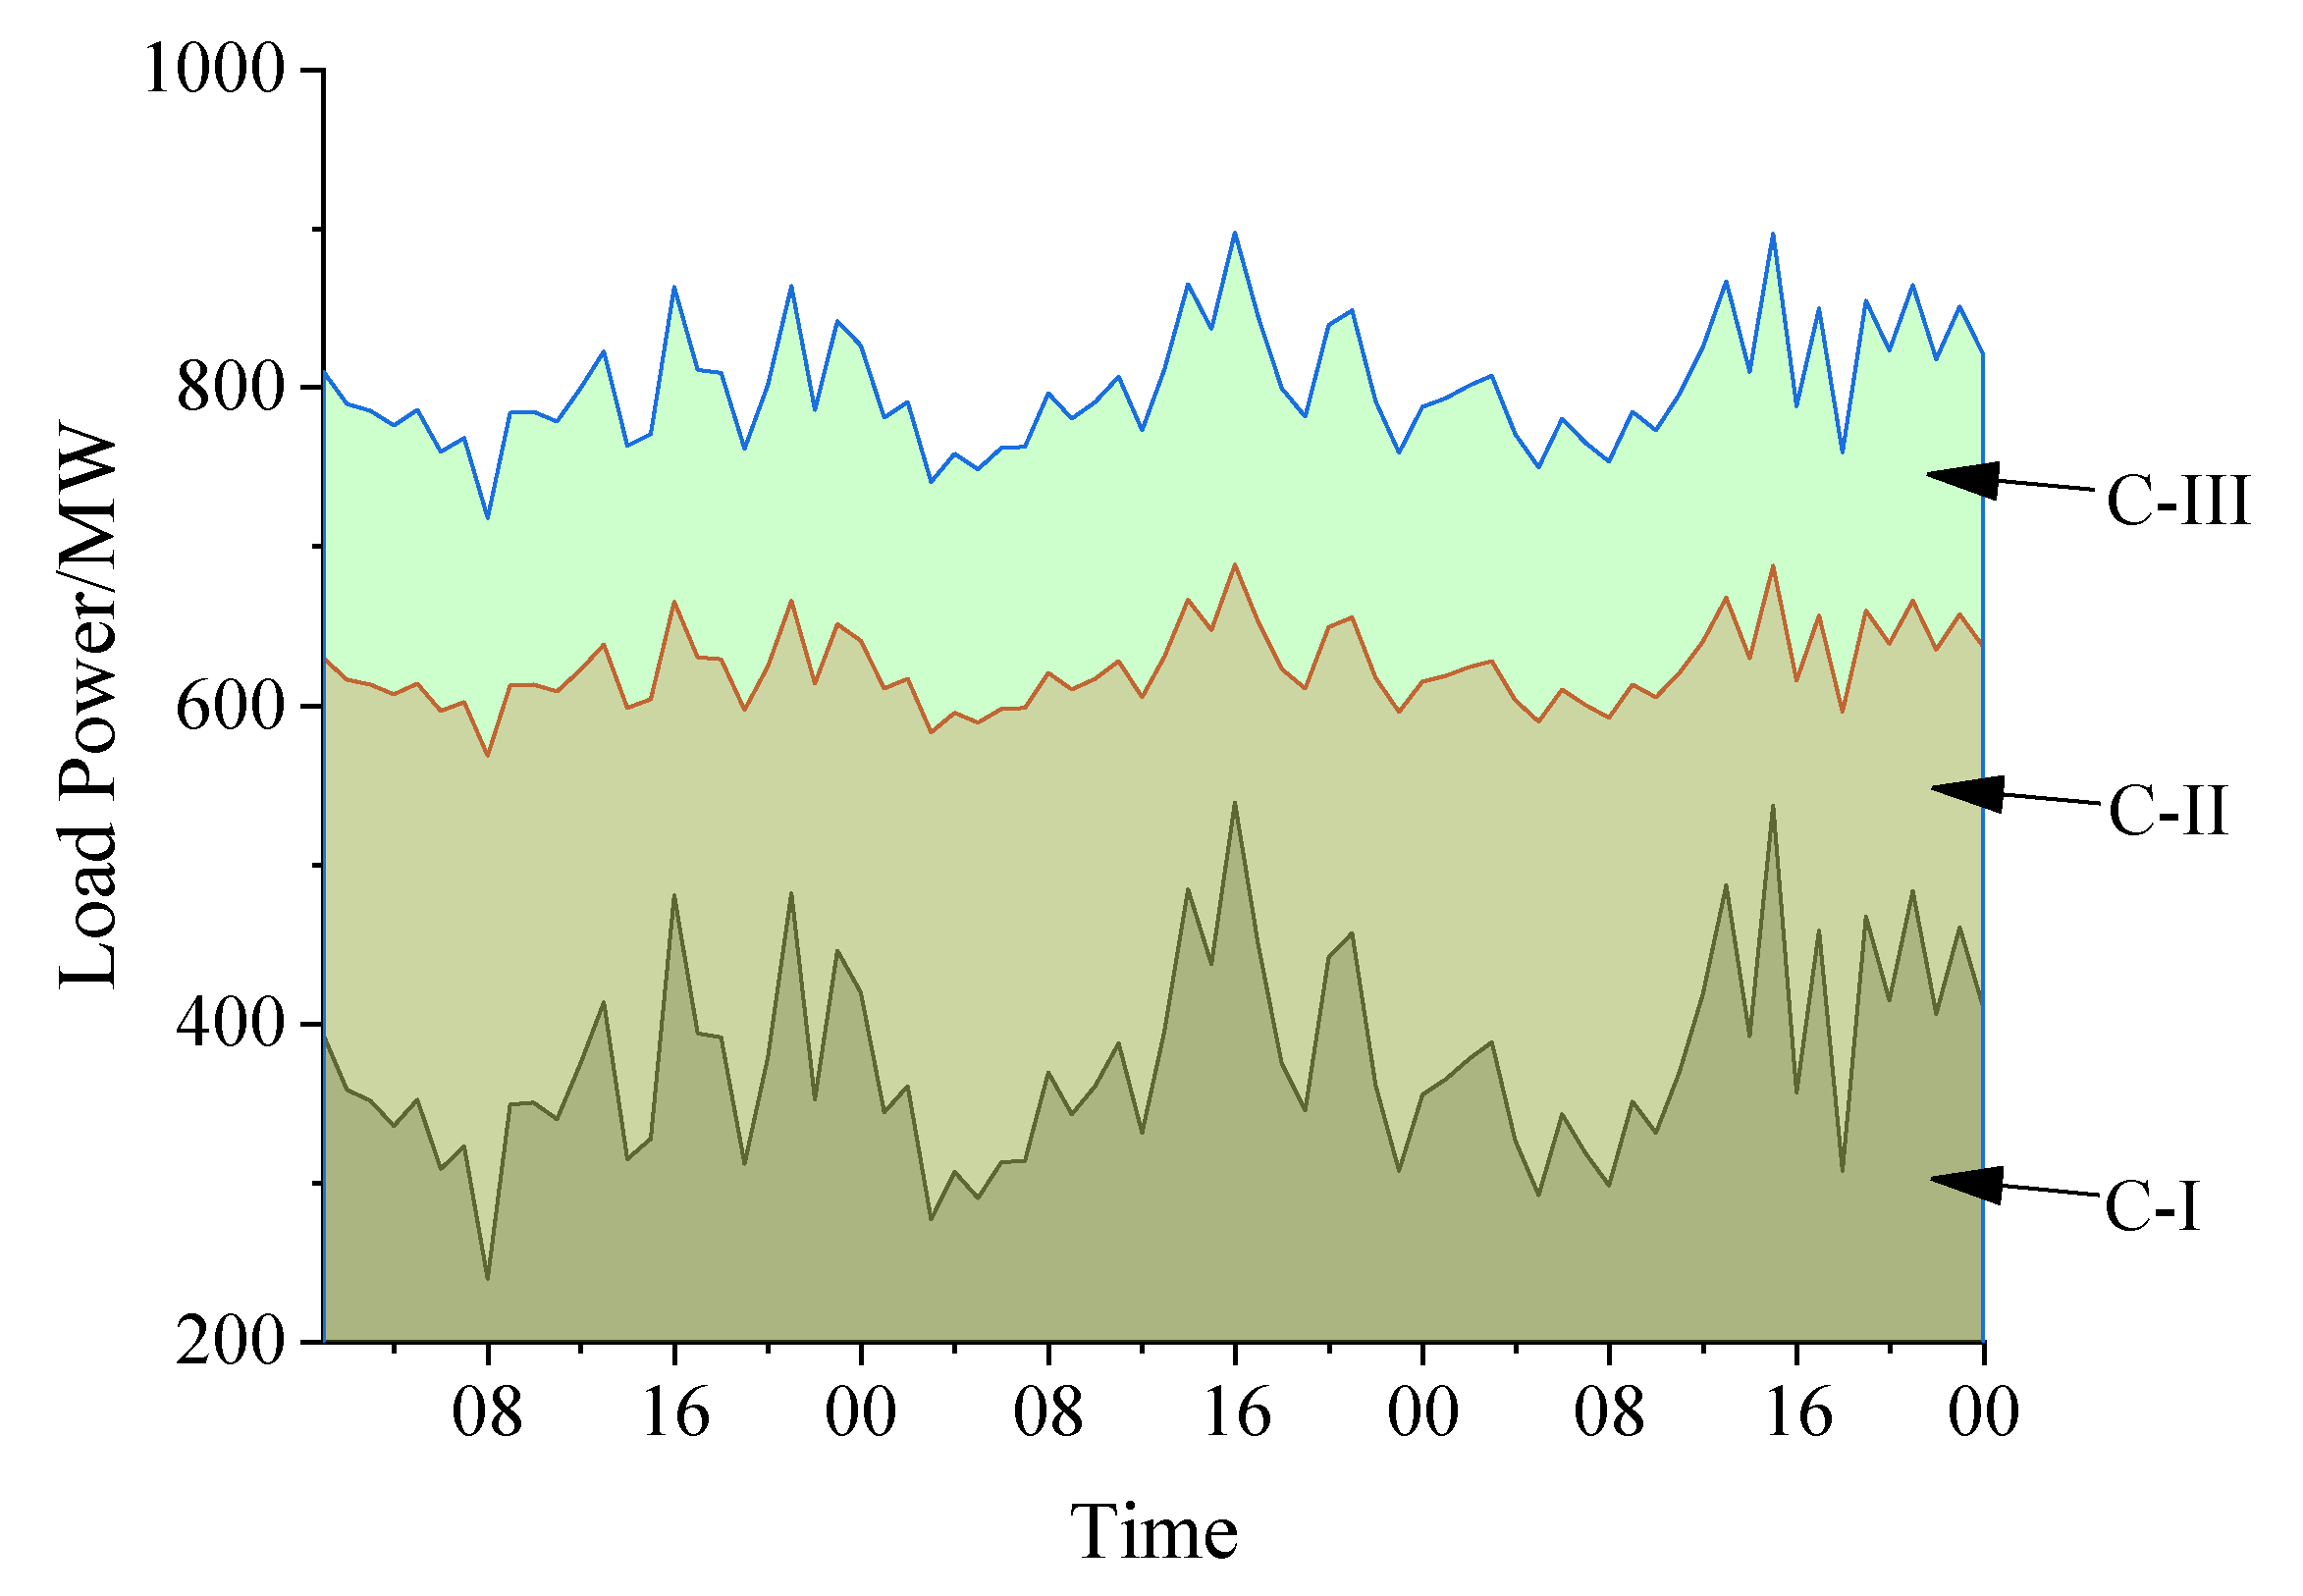
To conduct a comprehensive analysis of the relative proportions of the three distinct load classes present within the regional power system, the formulation expressed in Equation (1) is employed. This equation facilitates the segregation of the overall load curve into three distinct classes, with Class I (C-I) explicitly delineated as a standalone class, while the remaining load components are collectively grouped into the other two classes. The resulting three classes of load power curves, each representing a unique curve of demand patterns, are visually depicted in Figure 6. This demonstrates the extension of the typical load curve under error constraints, aiding in the further analysis and assessment of the power system operation under scenarios of extreme heat accompanied by low wind speed [29]. This provides example curves for the operation of energy storage systems discussed in this paper.
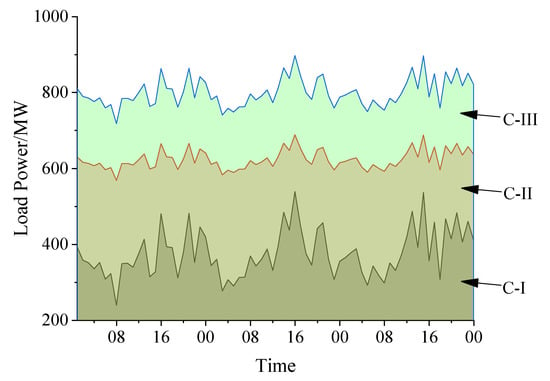
Figure 6.
Three classes of load power curves.
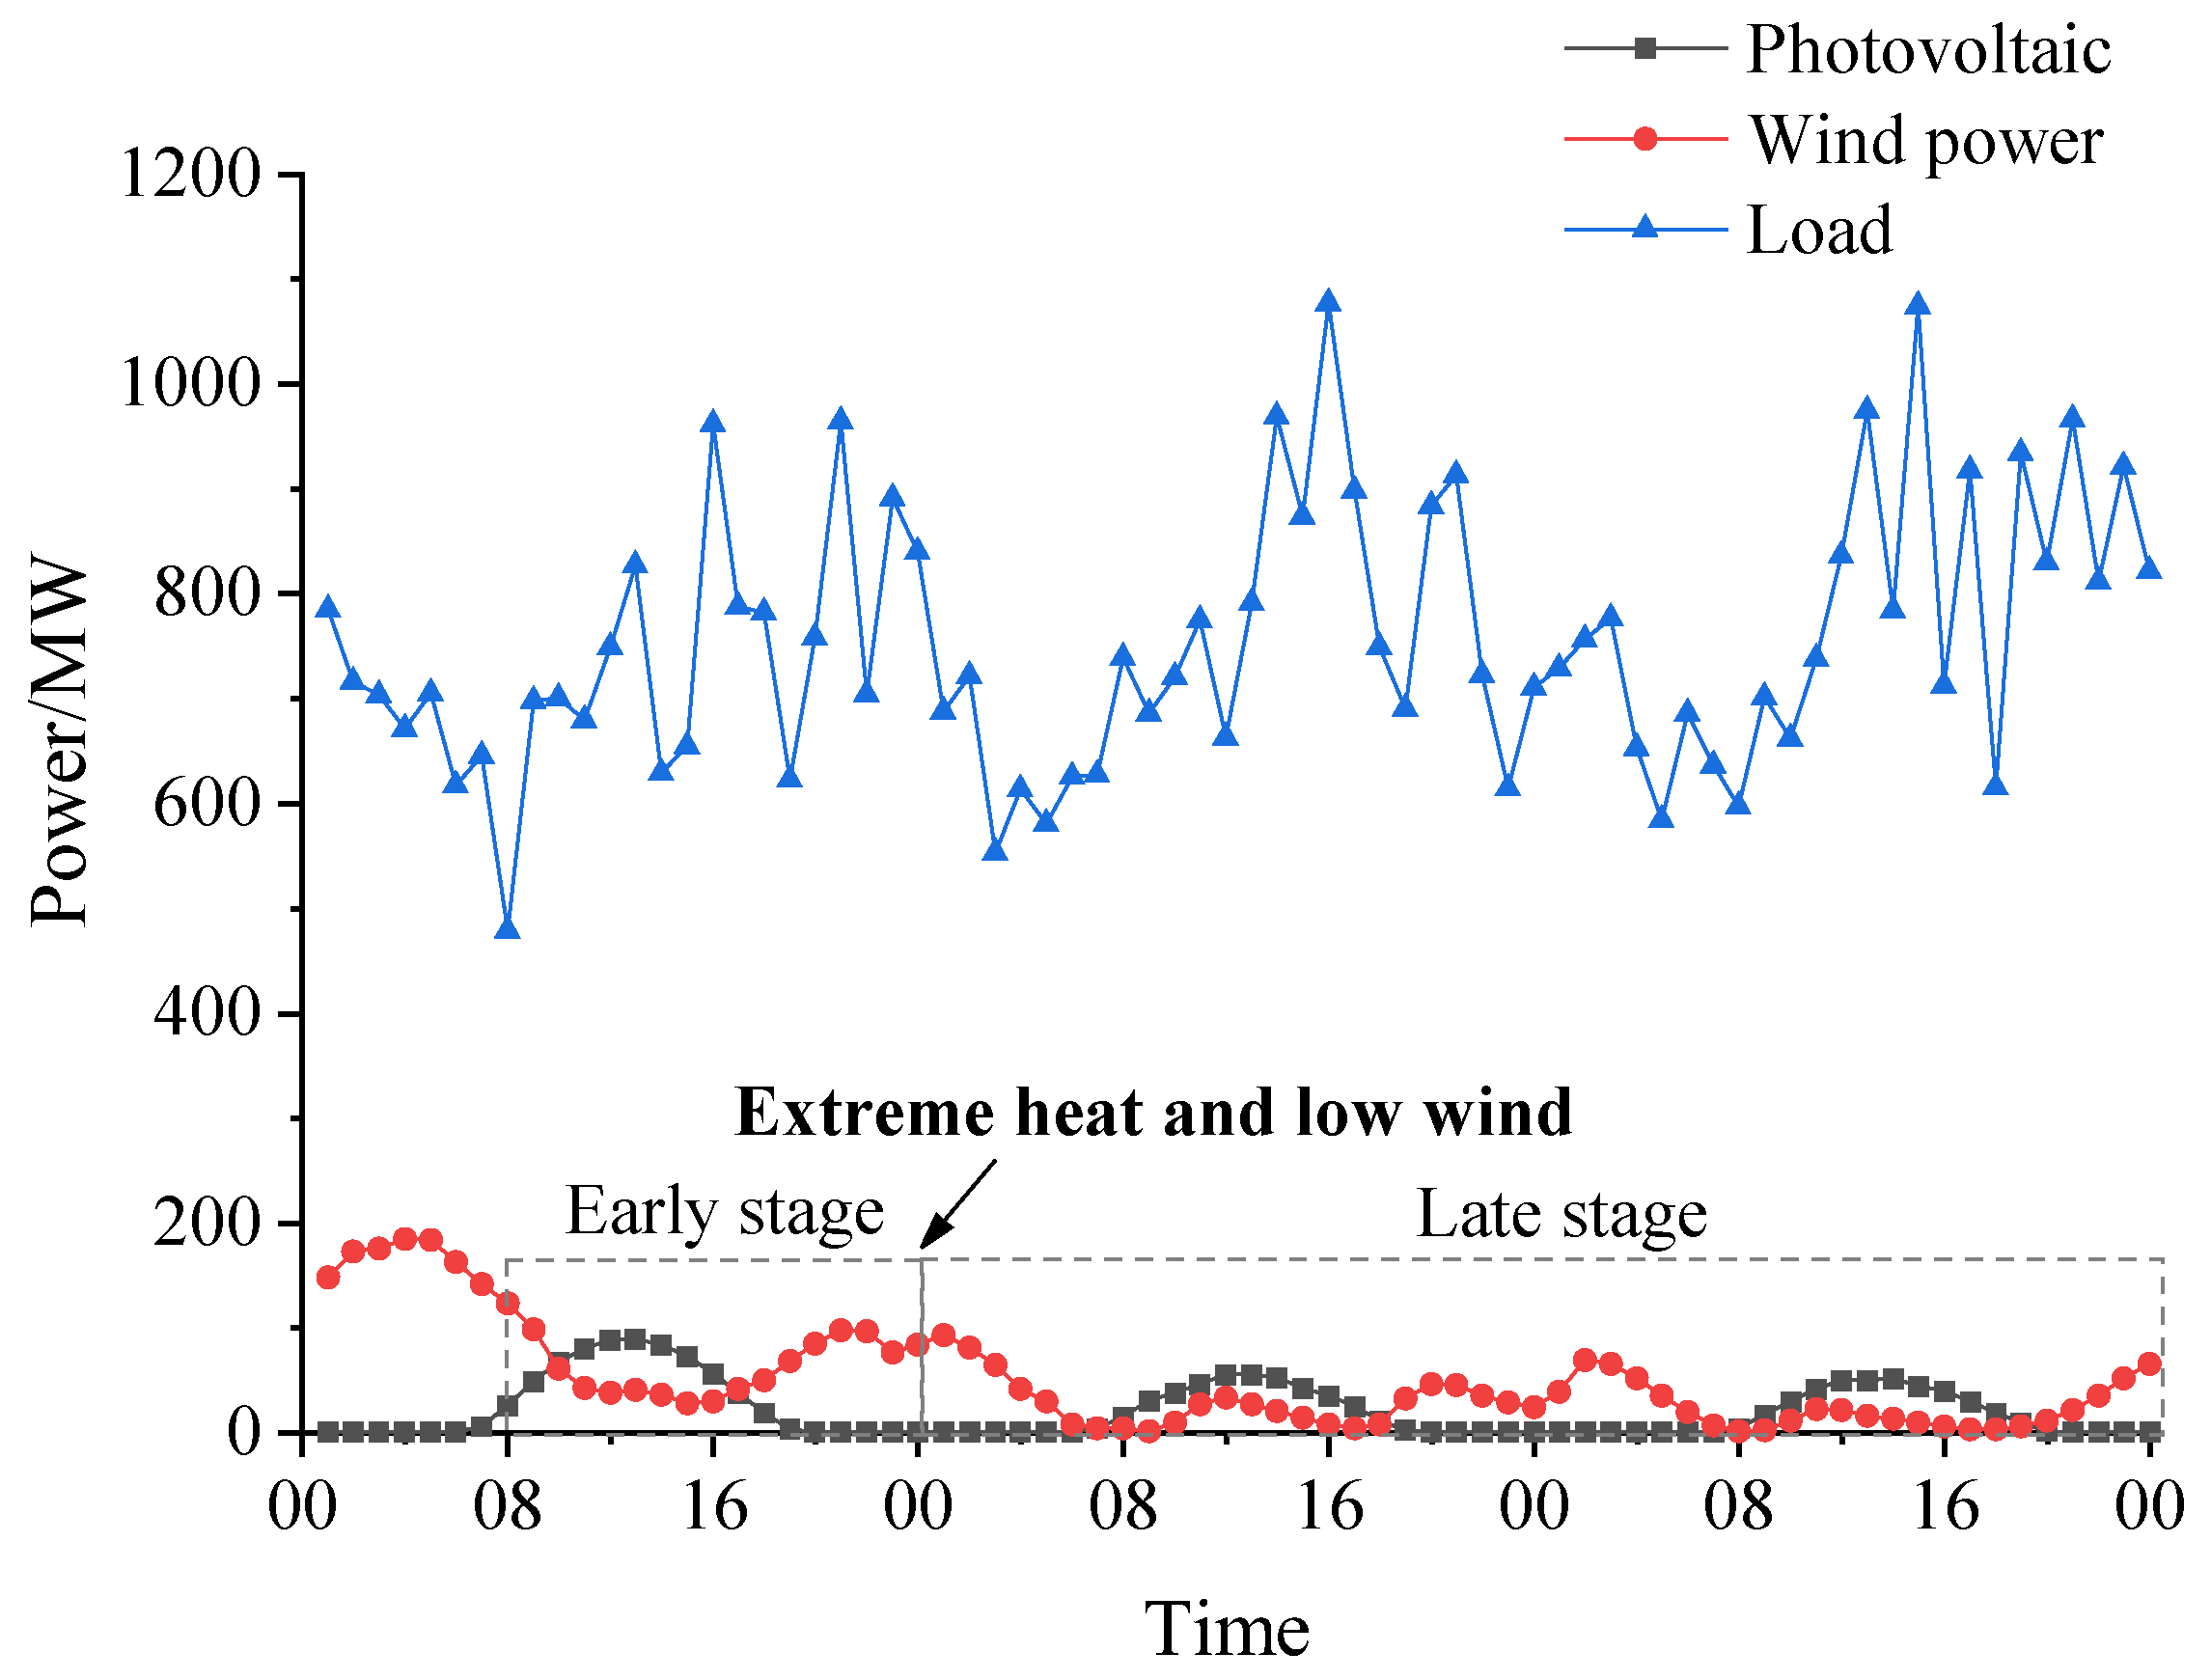
In the computational example presented in this paper, a crucial step involves analyzing the output characteristics of wind and solar power under extreme-heat-and-low-wind-speed conditions. This necessitates screening and identifying the specific wind and solar power output curves that correspond to such severe meteorological scenarios. Notably, the wind power output exhibits a distinctly low level during periods of extreme heat coupled with minimal wind availability. In contrast, the photovoltaic (PV) output remains relatively less affected by these extreme conditions. For the selected study area, the installed capacity comprises 100 MW of PV, 230 MW of wind power, 250 MW of DC-fed power, and 400 MW of thermal power generation, collectively representing a power system with a high penetration of renewable energy sources.
Under the extreme-heat-and-low-wind-speed meteorological conditions investigated, the renewable energy contribution in the form of wind power output is substantially diminished, generally falling below 20% of the installed capacity. To accurately capture the system behavior during such events, this paper selects representative wind power, PV, and load curves spanning two consecutive days of extreme-heat-and-low-wind-speed-conditions, as well as the preceding day. These three days’ worth of scenario data, as illustrated in Figure 7, serve as essential inputs for the subsequent analyses and modeling efforts undertaken in this study.
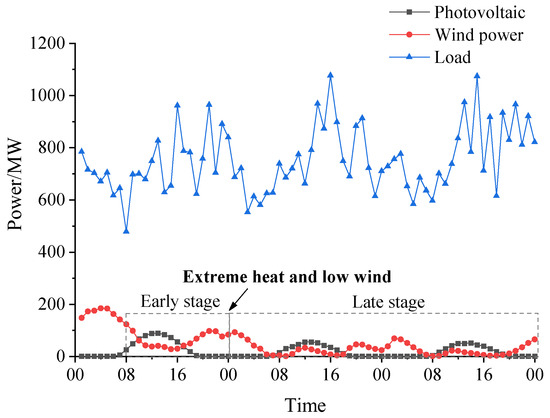
Figure 7.
Extreme-heat-with-low-wind-speed scenario.
Additionally, the analysis incorporates the assumption that the installed thermal power capacity is subject to a gradual ramp-up rate of 2.5% per minute, reflecting the operational constraints and response characteristics of conventional thermal generators. Furthermore, the study considers an energy storage system with a capacity equivalent to 20% of the total installed wind power capacity, representing a substantial grid-scale storage resource.
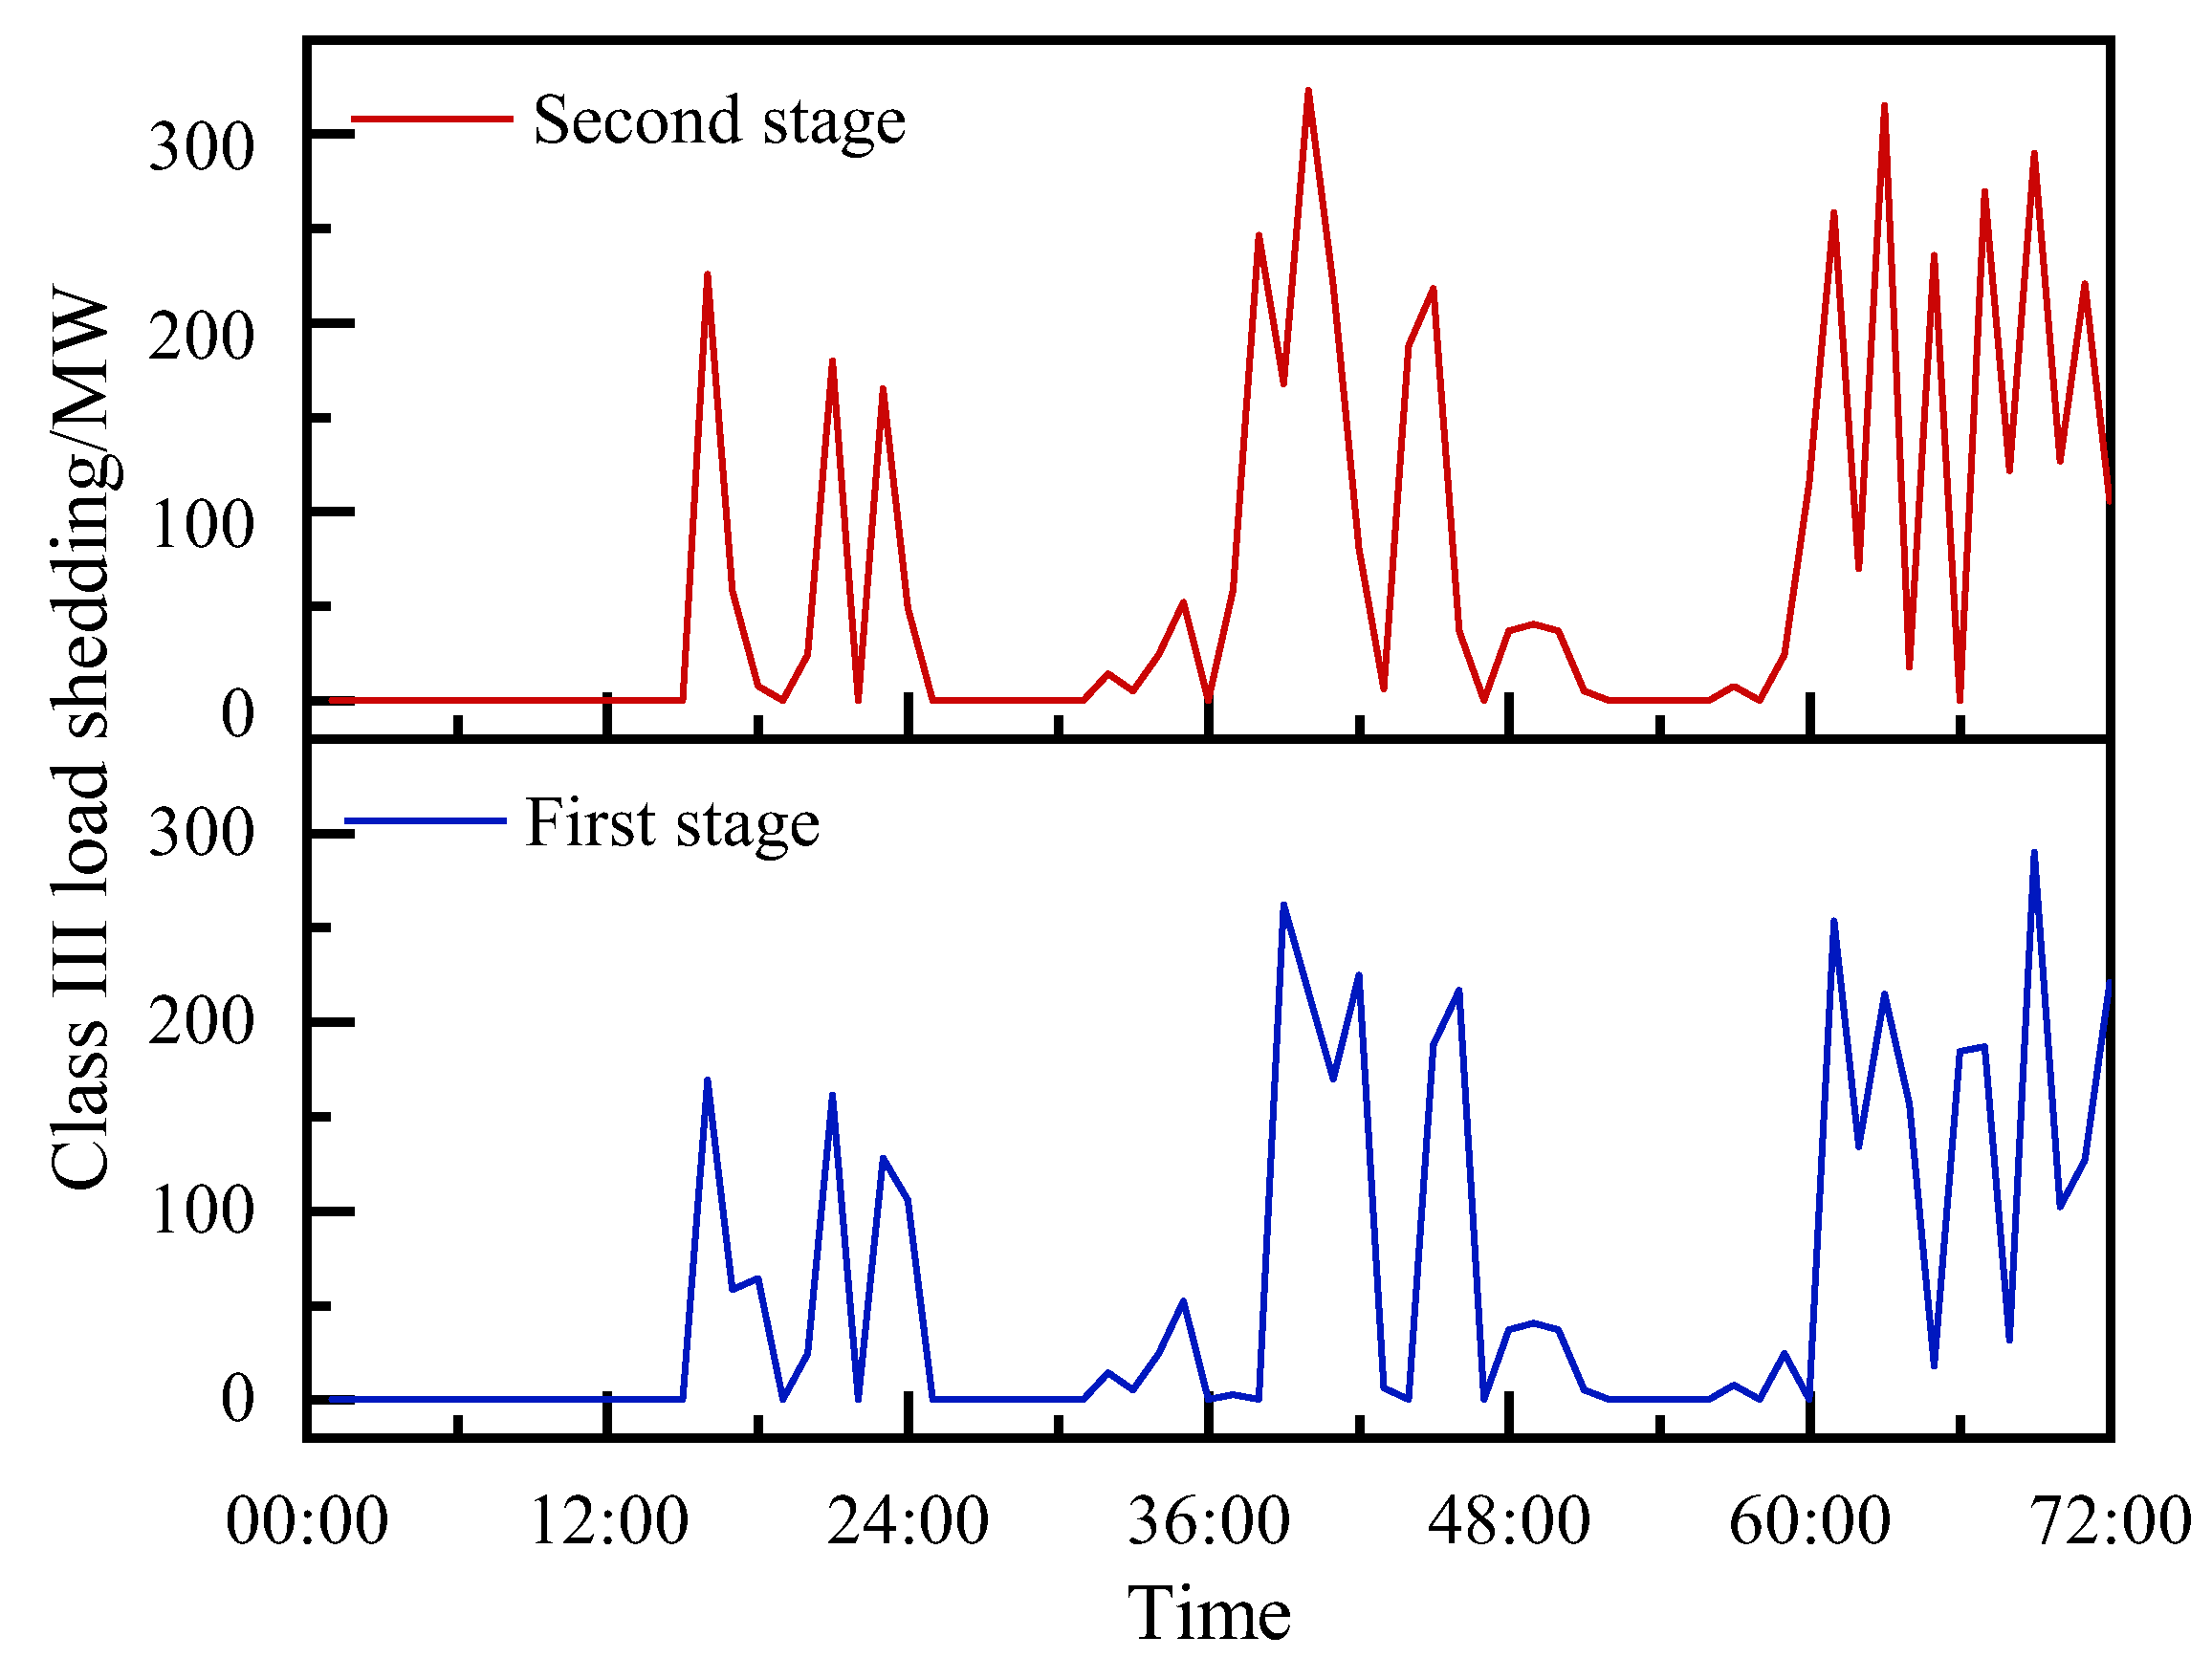
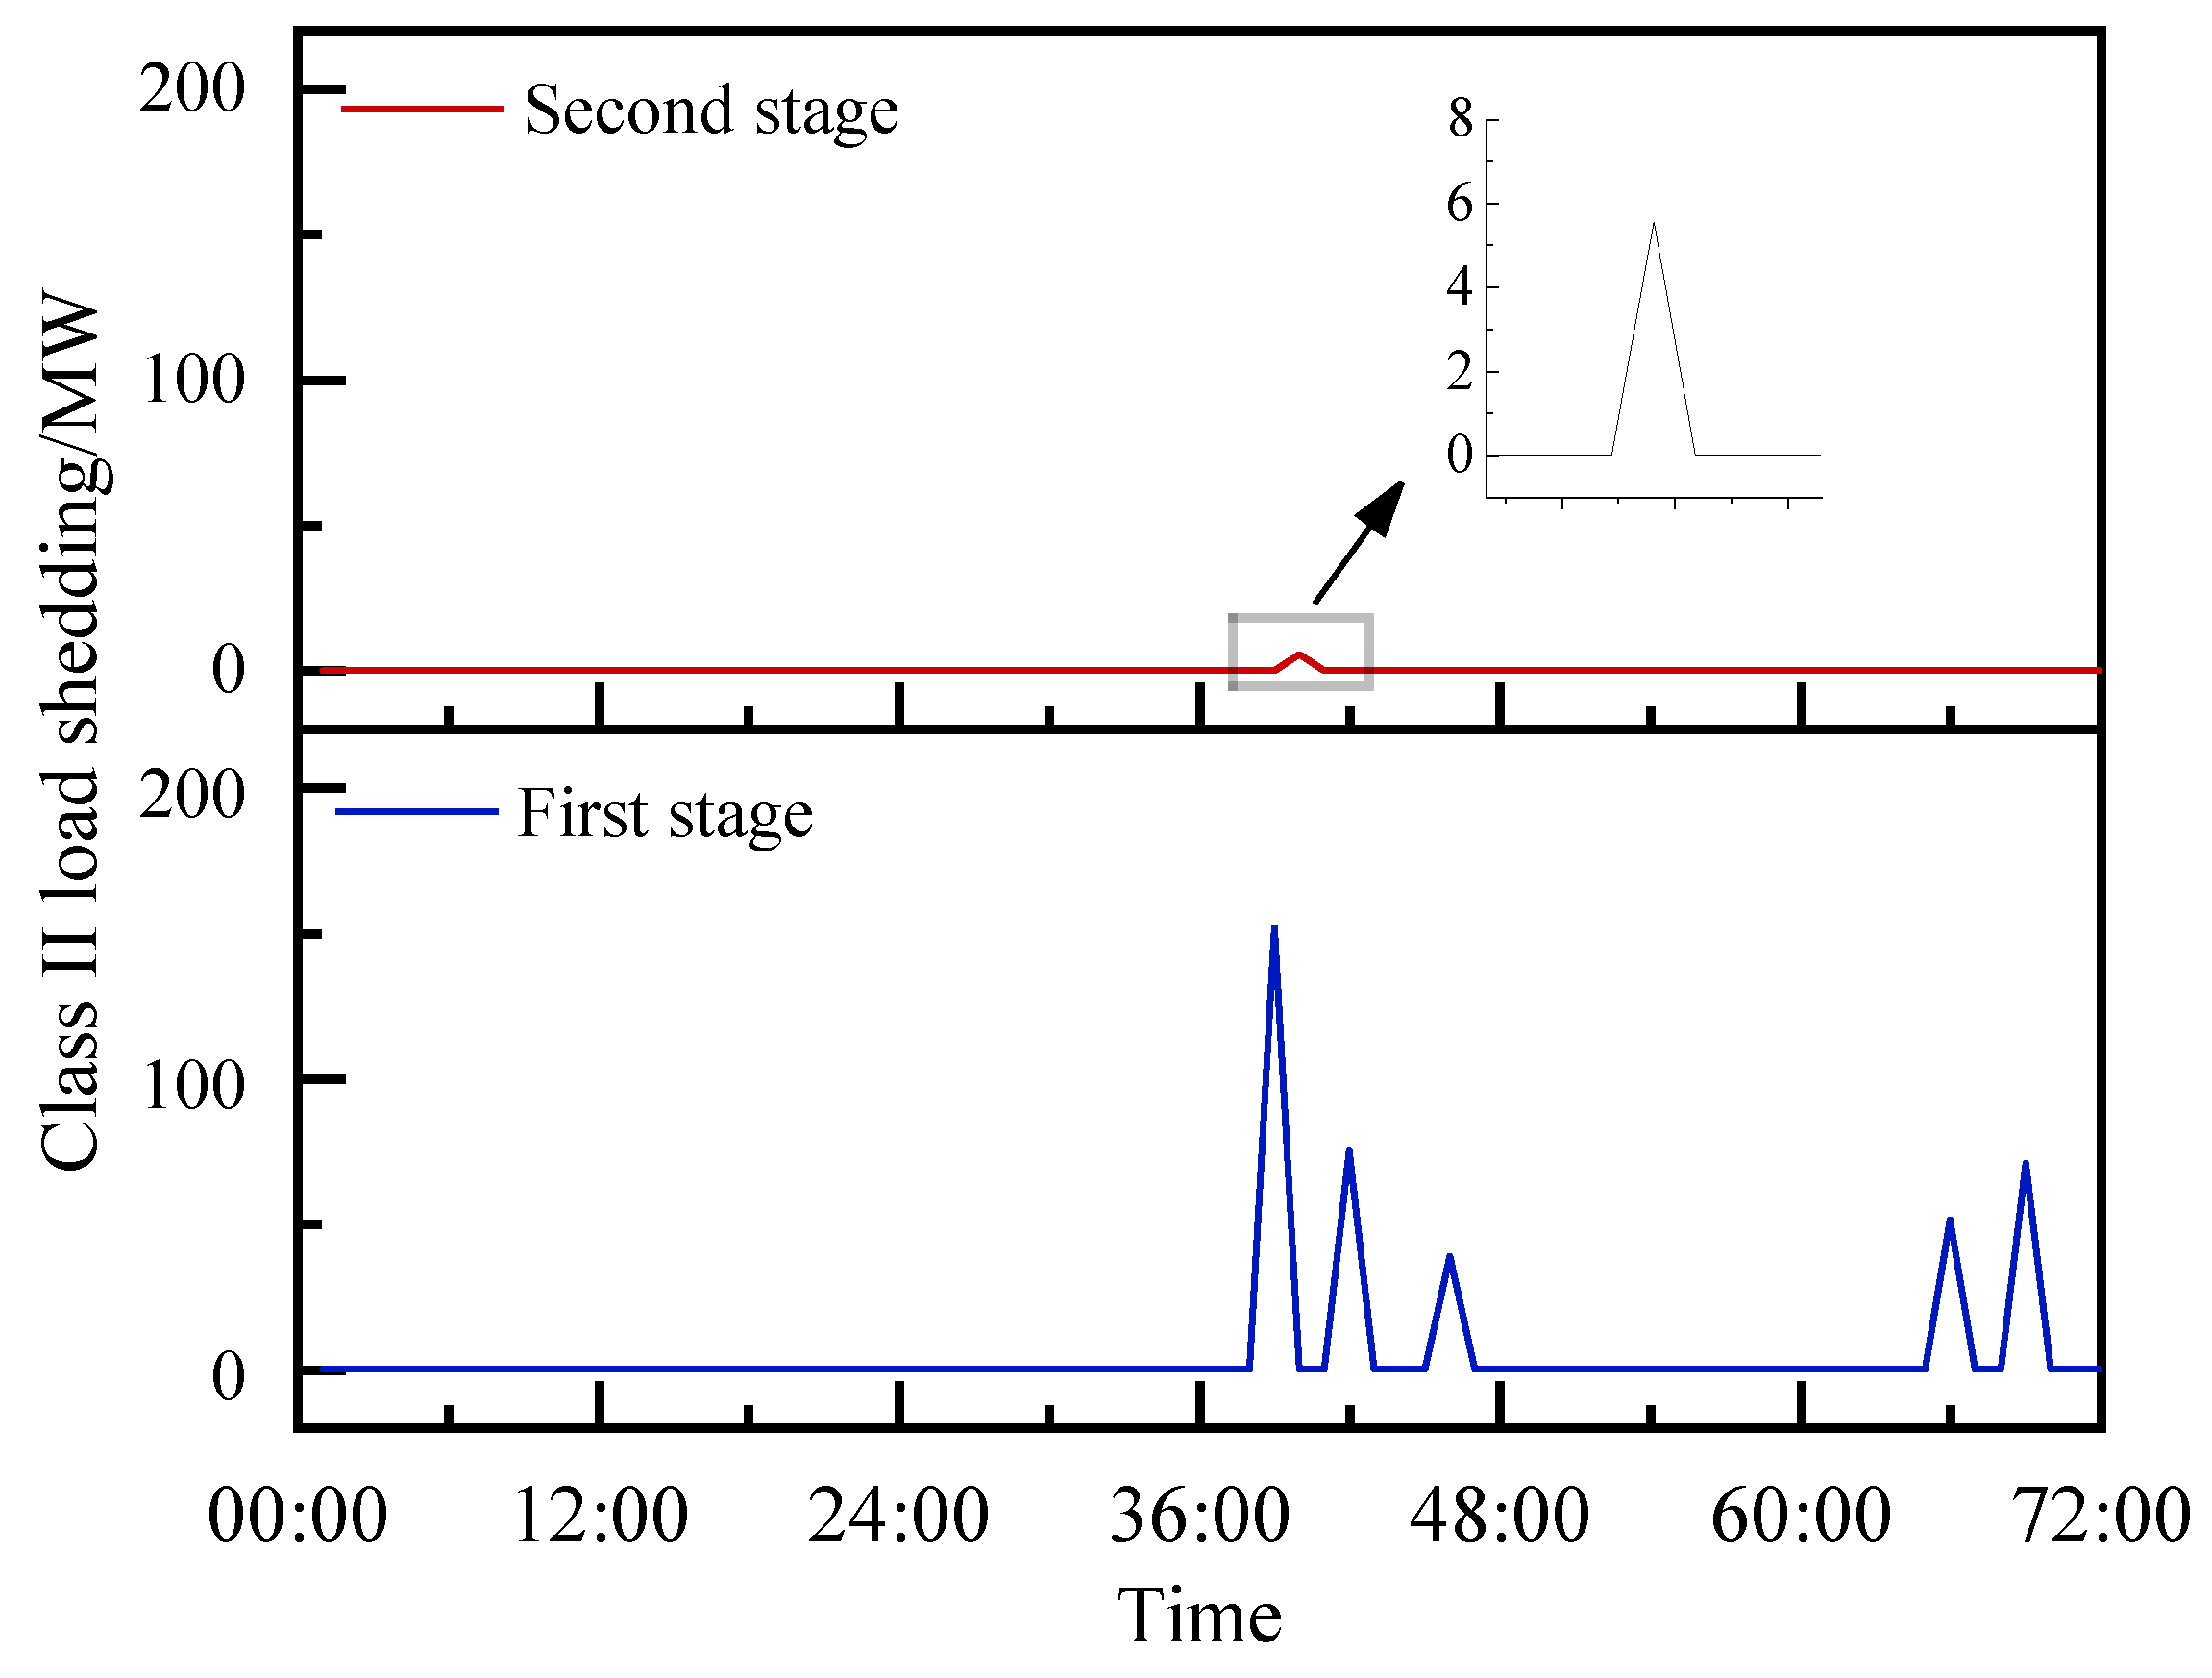
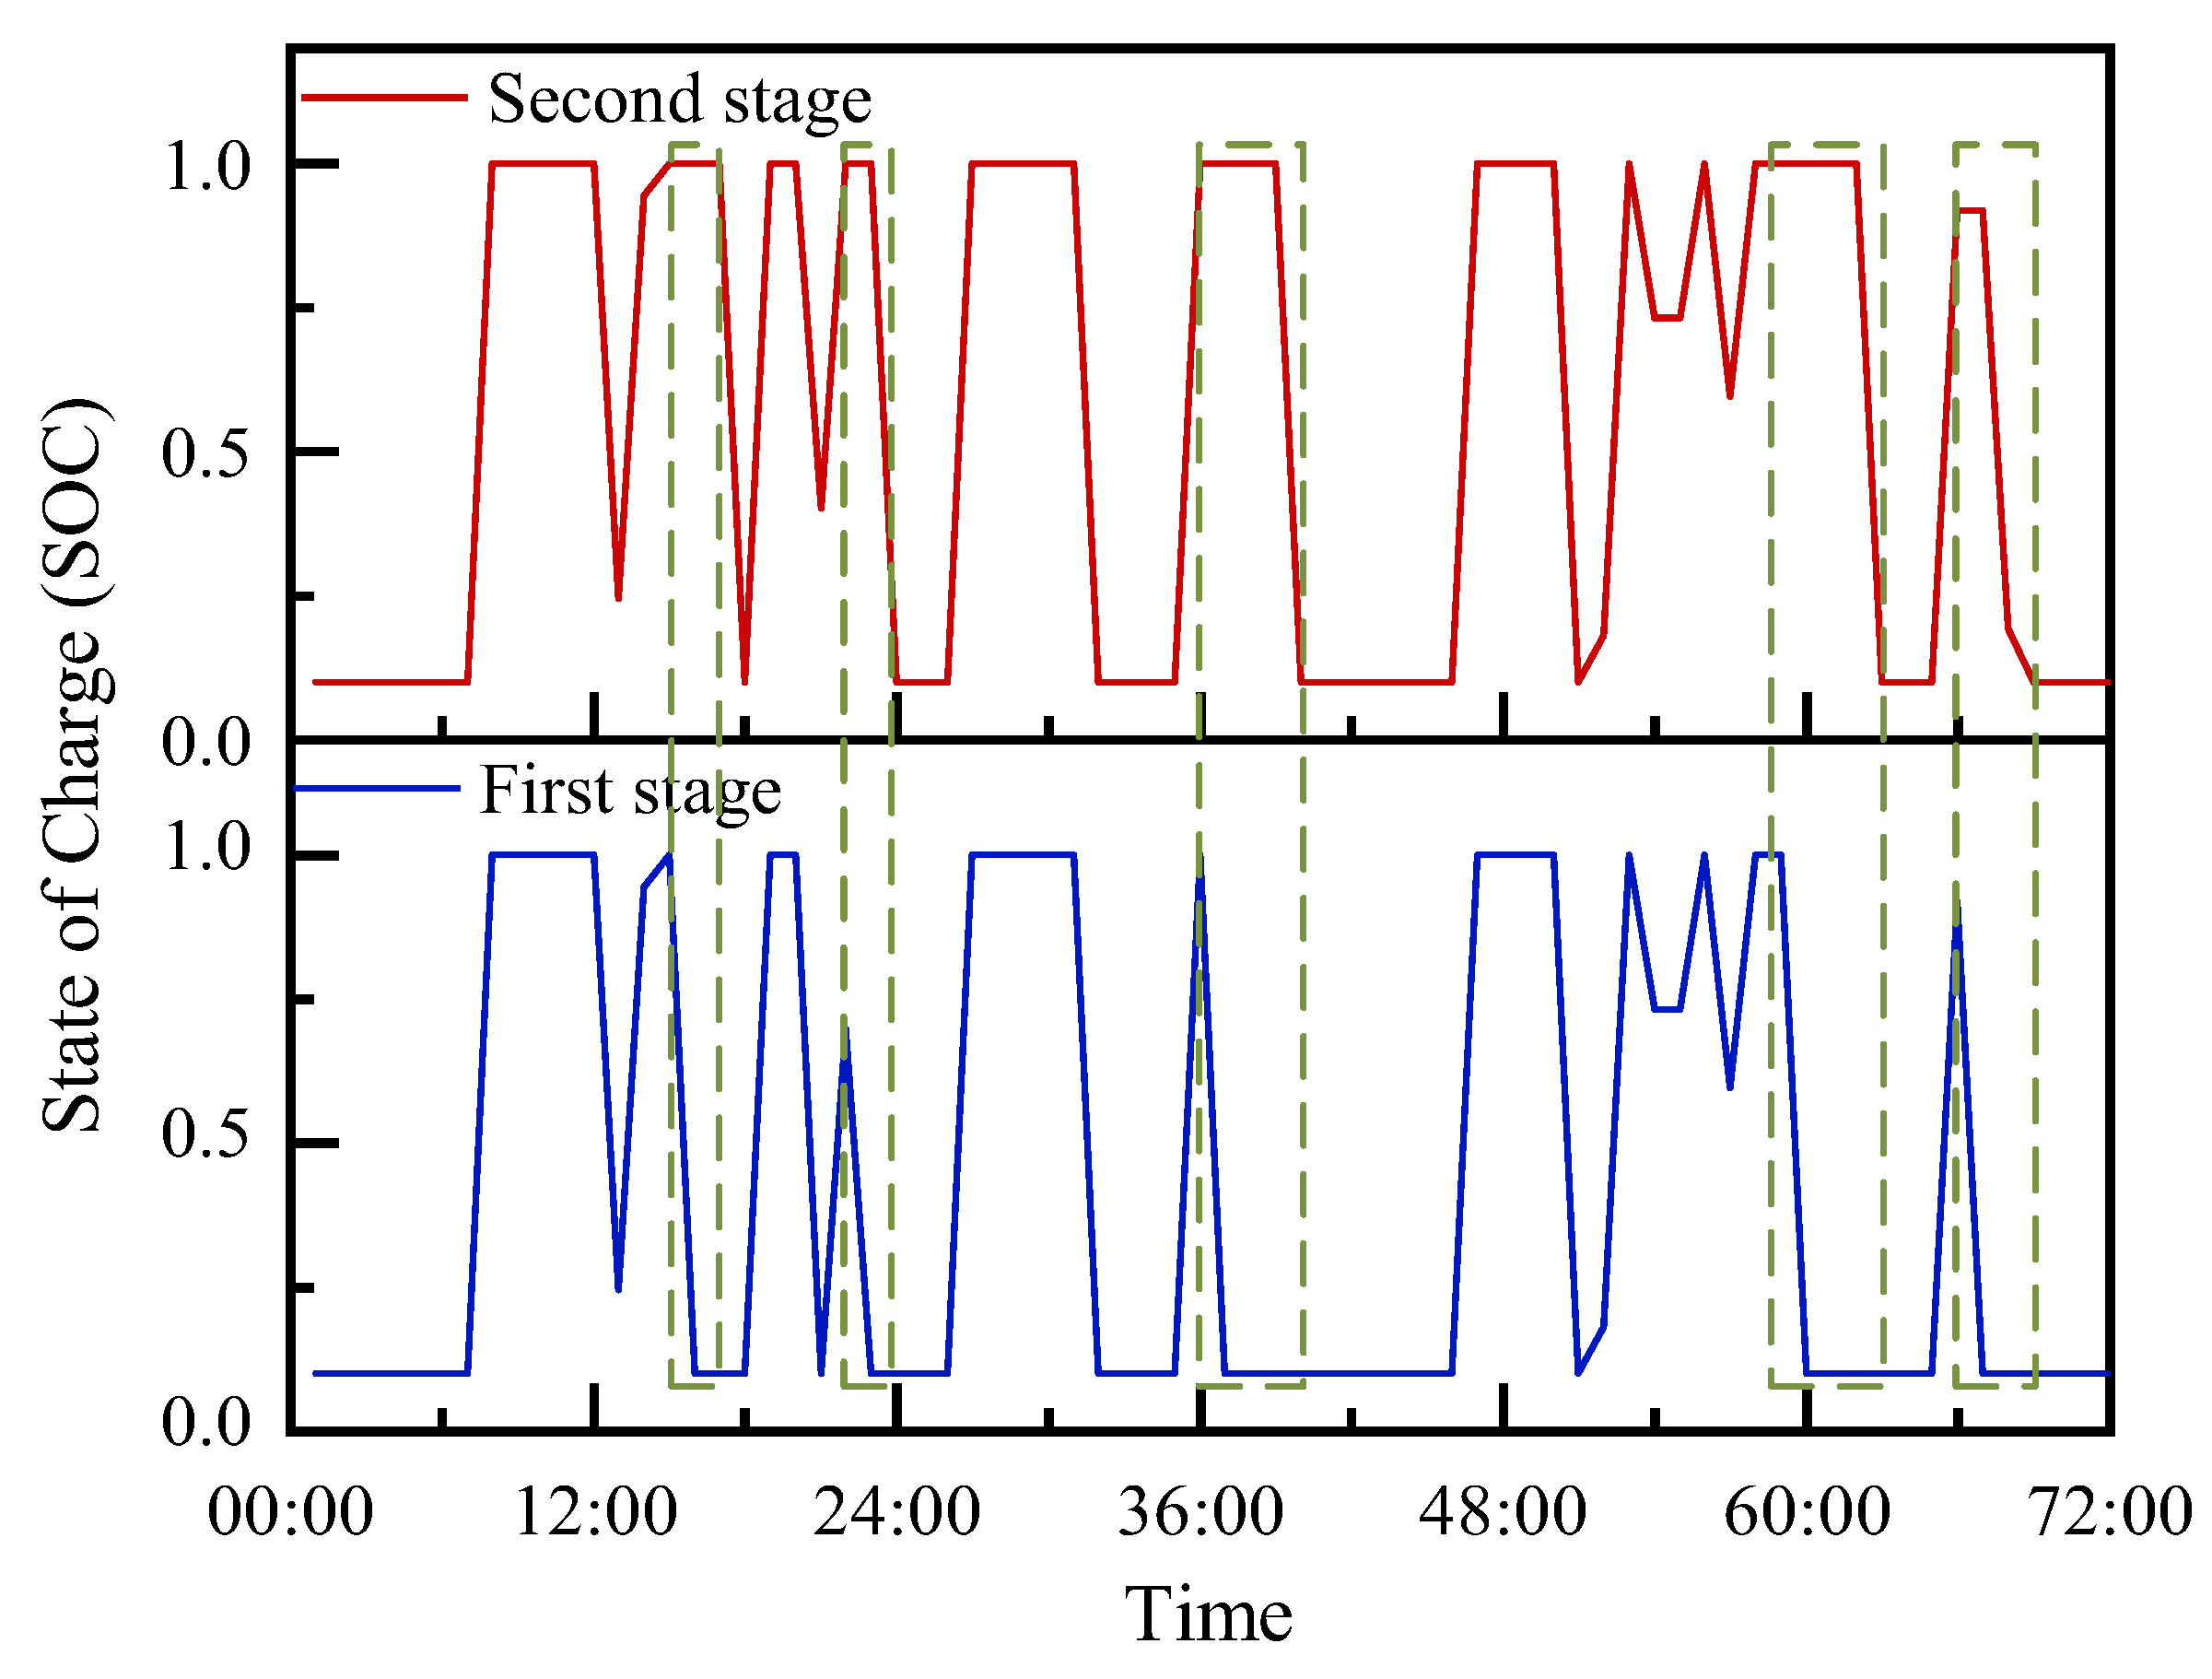
By employing the proposed two-stage operation strategy for energy storage management during the extreme-heat-with-low-wind-speed scenario, the paper presents a comprehensive evaluation of the resulting system performance. Figure 8 illustrates the extent of load reduction experienced by Class III loads (lowest priority), providing insights into the curtailment of non-essential demand under these severe conditions. Meanwhile, Figure 9 depicts the load reduction imposed on Class II loads, revealing the impact on this higher-priority category of consumers. Finally, Figure 10 showcases the temporal evolution of the energy storage system’s charging and discharging behavior, visually representing the strategic deployment of the storage resource to mitigate load shedding and maintain grid reliability during this challenging operational scenario.
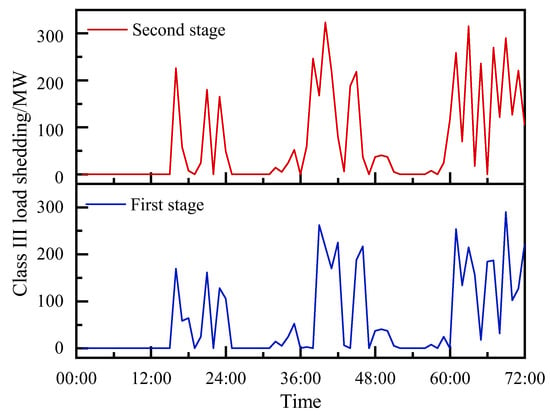
Figure 8.
Load reduction power for Class III loads under two stages.
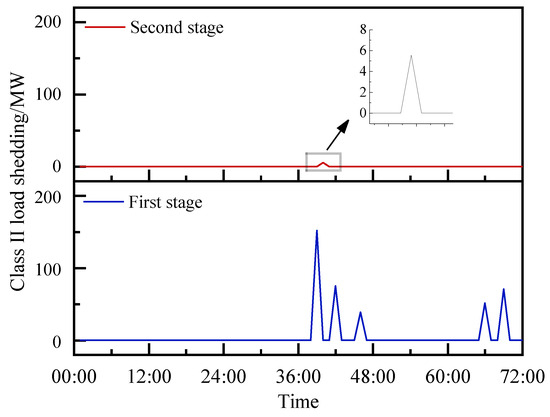
Figure 9.
Load reduction power for Class II loads under two stages.
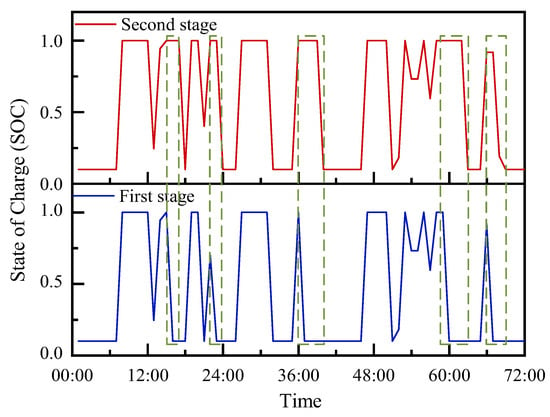
Figure 10.
Energy storage charge state under two stages.
The green boxes in Figure 10 indicate different operational strategies for energy storage. As can be seen from the figures, using the proposed two-stage operation strategy for energy storage in extreme-heat-with-low-wind-speed scenarios of the power system can effectively reduce the management power of Class II loads, and by utilizing the logical energy storage strategy for charging and discharging management and optimizing the load management for the target, it can be seen that the energy storage still does not discharge and performs energy preservation in some moments, especially at noon of the second day and at noon of the third day, when the Class III loads require a large amount of management to meet the power demand of Class II loads. Regarding discharge and energy conservation to meet the power demand of Class II loads, for the proposed method, this only occurred at 16:00 on the second day of the Class II load shedding, while for the conventional method, based on the lack of load and power supply economy, this occurred in a large number of load-cutting cases. Therefore, it can be seen that the proposed method can effectively address the important load preservation of a power system under extreme-heat-with-low-wind-speed scenarios, and provide an effective solution for the operation of a power system with a high proportion of renewable energy under extreme-heat-with-low-wind-speed scenarios.
Based on the information provided in Table 1, where the load reduction quantities are expressed in megawatts (MW), a noteworthy observation can be made. Although the total curtailed load experiences an increase in the second stage of the proposed strategy, the more critical Class II loads undergo a substantial reduction in the extent of load reduction. This favorable outcome can be attributed to the sequential discharge constraints imposed on the energy storage system.

Table 1.
Two classes of load reduction and total loads reduction (unit: MW).
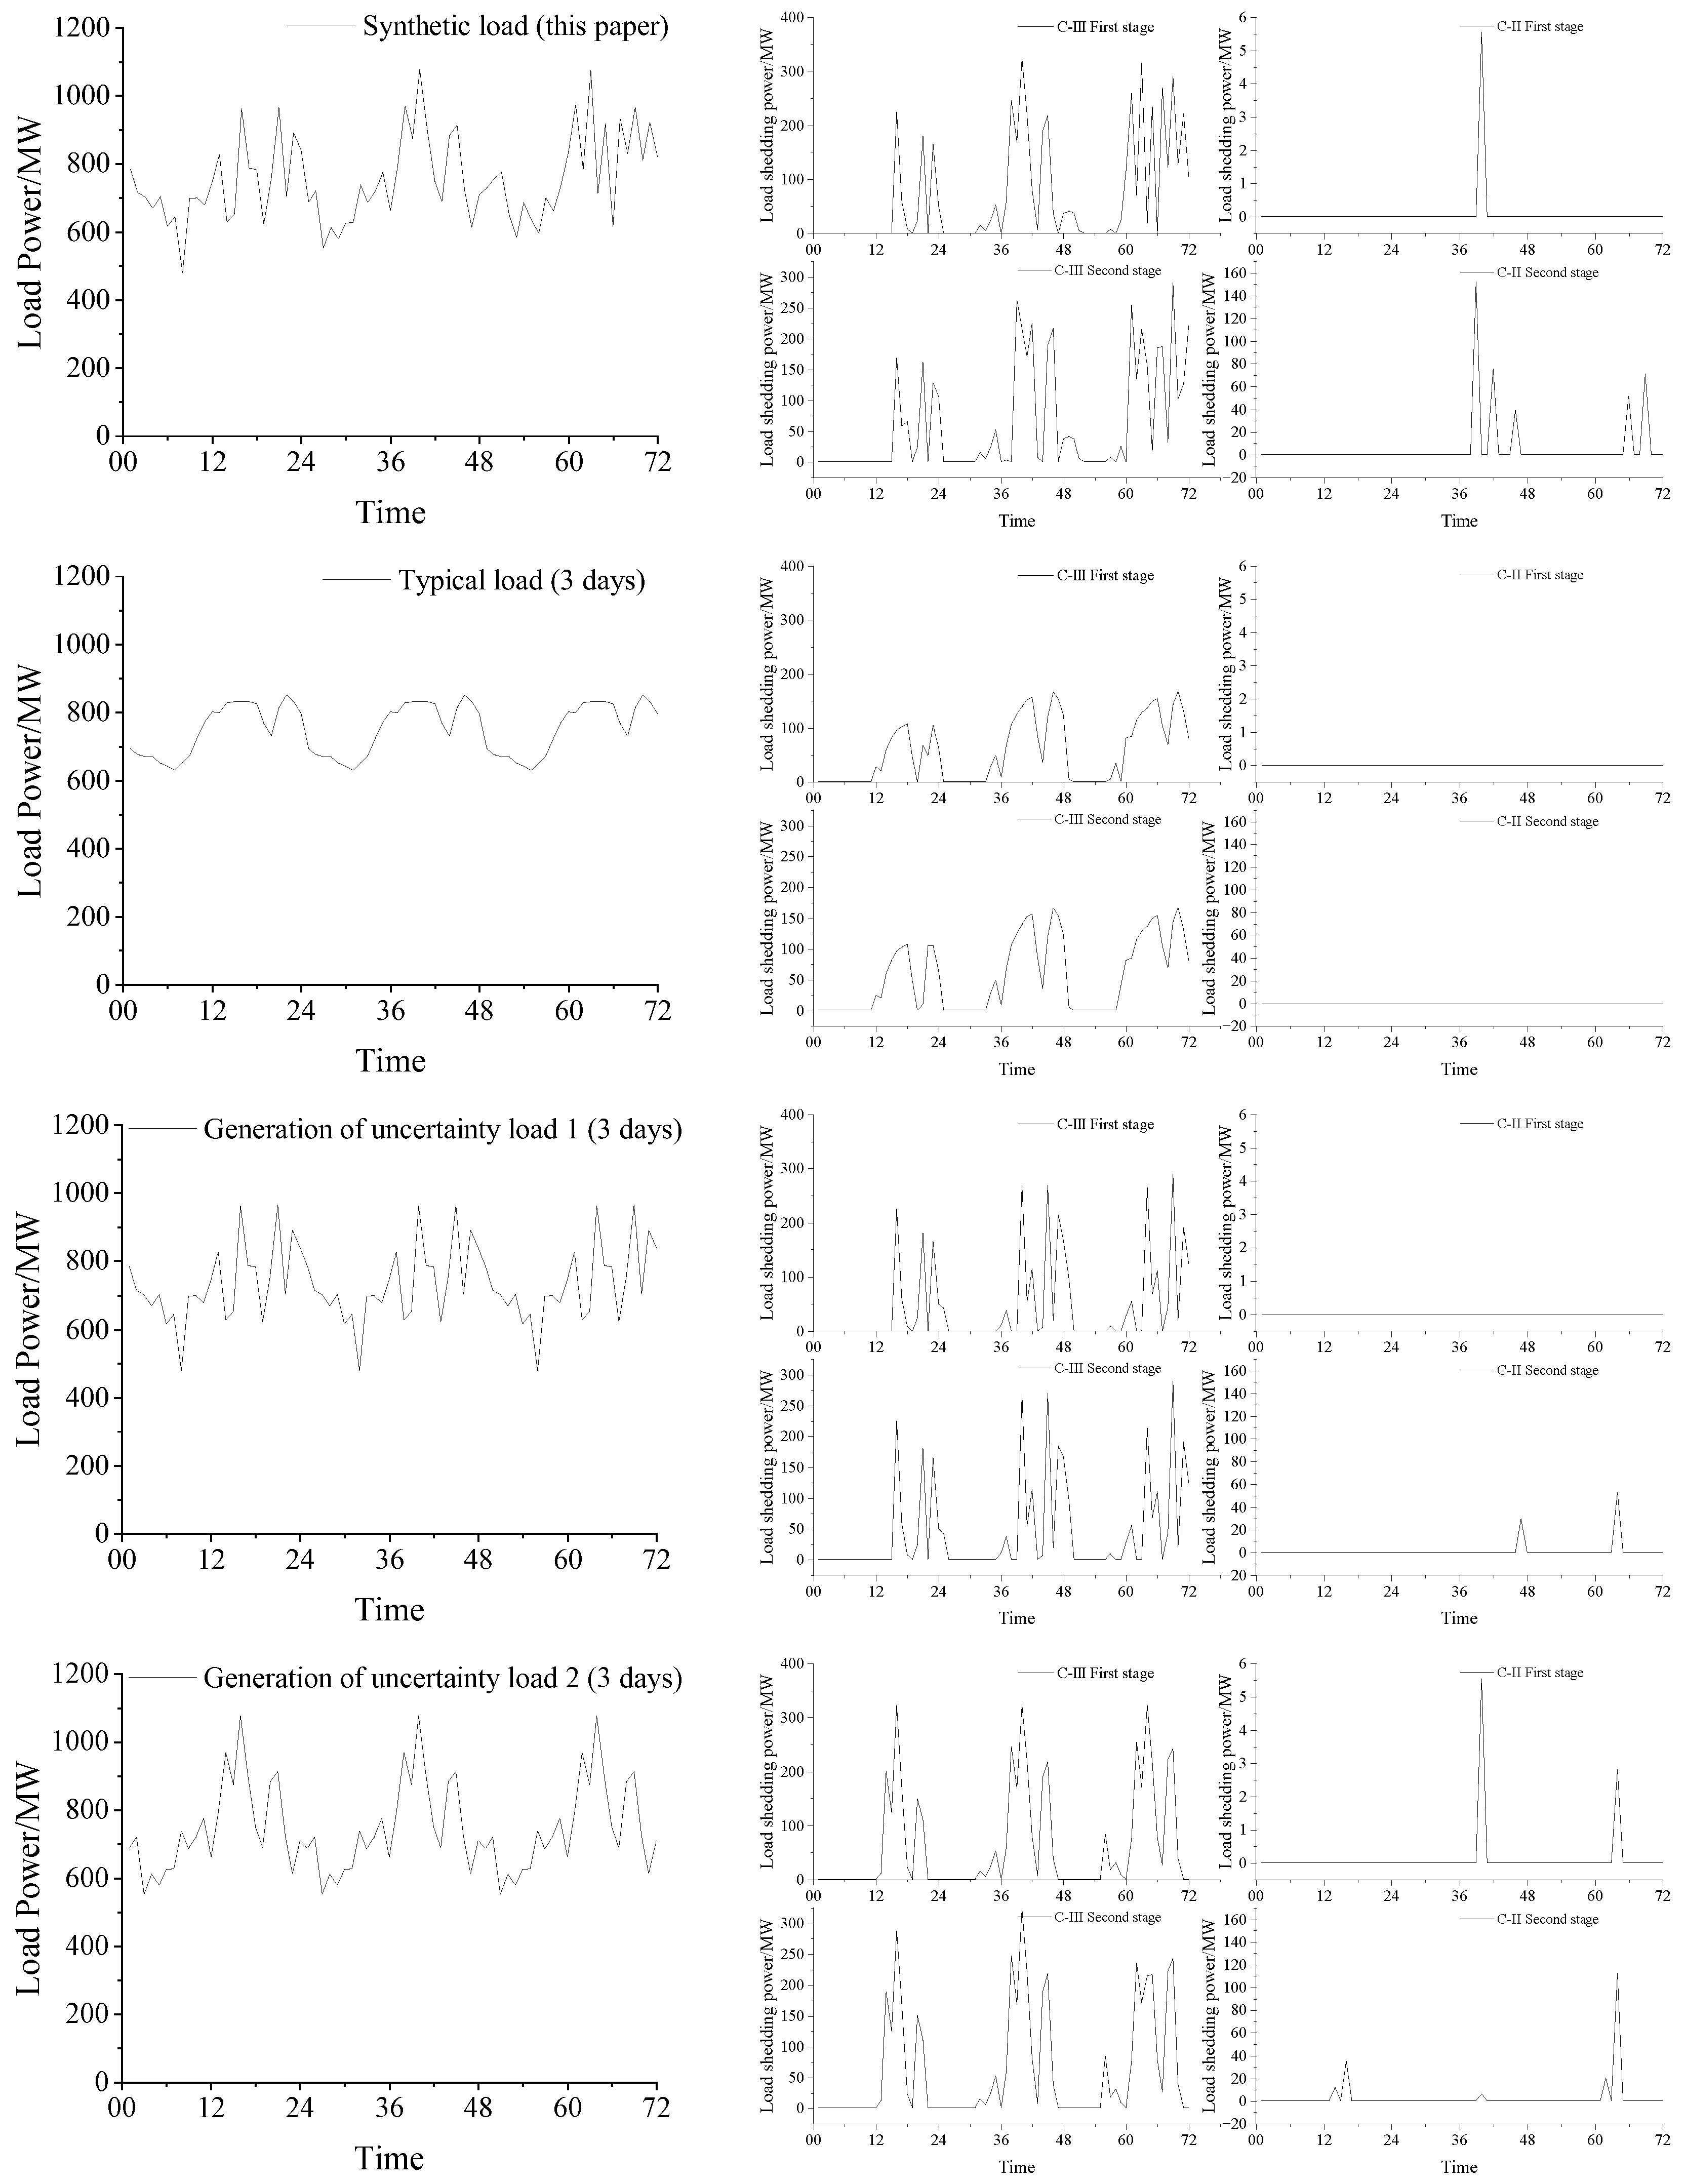
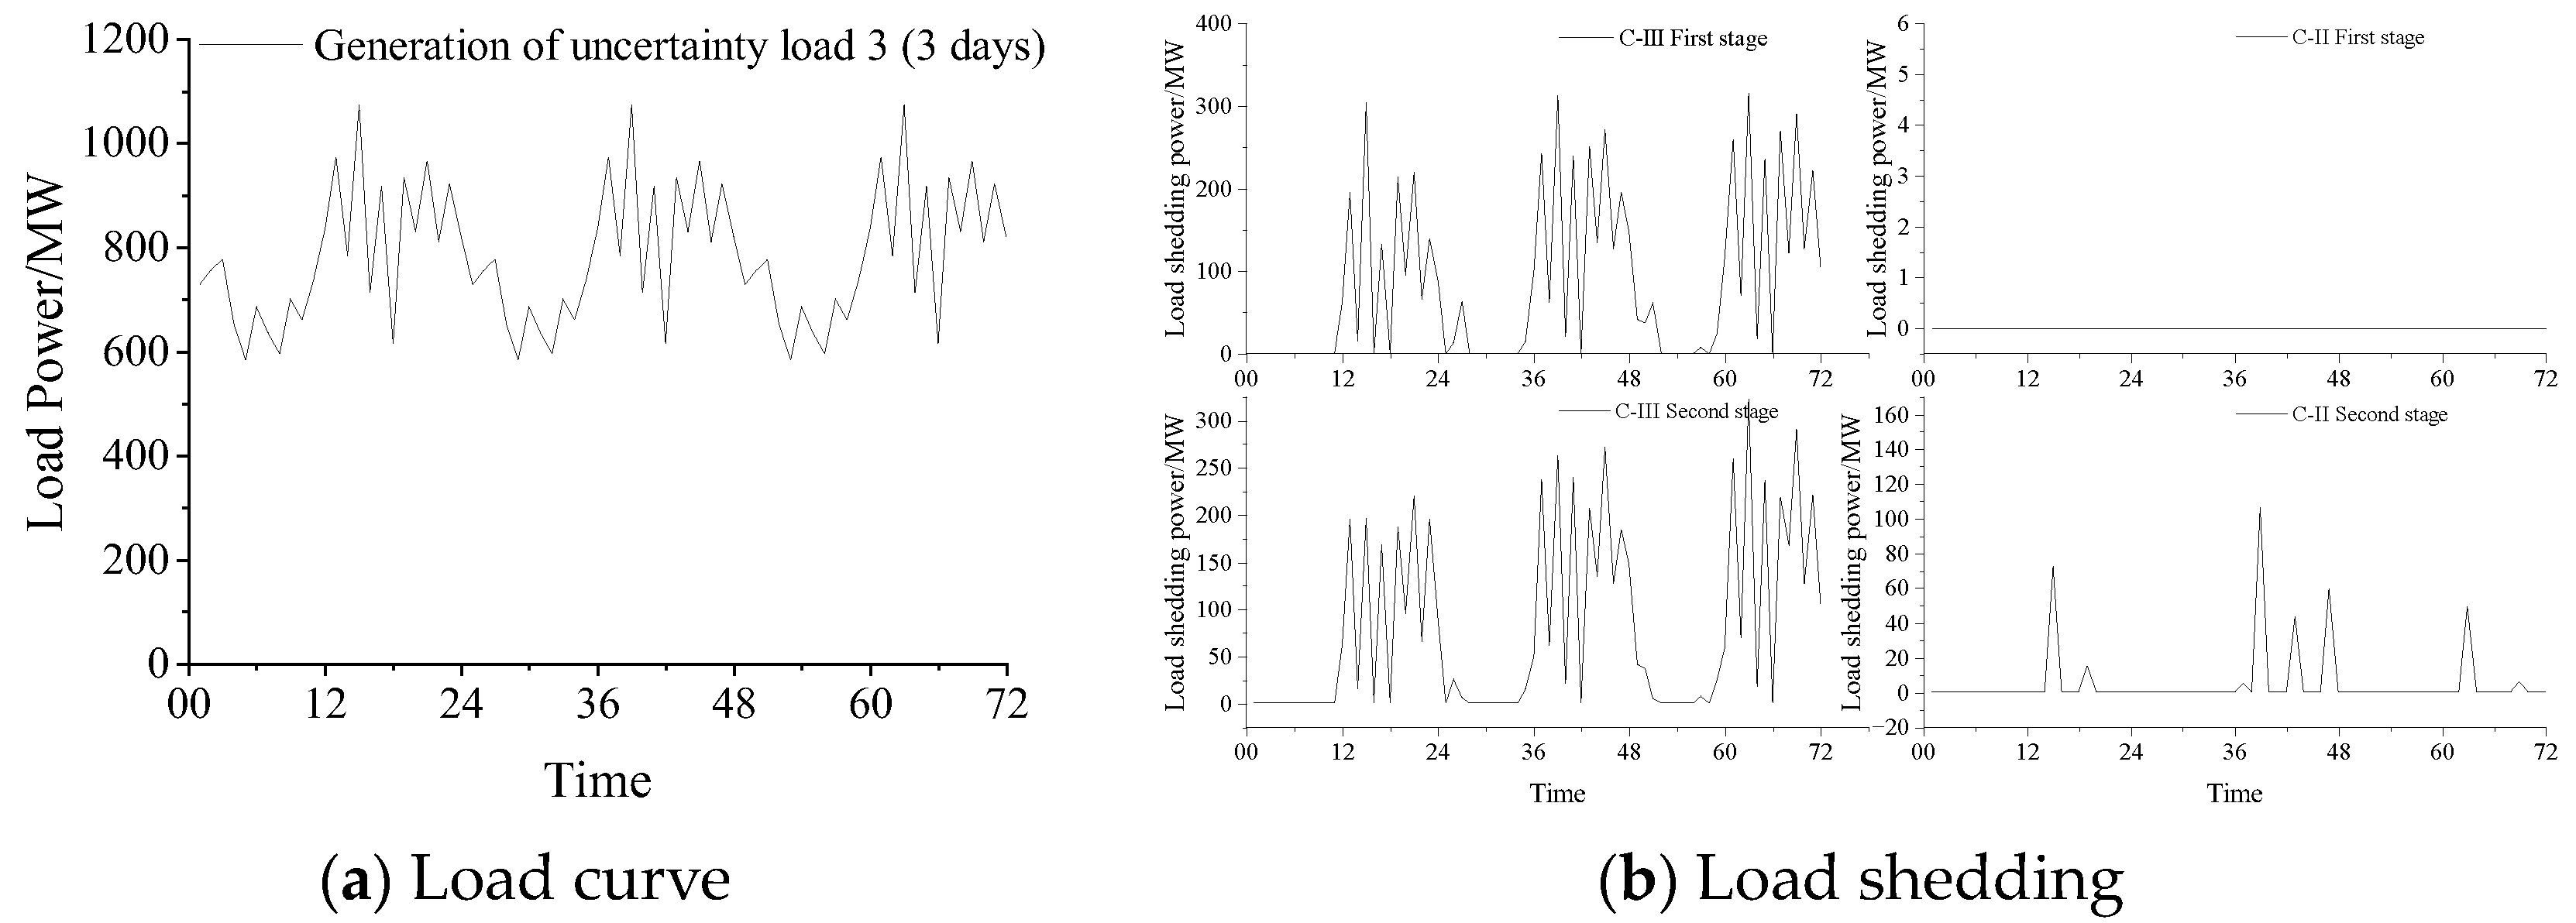
In order to show the feasibility of the method, different 3-day loads are used with the results obtained through the method of this paper, as shown in Figure 11 and Table 2. Where the Figure 11a represent the adopted loads and the Figure 11b represent the output load reduction results. The adopted loads include the typical loads used in Figure 5 with the uncertainty loads. Table 2 demonstrates the load reduction for Class II loads for different load forms. This proves that the method is not limited by means of loads and effectively reduces the reduction of more important loads.
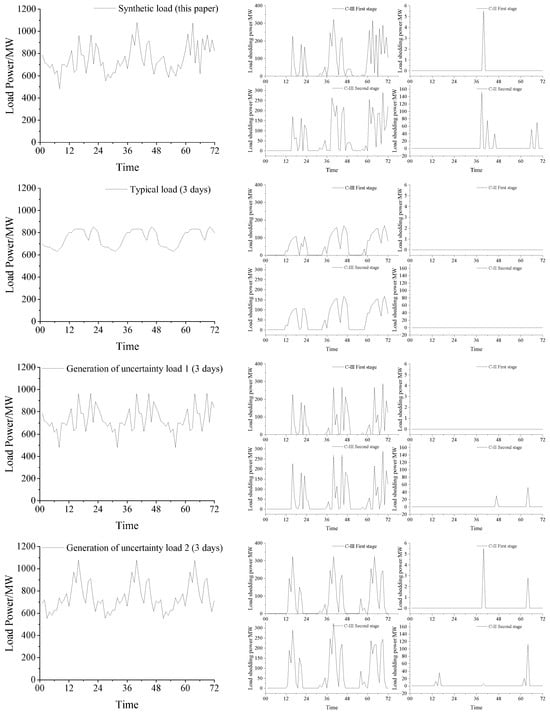
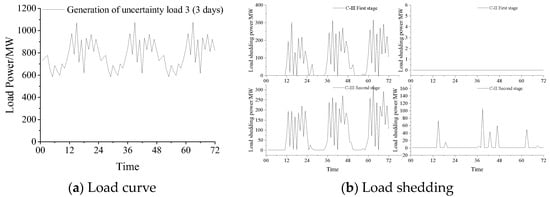
Figure 11.
Five types of load curves and load shedding.

Table 2.
Two classes of load reduction of load curves (unit: MW).
Specifically, the augmented load reduction affecting the lower-priority Class III loads serves to preserve the energy storage’s discharge capability, thereby mitigating the curtailment of the higher-priority Class II loads. This strategic trade-off, facilitated by the staged deployment of storage resources, ensures that the energy storage remains sufficiently charged and capable of supplying the essential Class II loads in the event of an impending shortage. Furthermore, the proposed approach allows for multiple instances of load reduction within the Class III category, leveraging the flexibility to curtail non-essential demand as necessary. This strategic load management approach, coupled with the judicious discharge of energy storage, effectively safeguards the continuity of supply for the critical Class II loads, a paramount objective under the challenging extreme-heat-with-low-wind-speed operational scenario.
5. Conclusions
In conclusion, this paper has presented a novel two-stage operation strategy for energy storage systems within power grids under extreme-heat-with-low-wind-speed scenarios. The proposed approach optimally schedules the charging and discharging of storage assets to ensure a reliable and prioritized power supply for critical loads during these challenging conditions. A comprehensive multi-timescale optimal scheduling model was developed, accounting for the operational constraints of energy storage devices and classifying loads into three distinct categories based on power supply reliability requirements.
A key contribution of this work is the formulation of a two-stage charging/discharging optimization method underpinned by a logical energy storage strategy. This intelligent management of storage resources has been shown through simulations to substantially reduce curtailment of high-priority Class II loads, with only minor instances of load reduction occurring during a few hours of the analyzed period. Significantly, the storage system prioritizes the supply to these essential Class II loads during peak demand intervals, outperforming traditional methodologies.
The proposed strategy effectively mitigates supply–demand imbalances that power systems face under extreme weather events, thereby enhancing the reliability of power delivery to vital loads. As a result, it provides a robust foundation for the economic and reliable operation of power grids with high penetrations of renewable energy sources, which are particularly vulnerable to variability and intermittency during severe meteorological conditions. This innovative approach paves the way for improved grid resilience and a more sustainable energy future.
Author Contributions
Conceptualization, W.L. and S.L.; methodology, Z.L.; validation, Z.L.; formal analysis, X.H.; investigation, R.M.; resources, R.M.; data curation, W.L.; writing—original draft preparation, Z.L.; writing—review and editing, S.L.; visualization, Z.L.; supervision, S.L.; project administration, S.L.; funding acquisition, S.L. and W.L. All authors have read and agreed to the published version of the manuscript.
Funding
This research was funded by the Key Technology Project of China Southern Power Grid Corporation, “Key technologies and applications for coordinated planning of regulating power supply and large scale renewable energy”, grant number 067600KK52222008.
Data Availability Statement
Data are contained within the article.
Acknowledgments
Thanks to “Power Grid Planning & Research Center of Guizhou Power Grid Co., Ltd.” for the data support.
Conflicts of Interest
Authors Wenxia Liu, Rui Ma and Xianggang He were employed by the Power Grid Planning & Research Center, Guizhou Power Grid Co., Ltd. The authors declare that the research was conducted in the absence of any commercial or financial relationships that could be construed as a potential conflict of interest. The funder was not involved in the study design, collection, analysis, interpretation of data, the writing of this article or the decision to submit it for publication.
References
- Mahzarnia, M.; Moghaddam, M.P.; Baboli, P.T.; Siano, P. A Review of the Measures to Enhance Power Systems Resilience. IEEE Syst. J. 2020, 14, 4059–4070. [Google Scholar] [CrossRef]
- Impram, S.; Varbak Nese, S.; Oral, B. Challenges of Renewable Energy Penetration on Power System Flexibility: A Survey. Energy Strategy Rev. 2020, 31, 100539. [Google Scholar] [CrossRef]
- Shair, J.; Li, H.; Hu, J.; Xie, X. Power System Stability Issues, Classifications and Research Prospects in the Context of High-Penetration of Renewables and Power Electronics. Renew. Sustain. Energy Rev. 2021, 145, 111111. [Google Scholar] [CrossRef]
- Zhang, N.; Jiang, H.; Du, E.; Zhuo, Z.; Wang, P.; Wang, Z.; Zhang, Y. An Efficient Power System Planning Model Considering Year-Round Hourly Operation Simulation. IEEE Trans. Power Syst. 2022, 37, 4925–4935. [Google Scholar] [CrossRef]
- Li, Y.; Ni, Z.; Zhao, T.; Yu, M.; Liu, Y.; Wu, L.; Zhao, Y. Coordinated Scheduling for Improving Uncertain Wind Power Adsorption in Electric Vehicles—Wind Integrated Power Systems by Multiobjective Optimization Approach. IEEE Trans. Ind. Appl. 2020, 56, 2238–2250. [Google Scholar] [CrossRef]
- Lopes, J.A.P.; Madureira, A.G.; Matos, M.; Bessa, R.J.; Monteiro, V.; Afonso, J.L.; Santos, S.F.; Catalão, J.P.S.; Antunes, C.H.; Magalhães, P. The Future of Power Systems: Challenges, Trends, and Upcoming Paradigms. WIREs Energy Environ. 2020, 9, e368. [Google Scholar] [CrossRef]
- Pulazza, G.; Zhang, N.; Kang, C.; Nucci, C.A. Transmission Planning With Battery-Based Energy Storage Transportation for Power Systems with High Penetration of Renewable Energy. IEEE Trans. Power Syst. 2021, 36, 4928–4940. [Google Scholar] [CrossRef]
- Li, J.; Chen, S.; Wu, Y.; Wang, Q.; Liu, X.; Qi, L.; Lu, X.; Gao, L. How to Make Better Use of Intermittent and Variable Energy? A Review of Wind and Photovoltaic Power Consumption in China. Renew. Sustain. Energy Rev. 2021, 137, 110626. [Google Scholar] [CrossRef]
- Huang, R.; Wang, X.; Liang, T.; Zhi, J.; Jin, Y.; Qian, J.; Li, H. Research on the Changing Trends in Electricity Prices in Gansu Province Considering High Future Penetration of Sustainable Energy. Sustainability 2024, 16, 3340. [Google Scholar] [CrossRef]
- Zhang, J.; Wang, B.; Ma, H.; Li, Y.; Yang, M.; Wang, H.; Ma, F. A Fast Reliability Evaluation Strategy for Power Systems under High Proportional Renewable Energy—A Hybrid Data-Driven Method. Processes 2024, 12, 608. [Google Scholar] [CrossRef]
- Liu, H.; Lu, R.; Dou, Z.; Zhang, C.; Wang, S. A Distributed Multi-Timescale Dispatch Strategy for a City-Integrated Energy System with Carbon Capture Power Plants. Energies 2024, 17, 1395. [Google Scholar] [CrossRef]
- Kubicek, K.; Cech, M.; Strelec, M. A Robust Distributed Algorithm for Solving the Economic Dispatch Problem with the Penetration of Renewables and Battery Systems. Appl. Sci. 2024, 14, 1991. [Google Scholar] [CrossRef]
- Liu, Z.; Hou, K.; Jia, H.; Zhao, J.; Wang, D.; Mu, Y.; Zhu, L. A Lagrange Multiplier Based State Enumeration Reliability Assessment for Power Systems with Multiple Types of Loads and Renewable Generations. IEEE Trans. Power Syst. 2021, 36, 3260–3270. [Google Scholar] [CrossRef]
- Kamruzzaman, M.; Duan, J.; Shi, D.; Benidris, M. A Deep Reinforcement Learning-Based Multi-Agent Framework to Enhance Power System Resilience Using Shunt Resources. IEEE Trans. Power Syst. 2021, 36, 5525–5536. [Google Scholar] [CrossRef]
- Wang, X.; Liu, R.-P.; Wang, X.; Hou, Y.; Bouffard, F. A Data-Driven Uncertainty Quantification Method for Stochastic Economic Dispatch. IEEE Trans. Power Syst. 2022, 37, 812–815. [Google Scholar] [CrossRef]
- Yang, Y.; Wu, W.; Wang, B.; Li, M. Chance-Constrained Economic Dispatch Considering Curtailment Strategy of Renewable Energy. IEEE Trans. Power Syst. 2021, 36, 5792–5802. [Google Scholar] [CrossRef]
- Son, Y.-G.; Kim, S.-Y.; Bae, I.-S. Optimal Coordination of Energy Coupling System Considering Uncertainty of Renewable Energy Sources. Energies 2024, 17, 931. [Google Scholar] [CrossRef]
- AlSkaif, T.; Dev, S.; Visser, L.; Hossari, M.; van Sark, W. A Systematic Analysis of Meteorological Variables for PV Output Power Estimation. Renew. Energy 2020, 153, 12–22. [Google Scholar] [CrossRef]
- Li, H.; Ren, Z.; Xu, Y.; Li, W.; Hu, B. A Multi-Data Driven Hybrid Learning Method for Weekly Photovoltaic Power Scenario Forecast. IEEE Trans. Sustain. Energy 2022, 13, 91–100. [Google Scholar] [CrossRef]
- Liu, R.-P.; Lei, S.; Peng, C.; Sun, W.; Hou, Y. Data-Based Resilience Enhancement Strategies for Electric-Gas Systems Against Sequential Extreme Weather Events. IEEE Trans. Smart Grid 2020, 11, 5383–5395. [Google Scholar] [CrossRef]
- Panteli, M.; Mancarella, P. Modeling and Evaluating the Resilience of Critical Electrical Power Infrastructure to Extreme Weather Events. IEEE Syst. J. 2017, 11, 1733–1742. [Google Scholar] [CrossRef]
- Liu, H.; Wang, C.; Ju, P.; Li, H. A Sequentially Preventive Model Enhancing Power System Resilience against Extreme-Weather-Triggered Failures. Renew. Sustain. Energy Rev. 2022, 156, 111945. [Google Scholar] [CrossRef]
- Liu, Y.; Bai, J. Daily Variation and Regional Differences in Wind Power Output during Heat and Cold Wave Days in China. Int. Trans. Electr. Energy Syst. 2023, 2023, 8828093. [Google Scholar] [CrossRef]
- Zuo, J.; Pullen, S.; Palmer, J.; Bennetts, H.; Chileshe, N.; Ma, T. Impacts of Heat Waves and Corresponding Measures: A Review. J. Clean. Prod. 2015, 92, 1–12. [Google Scholar] [CrossRef]
- Molina, M.O.; Gutiérrez, C.; Ortega, M.; Sánchez, E. Summer Heatwaves, Wind Production and Electricity Demand in Southern Europe: Climatic Conditions and Impacts. Environ. Res. Commun. 2023, 5, 085005. [Google Scholar] [CrossRef]
- Walsh, J.E.; Ballinger, T.J.; Euskirchen, E.S.; Hanna, E.; Mård, J.; Overland, J.E.; Tangen, H.; Vihma, T. Extreme Weather and Climate Events in Northern Areas: A Review. Earth-Sci. Rev. 2020, 209, 103324. [Google Scholar] [CrossRef]
- Nti, I.K.; Teimeh, M.; Nyarko-Boateng, O.; Adekoya, A.F. Electricity Load Forecasting: A Systematic Review. J. Electr. Syst. Inf. Technol. 2020, 7, 13. [Google Scholar] [CrossRef]
- National Development and Reform Commission of the People’s Republic of China. Typical Electricity Load Curves for Provincial Grids. Available online: https://www.gov.cn/zhengce/zhengceku/2020-12/03/5566580/files/eaaa93782e514543861bdcd434e86666.pdf (accessed on 20 April 2024).
- Sharma, K.C.; Jain, P.; Bhakar, R. Wind Power Scenario Generation and Reduction in Stochastic Programming Framework. Electr. Power Compon. Syst. 2013, 41, 271–285. [Google Scholar] [CrossRef]
Disclaimer/Publisher’s Note: The statements, opinions and data contained in all publications are solely those of the individual author(s) and contributor(s) and not of MDPI and/or the editor(s). MDPI and/or the editor(s) disclaim responsibility for any injury to people or property resulting from any ideas, methods, instructions or products referred to in the content. |
© 2024 by the authors. Licensee MDPI, Basel, Switzerland. This article is an open access article distributed under the terms and conditions of the Creative Commons Attribution (CC BY) license (https://creativecommons.org/licenses/by/4.0/).

