Abstract
In this paper, we investigate the nonlinear characteristics of the flow in a two-dimensional and a three-dimensional counterflow model with symmetrical structures. Through numerical simulations, we obtain the velocity fields of the fluid flow in these models for different Re. The numerical results are analyzed to understand the nonlinear characteristics and differences between the two-dimensional and three-dimensional models. The findings indicate that, when Re varies, both the two-dimensional and three-dimensional models exhibit solution bifurcations and nonlinear phenomena such as symmetry breaking, self-sustained oscillations, and chaos. As Re increases, the two-dimensional counterflow model displays a unique solution, an asymmetric solution, and an oscillating solution. Specifically, when Re < 4320, both the laminar and turbulent models show a unique, symmetric, and steady-state velocity distribution. For 4652 < Re < 8639, the two-dimensional model solutions are not unique, presenting a pair of antisymmetric, asymmetric solutions that nevertheless remain steady-state. When Re > 8639, the solution becomes oscillatory and unsteady. The three-dimensional counterflow model exhibits a two-dimensional solution independent of the Z-axis. At Re = 4652, both the three-dimensional and two-dimensional models produce the same unique, symmetric, and steady-state velocity distribution with no three-dimensional flow (W = 0). At Re = 8639, the three-dimensional model solutions are not unique, showing a pair of antisymmetric, asymmetric solutions, while still being steady and time-independent. At Re = 87,627, the three-dimensional model solution becomes oscillatory and unsteady. By elucidating the flow characteristics and nonlinear features of both models, this study compares the differences between the two-dimensional and three-dimensional flows, thereby laying the groundwork for simplification of the problem and further theoretical research.
1. Introduction
Due to the inherent inefficiencies, high carbon emissions, and significant pollutant outputs associated with conventional coal-fired power generation, there is an urgent necessity to develop advanced clean coal combustion technologies to meet the increasing demand for electricity. One promising approach is the development of ultra-supercritical units characterized by large capacity, high operational parameters, and reduced pollutant emissions [1,2]. However, the air supply conditions in these large-capacity units often degrade, resulting in deflected burner outlet airflow that scours the furnace walls. Consequently, the initially centralized and intense combustion process becomes dispersed and weak, occurring closer to the furnace walls [3].
In this study, we investigate the airflow characteristics within a symmetrically structured furnace as the engineering context. By examining the flow characteristics and nonlinear dynamics of two-dimensional (2D) and three-dimensional (3D) models using hydrodynamic simulation tools, we aim to gain an in-depth understanding of the airflow behavior within the boiler furnace. This comparison between 2D and 3D models is crucial for simplifying the problem, while facilitating thorough theoretical research, optimizing the velocity and temperature fields, and mitigating the thermal deviations at the furnace outlet [4,5,6,7,8].
This paper focuses on the nonlinear phenomena in symmetric-structured hedging flows, highlighting the differences in the flow dynamics and nonlinear characteristics between 2D and 3D models. Practical engineering problems are inherently three-dimensional. However, for theoretical analysis, problems are often abstracted into two dimensions to simplify the analysis without a significant loss of accuracy. Nevertheless, for nonlinear dynamic systems involving fluid flow, when nonlinear phenomena emerge, the physical flow laws represented by 2D models may become inaccurate and require reconsideration under a 3D framework. For instance, in the study of flow and mass transfer, scholars frequently elucidate the governing principles by drawing analogies with the convective heat transfer process [9,10,11]. Considerable attention has been directed towards investigating nonlinear phenomena in convective heat transfer, including issues such as asymmetric flow and heat transfer in symmetrical sudden expansion channels. However, research focusing on the nonlinear aspects of flow and mass transfer remains relatively limited [12,13]. In studies of the flow within expansion and contraction channels, once the flow’s characteristic parameters exceed certain critical values, nonlinear phenomena such as symmetry breaking, self-sustained oscillations, bifurcations, and chaos can occur [14]. These phenomena necessitate a 3D representation, because 2D models fail to capture the complete dynamics. A similar situation was observed in Ref. [15], which examined the nonlinear properties of 2D and 3D natural convective heat transfer. As the Rayleigh number (Ra) increased in concentric circular tube convection, the system exhibited steady-state symmetric solutions, asymmetric periodic solutions, and quasi-periodic solutions. After multiple bifurcations, the oscillatory flow eventually transitioned into chaotic flow.
Li [16] and Duan [17] optimized the flue gas skew in the furnace by adjusting the air distribution and setting the Reynolds number (Re) of the secondary air outlet to specific parameters, thereby mitigating the flue gas temperature deviation. Shao [18] employed numerical methods to analyze the combustion characteristics of coal-fired boilers, investigating the impact of various burner outlet Re numbers and air distribution conditions on the flue gas temperature field, velocity field, component field, NOx emissions, and carbon content within the furnace. Zhao [19] introduced a reverse stable combustion technology for pulverized coal jets in a four-corner rounded pulverized coal furnace. This technique reduces the flue gas deflection towards the furnace wall by optimizing the Re number of the primary pulverized coal jet, refining the gas jet ignition conditions and prolonging the residence time of the primary pulverized coal jet during the initial ignition phase. Wu [20] discovered that increasing the Re number of the Separated Overfire Air (SOFA) outlet effectively disrupts the residual rotation of the downstream gas flow in the furnace burner area, significantly reducing the flue gas velocity at the furnace outlet. Zhou [21] calculated the flue gas flow field and residual rotation at the furnace outlet under four different secondary air reverse chamfering angles by setting four working conditions, analyzing the causes of the excessive temperature deviation at the flue gas outlet under these conditions. Additionally, other researchers [22,23,24] have found that modifying the Re number of the furnace outlet airflow by enhancing the vertical air classification and adjusting the burner combination can also alleviate the outlet thermal deviation to a certain extent.
Wang Hui [25] abstracted a two-dimensional furnace flow model with a symmetrical structure based on a tower pulverized coal boiler. The study found that as the Re number of the burner outlet increased, the flow exhibited a symmetrical flow field, an asymmetrical flow field, and a time-oscillating flow field at certain critical Re values, indicating the presence of static and dynamic bifurcations in the two-dimensional symmetric flow system. Shen [26] noted that due to the nonlinear nature of the flow and heat transfer within the boiler furnace, an asymmetric solution can occur. Even if the furnace geometry and boundary conditions are perfectly symmetrical during the simulation, the fluid velocity and temperature distribution within the furnace can still be asymmetric, resulting in thermal deviation on the flue gas side at the furnace outlet.
The authors note that the geometry of the 2D and 3D physical models considered in Refs. [9,10,11,12,13,14,15,16,17,18,19,20,21,22,23,24,25,26] exhibits some degree of symmetry. However, the numerical results of the flow field, characterized by the Reynolds number (Re) of the airflow in the models, display asymmetrical patterns within certain parameter ranges. Furthermore, despite all boundary conditions being time-independent, when the characteristic parameter Re exceeds a critical value (Rec), the numerical results show oscillatory behavior, varying with time. Therefore, this paper posits that this is a manifestation of nonlinear flow phenomena, indicating bifurcation in the numerical solutions. This study investigates the nonlinear phenomena in symmetrical structural fluid flow models, focusing on the influence of geometry and characteristic parameters on flow and nonlinear characteristics.
From an engineering perspective, numerous scholars have discussed the nonlinear flow phenomena in various geometries and the bifurcation of their solutions. In the foundational study examining the effects of various parameters—such as the Rayleigh number (Ra), buoyancy ratio (Nc), Lewis number (Le), and aspect ratio—on both steady-state and transient nonlinear phenomena in double-diffusive convection, Zhao [27] analyzed the impact of the buoyancy ratio (Nc) and Rayleigh number (Ra) on multiple steady-state flow regimes in binary mixtures within a square cavity. The results demonstrate that at Ra = 2 × 10⁴, both single-cell and multi-cell flow states are simultaneously present in the square cavity. Xin [28], using the critical Reynolds number flow field as an initial condition, identified the occurrence of saddle-node bifurcation and drift bifurcation. Mamou [29] asserted that double-diffusive convection in a square cavity is highly sensitive to initial conditions.
Domestic scholars have also conducted extensive research on the nonlinear and linear characteristics of flow, as well as heat and mass transfer. In a smoke visualization experiment conducted by Wu [30] at Tsinghua University, two non-pairwise flow fields were observed in a symmetric structure flow field, with one skewing left and the other right, corresponding to two solutions of the flow equation. This experiment demonstrates that the flow solutions in symmetric structures are not necessarily symmetrical and that there are at least three solutions in the flow model: two asymmetric solutions and one symmetric solution. Multiple solutions are precisely one of the defining features of nonlinear systems. Chen [31] investigated the nonlinear and linear characteristics of fluid flow, as well as heat and mass transfer, in a square cavity subjected to horizontal temperature and concentration gradients. The study revealed that at Ra = 700 the fluid exhibited a typical static bifurcation, resulting in the formation of two distinct asymmetric diagonal flows. Furthermore, when Ra was increased to 2 × 10⁵, convective oscillations were observed.
I. Constenla [32] observed that the actual tangent circles in furnaces deviated from the ideal tangent positions. Despite identical boundary conditions in the four corners, a symmetric solution could not be achieved. Shapira [33] and linear stability analysis indicated that symmetry breaking results from the pitchfork bifurcation of the supercritical tuning fork as a solution to the Navier–Stokes equation, leading to the coexistence of two stable solutions under the critical Re described above.
Bhadauria and Kiran [34] examined the oscillation modes of double diffusion in a square cavity. Building on the work of Bergeon [35], Chen [36] analyzed the oscillatory solutions of double-diffusive fluid in an inclined square cavity when Nc = −1.0. Additionally, Sanghi [37] investigated the oscillatory behavior of double-diffusive convection in a square cavity at low Prandtl numbers.
In addressing the issue of flow and heat transfer within a sudden expansion channel, the symmetrical nature of the physical structure and boundary conditions typically leads to the assumption that the solutions are also symmetrical. Therefore, theoretical studies frequently examine only half of the symmetrical model of the sudden expansion channel. In his book “Numerical Heat Transfer”, academic Tao Wenquan [38] adopts this approach, performing numerical calculations on half of the area to derive solutions. Within the examined parameter range, the flow and heat transfer remain symmetrical. However, as the research parameters vary, the flow and heat transfer in this symmetrical channel exhibit nonlinear characteristics, resulting in both symmetric and asymmetric solutions.
In engineering applications, extensive experimental [39,40,41] and numerical [42,43,44,45,46,47] studies have shown that the flow in a symmetric sudden expansion channel reaches a critical Reynolds number (Rec) at which asymmetry emerges. Below Rec, the fluid exhibits a symmetric steady-state flow. When the Reynolds number surpasses Rec, the flow becomes asymmetric, and the length of the fluid recirculation zone increases with the Reynolds number. Montazer [48] conducted a comprehensive review of the flow patterns of both turbulent and laminar flows in symmetrical sudden expansion channels. Saha [49] reviewed the fluid flow and heat transfer phenomena in sudden expansion channels, considering various expansion ratios and Reynolds numbers (Re). They also provided the critical Reynolds number (Rec) values for both static and dynamic bifurcations of the system. Li [50] investigated the three-dimensional flow and heat transfer in circular and semicircular convection chambers. The simulation results revealed that when Re is below the critical Rec for the respective convection cavity, the flow and concentration distributions are unique and symmetrical. When Re exceeds Rec, the flow and concentration distributions become asymmetrical, resulting in steady-state symmetric and asymmetric solutions. Different streamlines for the onset and evolution of static bifurcation were tracked to explain the bifurcation phenomenon and double asymmetric solution phenomena in double diffusion convection in Ref. [50]. Ying [51] used a nonlinear dynamic method to explain the asymmetric flow and heat transfer phenomena in the paraffin wax melting process. The numerical results showed critical Ra numbers in the paraffin wax melting process. When Ra is within different critical ranges, the flow and heat transfer states transition from steady to unsteady, eventually oscillating vigorously with an irregular and chaotic phase portrait. In the author’s previous research [52], a nonlinear phenomenon was observed in the flow and heat transfer process within the furnace chamber of a four-corner tangent circle boiler with perfectly symmetrical geometry and boundary conditions. A specific strategy to control the initial flow field can achieve a stable flow tangent circle. This paper extends the previous work to further study the multiple solutions and bifurcation phenomena in the boiler furnace flow process.
The nonlinear characteristics of the dynamical system have been extensively analyzed, yet the complete transition path of the hedging flow process from stable to periodic oscillation and finally chaotic behavior in the two-dimensional symmetric model has not been thoroughly examined. The existing literature, such as references [14,25,50,51,52], often employs two-dimensional models to study nonlinear problems in the fluid flow and heat transfer processes. These studies effectively analyze the nonlinear phenomena in fluid dynamics and heat conduction through simplified two-dimensional models, providing valuable theoretical and experimental data support. However, some scholars have utilized three-dimensional models to investigate nonlinear issues in the fluid flow and heat transfer processes. These more complex three-dimensional models can simulate the nonlinear behavior of actual physical processes with greater accuracy and yield more detailed results. Nonetheless, few scholars have combined two-dimensional and three-dimensional models for analysis. Integrating two-dimensional and three-dimensional modeling approaches can maintain computational simplicity while ensuring model accuracy and broad applicability. This combined method not only allows for a more comprehensive understanding of nonlinear phenomena in the fluid flow and heat transfer processes but also provides more reliable guidance for practical engineering applications. Therefore, future research should endeavor to integrate two-dimensional and three-dimensional models to achieve more comprehensive advancements in the study of nonlinear problems. This paper establishes two-dimensional and three-dimensional models of hedging flow with a symmetrical structure, discussing the flow laws and nonlinear characteristics through numerical calculations. The numerical results of the 2D and 3D models are compared, highlighting the differences, thereby laying a foundation for more in-depth theoretical and experimental research.
2. Physical Model and Numerical Methods
2.1. Two-Dimensional Physical Model
In this paper, a two-dimensional counterflow model with complete symmetry along the vertical centerline is abstractly simplified based on a tower furnace with a burner opposing arrangement, as shown in Figure 1. Because the focus of this paper is on the nonlinear characteristics of the fluid flow, the model is simplified to consider only an arrangement with a pair of opposing burners, despite the actual boiler having multiple layers of burners. This study is limited to the cold state and a single phase, assuming uniform air intake for each burner (with no distinction between primary air and secondary air) and temporarily excluding the air intake of the SOFA air burner of the actual boiler.
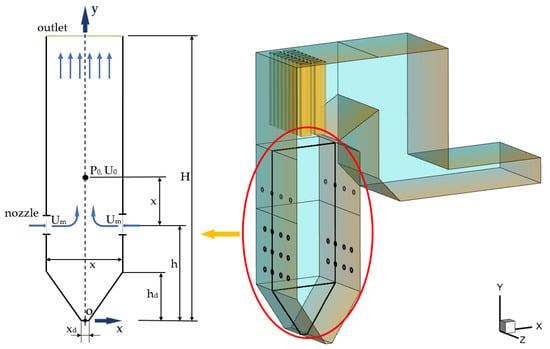
Figure 1.
Schematic diagram of a two-dimensional counterflow model.
The calculation areas of the flow model are divided into the cold ash hopper area, the main combustion area, and the upper flow area from upstream to downstream according to the flow direction. The entire model is perfectly symmetrical with respect to the vertical centerline. The intersection point between the vertical centerline of the model and the bottom edge of the cold ash hopper is taken as the coordinate origin, O. The Cartesian coordinate system is established with point O as the coordinate origin, and the flow direction is the positive direction of the y-axis. The height of the model is H, and the width to the left and right is x. The left and right burner nozzles are at the same height, both at h. The height of the corner of the cold ash hopper is Hd, and the width of the bottom edge of the cold ash hopper is xd. The point from the nozzle height directly above x is denoted as P0. The velocity U0 at point P0 is taken as the reference velocity for the dimensionless velocity. The dimensionless instantaneous velocity U in the x direction at P0 is used as a representative quantity for analyzing the nonlinear characteristics.
2.2. Two-Dimensional Numerical Methods
The two-dimensional (2D) counterflow simulation employs both a 2D unsteady laminar flow model and a turbulence model to simulate the flow within the model. The general governing equations for the laminar flow models are as follows:
where is a universal variable that can be expressed as velocity components u and v; is the generalized diffusion coefficient; and is the source term.
The general governing equations for the turbulence model are as follows:
where represents the time-averaged universal variable, which can be expressed as the time-averaged velocities and .
In this article, the following dimensionless quantities are defined:
where u and v are the velocity components in the horizontal x and vertical y directions, respectively; U0 is the velocity at point 0; P is the pressure; and ν and ρ are the kinematic viscosity and density, respectively.
The dimensionless Eigen quantity Re (the Reynolds number) is defined as follows:
It is assumed that the bottom surface of the cold ash hopper is modeled as a solid wall. All solid walls are considered to adhere to a no-slip condition. The outlet is characterized by a local unidirectional boundary condition, and the burner nozzle ensures a uniform air intake. The SIMPLE algorithm is used to handle the coupling of pressure and velocity, and the QUICK differential scheme is employed. For the turbulence calculations, the Realizable k-ε model and Enhanced Wall Treatment are used. All computing tasks in this article are completed by the Fluent 19.2commercial computing software.
The above calculation model and numerical simulation method are explained as follows:
Laminar Flow and Turbulent Flow: It is generally believed that the actual boiler operating conditions are usually turbulent. However, this paper aims to explore the mechanism of asymmetrical flow in the symmetrical structure of the furnace, which may lead to thermal deviation. Therefore, this study includes both laminar and turbulent flow conditions.
Model Application at Specific Reynolds Numbers: For example, at Re = 4652, both laminar flow and turbulence models are used to perform the calculations. At Re = 4652, the laminar flow model’s calculation results already show oscillations and asymmetric flow fields, indicating dynamic and static bifurcations. The laminar flow model is used to calculate the instantaneous value of the velocity field. In addition to the instantaneous value, engineering is also concerned with the average value. The turbulence model solves for the time mean, representing the average characteristic to some extent.
Nonlinear Characteristics of the Turbulence Model: When using the Reynolds time-averaged equation, the variable in the governing equation represents the time mean. Although the Reynolds time averaging is performed, in addition to the additional Reynolds stress term in the source term, the basic form of the time-averaged equation remains the same as the original equation. Thus, the laminar flow and turbulence models can be described by the same general equation, which is still a nonlinear equation. Therefore, the solution of the time mean still exhibits nonlinear phenomena such as oscillation and bifurcation. However, the nonlinear properties exhibited are time-averaged and related to the turbulence model used, and they do not represent the nonlinear characteristics of the actual instantaneous velocity (even if the mathematical model can accurately reflect the characteristics of the real physical model). Strictly speaking, the nonlinear properties derived from the averaging equation during the analysis are properties of this mathematical model. Nevertheless, the author believes that a large number of experiments have proven that the time mean obtained by the time-averaging equation is generally consistent with the average value in practical engineering, so the nonlinear properties of the time mean obtained by the time-averaging equation basically reflect the average properties of the variables in the actual physical model.
2.3. Three-Dimensional Physical Model
Figure 2 is a schematic diagram of the 3D counterflow model. The 3D model presented here is identical to the 2D model, except for the addition of a dimension perpendicular to the plane of the paper, represented by the Z-axis. The other geometric and physical quantities remain the same as those in the 2D model. Essentially, the 2D model can be considered a cross-section of the 3D model. Symmetrical boundary conditions are applied to the two boundaries in the Z direction, with the origin of the Z-axis located on the central symmetry plane.
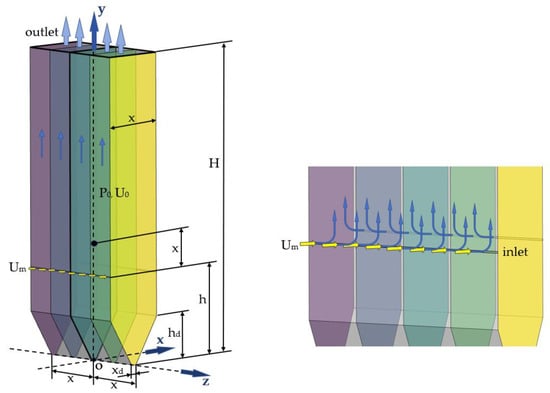
Figure 2.
Schematic diagram of a three-dimensional counterflow model.
2.4. Three-Dimensional Mathematical Model
The three-dimensional unsteady laminar flow model and the turbulence model were used to numerically simulate the flow in the three-dimensional counterflow simulation. The general governing equation is of the same form as the two-dimensional governing equation, except that the universal variables ϕ can be expressed as the velocities u, v, and w and the time-averaged universal variable can be expressed as the time-averaged velocities , and .
In addition to the dimensionless quantities X, Y, U, V, P, Re, etc., defined above, the following dimensionless quantities are also defined for 3D models:
2.5. Grid Validation and Time Step Setting
Mesh generation is executed utilizing the ICEM 19.2 software, employing a structured quadrilateral mesh for the discretization of the computational domain. Specific attention is given to the near-wall region and the burner nozzle area, where local mesh refinement is implemented to accurately capture the flow dynamics and thermal gradients in these critical zones. The mesh configuration is illustrated in Figure 3, providing a visual representation of the spatial discretization strategy adopted. This approach ensures that the numerical simulations are both accurate and efficient, facilitating a detailed analysis of the flow and thermal phenomena within the studied system.
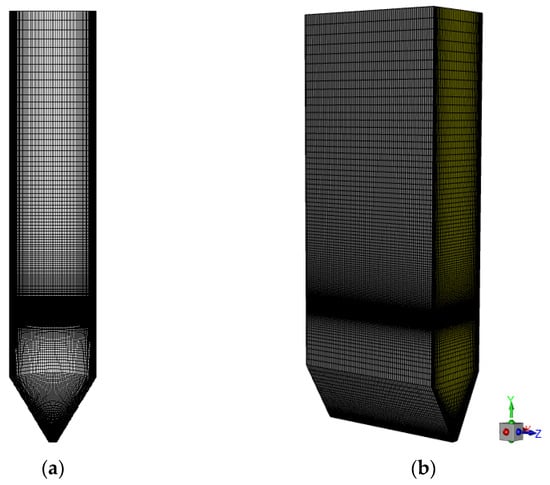
Figure 3.
Meshing: (a) 2D meshing; and (b) 3D meshing.
The mesh independence verification of the 2D model is conducted through the evaluation of nine distinct mesh densities to ascertain the impact of mesh refinement on the simulation accuracy. The initial mesh configuration employed for the simulation comprises 3522 elements. The subsequent mesh densities are determined by incrementally increasing the number of elements by a factor of 1.3 times the preceding mesh density. This systematic approach to mesh refinement ensures that the simulation results converge and remain independent of the grid size, thereby validating the computational model’s reliability. The various mesh densities evaluated, along with the corresponding outcomes of the grid independence study, are delineated in Table 1. This rigorous verification process is pivotal for establishing the numerical simulation’s credibility, confirming that the observed physical phenomena are not artifacts of the discretization but rather true representations of the underlying physics.

Table 1.
Grid number.
Utilizing the grid count as the independent variable, the velocities at monitoring point P0 along the central axis are systematically compared. The outcomes of this comparison are graphically represented in Figure 4a. Based on the results derived from the grid independence verification process, it is observed that the simulation data commenced stabilization from the seventh case (CAS7). After this point, incremental increases in the grid count resulted in negligible alterations to the simulation outcomes. Consequently, the grid density is conclusively set at 40,890 elements for the final simulations. This determination underscores the attainment of a mesh density sufficient to ensure that further refinement does not significantly impact the accuracy of the simulation results, thereby providing a reliable basis for the computational analysis of the fluid velocities within the studied system.
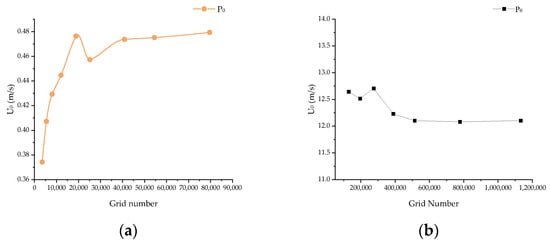
Figure 4.
Grid independence verification. (a) Velocity distribution at point P0 in the 2D model; and (b) velocity distribution at point P0 in the 3D model.
Similarly, the mesh independence verification of the 3D model is carried out. The initial number of meshes for the 3D model is 119,430, and the number of meshes is incrementally increased by a factor of 1.45. Using the number of meshes as an independent variable, the velocity at point P0 on the centerline of the cross-section of the 3D flow model is compared, and the results are shown in Figure 4b. The final number of meshes for the 3D counterflow model is 537,084.
In the calculations for this paper, when the Re range is less than the critical Reynolds number where oscillation occurs in the numerical solution, the flow in the model is steady-state and time-independent. The value of the dimensionless time step does not affect the calculated result after convergence and is fixed at ΔT = 10−2. When Re is greater than the critical Reynolds number Rec, the flow in the model is time-varying and oscillatory, and the value of ΔT is in the range of 10−3 to 10−4. The larger the Re, the smaller the dimensionless time step.
3. Calculation Results and Analysis
3.1. Nonlinear Phenomena of the Flow within a Two-Dimensional Counterflow Model
The results show that, as the Reynolds number (Re) increases, the numerical solution obtained by the two-dimensional counterflow model becomes bifurcated. Based on the main characteristics of the solution, it can be divided into three regions:
- Unique Symmetric Solution: When Re < Rec1 = 4652, the numerical solution is a unique symmetric solution.
- Bifurcation Region: When Rec1 < Re < Rec2 = 8639, there are two asymmetric numerical solutions and one unstable symmetric solution, indicating a tuning fork bifurcation.
- Oscillatory and Chaotic Solutions: When Re > Rec2 = 8639, the numerical solution becomes oscillatory, eventually leading to chaos and a Hopf bifurcation.
Figure 5 illustrates the variation of the dimensionless velocity component U in the x direction with Re at the monitoring point P0. U, U+, and U- are dimensionless velocities. When the actual velocity u is greater than zero, indicating that the velocity at the monitoring point is directed towards the positive X-axis, the dimensionless velocity U is greater than zero. In this scenario, U is denoted as U+ in Figure 5. Conversely, when the actual velocity u is less than zero, indicating that the velocity at the monitoring point is directed towards the negative X-axis, the dimensionless velocity U is less than zero. In this scenario, U is denoted as U- in Figure 5. As seen in Figure 5, when Re < Rec1 = 4652, the numerical solution is a unique symmetric solution. When Rec1 < Re < Rec2 = 8639, two asymmetric numerical solutions and one unstable symmetric solution emerge, indicating a tuning fork bifurcation. When Re > Rec2 = 8639, the numerical solution becomes oscillatory, and eventually chaotic, leading to a Hopf bifurcation.
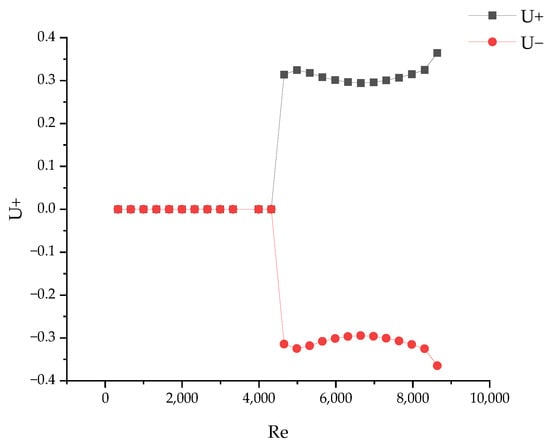
Figure 5.
The variation of the dimensionless velocity component U with Re in the x direction of the two-dimensional hedging flow.
For Re > Rec3, it is noted that the solution exhibits nonlinear oscillations, which will be discussed further later.
Figure 6a–c show the streamlines obtained by the numerical simulation of the laminar flow model at Re = 332, 4320, and 4652. Figure 6d–f show the velocity distribution curve of the y/h = 0.448 cross-section in the model corresponding to these Re values. From Figure 6a,b,d,e, it can be seen that in the range of 332 < Re < 4320, the cross-sectional velocity distribution in the two-dimensional counterflow model is perfectly symmetrical with respect to the axis of symmetry X = 0. After the numerical solution changes with time in the initial stage, it reaches a steady state and no longer changes with time, resulting in a unique, symmetric, and steady-state solution.
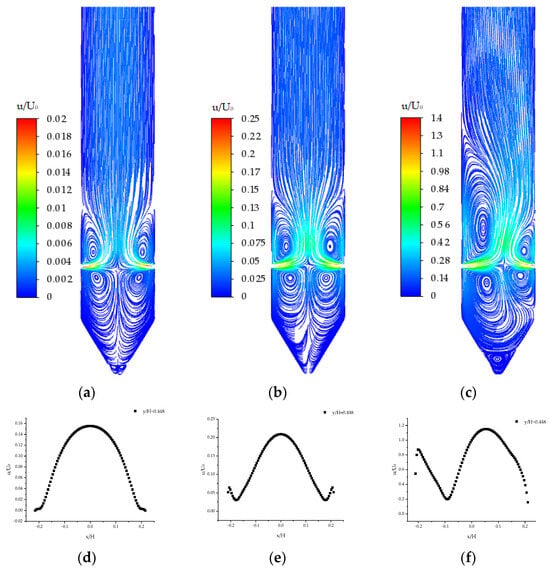
Figure 6.
The streamline diagram and velocity distribution of the y/H = 0.448 cross-section simulated by the laminar flow model: (a) Re = 332; (b) Re = 4320; (c) Re = 4652; (d) Re = 332; (e) Re = 4320; and (f) Re = 4652.
At Re = 4652, as shown in Figure 6c,f, the velocity distribution of the streamlines and sections in the 2D counterflow model starts to become asymmetrical, and the numerical solution is no longer unique. There are at least three solutions: one symmetric but unstable solution, and two steady-state asymmetric solutions. Figure 6c,f show one of these asymmetric solutions, which is steady-state and right-skewed. The other asymmetric solution is anti-symmetric to the right-skewed solution with respect to the axis of symmetry X = 0.
The numerical simulation results of the laminar flow model indicate that the bifurcation point of the two-dimensional counterflow occurs around Re = 4652 under the geometric and physical conditions calculated in this paper.
Figure 7a–c show the streamlines obtained by the numerical simulation of the turbulent flow model at Re = 4652, 4984, and 8639. Figure 7d–f show the velocity distribution curve of the y/H = 0.448 cross-section in the model corresponding to these Re values. Compared with the numerical results of the laminar flow model, at Re = 4652, as shown in Figure 7a,d, the time-averaged velocity distribution is symmetrically distributed with respect to the centerline of the model. At Re = 4984, as shown in Figure 7b,e, the velocity distribution in the two-dimensional counterflow model starts to become asymmetrical, indicating a static bifurcation of the time-averaged velocity with a bifurcation point around Re = 4984. At Re = 8639, Figure 7c,f show that the velocity distribution within the 2D model becomes significantly asymmetrical.
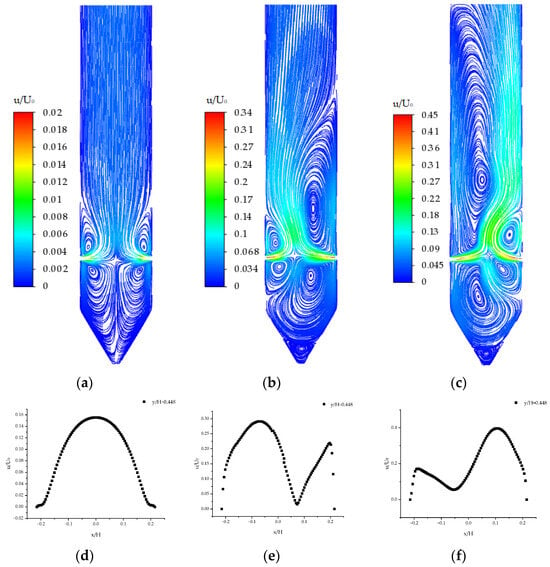
Figure 7.
The streamline diagram simulated by the turbulence model and the velocity distribution of the y/H = 0.448 cross-section: (a) Re = 4652; (b) Re = 4984; (c) Re = 8639; (d) Re = 4652; (e) Re = 4984; and (f) Re = 8639.
These results demonstrate that, within a certain range of Re, the flow field in the furnace remains symmetrical, regardless of whether the laminar flow model or the turbulence flow model is used. Beyond this range, the flow field in the furnace becomes asymmetrical.
3.2. Nonlinear Phenomena of the Flow within a Two-Dimensional Counterflow Model
3.2.1. Periodic Oscillatory Solution
As mentioned earlier, when Re > Rec2 = 8639, a Hopf bifurcation occurs, resulting in an oscillatory solution. Figure 8a shows the time series of velocity U at the monitoring point P0 for Re = 8696. As seen in Figure 8a, the velocity U at the monitoring point P0 oscillates periodically with time. The velocity phase diagram of the monitoring point P0 in Figure 8b shows that the trajectory of the velocity in the U-V phase space forms a closed annular trajectory and an isolated closed curve, indicating a stable single-period limit cycle. This periodic motion of the flow in the dynamical system reflects the cycle of the single-period limit loop, demonstrating that the numerical solution oscillates periodically with time.
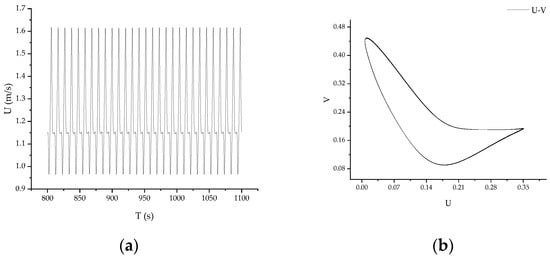
Figure 8.
Velocity time series and velocity phase under Re = 8696. (a) Velocity time series under Re = 8696; and (b) velocity phase under Re = 8696.
3.2.2. Non-Periodic Oscillatory Solution
As Re continues to increase, when Re = 26,067, as shown in Figure 9a, the velocity time series of the flow in the model begins to exhibit non-periodic oscillations, indicating the onset of chaotic flow. At this point, the flow in the model enters a chaotic state, and the solution becomes a chaotic solution. These phenomena demonstrate that, with an increase in Re, the properties of the numerical solution of the flow system change, resulting in a dynamic bifurcation, which is reflected in the flow field by changes in the flow field symmetry. In the velocity phase diagram shown in Figure 9b, the parameters of the phase space correspond to spatial trajectories that are nested and unenclosed. This phenomenon of the attractor in the phase space trajectory indicates that the motion state in the system at this time is oscillation with different periods over time.
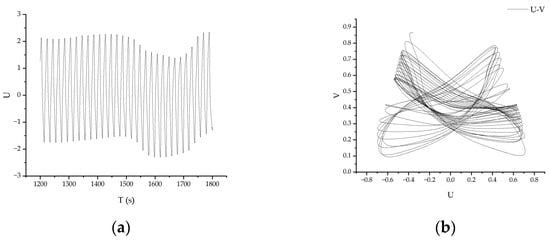
Figure 9.
Velocity time series and velocity phase under Re = 26,067. (a) Velocity time series under Re = 26,067; and (b) velocity phase under Re = 26,067.
3.2.3. Chaos
When Re is further increased to Re = 87,627, the internal motion characteristics of the flow system show strong instability. The velocity time series of the flow oscillates more intensively, as shown in Figure 10a, indicating that the flow within the model is in a state of intense chaos. Figure 10b shows the shape of the chaotic attractor in the phase space of non-periodic oscillation. At this point, the chaotic attractor, also known as the strange attractor, exhibits a very complex and variable trajectory structure in phase space. The flow inside the model displays complex instabilities. From the U-V phase diagram, the chaotic attractor is globally stable, and all other trajectories converge into the chaotic attractor. However, in some regions, the trajectory of the chaotic attractor is extremely unstable, with adjacent trajectories mutually exclusive and exponentially separated. Generally, the chaotic attractor exhibits self-similarity with infinitely nested levels, forming an aggregate of many infinite points in phase space.
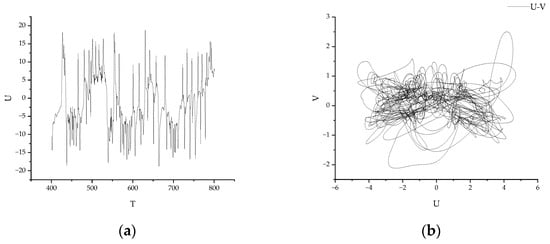
Figure 10.
Velocity time series and velocity phase under Re = 87,627. (a) Velocity time series under Re = 87,627; and (b) velocity phase under Re = 87,627.
3.3. Solution of the 3D Model and Its Differences from the 2D Model
The calculation results of the 3D counterflow model show that, with the increase in Re, the numerical solution of the 3D model exhibits nonlinear phenomena similar to those of the 2D model. However, the nonlinear characteristics and bifurcation points of the 3D model are not necessarily the same as those of the 2D model. In some ranges of Re values, there is flow in the Z direction (W ≠ 0), indicating a three-dimensional flow. For the research model in this paper, symmetrical boundary conditions () are applied to the two boundaries in the Z direction, and the 3D mathematical model presented has a pure two-dimensional solution. From the numerical simulation, it can be seen that the flow has a three-dimensional solution, indicating that the solution is not unique. In this case, the two-dimensional solution cannot fully characterize the three-dimensional flow.
The simulation results of the 3D counterflow show that it has similar flow characteristics to the 2D counterflow at low Re. As Re increases, the numerical solution of the 3D flow exhibits a nonlinear variation similar to that observed in 2D flow studies. Additionally, when the Reynolds number of the three-dimensional flow is less than 8369, the three-dimensional model exhibits the characteristics of two-dimensional flow: the dimensionless velocity in the Z direction is 0, reducing the three-dimensional flow solution to a two-dimensional one. When the Reynolds number of the 3D flow exceeds 8369, the model displays the characteristics of three-dimensional flow: the dimensionless velocity in the Z direction is non-zero, indicating a three-dimensional flow solution.
Figure 11 shows the time series of the dimensionless velocity component W at the monitoring points P1, P2, and P3 for Re = 4320, 4652, 8639, 26,067, and 87,627. As shown in Figure 11, when Re = 4320 and 4652, the dimensionless velocity W of the 3D counterflow model in the Z direction is 0 and time-independent, indicating a two-dimensional and steady-state flow. When Re = 8369, W≠0 but forms a horizontal straight line, indicating a steady-state three-dimensional flow. When Re = 26,067 and 87,627, the flow oscillates with time and W ≠ 0. The values and oscillation characteristics differ for each section, indicating a three-dimensional and unstable flow. The following is a detailed analysis of the flow characteristics in the 3D model at Re = 4652, 8639 and 87,627.
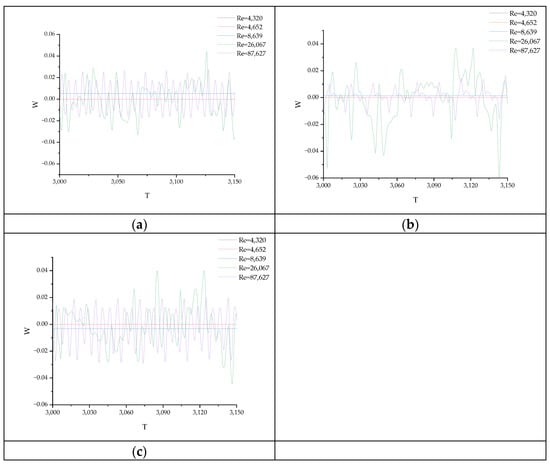
Figure 11.
The time series of the dimensionless velocity component W in the Z direction under different Re conditions at different monitoring points: (a) Z = −0.2; (b) Z = 0; and (c) Z = 0.2.
Figure 12a–c show the distribution curves of the dimensionless velocity component UUU in several different cross-sections Z = z/H = −0.2, 0, and 0.2 in the Z direction when Re = 4652. Figure 13a–c correspond to the dimensionless velocity distribution U on their respective cross-sections. As shown in these figures, the velocity distribution of the three vertical sections of the 3D flow model is identical, and they are all steady-state, symmetrical, and unique. At Re = 4652, the velocity component W = 0 is obtained numerically for the entire calculation area. Combined with the numerical results given in Figure 11 and Figure 7a, it can be seen that the numerical solution of the 3D model under this Re is exactly the same as that of the 2D model.
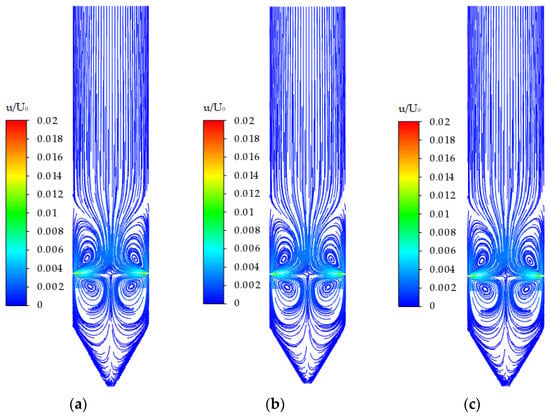
Figure 12.
Comparison of the velocity distribution on different sections when Re = 4652: (a) Z = −0.2; (b) Z = 0; and (c) Z = 0.2.
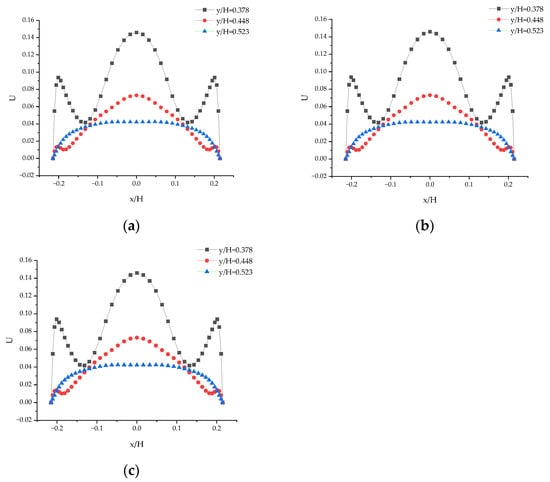
Figure 13.
Velocity distribution on different sections when Re = 4652: (a) Z = −0.2; (b) Z = 0; and (c) Z = 0.2.
By examining the distribution curves of the dimensionless velocity U in Figure 13a–c, it is evident that the velocity distribution remains almost perfectly symmetrical, indicating a high stability and symmetry of the flow at lower Reynolds numbers. The flow characteristics in the 3D model are the same as those in the 2D model. This means that, under certain conditions, three-dimensional problems may have two-dimensional solutions, making the theoretical two-dimensional solutions applicable to the three-dimensional experimental results.
Figure 14a–c show the distribution of the dimensionless velocity U over cross-sections P0, P1, and P2. Figure 15a–c depict the distribution curves of the dimensionless velocity component U at different Z-axis sections (Z = −0.2, Z = 0, Z = 0.2) under a Reynolds number of Re = 8639.
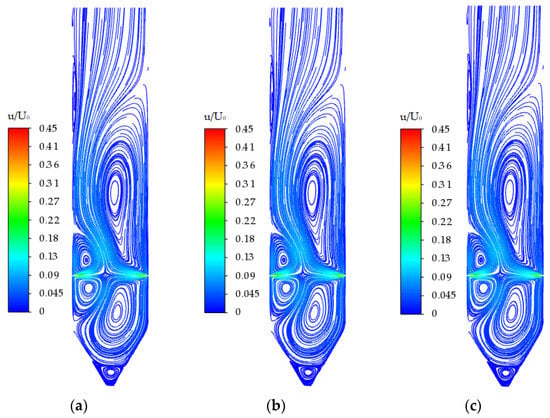
Figure 14.
Comparison of the velocity distribution on different sections when Re = 8639: (a) Z = −0.2; (b) Z = 0; and (c) Z = 0.2.
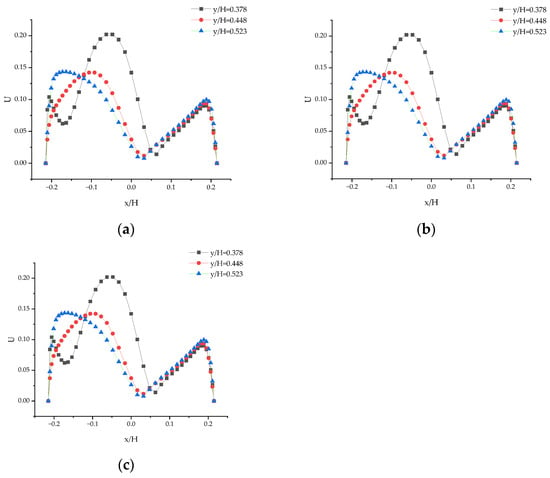
Figure 15.
Velocity distribution on different sections when Re = 8639: (a) Z = −0.2; (b) Z = 0; and (c) Z = 0.2.
As seen in Figure 15, at Re = 8639, the velocity distribution of the 3D model’s flow across different sections exhibits symmetry breaking, with the dimensionless velocity distribution in each section being the same. Figure 14 and Figure 15 demonstrate a symmetrical break in the predominance of the three-dimensional counterflow at Re = 8639 from both qualitative and quantitative perspectives.
Combined with the analysis of the multiple flow solutions in Figure 5 and the symmetry breaking in Figure 7c, which shows the opposite flow on the right side, it is evident that, at Re = 8639, there is also a set of symmetry breaks in the right-side flow dominance in the 3D counterflow.
Referring to Figure 11, when Re = 8639, the non-zero dimensionless velocity W in the Z direction indicates the presence of three-dimensional flow in the model. W behaves as a horizontal straight line over time, indicating that the three-dimensional flow is steady-state and does not change with time. This implies that the three-dimensional problems do not only have two-dimensional solutions but can also present three-dimensional solutions.
Figure 16a–c display the distribution curves of the dimensionless velocity component U for three Z-axis cross-sections (Z = −0.2, Z = 0, and Z = 0.2) at Re = 87,627. Correspondingly, Figure 17a–c depict the dimensionless velocity distribution on these cross-sections.
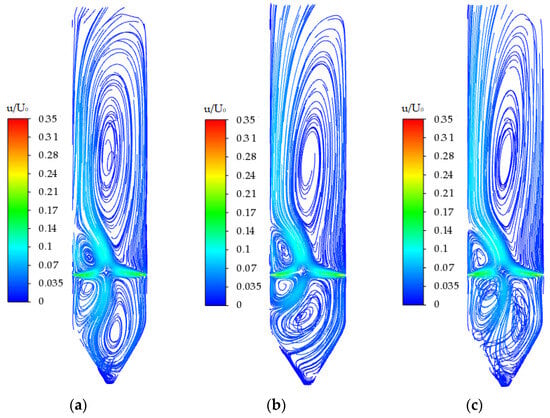
Figure 16.
Comparison of the velocity distribution on different sections when Re = 87,627: (a) Z = −0.2; (b) Z = 0; and (c) Z = 0.2.
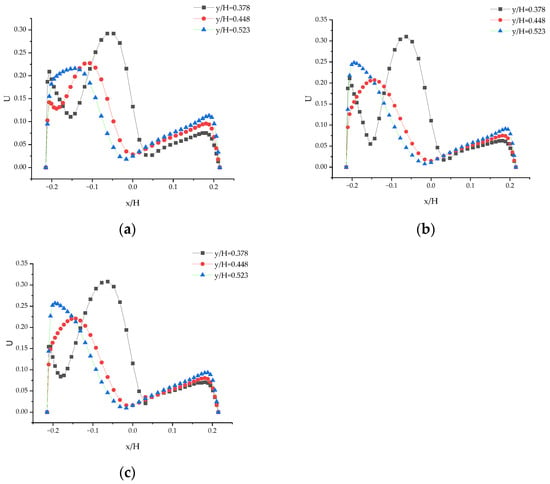
Figure 17.
Velocity distribution on different sections when Re = 87,627: (a) Z = −0.2; (b) Z = 0; and (c) Z = 0.2.
A detailed examination of the flow near the entrance at this high Reynolds number reveals significant asymmetry. In particular, the sections at Z = −0.2 and Z = 0.2 show markedly increased flow complexity, demonstrating strong turbulence. The velocity distribution curves exhibit greater fluctuations and instability, indicating that the flow has entered a highly turbulent state, with intense mixing and interactions occurring in all directions.
The substantial differences in the velocity distribution across the sections reveal the complex vortex structures and turbulent phenomena inherent in three-dimensional flow at high Reynolds numbers. These observations indicate both asymmetrical flow (multiple solutions) and three-dimensional flow (the flow in the Z direction), with a non-zero velocity W in each section. Combined with Figure 11, at Re = 87,627, the three-dimensional counterflow oscillates with time and W ≠ 0. The values and oscillation characteristics differ across each cross-section, highlighting the three-dimensional and unsteady nature of the flow.
To more intuitively analyze the 3D solutions that occur in the 3D model, Figure 18a–c and Figure 19a–c show the distribution of the dimensionless velocity component W at different cross-sections.
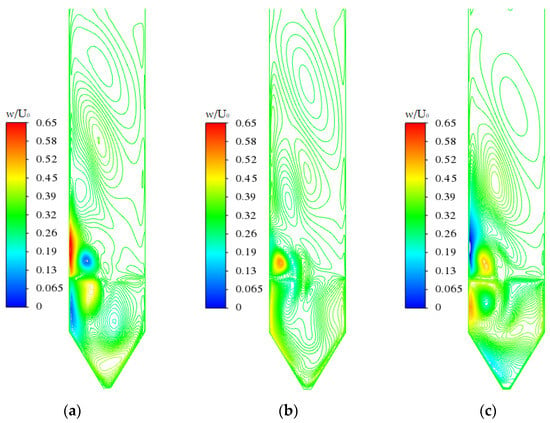
Figure 18.
Velocity distribution in the Z direction on different sections when Re = 87,627: (a) Z = −0.2; (b) Z = 0; and (c) Z = 0.2.
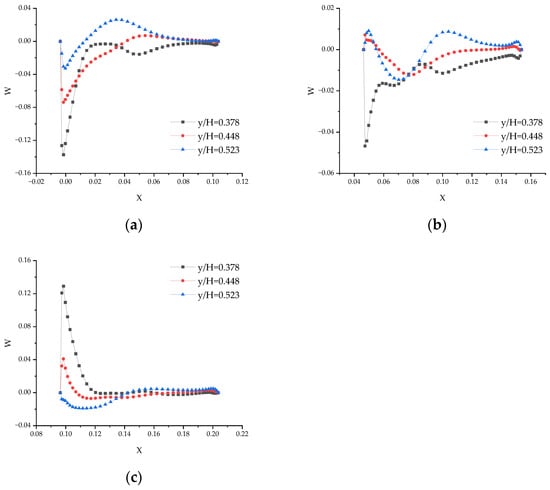
Figure 19.
The distribution of the dimensionless velocity W in different cross-sections when Re = 87,627: (a) Z = −0.2; (b) Z = 0; and (c) Z = 0.2.
Figure 18 presents the Z direction velocity components W at different sections when Re = 87,627. By analyzing three cross-sections (Z = −0.2, Z = 0, and Z = 0.2), we can gain a deeper understanding of the variations and complexities of the flow along the Z-axis.
At Z = −0.2 (Figure 18a and Figure 19a), the Z direction velocity components exhibit significant asymmetry, especially near the inlet region. High-velocity areas alternate with low-velocity regions, indicating strong mixing and turbulence near the inlet, leading to flow instability. Similarly, at Z = 0.2 (Figure 18c and Figure 19c), the Z direction velocity components also display asymmetry, particularly in regions further from the inlet, where the asymmetry becomes more pronounced. This highlight substantial differences in the flow characteristics at various Z-axis positions, especially at high Reynolds numbers where the flow becomes increasingly complex and unstable.
In contrast, at Z = 0 (Figure 18b and Figure 19b), the Z direction velocity components are relatively symmetrical, indicating a relatively stable flow at the mid-plane. However, even at this central cross-section, the velocity components exhibit some asymmetry, suggesting that the flow in the three-dimensional space is not entirely symmetrical but influenced by three-dimensional effects. This balanced state at the mid-plane further emphasizes the gradual variation and complexity of the flow along the Z-axis.
The complexity of the three-dimensional flow lies in the significant differences in the Z direction velocity components and characteristics across different sections. These variations reflect the presence of secondary flow structures and turbulence phenomena in three-dimensional flow. The occurrence of asymmetry may be due to the increased flow instability caused by three-dimensional effects and turbulence, particularly at high Re numbers. The three-dimensional model can capture turbulence and secondary flow structures that cannot be observed in a two-dimensional model.
4. Conclusions
In this paper, we investigate a boiler furnace with a symmetrical burner arrangement by abstracting and simplifying both a two-dimensional and a three-dimensional counterflow model. Through numerical simulations, we obtain the velocity fields of the fluid flow in these models for different Reynolds numbers (Re). The numerical results are analyzed to understand the nonlinear characteristics and differences between the two-dimensional and three-dimensional models. The findings indicate the following:
- When Re varies, both the two-dimensional and three-dimensional models exhibit solution bifurcations and nonlinear phenomena such as symmetry breaking, self-sustained oscillations, and chaos.
- As Re increases, the two-dimensional counterflow model displays a unique solution, an asymmetric solution, and an oscillating solution. Specifically, when Re < 4320, both the laminar and turbulent models show a unique, symmetric, and steady-state velocity distribution. For 4652 < Re < 8639, the two-dimensional model solutions are not unique, presenting a pair of antisymmetric, asymmetric solutions that nevertheless remain steady-state. When Re > 8639, the solution becomes oscillatory and unsteady.
- The three-dimensional counterflow model exhibits a two-dimensional solution independent of the Z-axis. At Re = 4652, both the three-dimensional and two-dimensional models produce the same unique, symmetric, and steady-state velocity distribution, with no three-dimensional flow (W = 0). At Re = 8639, the three-dimensional model solutions are not unique, showing a pair of antisymmetric, asymmetric solutions, while still being steady and time-independent. At Re = 87,627, the three-dimensional model solution becomes oscillatory and unsteady.
By elucidating the flow characteristics and nonlinear features of both models, this study compares the differences between the two-dimensional and three-dimensional flows, thereby laying the groundwork for simplification of the problem and further theoretical research.
Author Contributions
Conceptualization, M.Y. and W.W.; methodology, M.Y. and W.W.; software, M.Y.; validation, W.W. and M.Y.; formal analysis, W.W. and M.Y.; investigation, W.W.; resources, M.Y.; data curation, W.W.; writing—original draft preparation, W.W.; writing—review and editing, W.W. and M.Y.; visualization, W.W.; supervision, M.Y.; project administration, and M.Y.; funding acquisition, M.Y. All authors have read and agreed to the published version of the manuscript.
Funding
This research, including the APC, was funded by the National Natural Science Foundation of China, grant number 51736007.
Data Availability Statement
The data that support the findings of this study are available from the corresponding author, Mo Yang, upon reasonable request.
Conflicts of Interest
There are no conflicts of interest.
References
- Miao, L.; Liu, M.; Zhang, K.; Yan, J. Design and performance evaluation of thermal energy storage system with hybrid heat sources integrated within a coal-fired power plant. J. Energy Storage 2024, 82, 110611. [Google Scholar] [CrossRef]
- Pan, J.; Yang, D.; Yu, H.; Bi, Q.; Hua, H.; Gao, F.; Yang, Z. Mathematical modeling and thermal-hydraulic analysis of vertical water wall in an ultra-supercritical boiler. Appl. Therm. Eng. 2009, 29, 2500–2507. [Google Scholar] [CrossRef]
- Li, Z.; Miao, Z.Q.; Qiao, X. Effects of structural parameters of a novel burner scheme with annularly combined multiple airflows on performance of a 660MW tangentially fired boiler. Energy 2023, 280, 127963. [Google Scholar] [CrossRef]
- Battaglia, F.; Tavener, S.J.; Kulkarni, A.K.; Merkle, C.L. Bifurcation of Low Reynolds Number Flows in Symmetric Channels. AIAA J. 1997, 35, 99–105. [Google Scholar] [CrossRef]
- Chiang, T.P. Spanwise bifurcation in plane-symmetric sudden-expansion flows. Phys. Rev. E 2001, 65, 016306. [Google Scholar] [CrossRef] [PubMed]
- Guevel, Y.; Allain, T.; Girault, G.; Cadou, J.-M. Numerical bifurcation analysis for 3- dimensional sudden expansion fluid dynamic problem. Int. J. Numer. Methods Fluids 2018, 87, 1–26. [Google Scholar] [CrossRef]
- Moallemi, N.; Brinkerhoff, J.R. Numerical analysis of laminar and transitional flow in a planar sudden expansion. Comput. Fluids 2016, 140, 209–221. [Google Scholar] [CrossRef]
- Saha, S.; Biswas, P.; Das, A.N.; Kumar, A.; Kumar Singh, M. Analysis of Blood Flow Bifurcation Phenomena in Mitral Valve: A Numerical Approach to Predict Cardiac Arrest. J. Appl. Fluid Mech. 2023, 16, 491–504. [Google Scholar]
- Wragg, A.A.; Loomba, R.P. Free convection flow patterns at horizontal surfaces withionic mass transfer. Int. J. Heat Mass Transf. 1970, 13, 439–442. [Google Scholar] [CrossRef]
- Sedahmed, G.H.; Nirdosh, I. Natural convection mass transfer at an enclosure between two horizontal discs. Chem. Eng. Commun. 1991, 101, 93–102. [Google Scholar] [CrossRef]
- Mao, Y.-F.; Li, Z.; Zhang, Y.-P. A review of mass-transfer models and mechanistic studies of semi-volatile organic compounds in indoor environments. Indoor Built Environ. 2017, 27, 1307–1321. [Google Scholar] [CrossRef]
- Patrick, M.A.; Wragg, A.A. Optical and electrochemical studies of transient free convection mass transfer at horizontal surfaces. Int. J. Heat Mass Transf. 1975, 18, 1397–1407. [Google Scholar] [CrossRef]
- Antonini, G.; Guiffant, G.; Geiger, D. Periodic fluctuation of free convection mass transfer from horizontal surfaces. Lett. Heat Mass Transf. 1978, 5, 187–195. [Google Scholar] [CrossRef]
- Yang, L.; Yang, M.; Huang, W. Nonlinear Phenomena of Fluid Flow in a Bioinspired Two-Dimensional Geometric Symmetric Channel with Sudden Expansion and Contraction. Mathematics 2024, 12, 553. [Google Scholar] [CrossRef]
- Zhang, K.; Yang, M.; Zhang, Y. Two- and three-dimensional numerical simulations of natural convection in a cylindrical envelope with an internal concentric cylinder with slots. Int. J. Heat Mass Transf. 2014, 70, 434–438. [Google Scholar] [CrossRef]
- Li, Y.; Zhang, Q.; Gu, F. Numerical study on the effect of secondary air reverse cutting on flue gas deviation in large capacity tangential combustion boilers. Chin. J. Electr. Eng. 2001, 21, 33–37. [Google Scholar]
- Duan, Y.; Cai, X.; Wu, W. Numerical simulation of changing the air distribution mode for a 980t/h four corner tangential combustion boiler. Power Plant Syst. Eng. 2011, 27, 8–10. [Google Scholar]
- Shao, W.; Pan, W.; Wang, W. Study on numerical calculation of combustion characteristics of tangentially fired coal-fired boilers with different air distribution modes. Environ. Eng. 2017, 35, 73–77. [Google Scholar]
- Zhao, Z.; Zhang, M. Research and development of coal powder jet reverse stable combustion technology for tangential combustion boilers at four corners. Combust. Sci. Technol. 1997, 3, 88–96. [Google Scholar]
- Wu, S.; Bi, Z. Discussion on Four Corner Tangential Combustion Technology for Power Plant Boilers. China Electr. Power 1999, 32, 15–21. [Google Scholar]
- Zhou, J.; Song, G.; Chen, Y. Experimental study on the outlet flue gas temperature deviation of a 2008 t/h four corner tangential combustion boiler. J. Eng. Thermophys. 2013, 3, 2162–2165. [Google Scholar]
- Wang, Y.; Zhou, Y.; Bai, N.; Han, J. Experimental investigation of the characteristics of NOx emissions with multiple deep air-staged combustion of lean coal. Fuel 2020, 280, 118416. [Google Scholar] [CrossRef]
- Li, Z.; Qiao, X.; Miao, Z. A novel burner arrangement scheme with annularly combined multiple airflows for wall-tangentially fired pulverized coal boiler. Energy 2021, 222, 119912. [Google Scholar] [CrossRef]
- Bolegenova, S.; Askarova, A.; Georgiev, A.; Nugymanova, A.; Maximov, V.; Bolegenova, S.; Adil’bayev, N. Staged supply of fuel and air to the combustion chamber to reduce emissions of harmful substances. Energy 2024, 293, 130622. [Google Scholar] [CrossRef]
- Wang, H.; Yang, M.; Wang, Z.; Lv, J.; Chen, S.; Huang, K. Analysis of Asymmetric Flow Mechanism in the Furnace of a Symmetric Structure Boiler. J. Eng. Thermophys. 2013, 34, 2162–2165. [Google Scholar]
- Yun-Yi, S.; Mo, Y.; Xu, H.T. Investigation of the Forming Mechanism of Flue Gas Side Heat Deviation and Improvement Measures in the Boiler Furnace With a Symmetrical Structure. J. Eng. Thermophys. 2015, 36, 2178–2182. [Google Scholar]
- Zhao, F.-Y.; Liu, D.; Tang, G.-F. Multiple steady flows in confined gaseous double diffusion with discrete thermosolutal sources. Phys. Fluids 2007, 19, 103–107. [Google Scholar] [CrossRef]
- Xin, S.; Le Quéré, P.; Tuckerman, L.S. Bifurcation analysis of double-diffusive convection with opposing horizontal thermal and solutal gradients. Phys. Fluids 1998, 10, 850–858. [Google Scholar] [CrossRef][Green Version]
- Mamou, M.; Vasseur, P.; Bilgen, E. Multiple solutions for double-diffusive convection in a vertical porous enclosure. Int. J. Heat Mass Transf. 1995, 38, 1787–1798. [Google Scholar] [CrossRef]
- Wu, Q.; Liang, X.; Chen, Z.; Ren, J.; Guo, Z. Numerical study on the bifurcation phenomenon of convective heat transfer in a square cavity with oblique inlet. J. Tsinghua Univ. (Nat. Sci. Ed.) 2000, 40, 102–105. [Google Scholar]
- Chen, Z.-W.; Zhan, J.-M.; Li, Y.-S. Double-diffusive buoyancy convection in a square cuboid with horizontal temperature and concentration gradients. Int. J. Heat Mass Transf. 2013, 60, 422–431. [Google Scholar] [CrossRef]
- Constenla, I.; Ferrín, J.L.; Saavedra, L. Numerical study of a 350 MWe tangentially fired pulverized coal furnace of the As Pontes Power Plant. Fuel Process. Technol. 2013, 116, 189–200. [Google Scholar] [CrossRef]
- Shapira, M.; Degani, D.; Weihs, D. Stability and existence of multiple solutions for viscous flow in suddenly enlarged channels. Comput. Fluids 1990, 18, 239–258. [Google Scholar] [CrossRef]
- Bhadauria, B.S.; Kiran, P. Heat and mass transfer for oscillatory convection in a binary viscoelastic fluid layer subjected to temperature modulation at the boundaries. Int. Commun. Heat Mass Transf. 2014, 58, 166–175. [Google Scholar] [CrossRef]
- Chen, Z.; Li, Y.; Zhan, J. Onset of oscillatory double-diffusive buoyancy instability in an inclined rectangular cavity. Int. J. Heat Mass Transf. 2012, 55, 3633–3640. [Google Scholar] [CrossRef]
- Bergeon, A.; Ghorayeb, K.; Mojtabi, A. Double diffusive instability in an inclined cavity. Phys. Fluids 1999, 11, 549–559. [Google Scholar] [CrossRef][Green Version]
- Sanghi, A.; Fraser, A.; Garaud, P. The effects of a vertical magnetic field on Oscillatory Double-Diffusive Convection at low Prandtl number. Bull. Am. Phys. Soc. 2021, 66, T11-009. [Google Scholar]
- Wenquan, T. Numerical Heat Transfer, 2nd ed.; Xi’an Jiaotong University Press: Xi’an, China, 2001. [Google Scholar]
- Durst, F.; Melling, A.; Whitelaw, J.H. Low Reynolds number flow over a plane symmetric sudden expansion. J. Fluid Mech. 1974, 64, 111–128. [Google Scholar] [CrossRef]
- Cherdron, W.; Durst, F.; Whitelaw, J.H. Asymmetric flows and instabilities in symmetric ducts with sudden expansions. J. Fluid Mech. 1978, 84, 13–31. [Google Scholar] [CrossRef]
- Armaly, B.F.; Durst, F.; Pereira, J.C.F. Experimental and theoretical investigation of backward-facing step flow. J. Fluid Mech. 1983, 127, 473–496. [Google Scholar] [CrossRef]
- Hawa, T.; Rusak, Z. The dynamics of a laminar flow in a symmetric channel with a sudden expansion. J. Fluid Mech. 2001, 436, 283–320. [Google Scholar] [CrossRef]
- Mandal, D.K.; Bandyopadhyay, S.; Chakrabarti, S. A numerical study on the flow through a plane symmetric sudden expansion with a fence viewed as a diffuser. Int. J. Eng. Sci. Technol. 2011, 3, 210–233. [Google Scholar] [CrossRef][Green Version]
- Lima, R.C.; Andrade, C.R.; Zaparoli, E.L. Numerical study of three recirculation zones in the unilateral sudden expansion flow. Lett. Heat Mass Transf. 2008, 35, 1053–1060. [Google Scholar] [CrossRef]
- Zhou, X. Numerical Study on Effects of Geometric Parameters on the Release Characteristics of Straight Sudden Expansion Gas Extinguishing Nozzles. Symmetry 2021, 13, 2440. [Google Scholar] [CrossRef]
- Mishra, A.; Jithin, M.; De, A.; Das, M.K. Effect of Passive flow Control of Bifurcation Phenomenon in Sudden Expansion channel. Proc. Natl. Acad. Sci. India Sect. A Phys. Sci. 2018, 89, 663–672. [Google Scholar] [CrossRef]
- Saha, S. Numerical Simulation of Turbulent Flow Through a Sudden Expansion Channel: Comparison between Three Models. In Recent Advances in Sustainable Technologies; Springer: Berlin/Heidelberg, Germany, 2021; pp. 49–56. [Google Scholar]
- Montazer, E.; Yarmand, H.; Salami, E.; Muhamad, M.R.; Kazi, S.N.; Badarudin, A. A brief review study of flow phenomena over a backward-facing step and its optimization. Renew. Sustain. Energy Rev. 2018, 82, 994–1005. [Google Scholar] [CrossRef]
- Saha, S. A Survey on Flow Phenomena and Heat Transfer Through Expansion Geometry. In Recent Advances in Sustainable Technologies; Springer: Berlin/Heidelberg, Germany, 2021; pp. 257–264. [Google Scholar]
- Li, Y.; Yang, M.; Zhang, Y. Bifurcation analysis of coupling thermosolutal convection induced by a thermal and solutal source in a horizontal cavity. Int. Commun. Heat Mass Transf. A Rapid Commun. J. 2021, 126, 105455. [Google Scholar] [CrossRef]
- Ying, X.; Huang, W.; Liu, W. Asymmetric phenomenon of flow and heat transfer in charging process of thermal energy storage based on an entire domain model. Appl. Energy 2022, 316, 119122. [Google Scholar] [CrossRef]
- Wang, W.; Yang, M. Numerical and Experimental Study on Nonlinear Phenomena and Thermal Deviation Control in a 1000 MW Tower-Type Boiler. Energies 2024, 17, 1329. [Google Scholar] [CrossRef]
Disclaimer/Publisher’s Note: The statements, opinions and data contained in all publications are solely those of the individual author(s) and contributor(s) and not of MDPI and/or the editor(s). MDPI and/or the editor(s) disclaim responsibility for any injury to people or property resulting from any ideas, methods, instructions or products referred to in the content. |
© 2024 by the authors. Licensee MDPI, Basel, Switzerland. This article is an open access article distributed under the terms and conditions of the Creative Commons Attribution (CC BY) license (https://creativecommons.org/licenses/by/4.0/).