Abstract
Medium-voltage (MV) distribution networks that are spread through larger territory and threatened by extreme weather conditions are sometimes formed by very long underground cable lines. In such circumstances, a significant amount of capacitive reactive power flow can be generated. If, concurrently, there is low power demand in the network, it can result in significant reverse reactive power flows and voltage rise issues. This paper proposes a general approach for analyzing and mitigating voltage rise issues and demonstrates it using an example of a real distribution network that operates under the described conditions. Previous studies that dealt with this problem did not include the allocation of multiple shunt reactors in a larger distribution network, modeling a high number of lines that create reverse reactive power flows, and modeling the main distribution transformers, which are the locations where voltage rise predominantly occurs. In this paper, we demonstrate that precise allocation and placement of multiple shunt reactors in a fully modeled, larger distribution system, including transformer models, can reduce reverse reactive power flows, thereby improving voltage in the distribution system. If hourly control of the power factor from the distributed generation unit is also implemented, the voltage can be further improved.
1. Introduction
Medium-voltage overhead distribution networks that are spread through a large territory are vulnerable to severe weather conditions. A study [1] showed that in some places, weather-related outage events account for 78.09% of the total, with lightning, contributing 63.26%, and wind, contributing 12.27%, as the two main weather factors. Additionally, wildfires account for 2.14%, icing for 0.16%, and geological events for 0.11%.
In conditions where overhead line damage is frequent, medium-voltage networks are sometimes formed by long underground cable lines, ensuring enhanced reliability in the supply of electrical energy [2]. Electric power distribution networks were primarily developed for power flows directed towards consumers [3]. Due to the inductive characteristics of consumption, reactive power flows are commonly directed towards consumers, with variations in the inductive component roughly corresponding to fluctuations in electrical demand, especially when the medium-voltage network is predominantly implemented using overhead lines.
Underground medium-voltage cable lines generate reverse reactive power flows [4] toward the distribution network feeding point, where the quantity of reactive power flows increases with the length of the lines. In distribution networks with very low power demand and very long cable lines, significant reverse reactive power flows may occur, leading to voltage rises in the distribution network.
Standard indicators of voltage quality are defined by the EN 50160 standard [5]. The permissible voltage deviation is typically specified as ±10% of the nominal voltage. Voltage fluctuation limits are set to ensure that short-term flicker does not exceed 1.0 and long-term flicker remains below 0.8, as outlined in the same standard. Additionally, the standard specifies that voltage asymmetry between phases (voltage unbalance) should be ≤2%, ensuring balanced distribution across three-phase systems. Limits for non-sinusoidal voltages dictate that total harmonic distortion (THD) should not exceed 8%, maintaining the integrity of voltage waveforms and minimizing interference with electrical equipment.
The problems with voltage rise can result in the need for power curtailment of DG units [6]. The voltage rise issue is typically investigated in the context of the connection of distributed generation sources [7]. Papers related to voltage rises typically address the reduction in voltage rises resulting from reverse power flows caused by the connection of distributed generation units. In Ref. [8], the author proposed a phase shifting strategy to mitigate local voltage rises and reverse power flows caused by high photovoltaic penetration. In Ref. [9], the power curtailment of distributed generation is proposed to mitigate voltage rise. In Ref. [10], the authors considered the voltage rise issue during the distributed generation allocation process. In Ref. [11], the authors proposed the dynamic operation of a voltage regulator for voltage regulation in a distribution system with a significant integration of distributed generation. In Ref. [12], the authors proposed the usage of distributed energy storage for mitigation of the voltage rise impact caused by rooftop solar PV systems. In Ref. [13], the authors proposed a decentralized control strategy using droop-based control to adjust electric vehicle (EV) charging rates in real time based on nodal voltages, voltage unbalance, and state of charge (SOC) to mitigate voltage rise from rooftop solar PV systems. The paper [14] introduces a novel reactive power control technique tailored for low-voltage distribution networks with high photovoltaic (PV) system penetration, addressing voltage rise challenges by dynamically adjusting reactive power based on both PV active power injection and real-time network voltage conditions. It demonstrates superior voltage regulation and reduced losses compared to conventional fixed power factor and voltage-based methods, highlighting its adaptability to varying scenarios despite a potentially slightly slower response time. The paper [15] addresses voltage regulation challenges arising from increased distributed PV installations in distribution systems. It introduces a PID closed-loop-based volt-var (VV) function and a mode-switching function for PV smart inverters to enhance voltage regulation effectiveness. The paper [16] introduces a control strategy for grid-connected inverters interfacing with battery storage systems (BSS) to enhance PV penetration in low-voltage (LV) grids. The strategy optimizes inverter set points for active and reactive power based on grid voltage, considering battery specifications and state of charge (SoC). The paper [17] explores leveraging electric minibus taxi (EmBT) charging alongside residential solar photovoltaic (PV) generation to mitigate voltage rises in low-voltage (LV) networks with high penetration of distributed energy resources (DERs).
In contrast to the literature addressing voltage rises due to distributed generation units, the literature that investigates voltage rises caused by large capacitive currents in underground cables and variations in power demand is much less common. In Ref. [18], a reactive power control method using a variable shunt reactor and the reactive power control of a wind power plant was proposed to compensate for the capacitive reactive power of the cable. In Ref. [19], the authors addressed voltage issues resulting from substantial load variations by proposing the installation of shunt capacitor banks for voltage drop issues and shunt reactors (ShRs) for voltage rise issues. In Ref. [20], the authors deployed switchable shunt reactors in combination with DGs that have the capability of absorbing reactive power for voltage rise mitigation in a low-voltage distribution network with high penetration of photovoltaic DGs. The authors concluded that DGs have limited capacity to serve as a source of reactive power and are unable to provide sufficient reactive power for full voltage rise mitigation. In Ref. [21], the authors demonstrated that the shunt reactor can mitigate the power frequency voltage rise caused by the capacitance effect of long lines under no-load or light-load conditions in high-voltage systems. The paper [22] explores the voltage rise mitigation caused by minimal loading and excessive reactive power generated by line capacitance in magnetically controlled shunt reactors.
This paper focuses on analyzing voltage rise issues that are not primarily caused by DGs, but rather by very low power demand and a significant number of long underground cable lines that create a high amount of capacitive reactive power. The analysis was conducted on a real distribution network spread over two voltage levels. The network is located in Primorsko-Goranska County, Croatia. This distribution network is specific due to the very low power demand resulting from a significant population decrease, as well as a large number of long underground cable lines installed to withstand extreme weather conditions caused by the ice storm in 2014. A method for reducing voltage rise was introduced, involving the allocation of multiple fixed shunt reactors within the distribution network and the implementation of hourly power factor control for the existing distributed generation. The distribution system model contains two voltage levels of the distribution network with two distribution transformers that are connected between the 35 kV and 20 kV distribution networks. Modeling the distribution transformers and including them in the analysis of voltage rise issues is significant, as the majority of voltage rises occur in them. The analysis includes not only the 20 kV network and 35/20 kV transformers but also the feeder lines of the 35 kV network, which are expected to contribute to voltage rise issues due to their length and characteristics. The main 110/35 kV transformer is not included in the analysis since it has an on-load tap changer so the voltage is fixed to a set value of 1.05 p.u.
The main innovations introduced in this paper are summarized in four points:
- (1)
- This paper proposes a novel general approach for analyzing and mitigating voltage rise issues where the entire system is accurately modeled and various elements that contribute to voltage rises are unified into a single method for the mitigation of voltage rises on multiple voltage levels of a distribution network.
- (2)
- One of the novel aspects of our approach lies in the inclusion of main distribution transformers in the analysis of the voltage rise issue. The voltage rise issue is analyzed with the modeling of distribution transformers. Earlier research addressing this issue overlooked the incorporation of main distribution transformers, which are pivotal sites where voltage rise predominantly occurs.
- (3)
- Previous studies on this topic typically incorporated just one shunt reactor and a limited number of distribution lines. In contrast, our paper introduces a method for addressing voltage rise by strategically allocating multiple shunt reactors and implementing hourly power factor control for a distributed generation unit within extensive distribution networks featuring a high volume of lines generating reactive power flows. The allocated multiple shunt reactors simultaneously influence the reduction of voltage rise both in the lines and in the transformers.
- (4)
- The proposed method also unifies and accurately models the components of distribution lines responsible for creating reverse flows of capacitive reactive power, particularly the parallel branches that inject capacitive reactive power. The voltage rise issue is analyzed with the modeling of lines on two voltage levels of the distribution network.
Despite the relatively small size of the higher-level network, we demonstrated the feasibility of mitigating voltage rises in distribution lines of both voltage levels of the distribution network, as well as in the transformers that serve as connections between these voltage levels, by using shunt reactors and hourly power factor control of DGs.
2. Materials and Methods
The main objective of optimization is to mitigate voltage rise issues caused by low power demand and significant reverse power flows generated by underground cables in the distribution system. This is achieved by the allocation of up to eight fixed shunt reactors and the hourly power factor control of the existing distributed generation.
2.1. Objective Function for Voltage Rise Mitigation
The mitigation of voltage rises will be achieved by defining the objective function for voltage profile improvement across all distribution network nodes and time intervals, which can be mathematically expressed as follows:
In Equation (1), Nn and Nt represent the total number of nodes and time intervals, while Uit represents the ith node voltage at interval t. Un represents the desired system voltage in the distribution network. The nominal voltage is as follows:
2.2. Constraints
2.2.1. Positions of Shunt Reactors
The algorithm is permitted to suggest up to eight new shunt reactors, which can be connected to nodes on the secondary side of the 35/20 kV transformers; the nodes satisfy the following constraints, respectively:
(3 ≤ ShRs_position ≤ 42) ∨ (44 ≤ ShRs_position ≤ 71)
2.2.2. Installed Power of Shunt Reactors
The algorithm is permitted to suggest the following installed reactive power of one ShR unit:
In Equation (4), n represents the factor that must satisfy the constraint (5):
nmin ≤ n ≤ nmax
In this paper, nmin was set to a value of 0, and nmax was set to a value of 11.
2.2.3. Permitted Power Factor of Existing DG
Various types of DG generators have different operational constraints for the capability of reactive power generation and absorption [23]. Since the DG in the presented network is hydropower, the synchronous generator is considered. Therefore, the permitted power factor of the existing DG used in this paper ranges from 0.85 lagging to 1.0 p.u. and from 0.95 leading to 1.0 p.u. in steps of 0.005.
2.2.4. Current Magnitudes
The magnitude of the current that flows through all lines and transformers must satisfy the following constraint:
Iit ≤ In
In Equation (6), Iit stands for the current of the ith branch in the time interval t, and In is the nominal current of each branch.
2.3. Power Demand Modeling and Distribution System Model Used for Voltage Rise Issue Analysis
The analysis was conducted using a model based on a segment of the actual distribution network supplied from the transformer station 110/35 kV Delnice. From this substation, two other substations are taken for analysis. The substations are supplied through two separate feeders.
The distribution system model is shown in Figure 1. The substation TS 35/20 kV Kupjak is supplied through an underground cable, while the substation TS 35/20 kV Gerovo is supplied through a 35 kV overhead line. The transformer station 110/35 kV Delnice has a transformer installed with an on-load tap changer, which sets the secondary side voltage at 36.75 kV, corresponding to 1.05 p.u. Therefore, the voltage in the 20 kV distribution networks is also initially set to 21 kV, corresponding to 1.05 p.u. The voltage is set to 1.05 p.u. because a lower set voltage could result in excessively low voltages in some other parts of the distribution networks that are also supplied from TS 110/35 kV Delnice. Therefore, the voltage sought to be achieved by objective function (1) during the mitigation of excessive voltage rises is 1.05 p.u.
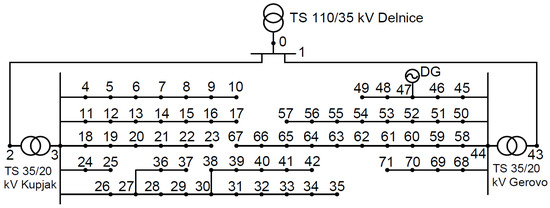
Figure 1.
Distribution system model used for analysis.
In addition to the two transformers, the model of the network includes 69 distribution lines with a total length of 252 km, the majority of which are underground cable lines.
Power demand is modeled in nodes 4–42 and 45–71, based on maximum active and reactive power in each node and real measured data for overall daily power demand in the presented network. The maximum power in each node is shown in Table 1.

Table 1.
Maximum active and reactive power in nodes that create power demand.
The normalized power demand curves are shown in Figure 2. To obtain these curves, the active power demand was measured in TS Gerovo and TS Kupjak in the period from 22 January 2023 to 21 July 2023. This six-month period is well suited for analysis as it includes both high and low consumption periods, making it a sufficiently robust dataset for representing the method. The data was obtained from the SCADA system, which provides the average active power consumption for each hour for all days within the specified period.
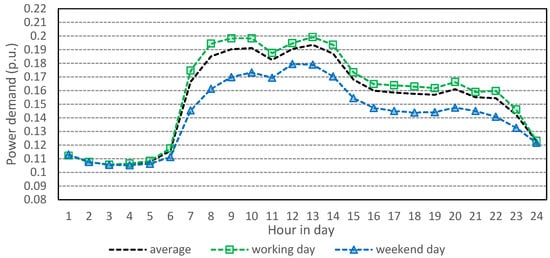
Figure 2.
Normalized power demand curves.
In this paper, the average curve shown in Figure 2 was used. The working day and weekend day curves are similar. Using an average curve is sufficient to present the method effectively. However, due to fluctuations in power consumption throughout the week, it is expected that voltage levels during weekends might be slightly higher than anticipated. Consequently, if the algorithm were to base its operation on the weekend day curve, it would likely decide on a slightly higher delivery of reactive power, either through increased deployment of ShRs or increased reactive power that the DG absorbs.
For even more accurate results, further segmentation could be considered by differentiating between weekdays and weekends. This would enable a more precise representation of power demand fluctuations throughout the week.
For each hour, the average power demand for the whole distribution system was calculated using the following equation:
In Equation (7), Pmeasured_totalt represents the total measured power demand of the whole distribution system during time interval t (including measurements from both substations). Pi_max represents the maximum allowed power demand in node i, while Ni represents the number of nodes.
In this paper, the demand changes in every node on an hourly basis, according to the curve. The active and reactive power demand at each node for time interval t is calculated as follows:
In Equation (9), tanφ is determined based on the chosen value for cosφ, which, in this paper, was 0.95. Therefore, the maximum reactive power in Table 1 represents the maximum reactive power of that value of cosφ.
2.4. Distribution Line Modeling, Data, and Voltage Rise Calculation
In this paper, the “backward/forward sweep” algorithm described in [24] was used for modeling distribution lines and load flow calculations. Matlab, Version R2015A, a widely used software platform known for its capabilities in numerical analysis, data processing, and visualization, was employed for implementing both the load flow calculation and the optimization algorithm and for processing the experimental results.
The distribution line model is shown in Figure 3. The longitudinal branch contains the distribution line series resistance RDLi and the series inductive reactance XDLi. Since the distribution system model contains distribution lines of two voltage levels, all series line impedances were reduced to the 21 kV voltage level. Real and reactive power Pi, Qi, Pi−1, and Qi−1 are calculated using the load flow algorithm from PPi, QPi, PP,i−1, and QP,i−1, which represent the active and reactive power demand in starting node i−1 and end node i.
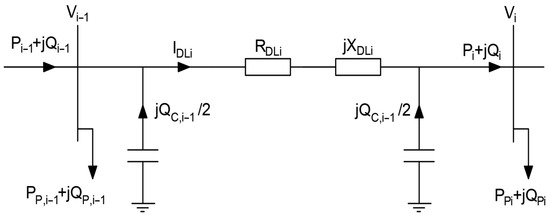
Figure 3.
Distribution line model.
The model also contains parallel branches, which are introduced to model the capacitive currents that underground distribution lines create. For each line, one part of that reactive power is added to the distribution line starting node and the other half to the distribution line end node. The reactive power is calculated using Equation (10).
In Equation (10), Ci represents the capacitance of the ith distribution line, Ui represents system voltage, and represents the phase angle of the voltage.
The current that flows through the distribution transformer and creates voltage rises or drops is calculated using Equation (11).
In Equation (10), QCi represent the reactive power of the parallel branch of ith distribution line.
The voltage rise on the distribution line is calculated using Equation (12):
In Equation (12), represent the voltage in the node at the beginning of the ith distribution line and the voltage at the end of the distribution line. RDLi and and XDLi represent the serial resistance and reactance of the ith distribution line, respectively. Distribution line lengths are shown in Table 2, and other data are shown in Table 3.

Table 2.
Distribution lines’ length.

Table 3.
Distribution lines’ data.
2.5. Distribution Transformers’ Modeling, Data, Voltage Rise Calculation, and Importance in Analysis
Two distribution transformers are integrated into the model because most voltage rises are expected to occur at the transformers. The transformer model is shown in Figure 4, and transformer data are shown in Table 4.
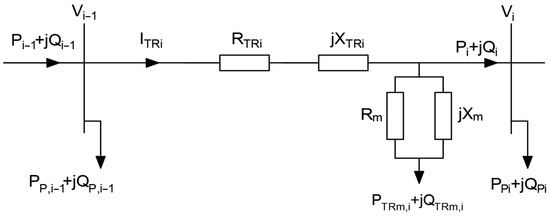
Figure 4.
A distribution transformer model.

Table 4.
Distribution transformer data.
The series resistance RTRi and the series inductive reactance of the distribution transformer XTRi have the largest impact on voltage rises and voltage drops that occur. The series resistance and reactance could be calculated as follows:
The aforementioned impedance values of the transformers were calculated for the nominal voltage value of 21 kV because this voltage is the voltage on the secondary side of the two transformers in the actual network. Additionally, all the line impedances were recalculated for the same voltage. In Equations (13)–(15), Sn represents the transformer installed power, PCu denotes transformer copper loss, and uk is the transformer short-circuit voltage.
The current that flows through the distribution transformer and creates voltage rises or drops is calculated using Equation (16):
PTRm,i and QTRm,i represent active and reactive power in the parallel branch of the transformer, where PTRm,i is obtained from the transformer open-circuit test and QTRm,i is calculated as follows:
In Equation (18), i0% stands for the transformer open-circuit current, and In denotes the transformer nominal current.
The voltage rise in the power transformer is calculated using Equation (19):
Based on Equations (13) and (15) and the distribution transformer data shown in Table 4, the serial impedance of the distribution transformer TS 35/20 kV Kupjak can be calculated to be 0.324 + j3.845 [Ω] and the impedance of the distribution transformer TS 35/20 kV Gerovo to be 0.684 + j6.58 [Ω]. If we compare these impedances with the impedances of the distribution lines given in Table 3, we can conclude that the transformer reactances are larger. We can also conclude that the reverse power flow through distribution transformers is larger because it contains the sum of the reverse power flows from all distribution lines after the transformer. Therefore, from Equation (19), used for the calculation of the voltage rise in the transformer, we can conclude that the voltage rise in the transformer will have a significant impact on the overall voltage rise in the distribution system at all nodes located after the distribution transformer.
From Equation (19), we can see that voltage rises could be decreased by decreasing the reverse reactive part of the current by using shunt reactors and the power factor control of DGs.
2.6. Distributed Generation Unit Data
In this paper, one existing DG with a constant power output is considered with a connection at node 47. The installed power of this DG is 2500 kW.
2.7. Concise Theory and Specific Advantages of Genetic Algorithms
The genetic algorithm (GA) was chosen for the optimization. GA is a computational method inspired by natural selection and genetics, initially proposed by John Holland in the 1960s and further developed by researchers such as David Goldberg. GA simulates the process of natural evolution to efficiently solve optimization and search problems.
At the core of GA is a population of potential solutions, represented as chromosomes encoding candidate solutions. The algorithm iteratively evolves this population over generations, guided by principles akin to biological evolution.
The iterative process of the genetic algorithm begins with an initial population of chromosomes:
Each chromosome represents a potential solution to the problem at hand. These chromosomes undergo evaluation, where their fitness is assessed based on an objective function defined by the problem domain. This fitness evaluation determines how well each chromosome solves the problem and guides the selection process. During selection, chromosomes with higher fitness are more likely to be chosen as parents for the next generation. Various selection methods, such as roulette wheel selection or tournament selection, are employed to determine which chromosomes proceed to the next stage. Selected parent chromosomes undergo crossover, where genetic material (genes) is exchanged to create offspring. Crossover points are randomly selected to maintain genetic diversity within the population. Additionally, GA introduces occasional mutations, where random changes are applied to offspring chromosomes. This mutation process promotes the exploration of new solutions and prevents premature convergence to suboptimal solutions. After generating offspring through crossover and mutation, the algorithm replaces less fit individuals in the current population with these new offspring. Elitism strategies may be employed to ensure that the best-performing individuals survive across generations, maintaining the population’s overall fitness. The iterative process continues until a termination criterion is met, such as reaching a maximum number of generations or achieving convergence where further improvement is unlikely.
GA was chosen because each solution of optimization in this research has 40 optimization variables, and GA is particularly effective in tackling intricate combinatorial problems with a large number of optimization variables [25]. Therefore, one of the main advantages is that genetic algorithms excel at exploring solution spaces and finding global optimal solutions, which is crucial in complex optimization problems where the search space is large or uneven. Another benefit is that by combining global exploration through selection and crossover with local exploration through mutation, genetic algorithms strike a balance between intensive and extensive search, often yielding superior results compared to metaheuristics focused solely on one aspect of search. Genetic algorithms can be easily adapted to meet specific optimization problem requirements, such as different types of constraints or multi-objective optimization, ensuring their wide applicability.
2.8. Implementation of an Optimization Algorithm for Allocation of Shunt Reactors and Hourly DG Power Factor Recommendation
The optimization variables for one solution of the optimization algorithm are shown in Table 5. The process of optimization is shown in Figure 5, and the optimization process is similar to the GA optimization process described in [26].

Table 5.
Genetic algorithm optimization variables.
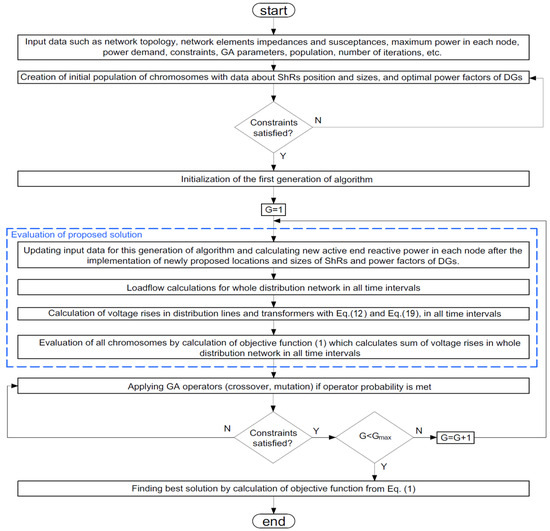
Figure 5.
Genetic algorithm flowchart.
The algorithm starts with inputting data about distribution network topology, network element impedances and susceptances, maximum power at each node, power demand, constraints, and genetic algorithm parameters such as population size, number of generations, and operator factors. The value of the chosen crossover factor is 0.9, and the chosen mutation factor is 0.1.
The first step is the creation of an initial population of chromosomes with data about proposed positions and sizes for shunt reactors and optimal power factors of DGs, if applicable. All proposed solutions for all chromosomes must adhere to the constraints described in Section 2.2.1, Section 2.2.2, Section 2.2.3 and Section 2.2.4 of this paper. After that, the first generation of the algorithm is initiated. For the proposed solution for the ShRs and power factors of DGs, the new data about active and reactive power in each node is calculated. Then, load flow calculations are made using a backward–forward sweep algorithm for the whole distribution network at all time intervals. After that, voltage rises are calculated for all distribution lines and transformers using Equations (12) and (19). Then, all chromosomes are evaluated using the calculation of the objective function given in Equation (1), which calculates the overall sum of voltage rises in the whole distribution network in all time intervals. After that, genetic algorithms apply crossover and mutation operators if the probability of each operator is met. All proposed solutions for all chromosomes after applying crossover and mutation factors must adhere to the constraints described in Section 2.2.1, Section 2.2.2, Section 2.2.3 and Section 2.2.4 of this paper.
The process repeats until the last generation of the algorithm is executed. After that, the algorithm finds the best solution by calculating the objective function given in Equation (1).
2.9. Comparision with Other Established Methods for Voltage Rise Mitigation
This study proposes a novel approach for addressing voltage rise issues in distribution networks through a comprehensive methodology that integrates various contributing factors into a unified solution. By accurately modeling the entire system, including medium-voltage lines, distribution transformers, and the effects of low power demand and long underground cable lines, the method aims to mitigate voltage rises effectively across multiple voltage levels. Existing methods typically focus on mitigating voltage rises at single voltage levels, whereas our approach uniquely addresses these challenges across multiple voltage levels of the distribution network.
Unlike traditional approaches that may focus on singular aspects such as shunt reactors or power factor control alone [19], this method combines the allocation of fixed shunt reactors with hourly power factor control of distributed generators (DGs). This integrated approach ensures a more balanced reduction in voltage rises by effectively managing reactive power flows at critical nodes. The study emphasizes the role of distribution transformers in voltage rise occurrences, showing that significant voltage rises often occur at these points due to reverse reactive power flows. This insight underscores the importance of modeling transformers to effectively tackle voltage rise challenges, a perspective that distinguishes this study from the existing literature.
2.10. Cost Analysis of Shunt Reactor Deployment
The existing studies on the installation of shunt reactors [18,19,20] have excluded a comprehensive cost–benefit analysis. Shunt reactors are typically installed in power grids, facing issues with excessive reverse flows of reactive power. Installing compensating shunt reactors is a necessary solution to mitigate these reverse flows. An alternative would be to deactivate the cables, generating these reverse flows and connecting existing consumers via new overhead lines. However, such an approach is often not economically viable compared to the installation of shunt reactors.
According to [27], an MV aluminum conductor with a cross-sectional area of 185 mm², which is the most prevalent in the network in our study, generates a capacitive reactive power of 34.2 kVAr/km. This means that to reduce the capacitive reactive power by 1 MVAr, approximately 29.24 km of the mentioned cable would need to be removed and replaced with overhead lines. According to [28], the construction cost of overhead lines would amount to at least USD 62,150 per kilometer. Therefore, the construction of a 29.24 km overhead line needed to remove a 29.24 km cable line could cost around USD 1.8 million.
According to [29], the cost of installing shunt reactors is USD 54,000/MVAr. Therefore, installing 1 MVAr of shunt reactors at an approximate cost of USD 54,000 would present a much more cost-effective solution compared to alternatives, such as replacing a 29.24 km cable with overhead lines, which could cost around USD 1.8 million.
3. Results
3.1. Cases Studied
The simulations were made to demonstrate the effectiveness of the proposed method for mitigating voltage rises by allocating shunt reactions and using the hourly recommended power factors of the DG unit. The simulation was made for a single objective function for voltage profile improvement based on the fitness function given in Equation (1).
To compare the results, three simulation cases were considered. Before applying the method, load flow calculations were made for the initial network state without connected shunt reactors and with the existing DG unit working at unity power factor. Then, in Case 1, the algorithm recommended the hourly power factor of the existing DG without connecting new shunt reactors. In Case 2, the algorithm allocated and sized up to eight shunt reactors without hourly power factor control of the existing DG. Finally, in Case 4, the algorithm used both new shunt reactors and hourly power factor control of the DG.
3.2. Results and Comments
The results for the locations and sizes of new shunt reactors for various cases are shown in Table 6. The results for recommended DG power factors for previously installed DG units are shown in Table 7.

Table 6.
Allocation of shunt reactors.

Table 7.
Recommended DG power factors.
In Case 1, voltage mitigation is achieved only by controlling the power factor of one DG installed in part of the distribution network powered by TS 35/20 kV Gerovo in nodes 45 to 71. The algorithm in all parts of the day proposed the maximum leading power factor of 0.95. With this power factor, the existing DG behaves as a consumer of excessive reactive power. However, since the DG produces 2.5 MW of real power, with a leading power factor of 0.95, the DG unit can consume only around 0.84 MVAr of reactive power. Figure 6 shows the overall reactive power in branch 44 of the power transformer in TS 35/20 kV Gerovo. The large reverse reactive power flow is partially reduced, but is still high.
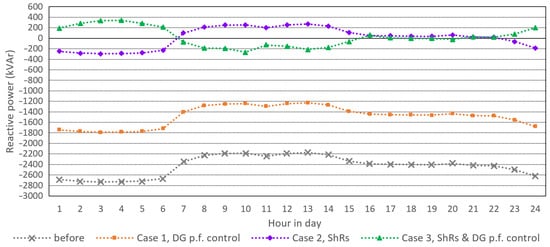
Figure 6.
Reactive power in branch 44 of the TS Gerovo transformer.
Therefore, the voltage rise is slightly mitigated, as shown in Figure 7, which shows the voltage in the whole distribution network at 3 AM. In nodes 45 to 71, which are powered from TS 35/20 kV Gerovo, the maximum voltage rise is reduced, but only from 1.13 p.u. to 1.11 p.u. The voltage at the end of MV line 43 is around 1.07 p.u., which shows that even the voltage rise issue in that MV line is not fixed. The voltage in nodes 2 to 42 is not affected because changing the power factor of the DG unit in node 47 does not have an impact on that part of the distribution network.
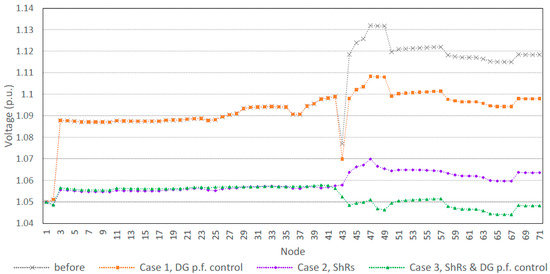
Figure 7.
Voltage profile for nodes 1–71 at 3 AM.
In Case 2, the algorithm proposed the locations and sizes of new shunt reactors, but without power factor control of the existing DG. The algorithm recommended the allocation of shunt reactors with a total installed power of 5.2 MVAr. Figure 7 shows that the voltage magnitudes at all nodes are significantly reduced. The maximum voltage rise is 1.07 p.u. and the voltage at all nodes is near the desired magnitude of 1.05 p.u. Figure 8 shows the voltage in node 44 on the secondary side of the transformer in TS 35/20 kV Gerovo. The voltage in this case is within the range of 1.04 p.u. to slightly above 1.06 p.u., which is much better than in Case 1.
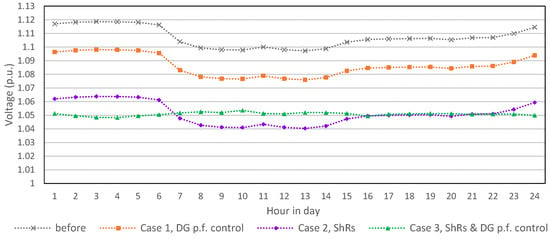
Figure 8.
Voltage at node 44 on the secondary side of TS 35/20 kV Gerovo at 3 AM.
In Case 3, the algorithm proposed the locations and sizes of new shunt reactors and also the optimal power factor of the existing DG, as shown on Figure 9. The algorithm recommended the allocation of shunt reactors with a total installed power of 6.2 MVAr. The algorithm proposed a lagging power factor of the existing DG in the range of 0.85 to 0.975 p.u., as shown in Figure 8.
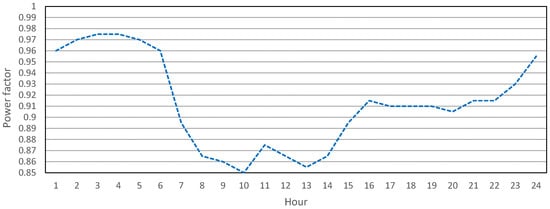
Figure 9.
Proposed DG power factor for Case 3.
The combination of new shunt reactors and DG power factor control achieved the best results in voltage rise mitigation. Figure 7 shows that the voltage in all nodes in Case 3 is very close to the desired 1.05 p.u. at 3 AM. Figure 8 shows that the voltage in node 44, on the secondary side of the transformer in TS 35/20 kV Gerovo, is very close to the desired value of 1.05 p.u at all times of the day.
To summarize, Figure 6 shows the reactive power flow in branch 44 at the TS 35/20 kV Gerovo transformer. In Case 1, voltage rise mitigation adjusted the DG power factor, resulting in a modest reduction in the reverse reactive power flow. Cases 2 and 3 achieved significant reductions in reactive power flows through the deployment of SHRs, with Case 3 also optimizing DG power factor control. Figure 7 displays the voltage profile of the whole network at 3 A.M. In Case 1, adjusting DG power factors slightly reduced the voltage rises to around 1.11 p.u. Case 2, using SHRs, saw voltages peak at 1.07 p.u. Case 3, with SHRs and optimized DG factors, maintained stable voltages of around 1.05 p.u. across all nodes. Figure 8 shows the voltage at node 44 on the secondary side of TS 35/20 kV Gerovo at 3 AM. Case 1 limits voltage to 1.1 p.u., Case 2 ranges between 1.04 to slightly above 1.06 p.u., and Case 3 is near the desired 1.05 p.u. Figure 9 illustrates the proposed DG power factor for Case 3, ranging from 0.85 to 0.975 p.u., as recommended by the algorithm.
3.3. The Importance of Modeling Distribution Transformers in Voltage Rise Analysis
Figure 10 shows part of the distribution network, which includes one 35 kV overhead line between nodes 1 and 43, one 35/20 kV distribution transformer between nodes 43 and 44, and five 20 kV distribution lines from node 44 to node 49.
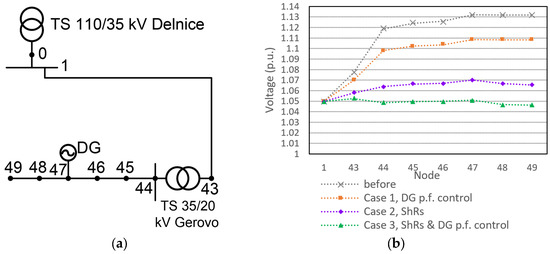
Figure 10.
Part of the distribution network (a) and the voltage profile in that part of the network (b).
Without the implementation of the presented method, it is notable (Figure 10b) that the overall voltage rise from the start to the end node of this part of the distribution network is approximately 0.08 p.u. The voltage rise in the 35 kV line between nodes 1 and 43 is approximately 0.03 p.u. The voltage rise in the 35/20 kV distribution transformer between nodes 43 and 44 is 0.04 p.u. The voltage rise in the 20 kV part of the distribution network between nodes 44 and 49 is 0.01 p.u. It is clear that the voltage rise in the distribution transformer represents approximately half of the overall voltage rise. It is also important to note that the voltage rise in the distribution transformer is caused not only by reverse power flows from the distribution network between nodes 44 and 49 but also by reverse power flows from all other distribution lines that are modeled after that distribution transformer. The results for Cases 1 to 3 show that with the implementation of the presented method, the voltage rises decreased. In Case 3, the algorithm even recommended a small voltage drop in the distribution transformer in order to keep the voltage in the remaining part of the network close to the desired one. Therefore, modeling distribution transformers is very important in voltage rise analysis.
4. Conclusions
This paper proposed a novel general approach for analyzing and mitigating voltage rise issues in distribution networks where the entire system is accurately modeled and various elements that contribute to voltage rises are unified into a single method for the mitigation of voltage rises on multiple voltage levels of a distribution network. The proposed method may prove beneficial in the analysis and mitigation of voltage rises caused by low power demand and very long underground cable lines, which create a significant amount of reverse reactive power flow. The primary objective of this paper was to reduce voltage rises. The proposed method has been demonstrated in the analysis of voltage rise issues within a real distribution network operating under these conditions, with a focus on exploring potential solutions.
The distribution system model used in this paper contains MV lines at two voltage levels and distribution transformers that are connections between these two voltage levels. Through simulations, it was established that by implementing hourly power factor control of the DG unit, voltage rise issues could be mitigated. The maximum voltage rise was reduced, but only from 1.13 p.u. to 1.11 p.u., during a critical part of the day when the demand is lowest. Another case showed that precise allocation and sizing of fixed shunt reactors can also decrease reactive power flows and reduce voltage rises. The maximum voltage rise during a critical part of the day was reduced from 1.13 p.u. to 1.07 p.u.
The best results in the mitigation of voltage rises are achieved by combining the allocation of new shunt reactors and the control of the power factor of the existing DG. In this case, the voltage in all nodes in the part of the network with the installed DG is held very close to the set value of 1.05 p.u. The fixed shunt reactor consumes a large amount of reactive power, while changing the DG power factor precisely injects the remaining reactive power of the DG unit, through which the transformer voltage is controlled during different time intervals.
The scientific innovations of this paper are summarized as follows:
- (1)
- In this paper, we proposed the use of a new method for an improved approach to evaluating voltage rise, where the entire system is more accurately modeled and various elements that contribute to voltage rise are unified into a single method for the mitigation of voltage rises. In addition to the usual modeling of distribution lines, the method precisely models transformers due to their significance for voltage rises. It also models distribution lines at two voltage levels, not just at one. The method also unifies and accurately models the components of distribution lines responsible for creating reverse flows of capacitive reactive power, particularly the parallel branches that inject capacitive reactive power.
- (2)
- Unlike traditional methods that often address voltage rise issues in isolation or at a single voltage level, our method provides an integrated approach that considers multiple voltage levels and unifies various mitigation elements into a coherent strategy. This holistic modeling significantly enhances the accuracy and effectiveness of voltage rise mitigation.
- (3)
- In the analysis of voltage rises caused by low power demand and long underground cable lines that generate reverse reactive power flows, it is important to model distribution transformers because the transformers are the location where voltage rise predominantly occurs. The research showed that in the selected network example, which is based on a real distribution network, in the moments of the highest voltage increase, half of the voltage rise occurs in the transformer.
- (4)
- It is possible to mitigate voltage rises with the use of shunt reactors or DG power factor control. The research results based on a real example showed that the voltage at 3 a.m. could be decreased from 1.13 to 1.11 p.u. with DG power factor control and from 1.13 to 1.07 p.u. with shunt reactors. However, the best results are achieved by combining the allocation of new shunt reactors and hourly control of the power factor of DGs. In this case, the highest voltage is decreased very close to the desired value of 1.05 p.u. The best results in mitigation of voltage rises are achieved by using a fixed shunt reactor that consumes a large amount of reactive power and changing the DG power factor to precisely inject the remaining reactive power of the DG unit.
Future research should include testing the obtained results using other optimization techniques and focus on influencing voltage rise prevention during the development planning of distribution networks. Strategies such as reducing the cross-sectional area of cable conductors to minimize transverse capacitance and planning overhead lines can effectively decrease reverse capacitive currents, thereby mitigating voltage rises without the need for additional investments in ShRs or DG power factor control. Moreover, evaluating the impact of integrating new DGs on voltage conditions and optimizing their integration into existing networks are important areas for further investigation. Exploring network reconfiguration possibilities also offers promising avenues for reducing voltage rises in distribution systems. Additionally, it is necessary to investigate how excess reverse reactive power affects higher-level transmission networks. Given that during the analysis of this study, the authors noted frequent instances of elevated input voltages from the transmission network, voltage rise represents a problem that extends across multiple voltage levels and should thus be addressed accordingly. This study provides a solution for analyzing the voltage rise issue on multiple voltage levels of a network.
Author Contributions
Conceptualization, D.Ć., J.Ž. and V.K.; software, D.Ć.; methodology, D.Ć.; formal analysis, D.Ć. and J.Ž.; data curation, D.Ć.; writing—original draft, D.Ć.; writing—review and editing, D.Ć.; visualization, D.Ć.; supervision, V.K. All authors have read and agreed to the published version of the manuscript.
Funding
This research received no external funding.
Data Availability Statement
The data are contained within the article.
Conflicts of Interest
The authors declare no conflict of interest.
References
- Yang, S.; Zhou, W.; Zhu, S. Failure probability estimation of overhead transmission lines considering the spatial and temporal variation in severe weather. J. Mod. Power Syst. Clean Energy 2019, 7, 131–138. [Google Scholar] [CrossRef]
- Souto, L.; Santoso, S. Overhead Versus Underground: Designing Power Lines for Resilient, Cost-Effective Distribution Networks under Windstorms; Resilience Week (RWS): Salt Lake City, UT, USA, 2020; pp. 113–118. [Google Scholar] [CrossRef]
- Marot, A.; Kelly, A.; Naglic, M.; Barbesant, V.; Cremer, J.; Stefanov, A.; Viebahn, J. Perspectives on Future Power System Control Centers for Energy Transition. J. Mod. Power Syst. Clean Energy 2022, 10, 328–344. [Google Scholar] [CrossRef]
- Karki, U.; Gunasekaran, D.; Fang, Z.P. Reactive compensation of overhead AC transmission lines using underground power cables. In Proceedings of the 2015 IEEE Power & Energy Society General Meeting, Denver, CO, USA, 26–30 July 2015; pp. 1–5. [Google Scholar] [CrossRef]
- Ferreira, P.D.F.; Carvalho, P.M.S.; Ferreira, L.A.F.M.; Ilic, M.D. Distributed Energy Resources Integration Challenges in Low-Voltage Networks: Voltage Control Limitations and Risk of Cascading. IEEE Trans. Sustain. Energy 2013, 4, 82–88. [Google Scholar] [CrossRef]
- Markiewicz, H.; Klajn, A. Voltage Disturbances Standard EN50160—Voltage Characteristics of Electricity Supplied by Public Electricity Networks; Wroclaw University of Technology: Wrocław, Poland, 2004. [Google Scholar]
- Tonkoski, R.; Turcotte, D.; EL-Fouly, T.H.M. Impact of High PV Penetration on Voltage Profiles in Residential Neighborhoods. IEEE Trans. Sustain. Energy 2012, 3, 518–527. [Google Scholar] [CrossRef]
- Raval, D.Y.; Pandya, S.N. Phase Shifting Strategy for Mitigation of Local Voltage Rise in Highly PV Penetrated Distribution Network. In Proceedings of the 2021 9th IEEE International Conference on Power Systems (ICPS), Kharagpur, India, 16–18 December 2021; pp. 1–6. [Google Scholar] [CrossRef]
- Wang, J.; Zhou, N.; Ran, Y.; Wang, Q. Reducing the active power curtailment of distributed generation based on soft open points in unbalanced distribution networks. IET Renew. Power Gener. 2020, 14, 3252–3258. [Google Scholar] [CrossRef]
- Singh, R.K.; Goswami, S.K. Optimum allocation of distributed generations based on nodal pricing for profit, loss reduction, and voltage improvement including voltage rise issue. Int. J. Electr. Power Energy Syst. 2010, 32, 637–644. [Google Scholar] [CrossRef]
- Mufaris, A.L.M.; Baba, J.; Yoshizawa, S.; Hayashi, Y. Determination of dynamic line drop compensation parameters of voltage regulators for voltage rise mitigation. In Proceedings of the 2015 International Conference on Clean Electrical Power, Taormina, Italy, 16–18 June 2015; pp. 319–325. [Google Scholar] [CrossRef]
- Alam, M.J.E.; Muttaqi, K.M.; Sutanto, D. Distributed energy storage for mitigation of voltage-rise impact caused by rooftop solar PV. In Proceedings of the 2012 IEEE Power and Energy Society General Meeting, San Diego, CA, USA, 22–26 July 2012; pp. 1–8. [Google Scholar] [CrossRef]
- Then, J.; Agalgaonkar, A.P.; Muttaqi, K.M. Coordinated Charging of Spatially Distributed Electric Vehicles for Mitigating Voltage Rise and Voltage Unbalance in Modern Distribution Networks. IEEE Trans. Ind. Appl. 2023, 59, 5149–5157. [Google Scholar] [CrossRef]
- Jasni, J.; Mohd Radzi, M.A.; Azis, N. Novel Reactive Power Control Technique for Mitigating Voltage Rise in Distribution Network with High Pv Penetration; SSRN: Rochester, NY, USA, 2023; Available online: https://ssrn.com/abstract=4661084 (accessed on 22 June 2024).
- Xie, S.; Kaneko, A.; Hayashi, Y. A Decentralized Voltage Regulation Scheme Using Improved Volt-Var Function of PV Smart Inverter. IEEJ Trans. Electr. Electron. Eng. 2024. [Google Scholar] [CrossRef]
- Omar, M.A.; Hamdan, A. Control strategy of battery inverter for voltage profile improvement in low voltage networks with high PV penetration level. Int. J. Power Energy Convers. 2024, 15, 25–41. [Google Scholar] [CrossRef]
- Waswa, L.; Chihota, M.J.; Bekker, B. Coordinated deployment of electric minibus taxis to enhance solar photovoltaic hosting capacity of residential networks. In Proceedings of the 27th International Conference on Electricity Distribution (CIRED 2023), Rome, Italy, 12–15 June 2023; pp. 3939–3943. [Google Scholar] [CrossRef]
- Song, S.-H.; Kim, S.-B. Coordinated Reactive Power Control with a Variable Shunt Reactor and an Inverter-Based Wind Power Plant. Energies 2022, 15, 4739. [Google Scholar] [CrossRef]
- Sithole, S.; Mbuli, N.; Pretorius, J. Voltage regulation in the douglas area using shunt capacitor banks and controllable shunt reactors. In Proceedings of the 2013 13th International Conference on Environment and Electrical Engineering (EEEIC), Wroclaw, Poland, 1–3 November 2013; pp. 85–90. [Google Scholar] [CrossRef]
- Teshome, D.F.; Xu, W.; Bagheri, P.; Nassif, A.; Zhou, Y. A Reactive Power Control Scheme for DER-Caused Voltage Rise Mitigation in Secondary Systems. IEEE Trans. Sustain. Energy 2019, 10, 1684–1695. [Google Scholar] [CrossRef]
- Hu, J.; Yuan, P.; Li, X.; Liu, Y. Analysis on the Necessity of High-Voltage Shunt Reactors in Power Grid. In Proceedings of the 2020 10th International Conference on Power and Energy Systems (ICPES), Chengdu, China, 25–27 December 2020; pp. 83–87. [Google Scholar] [CrossRef]
- Bryantsev, A.; Dorofeev, V.; Zilberman, M.; Smirnov, A.; Smolovik, S. Magnetically Controlled Shunt Reactor Application for AC HV and EHV Transmission Lines; CIGRE: St. Petersburg, Russia, 2006; pp. 1–8. [Google Scholar]
- Pereira, B.R.; da Costa, G.R.M.; Contreras, J.; Mantovani, J.R.S. Optimal Distributed Generation and Reactive Power Allocation in Electrical Distribution Systems. IEEE Trans. Sustain. Energy 2016, 7, 975–984. [Google Scholar] [CrossRef]
- Prenc, R.; Škrlec, D.; Komen, V. A novel load flow algorithm for radial distribution networks with dispersed generation. Technol. Gazzete 2013, 20, 969–977. [Google Scholar]
- Prenc, R.; Škrlec, D.; Komen, V. Distributed generation allocation based on average daily load and power production curves. Int. J. Electr. Power Energy Syst. 2013, 53, 612–622. [Google Scholar] [CrossRef]
- Ćetković, D.; Komen, V. Optimal Distributed Generation and Capacitor Bank Allocation and Sizing at Two Voltage Levels. IEEE Syst. J. 2023, 17, 5831–5841. [Google Scholar] [CrossRef]
- Vlahinić, S.; Franković, D.; Komen, V.; Antonić, A. Reactive Power Compensation with PV Inverters for System Loss Reduction. Energies 2019, 12, 4062. [Google Scholar] [CrossRef]
- Miranda, L.; Mueller-Stoffels, M.; Whitney, E. An Alaska case study: Electrical transmission. J. Renew. Sustain. Energy 2017, 9, 061702. [Google Scholar] [CrossRef]
- Grup Arge, Energy and Control Systems 2023/1 Price List. Available online: https://www.gruparge.com/wp-content/uploads/2023/02/grup-arge-price-list-2023.pdf (accessed on 22 June 2024).
Disclaimer/Publisher’s Note: The statements, opinions and data contained in all publications are solely those of the individual author(s) and contributor(s) and not of MDPI and/or the editor(s). MDPI and/or the editor(s) disclaim responsibility for any injury to people or property resulting from any ideas, methods, instructions or products referred to in the content. |
© 2024 by the authors. Licensee MDPI, Basel, Switzerland. This article is an open access article distributed under the terms and conditions of the Creative Commons Attribution (CC BY) license (https://creativecommons.org/licenses/by/4.0/).