Article

A Dynamic Analysis of Biomethane Reforming for a Solid Oxide Fuel Cell Operating in a Power-to-Heat System Integrated into a Renewable Energy Community

by
Francesco Calise
,
Francesco Liberato Cappiello
,
Luca Cimmino
* and
Maria Vicidomini
Department of Industrial Engineering, University of Naples Federico II, 80125 Naples, Italy
*
Author to whom correspondence should be addressed.
Energies 2024, 17(13), 3160; https://doi.org/10.3390/en17133160
Submission received: 22 May 2024 / Revised: 17 June 2024 / Accepted: 24 June 2024 / Published: 27 June 2024

Abstract

:
This paper aims to develop a dynamic simulation model for the reduction of energy consumption through the use of organic waste from a residential district, supplied by a hybrid renewable energy plant. The proposed layout is based on a novel paradigm of a renewable energy community focused on the biocircular economy and a sustainable approach. The novelty with respect to the majority of papers developed in the literature on renewable energy communities lies in the use of both solar photovoltaic production and the organic fraction of municipal solid waste collected by the community. Energy production by biomass conversion and by photovoltaic fields shared among the buildings is used to satisfy in a sustainable manner the community loads for heating, cooling, and power. The district heating network is based on water loop heat pumps and air-to-air heat pumps and it includes the power-to-heat energy storage strategy. The biogas produced by the anaerobic digestion process is cleaned in order to supply a solid oxide fuel cell for the production of additional power, mainly during the hours of poor or null solar energy production. Then, the layout integrates several innovative topics, such as the power-to-heat strategy, the biocircular economy, the low-temperature district heating, the use of a solid oxide fuel cell, and a renewable energy community. The dynamic model of the proposed hybrid renewable layout is developed in the TRNSYS environment, but some innovative energy components, such as anaerobic digestion, the biogas upgrading unit, and the solid oxide fuel cell, are dynamically modeled in MATLAB and then integrated into the whole plant model. The proposed plant has been confirmed to be extremely profitable and able to obtain important energy savings, considering the achieved payback period of 4.48 years and the primary energy saving of 23%. This layout resulted in an interesting solution for pushing the development of smart and sustainable cities.

1. Introduction

During the last decades, district heating and cooling systems have been coupled to electric systems by combined heat and power units supplied by natural gas [1]. However, in recent years, the significant increase in natural gas prices [2,3] due to the Ukrainian war has made the CHP plant operation particularly expensive. This has also corresponded to a significant vulnerability in the energy security of the UE [4]. Then, the current UE energy policies aim at considerably reducing importations of natural gas, also promoting the electrification of final user demand [5]. Among all the innovative solutions recently developed [6], electrification is seen as a key solution for reducing emissions, but only if paired with clean electricity generation [7], i.e., with renewable energy sources. Considering the highly intermittent renewable energy production, solutions based on the integration of multiple renewable energy sources are often selected. For example, hybrid systems based on the combination of both photovoltaic (PV) panels and wind turbine technologies are extremely attractive, since a more stable profile of the overall yearly electricity production can be achieved [8]. An interesting solution in this framework may be the use of the surplus of renewable energy used to produce green hydrogen [9] that is delivered to a fuel cell when the renewable energy source is not available. Other analyses have found that for increasing the levels of variable renewable electricity sources, electricity-consuming conversion units, such as heat pumps, are pivotal. In this framework, numerous studies investigated the integration of low-temperature district heating networks with heat pumps and other renewable energy sources [10], including geothermal, wind, biomasses, etc. [11]. In many cases, this innovative approach, referred to as fourth-generation district heating systems [12] or smart energy systems, considers energy synergy between energy production for space heating, cooling, and electricity purposes and user energy demand [13].
In the context of the local energy sharing of renewable production, even more renewable energy communities (RECs) [14,15] are considered a key solution to promote sustainable energy transition. According to the European Union Renewable Energy Directive (RED II) [16], RECs are legally established non-commercial entities with the main aim of obtaining energy, environmental, economic, and social advantages for the members of the community, sharing the renewable energy production. Commonly, European RECs include the sharing of renewable thermal energy production [17], renewable electric energy production [18], or both thermal and electric energy production [19]. Considering that high incentives for the members are guaranteed when RECs share electricity [20], the majority of studies are concentrated on PV panel fields and their integration into electric storage systems [21]. The diffusion of the RECs sharing electricity implies the total electrification of the building sector. However, several layouts consider RECs sharing electricity and simultaneously thermal energy among users by means of district heating and cooling networks (DHC) [22]. Renewable energy sources such as geothermal energy, solar energy, wind energy, and biomass represent the main efficient and sustainable fuel for supplying DH networks in order to obtain the sustainability of urban areas. In this framework, hybrid systems including the coupling of several renewable sources are also preferred. For example, a centralized solar and biogas hybrid heating system for rural areas is proposed by Chen et al. [23]. The authors propose an energy and exergy analysis mathematical model of the system on the MATLAB/Simulink platform. The capacity parameters’ effect on the system’s thermodynamic performance is evaluated. In addition, an economic and energy comparison of the hybrid system and the single solar or biogas system are compared and discussed. The energy efficiency of the hybrid heating system is 29.7%. The economic feasibility of the hybrid heating system is better than the feasibility of the conventional single solar heating system, considering that the payback period decreases by about 50%. Zwickl-Bernhard et al. [24] suggested two interconnected solutions in order to obtain the decarbonization of the urban district of Vienna. They proposed the expansion of a district heating network supplied by heat pumps and simultaneously the electrification of almost all energy facilities. An Italian REC based on PV rooftop systems coupled with a fifth-generation district heating and cooling network supplied by heat pumps was investigated by Vivian et al. [25]. Such a system is able to reduce CO2 emissions by approximately 72% and increase PV electricity self-consumption by 45%. Bartolini et al. [26] compared two layouts for enhancing the sharing of PV electric energy for a residential district: (i) the first layout includes the use of batteries; (ii) the second layout is based on the power-to-gas technology. In particular, this second layout based on a 2830 kWh hydrogen storage, 42 kWel cogeneration unit fueled by a natural gas–green hydrogen blend, and a 135 kWh battery system proved most effective. For a REC in the city of Bologna, Ancona et al. [27] investigated the option of using the PV excess production to supply a heat pump coupled with a district heating network during the winter season. The proposed REC was able to reduce CO2 emissions by up to 12% with respect to the reference case based on a district network supplied by a cogeneration unit.
As could be noted in the presented literature review, considering the significant and crucial push of penetrating policy actions in the European and Italian context, renewable energy communities have been investigated in detail in recent years. Nevertheless, the majority of works on this topic evaluate the common layout based on the integration of conventional PV fields within REC by focusing only on the electric load of the community. Conversely, very few papers consider the integration of further renewable energy sources in REC or the adoption of more recent technologies. For example, in ref. [28], the economic analysis of a biomass-based renewable energy community for a case study of Tirano Municipality (Northern Italy) is investigated. Here, a model for analyzing and optimally sizing the proposed renewable energy system serving the investigated REC is presented. Solar, biomass, and hydro sources are considered. The district heating network is served by a biomass-activated CHP system based on the organic Rankine cycle and biomass boilers, whereas the electric energy demand is provided by the CHP system, PV panels, and a small hydroelectric plant. The biomass used to activate biomass boilers is obtained from the maintenance of the local forest, sawmill waste, and pruning. Considering several proposed new scenarios, the result for this REC is that, considering that the thermal energy is sold at 49.2 euro/MWh, with a penetration of PV of 1000 kW and with a cogenerator working at full power load, the simple payback is equal to 5 years.

2. Methodology

In this work, we present energy production using the organic fraction of the municipal solid waste (OFMSW) of a specific REC for a hybrid and innovative system layout. The innovative hybrid system is developed in order to achieve a REC including the approach of sustainable bioeconomy [29,30] and waste-to-energy paradigm [31]. A renewable power plant based on local PV fields coupled with an innovative district network is proposed simultaneously with the energy production by the OFMSW of a residential district. The district network is based on water loop heat pumps and air-to-air heat pumps. The user in the district can share the surplus of renewable power production at the district scale. Solar renewable energy production is used to implement a power-to-heat energy storage strategy. The collected OFMSW is converted into biogas by an anaerobic digestion process [32]. The cleaned biogas is used to supply a solid oxide fuel in order to meet the power load of the district during the nighttime hours when the production of the PV fields is null. The heat pumps serving the district network are supplied by solar energy production excesses or by the electricity of a solid oxide fuel cell.

3. System Layout

The innovative bio-REC proposed in this work is compared with a novel layout of a REC integrating a DH system for P2H strategy.
Figure 1 shows the layout of the reference REC presented in this research. This layout is based on a REC in which each building is a participant in the community with its own PV field (PV-i) installed on the rooftop. The REC consists of a large district of 900 buildings. These buildings are clustered in four groups, each representing one specific combination of users. All the buildings participating in the community are connected to the same primary electric substation (SUB), where the power trades occur. When a building (Bi) has a renewable power production exceeding the load, the surplus power is shared among the users whose power load is greater than their PV (PV-i) production. The control strategies for the management of the SUB are discussed in detail in Section 4.
This layout also includes a DH network which provides thermal energy to meet the buildings’ space heating demand. In particular, the thermal energy to the water loop heat pumps (WLHPs) installed in the local substations is supplied by a hot water ring (HWR). Therefore, the HWR acts as a cold sink for the WLHPs operating in to supply heat to the buildings. Each building is equipped with one WLHP, which produces hot water that is supplied to the radiators installed in each apartment. More specifically, when the heating system is activated, the pump P-Li withdraws hot water from the top side of the water tank installed in the substation (TK-i). This hot water is supplied to the radiators. An accurate control strategy is applied to the tank top temperature (TTK-i,top). When TTK-i,top decreases below the lower bound value of 70 °C, the local water loop heat pump is activated to provide heat to the ring until the TTK-i,top reaches the upper value of 80 °C. In particular, the circulating pump P-WLHP,i supplies water to the condenser of the WLHP, which transfers heat to the condenser hot water loop. At the same time, the HWR provides hot water to the WLHP. The pump P-D supplies the water from the ring to the evaporators of the WLHPs. The operating temperature range of the ring lies between 25 °C and 45 °C. Therefore, the WLHPs operate at a very high temperature from the source side, achieving high values of the COP. This occurs despite the extremely high condensing temperatures of the WLHPs. The HWR is balanced by a thermal plant based on an air-to-water heat pump, operating with eight compressors activated in a cascade. Therefore, when the temperature of the THWR drops below the threshold value of 25 °C, the heat pump system (D-HP) is activated at the rated capacity, i.e., all the compressors are turned on, to increase the operating temperature of the ring. The D-HP is turned off exclusively when the THWR gets up to the value of 37 °C.
Once the energy trade among the users is performed and there is still a renewable power excess with respect to the load, the surplus electricity is supplied to the D-HP. D-HP is activated to further increase the temperature of the ring up to 45 °C. This way, the thermal inertia of the ring is exploited to store the PV power excess as thermal energy, according to the P2H strategy. The control strategies developed for the management of the DH network and the P2H strategy are discussed in Section 4.
The layout of the innovative REC proposed in this work is shown in Figure 2. The operating principle of the REC is the same as the one for the reference system presented above. In addition to the layout discussed earlier, this system also includes a solid oxide fuel cell (SOFC) operating as a cogenerator (CHP) to provide electricity and thermal energy to the district. The SOFC is fueled by biomethane produced from the upgrading of the biogas obtained by means of the anaerobic digestion of the OFMSW harvested from the same users of the REC within the district. The biogas is upgraded to biomethane by means of a selective membrane filter where the compressed flow rate of biogas is separated into carbon dioxide and methane. The biomethane obtained is supplied to the external reformer of the SOFC, which operates at a temperature close to 800 °C. Given the nearly constant biogas production of the anaerobic digester, the SOFC is constantly fed with biomethane, allowing steady-state operation of the device. The fuel cell operates as a CHP for the district. The renewable power produced by the SOFC is supplied to the users in the community and is always used due to the fact that the power production is lower than the baseload. The thermal energy produced by the SOFC is exploited with the same mechanism explained before regarding the D-HP. The heat transfer rate produced by means of the post-combustion (PC) of the exhaust gases of the fuel cell is sent to the DH ring through a gas–water heat exchanger. This heat recovery only occurs when the top temperature of the tank falls below the lower limit, i.e., 70 °C. When the power supplied by the SOFC is not sufficient to bring the top temperature of the tank up to the upper limit of 80 °C, the D-HP cascade system is activated. The complex internal heat recovery system of the SOFC is not shown in the layout for the sake of clarity, and only a simplified diagram is shown. More details are provided in ref. [33].

4. System Model

The model of the bio-REC was developed in TRNSYS 18 software [33], which is a widely acknowledged tool to simulate the dynamics of complex energy systems [34] based on renewable energy [35]. The model developed follows a general methodology which is widely adopted in the field of energy systems, making it replicable for general use by other researchers. To address different requirements and to be integrated into different case studies, the boundary conditions of the model must be necessarily modified. Modifying parameters and variables such as weather conditions, the design of components, and control strategy is perfectly feasible, making this kind of system open to a variety of case studies.

4.1. Renewable Energy Community Model

The concept of REC is based on the sharing of renewable power excess among a community of people who are consumers and prosumers of electricity.
The power excess of the single building of the REC (Pel,toGRID,Bi) and the power deficit of the single building of the REC (Pel,fromGRID,Bi) are calculated according to the equations discussed in this section. More specifically, the deficit of electricity is divided among the apartments of the building proportionally to the power consumption by the single user (Pel,deficit,j). When it comes to the single apartment, the greater the power demand, the higher the fraction of electricity withdrawn from the grid is (Ψj Equation (2)). This strategy is designed to reward the users who consume less energy.
P e l , t o G R I D , B i = 1 24 P e l , s u r p l u s , j 1 24 P e l , d e f i c i t , j i f 1 24 P e l , s u r p l u s , j > 1 24 P e l , d e f i c i t , j j = 1 , 2 , , 24 P e l , f r o m G R I D , B i =   1 4 P e l , d e f i c i t , j 1 4 P e l , s u r p l u s , j i f 1 24 P e l , s u r p l u s , j < 1 24 P e l , d e f i c i t , j
P e l , f r o m G R I D , j =   P e l , f r o m G R I D , B i · ψ j ψ j = P e l , d e f i c i t , j 1 24 P e l , d e f i c i t , j
Figure 3 shows the flow chart of the control strategy in case the j-th member of the REC is a consumer.
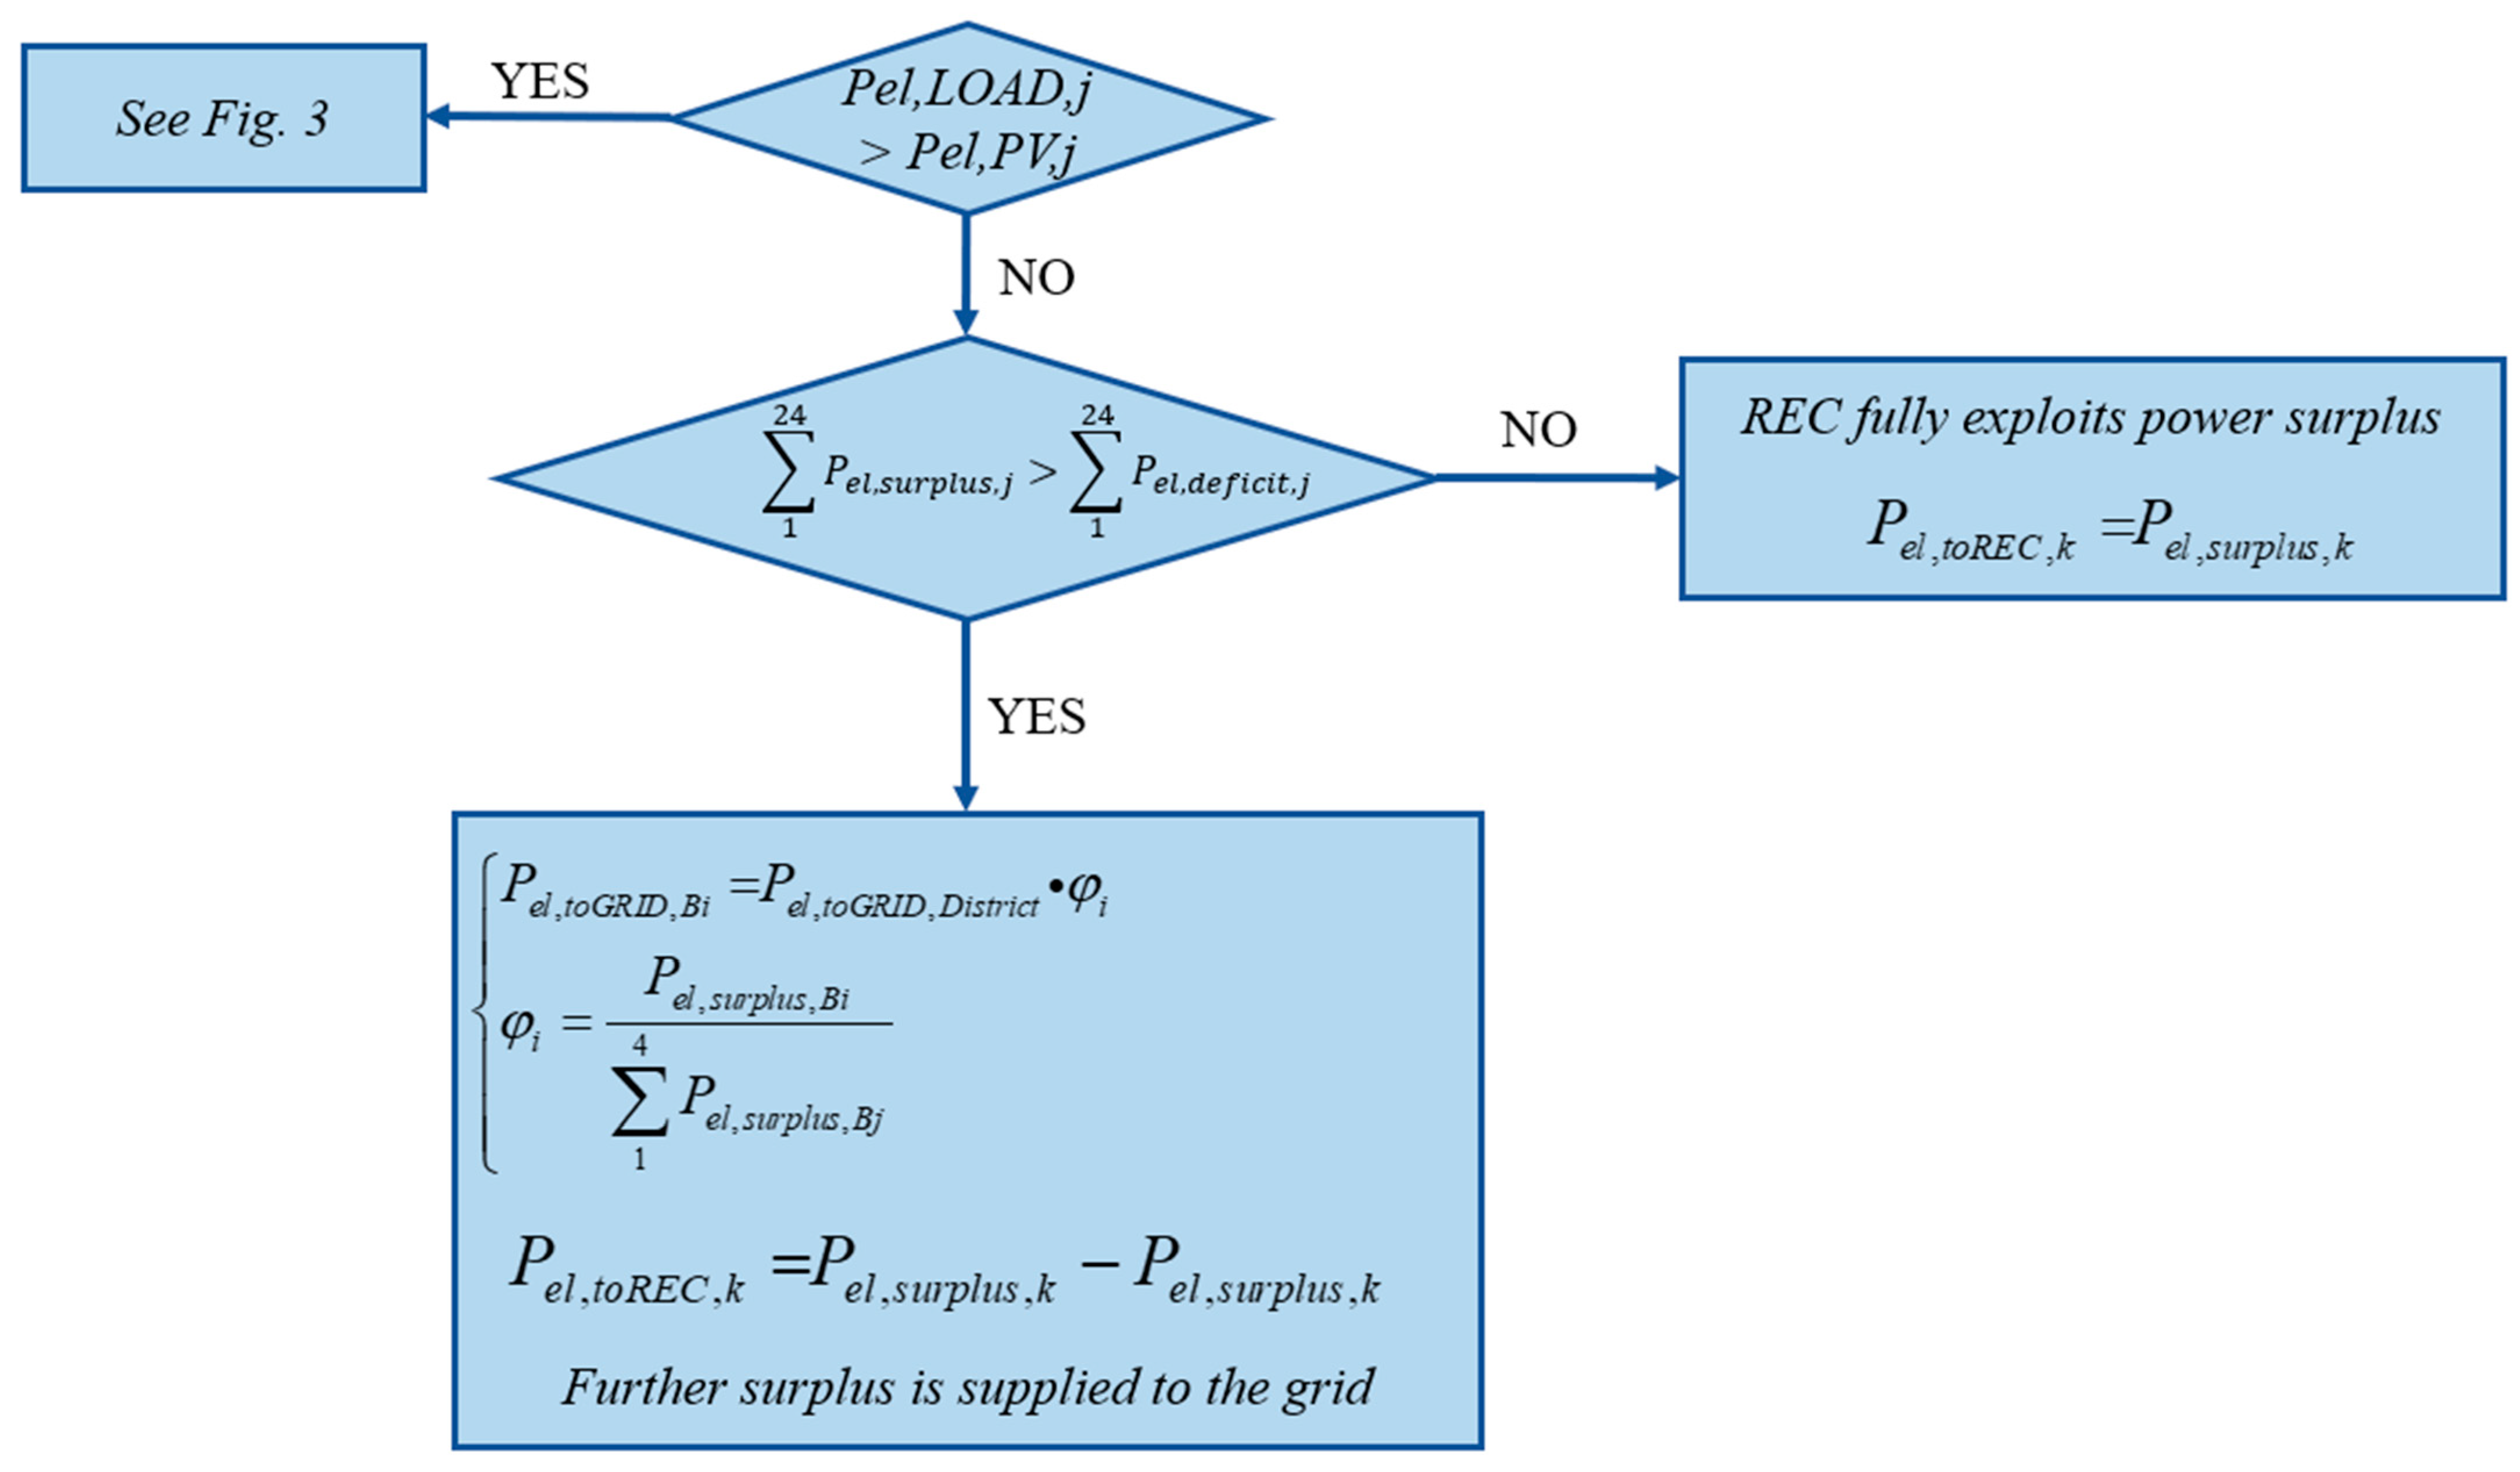
When there is a power surplus, the electricity is divided among the renewable power producers proportionally to their power production. Figure 4 displays the flowchart of the control strategy when the j-th apartment is in excess of renewable power.
P e l , t o G R I D , j =   P e l , t o G R I D , B i · φ j φ i = P e l , s u r p l u s , j 1 13 P e l , s u r p l u s , j
Thus, the renewable energy excess is first shared among the apartments of each building; then, the residual surplus is traded to other buildings, i.e., to other users in the district. Only after all these steps, an eventual surplus is supplied to the grid.
Further details regarding the management of the power in the REC are provided in ref. [36].

4.2. Thermoeconomic Model

This research compares the energy and economic performance of a bio-REC, i.e., a renewable energy community integrated with a share of bioenergy and an already simulated REC [36] with a conventional district. The reference system (RS) consists of a large-scale district REC in which the electricity demand is met by the grid (Eel,fromGRID) and the thermal energy demand is met by natural gas (NG).
The energy performance of the reference (RS) and proposed systems (i.e., REC and bio-REC) are calculated as the difference in primary energy (PE) consumption and the primary energy savings (PES) key performance indicator.
The primary energy consumption of the RS is calculated according to the following equation:
P E R S = E e l , L O A D + E e l , c o o l i n g η e l + E t h , D H W + E t h , h e a t i n g η b
where Eel,LOAD is the electricity consumption by the electrical appliances of each apartment, Eel,cooling is the electricity consumption by the air-to-air heat pumps, evaluated according to ref. [37], and Eth,DHW and Eth,heating are, respectively, the thermal energy demand for domestic hot water and building heating.
The primary energy consumption for both PSs is calculated as
P E P S = E e l , f r o m G R I D E e l , t o G R I D η e l + E t h , D H W η b
The difference between the REC and the bio-REC is the amount of energy withdrawn and supplied from/to the grid. Integrating the SOFC fueled by biomethane, an increased share of renewable energy is observed in the bio-REC compared to the base REC. The terms Eth,heating and Eel,cooling are not included in the PE equation for the PS because the building space heating is converted into electricity demand due to the DHN adoption: the DHN is driven by air-to-water and water loop heat pumps.
Table 1 lists the main parameters adopted in this thermoeconomic analysis.
The total district operating costs for the i-th building in both the RS and PSs are evaluated according to Equation (6):
C R S = i E e l , L O A D , i + E e l , c o o l i n g , i · j e l , f r o m G R I D + E t h , D H W + E t h , h e a t i n g L H V N G η b i · j N G C R E C = i C e l , R E C + E t h , D H W L H V N G η b i · j N G + m p l a n t , i + m P V , i C b i o R E C = i C e l , b i o R E C + E t h , D H W L H V N G η b i · j N G + m p l a n t , i + m P V , i
where Cel,i is the cost of energy for each user, which is explained in detail in ref. [36] and here omitted to avoid a lengthy discussion of the model. Other thermoeconomic factors are explained in Table 1.
The investment costs for the proposed layouts are calculated as follows:
C t o t , R S = I P V
C t o t , R E C = I L H P s + I D H P + I p i p i n g + I p u m p s + I P V
C t o t , b i o R E C = I L H P s + I D H P + I p i p i n g + I p u m p s + I P V + I A D + I S O F C
where ILHPs is the installation cost of the water heat pumps in the district substations, one for each building, and IDHP is the cost for the installation of the district heat pumps. The costs of other items are displayed in Table 1. To make an accurate evaluation of the economic benefits of including biogas production in the bio-REC, economic benefits are integrated into the analysis. The Italian government provides funding for 20 k€ per Sm3/h/year of rated biogas produced up to 40% of the capital cost of the anaerobic digester when it digests OFMSW [38]. Moreover, for waste disposal, roughly 50 €/tons of municipal waste must be paid for by the population in the form of tax [39]. Therefore, this avoided cost is considered in the calculation of the operating costs for the bio-REC.
The economic KPIs are therefore calculated according to the conventional formulations [40] to assess the feasibility of the solution proposed in terms of the simple payback period (SPB), the net present value (NPV), and the profit index (PI).
Table 1. Thermoeconomic factors used in the analysis.
ParameterDescriptionValueUnit
jel,fromGRIDElectricity purchasing cost0.25€/kWh
jel,toGRIDElectricity energy exporting cost0.05€/kWh
jel,fromRECLocal electricity purchasing cost0.15€/kWh
jel,toRECLocal electricity exporting cost0.15€/kWh
jNGNatural gas purchasing price1.50€/Sm3
LHVCH4Natural gas lower heating value9.59kWh/Sm3
JPVPV cost1000 [41]€/kW
JpipingPiping specific cost72.20 [4]€/m
JexcavationExcavation specific cost12.68€/m3
dDiscount25%
Jpump108 m3/hCost of Salmson 108 m3/h pump2.66 [5]k€/pump
110 m3/hCost of Salmson 110 m3/h pump2.88 [5]k€/pump
20 m3/hCost of Salmson 20 m3/h pump0.61 [5]k€/pump
14 m3/hCost of Salmson 14 m3/h pump0.68 [5]k€/pump
JLHPWater loop heat pump-specific cost150 [42]€/kW
JDHPDistrict heat pump-specific cost150 [42]€/kW
JSOFCSolid oxide fuel cell cost2500 [43]€/kW
JADAnaerobic digestion plant cost800 [32]€/m3
ηelElectric grid efficiency46%
ηBBoiler efficiency75%
mPVPV yearly maintenance cost0.5%/year
mplantPlant yearly maintenance cost1.0%/year

5. Case Study

The case study selected for this analysis is a residential district located in Naples (South of Italy) including 900 buildings. The selected district is modeled by following the approach reported in detail in ref. [33]. To perform an accurate modeling of this residential district, four clusters of users are considered, which are shown in ref. [36] and omitted here for the sake of brevity. Also, the features of the envelope of the buildings included in the residential district were accurately modeled [43]. Given the constructive era of the district selected, the buildings are assumed to have scarce thermal insulation.
The methodology followed to generate data is the following: the electric appliances of the users are simulated by means of the Load Profile Generator (LPG) tool. LPG is a software application used to create detailed and realistic simulations of electricity consumption patterns, i.e., load profiles, over time for different types of users, such as residential, commercial, or industrial entities [36]. Therefore, this tool enables the detailed simulation of power use over time for various types of households, with a focus on selecting and modeling the main electrical appliances based on standards from the ASHRAE handbook [44] and ENEA energy labels [45]. The critical features of these appliances, which influence both power consumption and the heating/cooling requirements of an apartment, are listed in Table 2. The results in terms of load profiles are compared and calibrated against real energy bills [36]. Accurately capturing the heat output from these appliances is essential for determining the overall heating/cooling needs of the building.
The heating and cooling demands are provided by using type 56 in TRNSYS, used to dynamically calculate the thermal performance of the building [33]. This type is extremely useful and commonly adopted to simulate the energy performance of the buildings given the thermodynamic, geometric, and structural features of the building. Specific scheduling for the occupancy profiles of the inhabitants is integrated for a more realistic performance of the model. All these simulated data are validated against real energy bills and data provided by the scientific literature for the same type of end users.
The reference system (RS) includes the residential district already discussed, with thermal energy requirements for building space heating met by a centralized boiler and the needs for domestic hot water addressed through individual boilers. The demand of each apartment for space heating is matched by using air-to-air heat pumps. The electricity demand of the residential district is supplied by withdrawing power from the national electric grid.
The PS1, i.e., the REC, replaces the centralized boilers with water loop heat pumps of 182 kWth, producing hot water at 80 °C. The radiators in the apartments are supplied with heat provided by these pumps, leaving the building heating network unchanged. The water loop heat pumps (WLHPs) receive their thermal energy from the DH system, which increases the COP of the WLHPs by providing heat to the evaporators. This DH is balanced by an air-to-water heat pump composed of eight modules activated in a cascade, with each module having a thermal capacity of 9.30 MWth. The demand for domestic hot water is met by separate boilers. Building on the concepts discussed earlier, this setup incorporates a power-to-heat (P2H) control strategy, which utilizes unused electrical surplus by redirecting it to the air-to-water heat pump. This increases the district heating temperature, effectively using the system’s thermal inertia to store excess electricity as heat.
The PS2, i.e., the bioREC, is similar to the REC, but in this case, a district-level SOFC of 288 kW is included. The SOFC works as a cogenerator for the district providing renewable power and thermal energy to the ring to increase the performance of the system. The SOFC is fueled with biomethane provided by an anaerobic digester operating digesting OFMSW in mesophilic conditions equipped with a biogas upgrading unit of 120 kW. The biomethane produced by the AD system is provided to an external reformer, which converts CH4 into H2, which in turn fuels the SOFC; this provides useful power and heat for the district.

6. Results

This section provides the numerical results of the dynamic simulations and thermoeconomic analyses performed in this work. First, the operation of the system for a typical winter and summer day is analyzed. Then, the monthly trends of the main energies of the proposed plant are discussed as well as the yearly results from an energy and economic point of view.
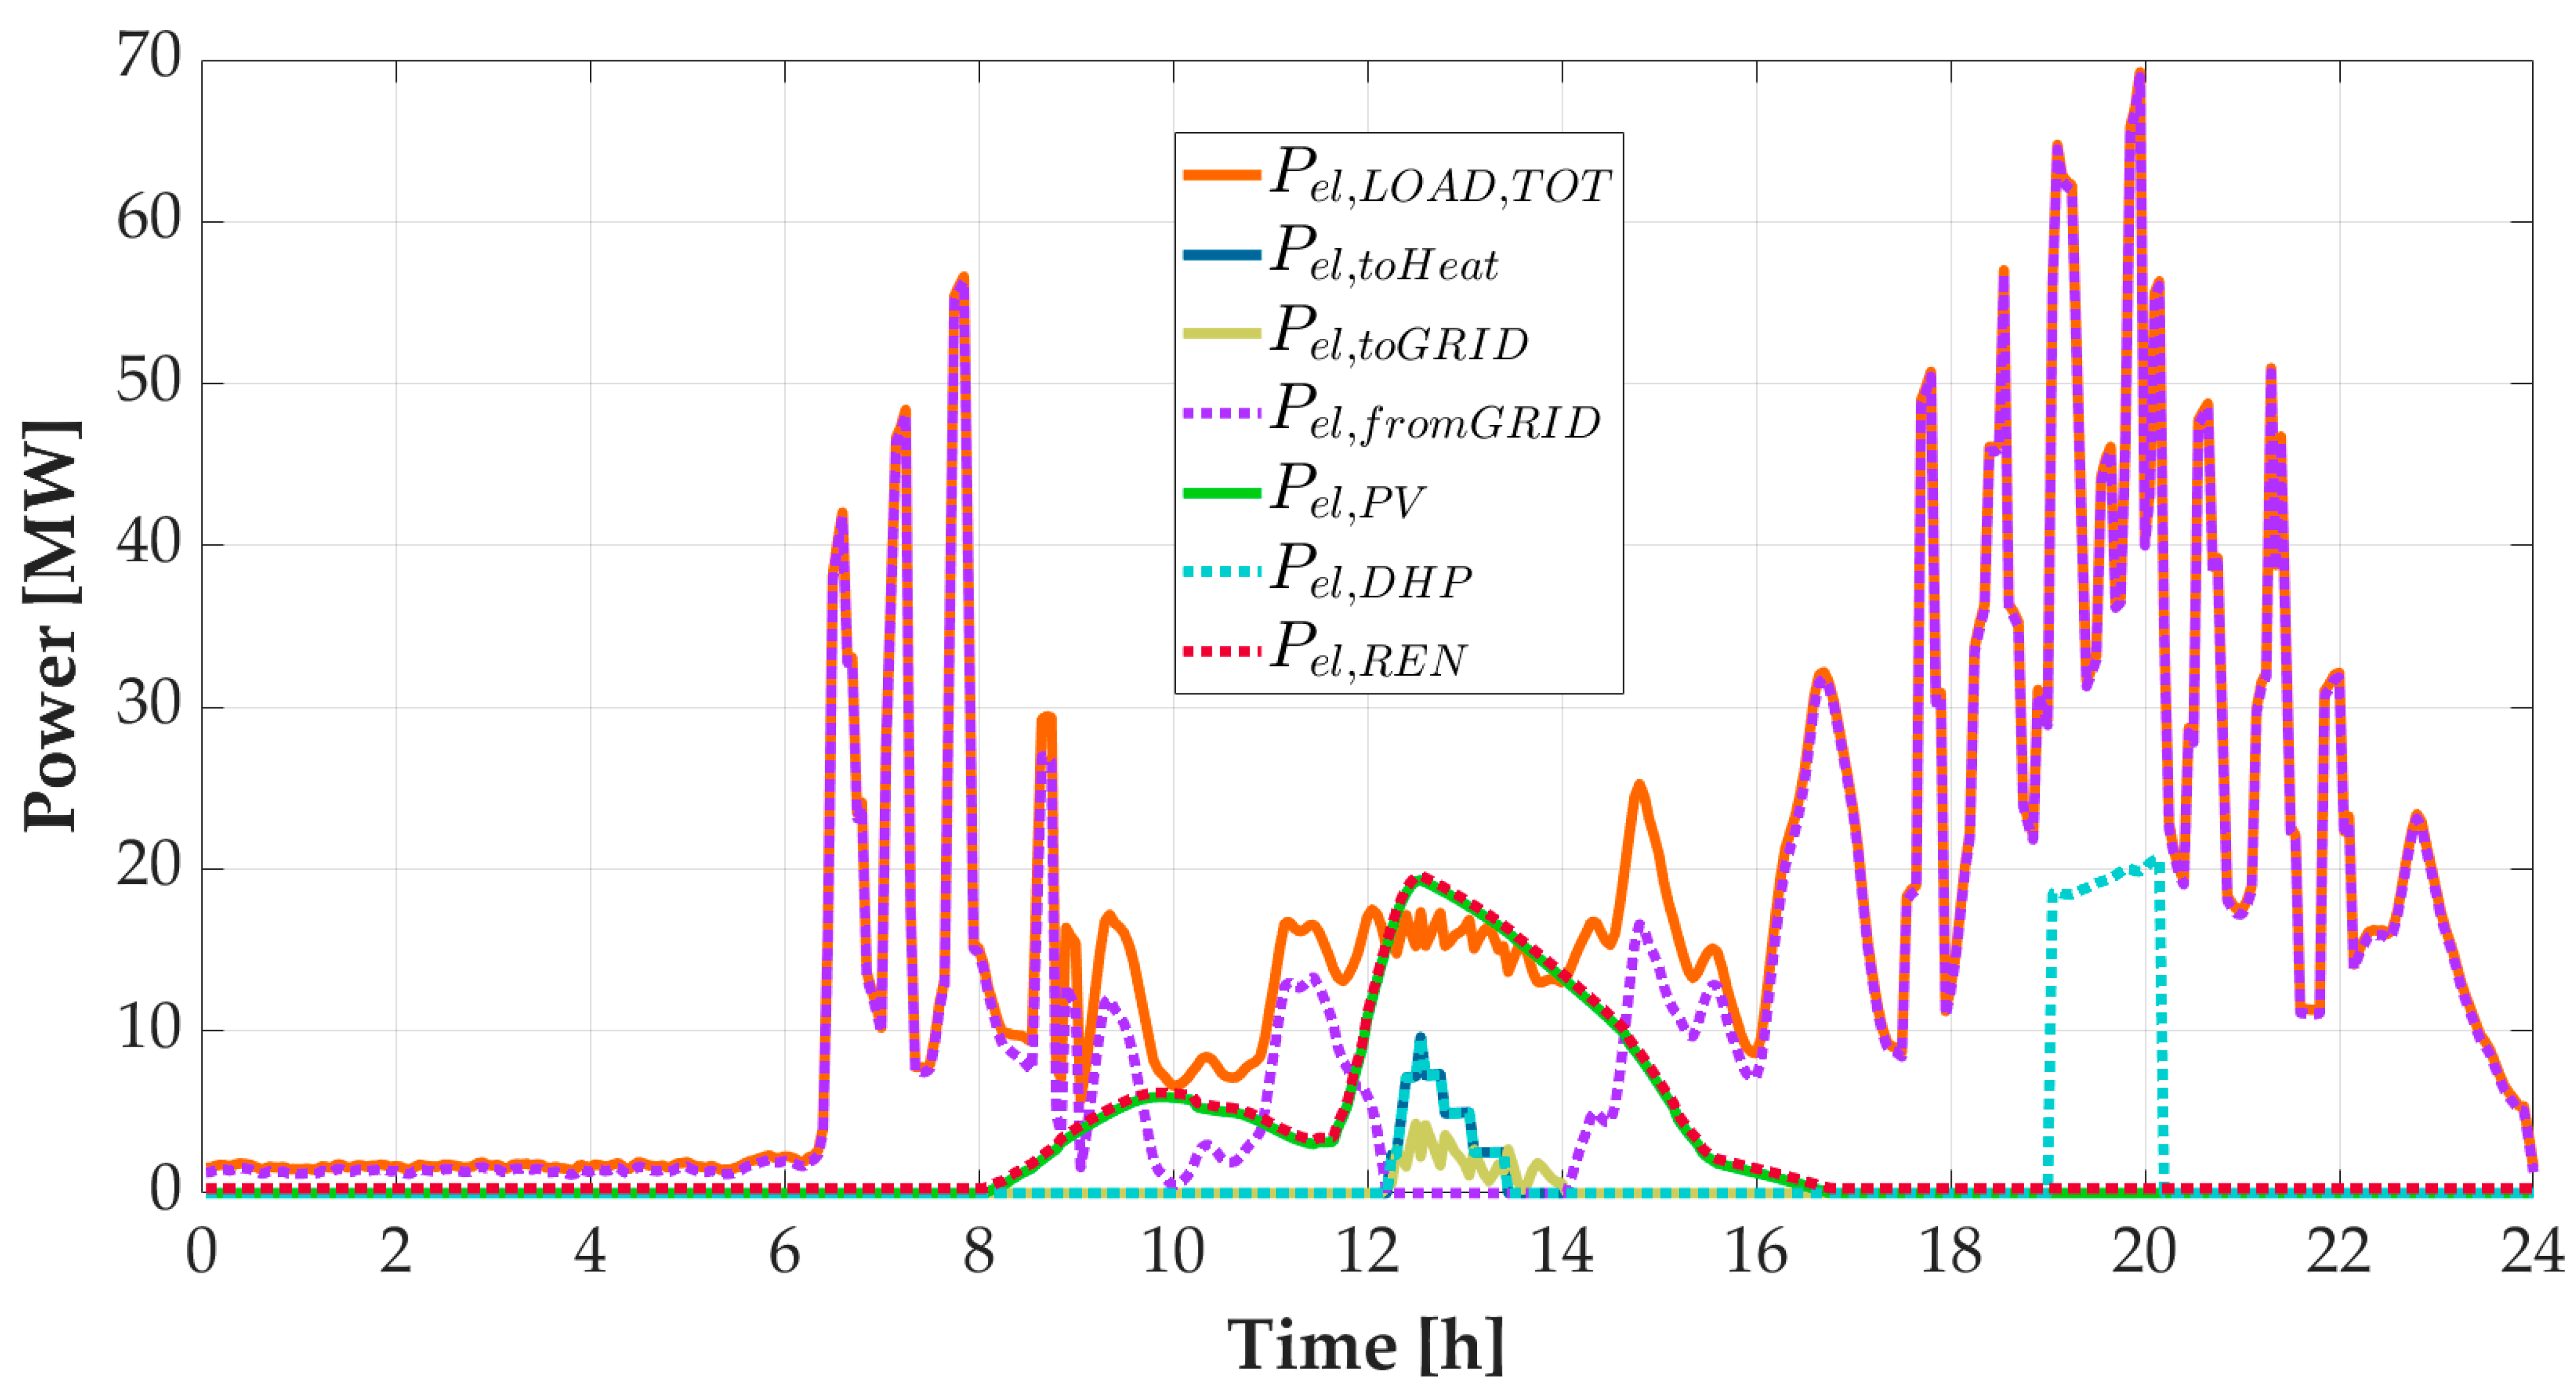
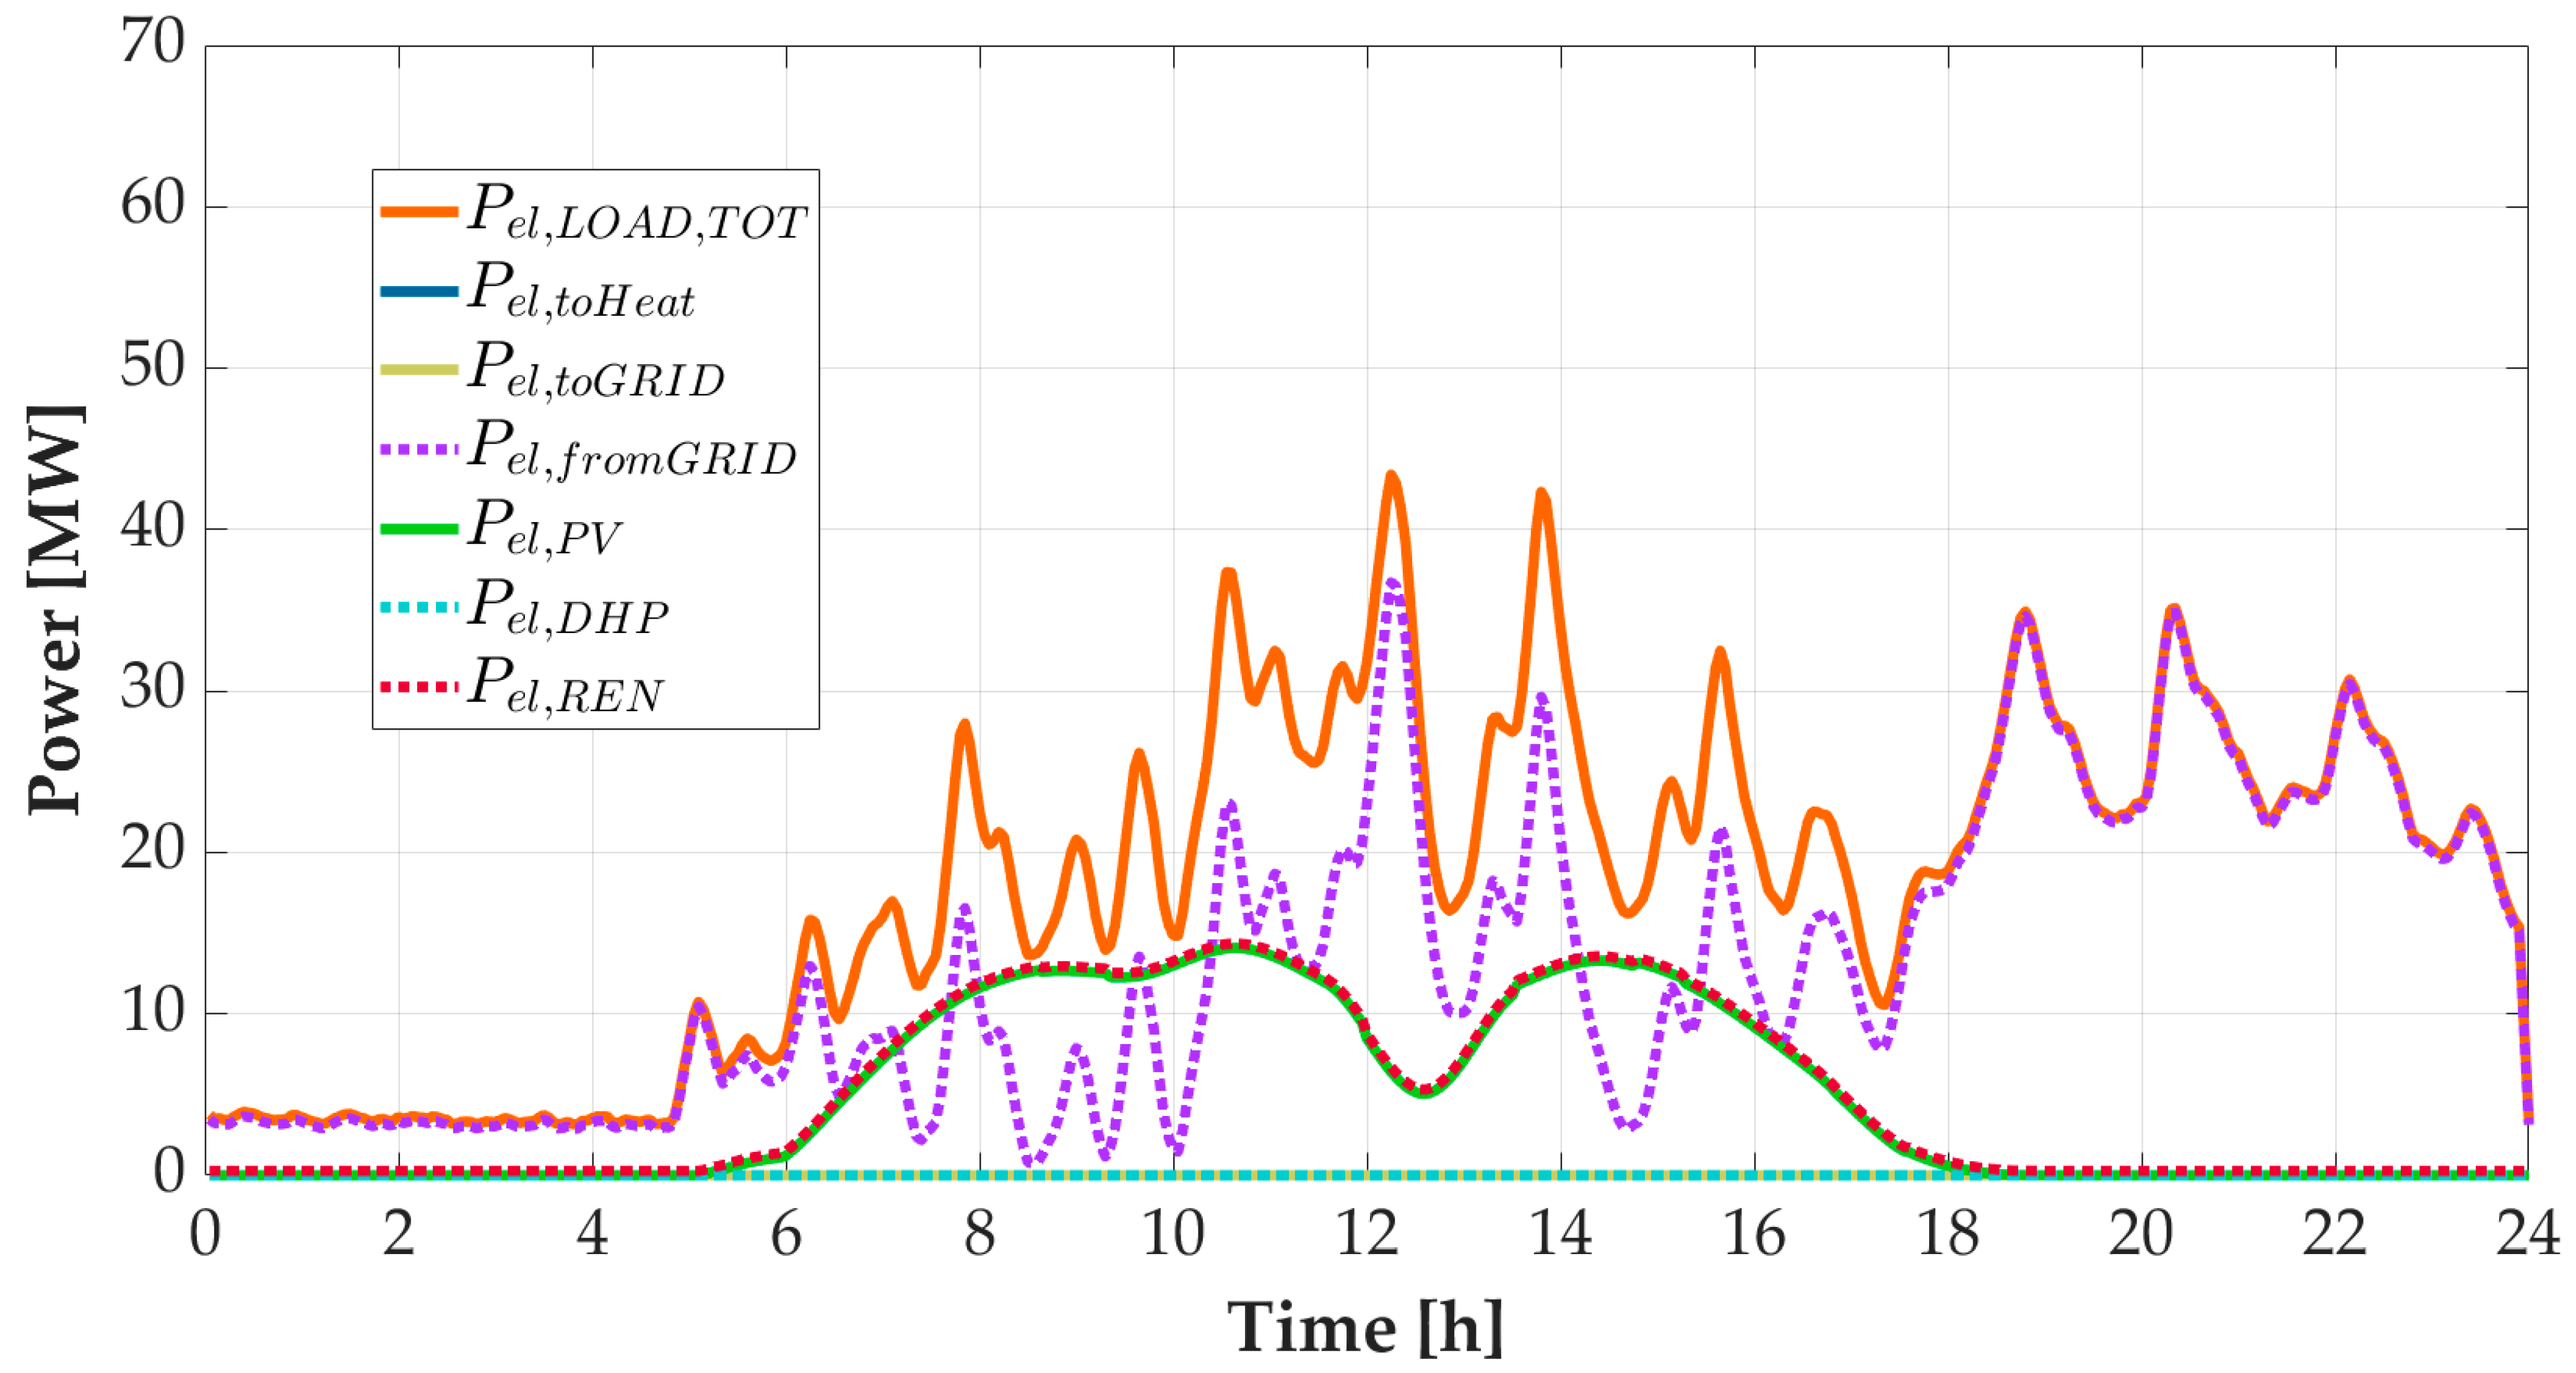
In Figure 5 and Figure 6, the dynamic results related to the power flow for a typical winter and summer day, respectively, are reported. In particular, Pel,load,TOT is the total electric load of the district, including the electric load of the electric auxiliaries, of the air-to-air heat pumps for the space cooling and of the air-to-water district heat pumps; Pel,2,Heat is the surplus power used to produce heat for space heating, according to the control strategy developed.
Note that this strategy allows to use the renewable power excess to drive the air-to-water heat pumps for space heating; Pel,toGRID is the excess power delivered to the grid; Pel,fromGRID is the power withdrawn from the grid; Pel,ren is the total renewable power production, i.e., the sum of the PV field and the SOFC; Pel,DHW is the power used to supply the air-to-water district heat pumps (this term is included in Pel,load,TOT).
Figure 5 shows how with the power-to-heat strategy one can exploit the surplus of renewable production to increase the energy self-consumption of the district and reduce the power export to the grid. This includes both solar PV production and SOFC production, obtained by the conversion of the waste into biogas in order to increase the electric availability in terms of renewable energy production. Given the extremely small size of the SOFC compared to the PV field, as can be noted in the case study section (Table 2), the SOFC contribution in terms of power production is negligible with respect to the PV field production. However, in the framework of the biocircular economy approach, the useful conversion of waste into energy is optimally obtained. In fact, the SOFC is able to operate constantly during all the hours of the year at rated capacity. The size of the SOFC was selected according to the availability of green fuel provided by the waste harvested from the district.
The renewable electricity produced is first shared among the users of the district according to the control strategy implemented. When the power production (Pel,ren) is greater than the total load of the whole district Pel,load,TOT, in particular during the central part of the day, from 12:00 to 13:30, the available surplus electricity is used for driving the DHP. During these hours, Pel,P2H follows the same trend as Pel,DHP. This decreases the electricity delivered to the grid Pel,toGRID. From 19:00 to 20:00, the power used to supply the air-to-water district heat pumps, Pel,DHP, reaches the value of 20 MW. This means that during the evening hours, the temperature of the ring is increased to 45 °C by only exploiting the power withdrawn from the grid. The contribution of the SOFC during the nighttime is negligible compared to the power required to activate the heat pumps.
In Figure 6, the power fluxes discussed are shown for a typical summer day. The power-to-heat strategy is not implemented for the whole summer season (the space heating demand is null).
However, the consumption for space cooling, included in Pel,load,TOT, is matched by the renewable production in the central hours of the day, from 05:00 to 18:00, decreasing the power withdrawn from the grid. The excess power delivered to the grid is null for all the hours of the day. Therefore, for all the hours of the day, all the power produced is self-consumed.
Figure 7 shows the monthly trends of the main electric energy flows of the plant; (i) Eel,load,tot is the total electric energy consumption of the district; (ii) Eel,toGRID is the electric energy delivered to the grid; (iii) Eel,fromGRID is the electric energy withdrawn from the grid; (iv) Eel,ren is the total renewable electric energy production (from solar and biomass); (v) Eel,PV is the total electric energy production of the PV field; (vi) Eel,P2H is the surplus electric energy used to supply the district heat pumps; and (vii) Eel,SELF is the electric energy self-consumed by the district.
Eel,load,TOT remarkably decreases during the summer season. The seasonal trend of the district energy consumption is justified according to the assumptions well defined in Ref. [36]. The high winter electric energy consumption of the district is due to the high electric energy consumption of the district heat pumps for space heating purposes. Considering the low PV energy production during the winter months, the electric energy withdrawn from the grid is considerably high during the winter months, about 14.7 GWh/month in January, as opposed to the value of 6.8 GWh/month occurring in August. The total renewable electric energy production follows the same trend as PV solar production, considering that the SOFC operates constantly during the hours of the year. The surplus electric energy used to supply the district heat pumps allows to reduce the electric energy delivered to the grid during the winter months. The maximum amount of electric energy delivered to the grid occurs in August (equal to 3.3 GWh/month), when the renewable production increases, the electric energy consumption significantly decreases, and the district heat pumps are switched off. For all the reasons reported above, the summer self-consumed electric energy by the district is higher than the winter one.
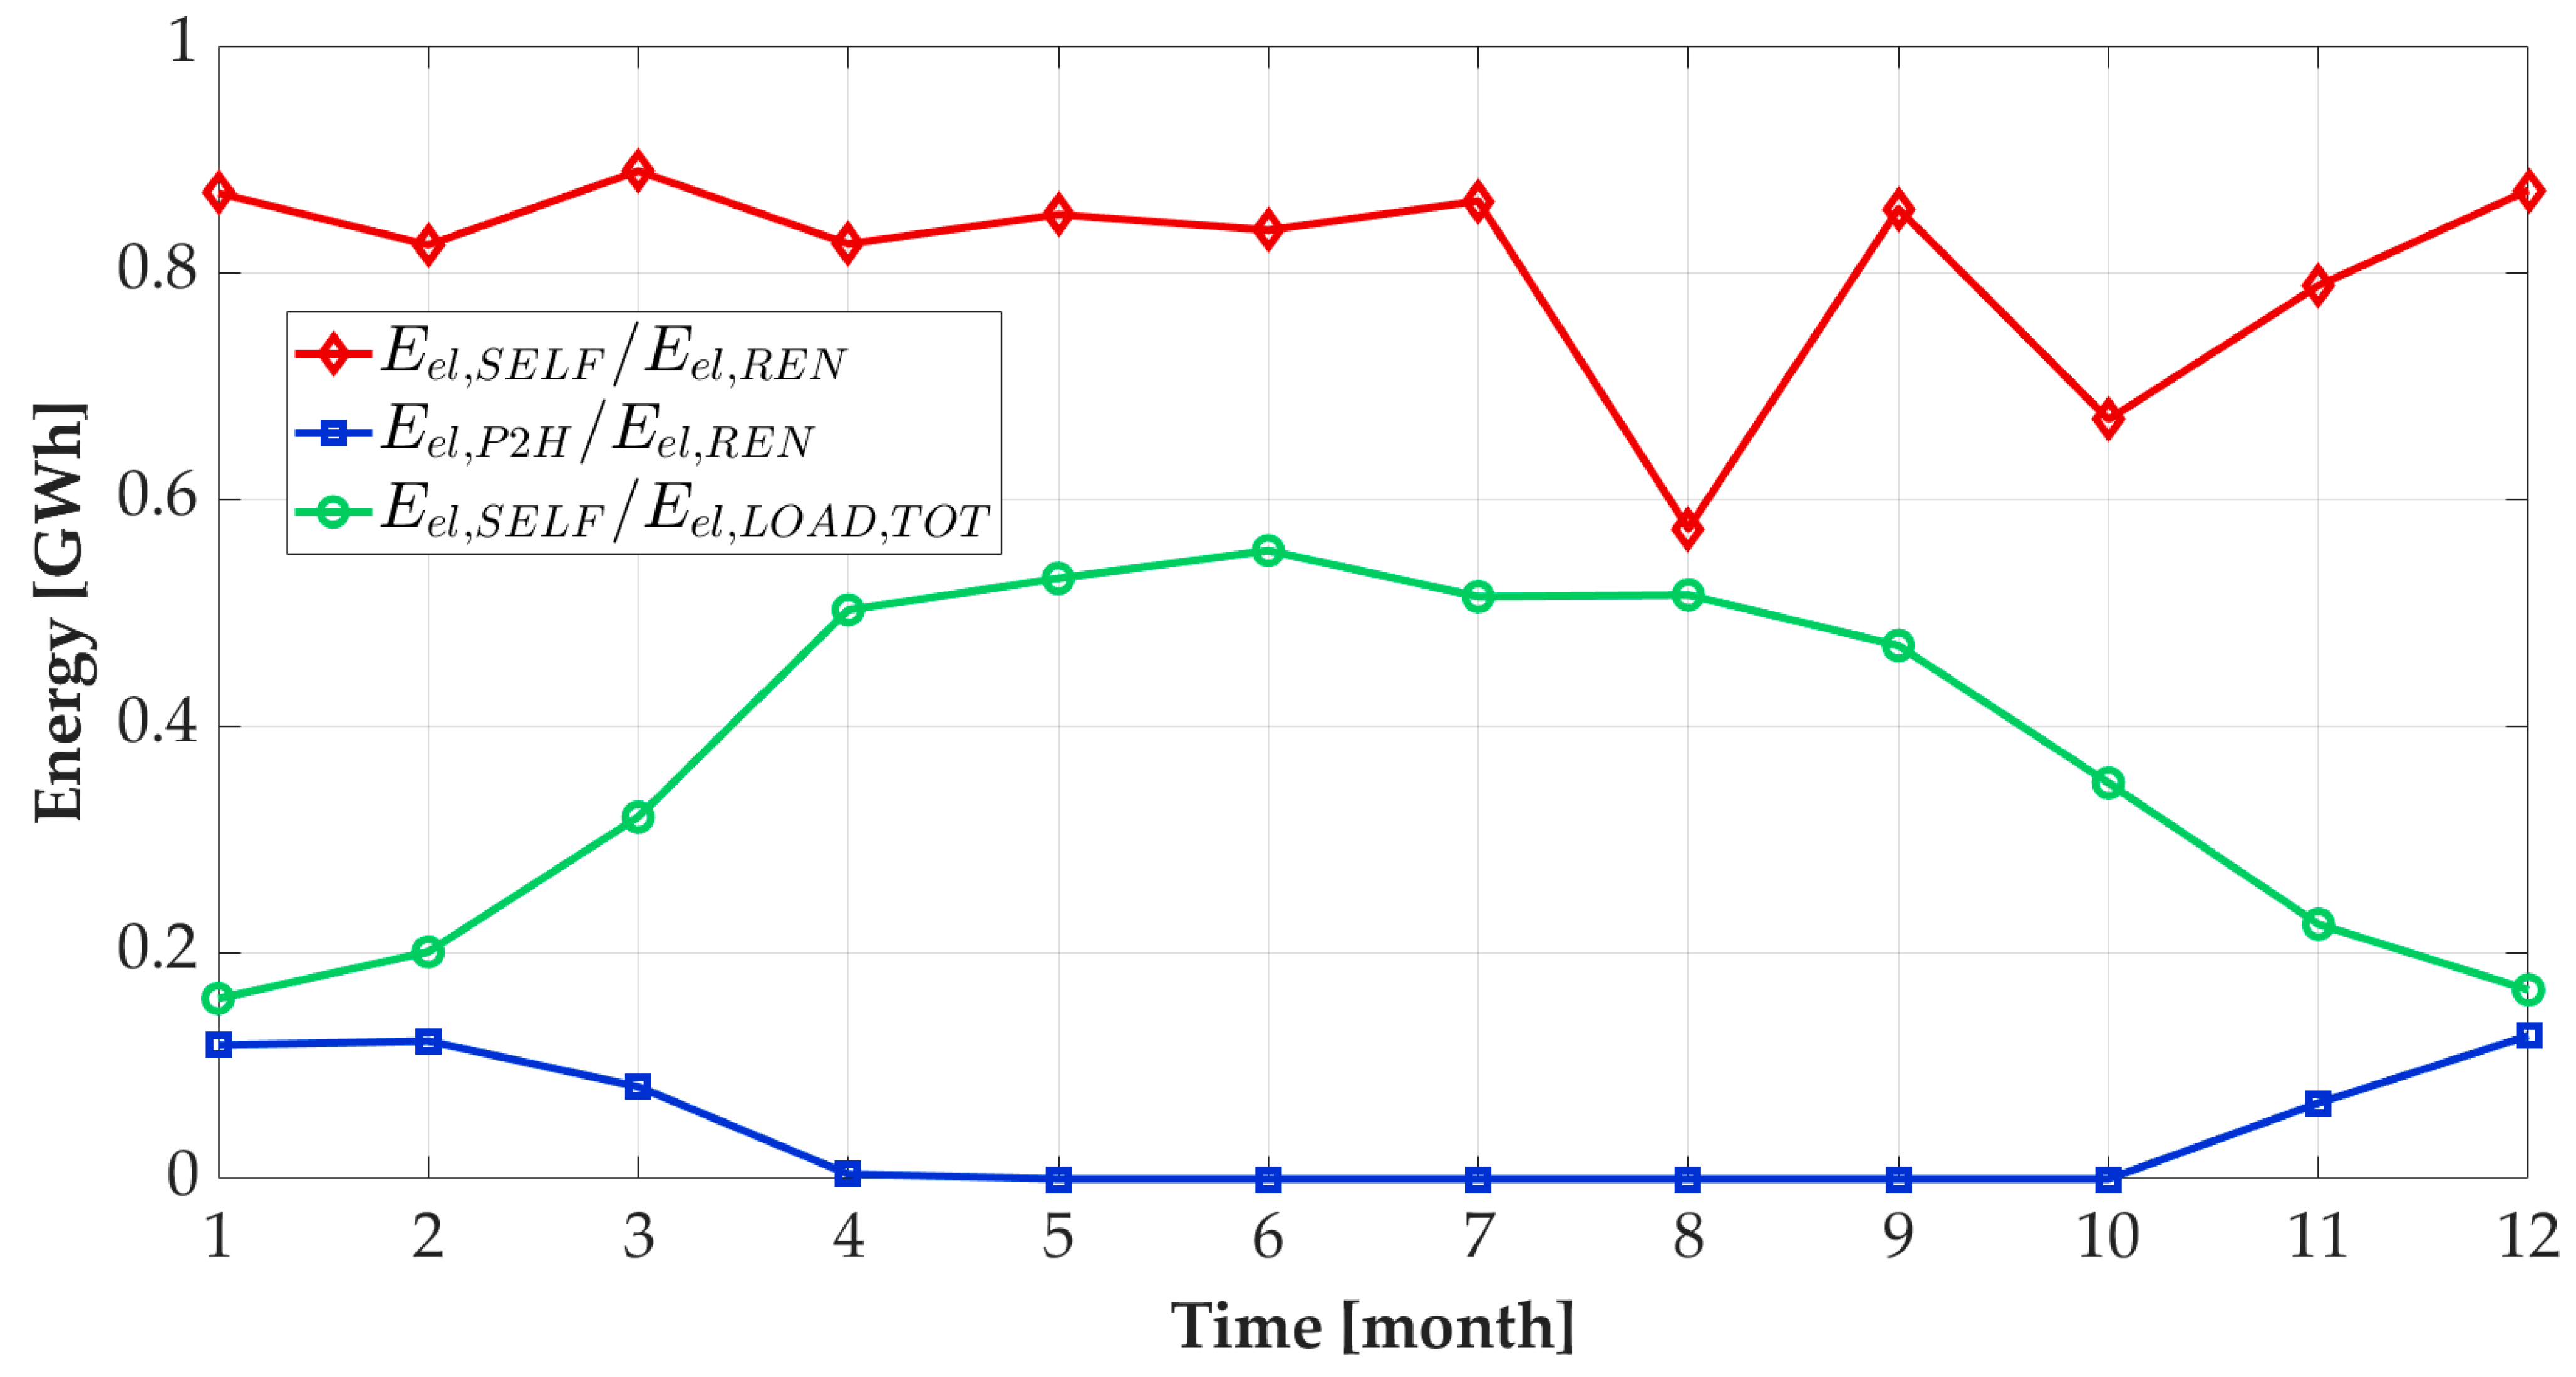
Figure 8 reports the monthly trends of main energy ratios: (i) Eel,SELF/Eel,ren represents the electric energy self-consumed by the district with respect to the total renewable electric energy production; (ii) Eel,P2H/Eel,ren represents the surplus electric energy used to supply the district heat pumps regarding the total renewable electric energy production; (iii) Eel,SELF/Eel,load represents the electric energy self-consumed by the district with respect to total electric energy consumption of the district.
The surplus electric energy used to supply the district heat pumps is roughly 15% of the total renewable electric energy production. This ratio is quite constant during the coldest months (from December to February). The ratio Eel,SELF/Eel,load shows great seasonal variation. The electric energy self-consumed by the district with respect to the total electric energy consumption of the district reaches values higher than 50% during the summer months and lower than 20% during the winter months. The ratio Eel,SELF/Eel,ren, i.e., the self-consumed electric energy by the district with regard to the renewable electric energy production (biomass and PV field) is significant. This ratio reaches values higher than 70% for all the months, with the exception of August, when the maximum value of the energy delivered to the grid occurs (Figure 7).
The yearly results of the dynamic simulations are reported in Table 3. Here, the energy results are shown as well as the main economic indexes evaluated to perform the economic analysis.
Table 3 also compares the energy and economic performance of the proposed bio-REC, i.e., PS2 (the renewable energy community integrating the bioenergy production system) and an already simulated REC coupled with a conventional district as explained in ref. [36], PS1. In order to make an accurate economic evaluation of the proposed bio-REC, the economic benefits related to the adoption of biogas production systems are also integrated into the economic analysis. As can be noted, from the energy and economic point of view, both systems, REC (PS1) and Bio-REC (PS2), are quite similar. The primary energy savings of both plants are 22% and 23%, respectively, and the SPB is 4.7 years for both systems. This is due to the fact that despite having higher annual savings, the Bio-REC system also has higher capital costs compared to the REC. In the case of Bio-REC, the costs for the anaerobic digester and the SOFC unit are included. Considering the economic benefits, the SPBinc of the Bio-REC decreases to 4.5 years. This result is mainly due to the low capacity of the SOFC unit with respect to the size of the PV field in both systems, PS1 and PS2. However, in the design phase, the size was selected according to the biomass available and, therefore, according to the biomethane production achievable. A SOFC featuring a larger capacity could only be selected if a greater amount of waste was available. In the proposed case study, this could be obtained by considering different biomasses for biogas production or by purchasing biomass from other districts. This aspect is not yet evaluated in this work, although the aim of the research is to compare the same REC with and without the recovery of the wastes for bioenergy production.
The sensitivity analysis of the model proposed was conducted based on various operating and design parameters to understand their influence on the results. According to the analyses, the PV field capacity emerged as the most influential parameter. Therefore, for brevity, only the impact of varying PV sizes on the main KPIs, i.e., PES and SPB, is presented.
Figure 9 shows the trends of these KPIs for PV field sizes ranging from 1.4 MW to 2.6 MW. It is important to remember at this point that the capacity initially selected was 2.2 MW, i.e., 36 kW per building, which is the maximum capacity available based on rooftop space assumptions [33]. Therefore, the PV capacity variation ranges from 23 kW per building (less than the available rooftop space) to 43 kW (exceeding the maximum rooftop space, assuming additional external space is available near the buildings or in specific district areas).
The figure demonstrates that varying PV capacity significantly impacts environmental performance more than economic performance. Specifically, the PES varies from 0.10 to 0.30 within the selected range, which is notable given the system scale. However, this variation does not significantly affect the economic indicator (SPB), which only changes slightly from approximately 5.5 to 4 years, consistently remaining low.
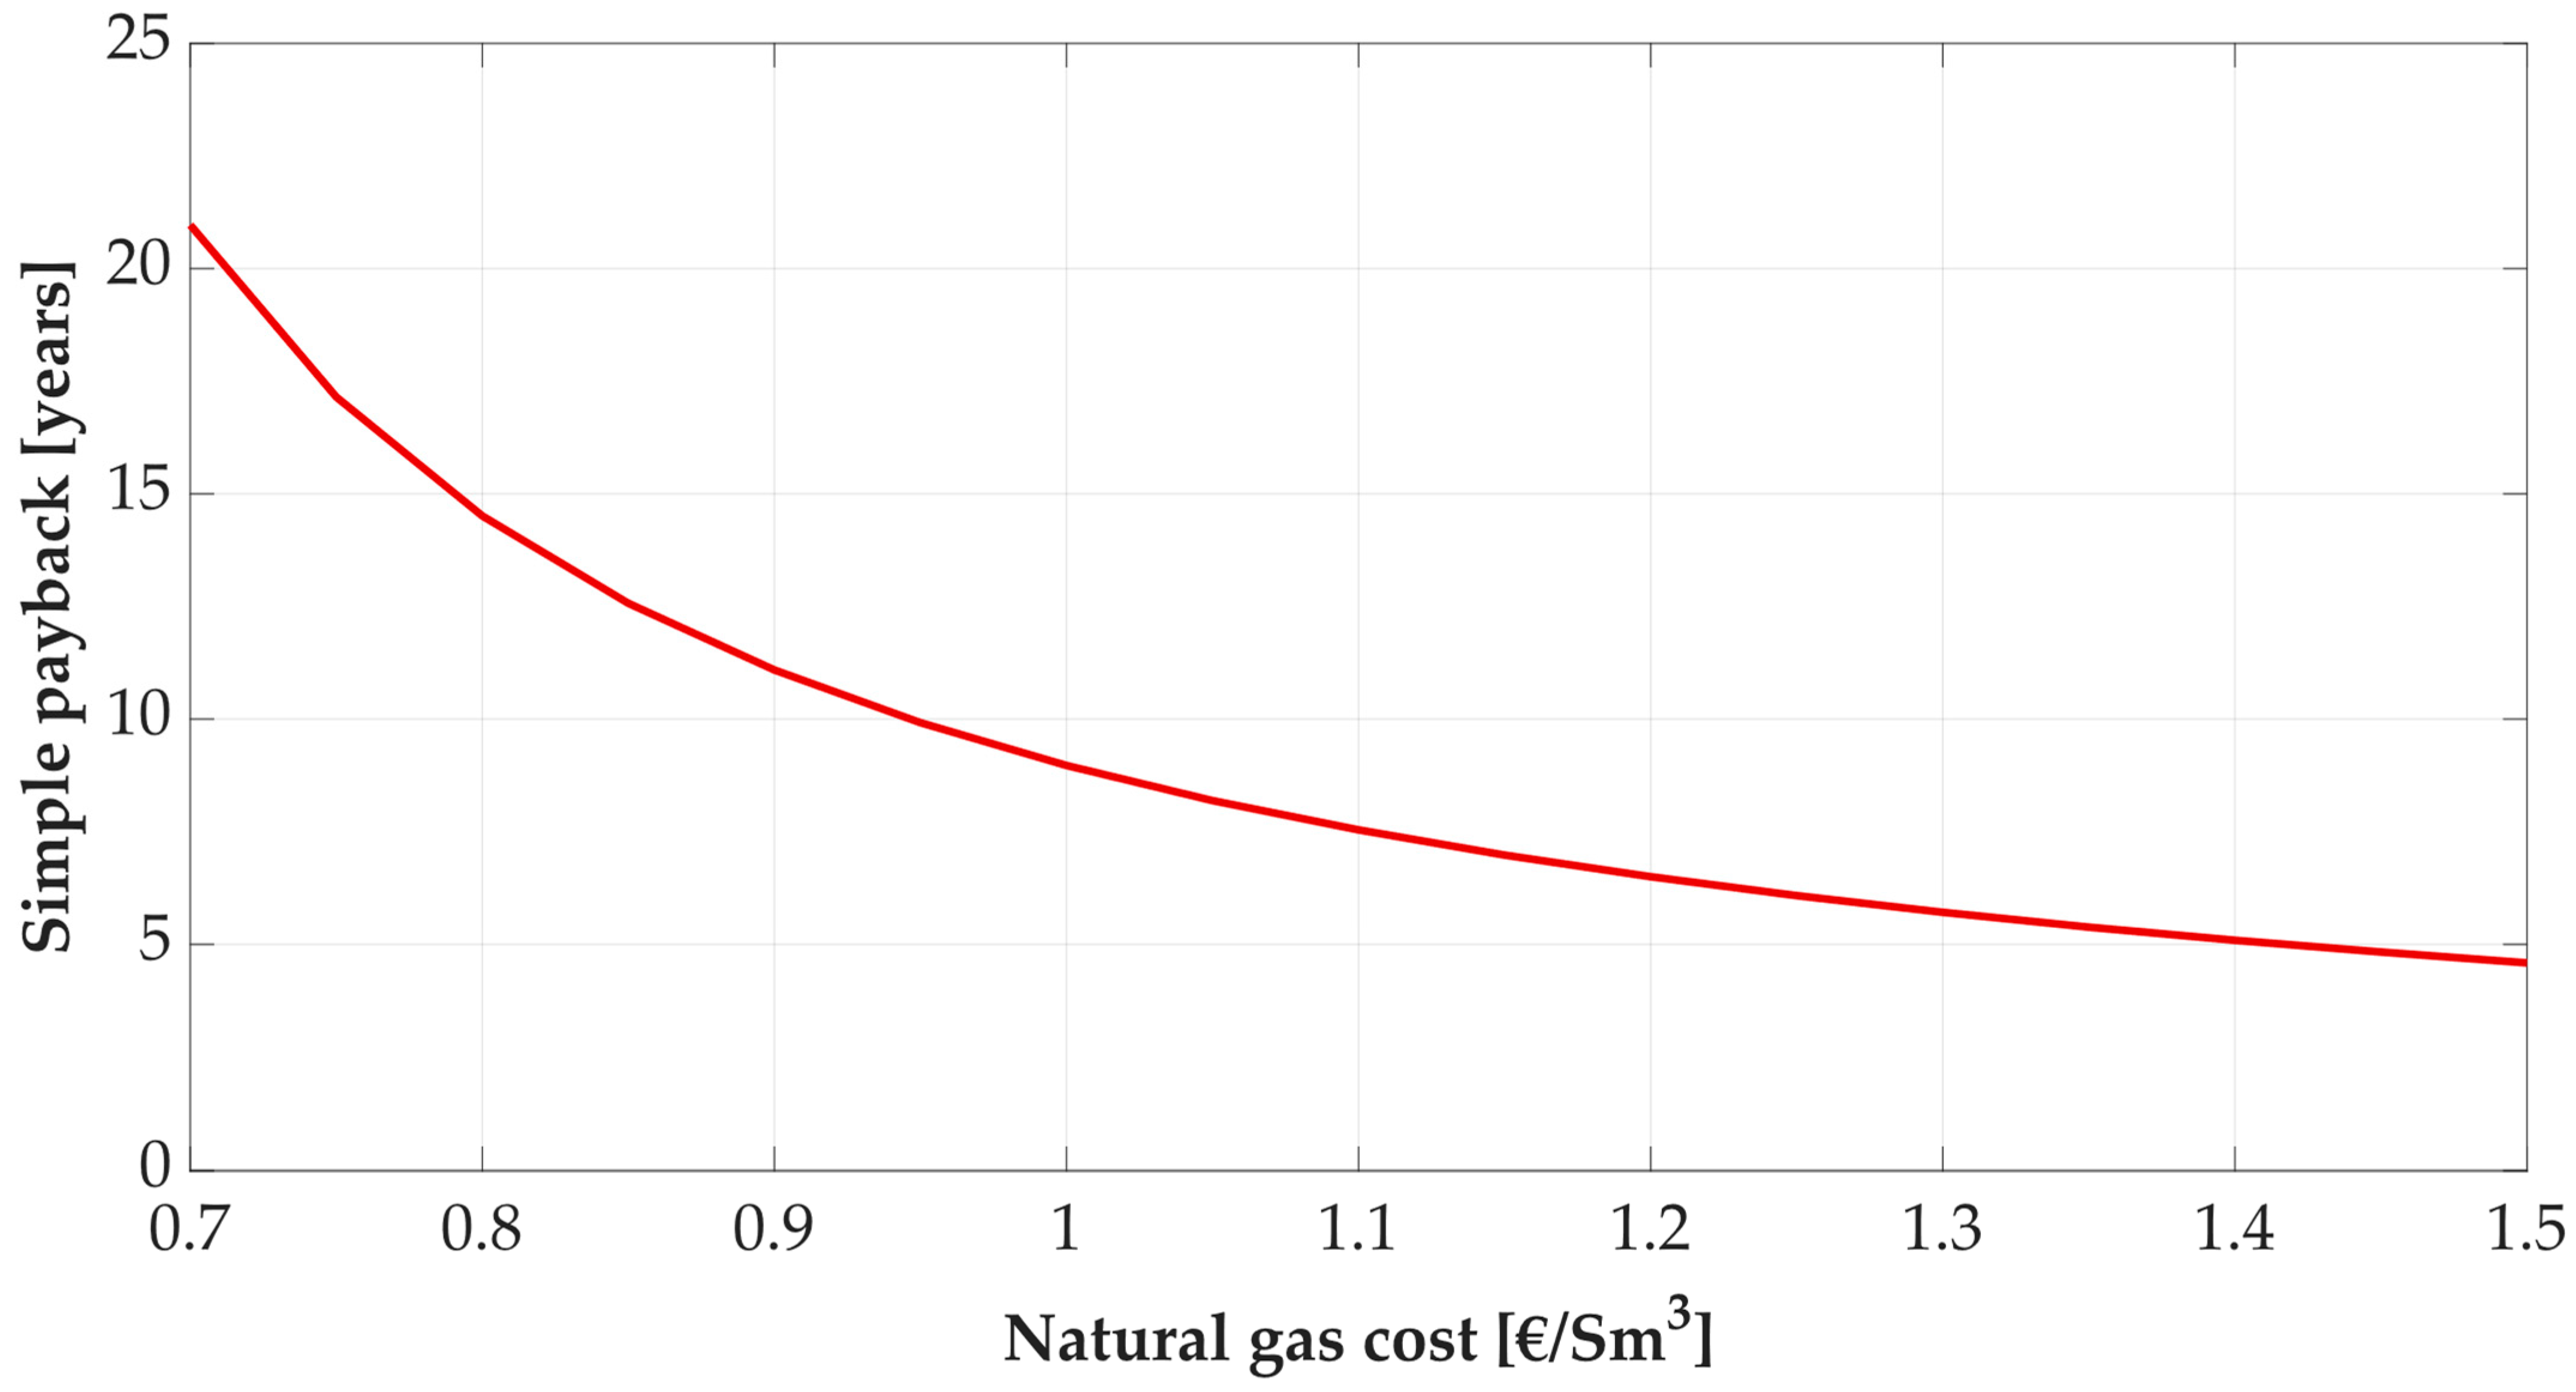
To analyze how much the performance of the system proposed relies on the economic parameters, a sensitivity analysis was performed by varying the price of natural gas. Given the high cost of natural gas selected in this case study, i.e., 1.50 €/Sm3, this cost varied from 0.70 €/Sm3 to 1.50 €/Sm3 in this sensitivity analysis. Figure 10 shows the impact on the SPB of the variation of natural gas prices. As the natural gas cost increases from 0.70 €/Sm3 to approximately 0.95 €/Sm3, the SPB period rapidly decreases from more than 20 years to fewer than 10 years. This indicates that higher natural gas prices significantly enhance the economic viability of the proposed renewable energy system by reducing the time required to recover the initial investment. The SPB sharply increases only when the natural gas cost drops below 0.80 €/Sm3. However, the value of SPB is extremely low for natural gas costs higher than 0.90 €/Sm3, which is roughly 60% of the cost initially assumed for calculations. This sensitivity analysis highlights that the feasibility of the solution proposed may be poor when the prices of natural gas are extremely low. The system becomes increasingly cost-effective as the price of natural gas rises, underscoring the potential financial benefits of transitioning to renewable energy sources in high-cost natural gas scenarios.

7. Discussion

The novel bio-REC system presented in this study introduces significant advancements in integrating renewable energy sources for district energy management. By combining PV solar energy and biogas production from municipal solid waste to supply a SOFC, it provides a continuous and reliable energy supply, addressing key limitations of conventional renewable-based systems [47]. The bio-REC system proposed achieves a primary energy saving of 23%, surpassing similar systems based on the use of biogas as fuel for fuel cells [48]. It offers enhanced economic viability through incentives for biogas production, reducing the payback period to 4.5 years and paving the way for abating the social barriers hindering biogas dissemination [49].
In the current framework of evolving energy grids, the proposed bio-REC system aligns with future advancements in smart grid technology. Although the current infrastructure may struggle with its complexity, future smart grids will enable seamless integration of various energy devices and bidirectional energy flow. Managed by advanced control mechanisms, users will both supply and draw energy, facilitating a shift from centralized to distributed systems. This evolution is crucial for smart, sustainable cities, making the proposed system feasible and beneficial in future energy landscapes [50].
Regarding the environmental impact, the bio-REC system contributes to significant reductions in primary energy consumption, and therefore CO2 emissions, compared to conventional district heating systems [51]. This reduction is achieved through the utilization of local renewable resources and the promotion of sustainable waste management practices, which further enhance its environmental benefits [52]. The inclusion of biogas production and SOFC technologies ensures a stable energy supply even during periods of low solar irradiance, significantly improving the reliability of the system compared to those relying solely on solar energy.
The proposed system also paves the way for the broader adoption of RECs by demonstrating the feasibility and benefits of integrating multiple renewable sources. This integration can facilitate the transition from centralized to decentralized energy systems, where local communities generate and manage their own energy needs. Recent studies have highlighted the role of community involvement and advanced data analytics in optimizing energy usage within RECs, underscoring the importance of storage systems and multi-energy approaches for maximizing self-consumption [26].
The model developed in this work successfully contributes to the advancements of the research field. Its strengths lie in the effective integration of multiple renewable energy sources, specifically solar PV and biomass, enhancing both sustainability and reliability. By promoting a biocircular economy, it uses organic municipal wastes for energy production and addresses waste-to-energy conversion, reducing waste disposal challenges. The model also incorporates innovative technologies such as SOFC and biogas upgrading units, along with a P2H strategy to store excess electricity as thermal energy. However, some weaknesses are detected, which include challenges in scalability and generalization. The complexity of integrating multiple technologies and components can pose practical implementation and maintenance challenges. Economic feasibility heavily relies on incentives and subsidies, which may not always be available, and the model accuracy depends on specific assumptions about energy prices, efficiency rates, and biomass availability, potentially affecting its performance and outcomes in real-world applications.

8. Conclusions

This study presents energy production using the organic fraction of municipal solid waste (OFMSW) of a specific renewable energy community (REC) for a hybrid and innovative system layout. The proposed renewable energy plant is developed to achieve a REC including the approach of sustainable bioeconomy and waste-to-energy paradigm. A renewable power plant based on local PV fields coupled with an innovative district network is proposed simultaneously with the electricity production of a solid oxide fuel cell driven by the biomethane obtained from the anaerobic digestion of the OFMSW. Solar renewable energy production and the electricity of a solid oxide fuel cell are used to implement a power-to-heat energy storage strategy via a suitable district heating network. A very detailed dynamic simulation model is developed in the TRNSYS environment as well as a comprehensive energy and economic analysis of the proposed system by considering also the economic benefits related to the adoption of biogas production systems. The following results can be summarized:
  • The bio-REC system achieves a primary energy saving slightly higher than a conventional REC system, despite the small size of the solid oxide fuel cell (SOFC) selected based on the available OFMSW from the district. This indicates that the integration of biogas production can enhance energy efficiency.
  • The self-consumption to load ratio increases from 33% to 35% due to reduced energy withdrawal from the grid during night hours. This suggests that even a small-sized SOFC can significantly improve grid independence and energy self-sufficiency.
  • The profitability of the proposed bio-REC plant is extremely good with and without the adoption of incentives. This highlights the financial benefits of investing in bio-REC systems, which can be an attractive option for stakeholders even without government subsidies.
  • The proposed bio-REC system resulted in an interesting solution for pushing towards the development of smart and sustainable cities. It efficiently integrates renewable energy technologies to match the energy demand of grouped users, suggesting that similar systems can be replicated in other urban areas to enhance sustainability and resilience.

Author Contributions

F.C.: conceptualization, formal analysis, funding acquisition, methodology, project administration, resources, software, supervision, writing—review and editing. F.L.C.: conceptualization, data curation, formal analysis, funding acquisition, investigation, methodology, project administration, resources, software, supervision, validation, visualization, writing—original draft, writing—review and editing. L.C.: data curation, investigation, software, visualization, writing—original draft, writing—review and editing. M.V.: data curation, investigation, methodology, resources, validation, writing—review and editing. All authors have read and agreed to the published version of the manuscript.

Funding

This research received no external funding.

Data Availability Statement

The data used for this research can be shared if requested.

Acknowledgments

The authors gratefully acknowledge the partial financial support of the project PRIN 2022–AGRIRENEW “AGRoIndustrial sector decarbonisation through energy recovery from waste biomass and integration with other RENEWables” (CUP: E53D23003030006), funded by the Italian Ministry of University and Research (MUR). The authors gratefully acknowledge the partial financial support of project under the National Recovery and Resilience Plan (NRRP), Mission 4, Component 2, Investment 1.3—Call for tender No. 1561 of 11.10.2022 of Ministero dell’Università e della Ricerca (MUR); funded by the European Union—NextGenerationEU, Award Number: Project code PE0000021, Concession Decree No. 1561 of 11.10.2022 adopted by Ministero dell’Università e della Ricerca (MUR), CUP E63C22002160007, Project title: “Network 4 Energy Sustainable Transition—NEST”.

Conflicts of Interest

The authors declare no conflicts of interest.

References

  1. Sorknæs, P. Hybrid energy networks and electrification of district heating under different energy system conditions. Energy Rep. 2021, 7, 222–236. [Google Scholar] [CrossRef]
  2. Izzeldin, M.; Muradoğlu, Y.G.; Pappas, V.; Petropoulou, A.; Sivaprasad, S. The impact of the Russian-Ukrainian war on global financial markets. Int. Rev. Financ. Anal. 2023, 87, 102598. [Google Scholar] [CrossRef]
  3. Pörtner, H.O.; Roberts, D.C.; Adams, H.; Adler, C.; Aldunce, P.; Ali, E.; Ara Begum, R.; Betts, R.; Bezner Kerr, R.; Biesbroek, R.; et al. (Eds.) Summary for Policymakers. In IPCC Report, Climate Change 2022: Impacts, Adaptation and Vulnerability; Cambridge University Press: Cambridge, UK, 2022; pp. 3–33. [Google Scholar] [CrossRef]
  4. Zhou, E.; Wang, X. Dynamics of systemic risk in European gas and oil markets under the Russia–Ukraine conflict: A quantile regression neural network approach. Energy Rep. 2023, 9, 3956–3966. [Google Scholar] [CrossRef]
  5. Lamioni, R.; Bronzoni, C.; Folli, M.; Tognotti, L.; Galletti, C. Impact of H2-enriched natural gas on pollutant emissions from domestic condensing boilers: Numerical simulations of the combustion chamber. Int. J. Hydrogen Energy 2023, 48, 19686–19699. [Google Scholar] [CrossRef]
  6. Di Giulio, E.; Napolitano, M.; Di Meglio, A.; Romano, R.A.; Dragonetti, R. Low frequency acoustic method to measure the complex density of porous materials. J. Acoust. Soc. Am. 2022, 152, 2220–2226. [Google Scholar] [CrossRef]
  7. Sanongboon, P.; Pettigrew, T. Hybrid energy system optimization model: Electrification of Ontario’s residential space and water heating case study. Energy Clim. Chang. 2022, 3, 100070. [Google Scholar] [CrossRef]
  8. Buonomano, A.; Calise, F.; d’Accadia, M.D.; Vicidomini, M. A hybrid renewable system based on wind and solar energy coupled with an electrical storage: Dynamic simulation and economic assessment. Energy 2018, 155, 174–189. [Google Scholar] [CrossRef]
  9. De Miranda, P.E.V. Hydrogen energy: Sustainable and perennial. In Science and Engineering of Hydrogen-Based Energy Technologies; Elsevier: Amsterdam, The Netherlands, 2019; pp. 1–38. [Google Scholar]
  10. Napolitano, M.; Di Giulio, E.; Auriemma, F.; Romano, R.A.; Dragonetti, R. Low frequency acoustic method to measure the complex bulk modulus of porous materials. J. Acoust. Soc. Am. 2022, 151, 1545–1556. [Google Scholar] [CrossRef]
  11. Di Giulio, E.; Di Meglio, A.; Massarotti, N.; Dragonetti, R. Effective Thermal Conductivity Model for Tetragonal Pin Array Stack. J. Fluid Flow Heat Mass Transf. 2022, 9, 38–42. [Google Scholar] [CrossRef]
  12. Testasecca, T.; Catrini, P.; Beccali, M.; Piacentino, A. Dynamic simulation of a 4th generation district heating network with the presence of prosumers. Energy Convers. Manag. X 2023, 20, 100480. [Google Scholar] [CrossRef]
  13. Liu, D.-x.; Lei, H.-Y.; Li, J.-S.; Dai, C.-s.; Xue, R.; Liu, X. Optimization of a district heating system coupled with a deep open-loop geothermal well and heat pumps. Renew. Energy 2024, 223, 119991. [Google Scholar] [CrossRef]
  14. Volpato, G.; Carraro, G.; Cont, M.; Danieli, P.; Rech, S.; Lazzaretto, A. General guidelines for the optimal economic aggregation of prosumers in energy communities. Energy 2022, 258, 124800. [Google Scholar] [CrossRef]
  15. Smirnova, E.; Kot, S.; Kolpak, E.; Shestak, V. Governmental support and renewable energy production: A cross-country review. Energy 2021, 230, 120903. [Google Scholar] [CrossRef]
  16. Directive (EU) 2001 of the European Parliament and of the Council of 11 December 2018 on the Promotion of the Use of Energy from Renewable Sources (Recast). Available online: https://eur-lex.europa.eu/legal-content/EN/TXT/?uri=uriserv:OJ.L_.2018.328.01.0082.01.ENG (accessed on 1 March 2024).
  17. Fouladvand, J.; Aranguren Rojas, M.; Hoppe, T.; Ghorbani, A. Simulating thermal energy community formation: Institutional enablers outplaying technological choice. Appl. Energy 2022, 306, 117897. [Google Scholar] [CrossRef]
  18. Petrucci, A.; Barone, G.; Buonomano, A.; Athienitis, A. Modelling of a multi-stage energy management control routine for energy demand forecasting, flexibility, and optimization of smart communities using a Recurrent Neural Network. Energy Convers. Manag. 2022, 268, 115995. [Google Scholar] [CrossRef]
  19. Hachem-Vermette, C.; Guarino, F.; La Rocca, V.; Cellura, M. Towards achieving net-zero energy communities: Investigation of design strategies and seasonal solar collection and storage net-zero. Sol. Energy 2019, 192, 169–185. [Google Scholar] [CrossRef]
  20. Gjorgievski, V.Z.; Cundeva, S.; Georghiou, G.E. Social arrangements, technical designs and impacts of energy communities: A review. Renew. Energy 2021, 169, 1138–1156. [Google Scholar] [CrossRef]
  21. Gul, E.; Baldinelli, G.; Bartocci, P.; Bianchi, F.; Piergiovanni, D.; Cotana, F.; Wang, J. A techno-economic analysis of a solar PV and DC battery storage system for a community energy sharing. Energy 2022, 244, 123191. [Google Scholar] [CrossRef]
  22. Fouladvand, J.; Ghorbani, A.; Mouter, N.; Herder, P. Analysing community-based initiatives for heating and cooling: A systematic and critical review. Energy Res. Soc. Sci. 2022, 88, 102507. [Google Scholar] [CrossRef]
  23. Chen, Y.; Guo, M.; Liu, Y.; Wang, D.; Zhuang, Z.; Quan, M. Energy, exergy, and economic analysis of a centralized solar and biogas hybrid heating system for rural areas. Energy Convers. Manag. 2023, 276, 116591. [Google Scholar] [CrossRef]
  24. Zwickl-Bernhard, S.; Auer, H. Demystifying natural gas distribution grid decommissioning: An open-source approach to local deep decarbonization of urban neighborhoods. Energy 2022, 238, 121805. [Google Scholar] [CrossRef]
  25. Vivian, J.; Chinello, M.; Zarrella, A.; De Carli, M. Investigation on Individual and Collective PV Self-Consumption for a Fifth Generation District Heating Network. Energies 2022, 15, 1022. [Google Scholar] [CrossRef]
  26. Bartolini, A.; Carducci, F.; Muñoz, C.B.; Comodi, G. Energy storage and multi energy systems in local energy communities with high renewable energy penetration. Renew. Energy 2020, 159, 595–609. [Google Scholar] [CrossRef]
  27. Ancona, M.A.; Baldi, F.; Branchini, L.; De Pascale, A.; Gianaroli, F.; Melino, F.; Ricci, M. Comparative Analysis of Renewable Energy Community Designs for District Heating Networks: Case Study of Corticella (Italy). Energies 2022, 15, 5248. [Google Scholar] [CrossRef]
  28. Ceglia, F.; Marrasso, E.; Roselli, C.; Sasso, M.; Coletta, G.; Pellegrino, L. Biomass-Based Renewable Energy Community: Economic Analysis of a Real Case Study. Energies 2022, 15, 5655. [Google Scholar] [CrossRef]
  29. Babu, R.; Prieto Veramendi, P.M.; Rene, E.R. Strategies for resource recovery from the organic fraction of municipal solid waste. Case Stud. Chem. Environ. Eng. 2021, 3, 100098. [Google Scholar] [CrossRef]
  30. Di Fraia, S.; Di Meglio, A.; Massarotti, N.; Vanoli, L.; Bentivoglio, R.; Volpecina, V. Energy recovery and waste valorization in a frozen food processing facility: A case study from Lazio, Italy. Energy Effic. 2024, 17, 13. [Google Scholar] [CrossRef]
  31. Rajaeifar, M.A.; Sadeghzadeh Hemayati, S.; Tabatabaei, M.; Aghbashlo, M.; Mahmoudi, S.B. A review on beet sugar industry with a focus on implementation of waste-to-energy strategy for power supply. Renew. Sustain. Energy Rev. 2019, 103, 423–442. [Google Scholar] [CrossRef]
  32. Calise, F.; Cappiello, F.L.; d’Accadia, M.D.; Vicidomini, M. Concentrating photovoltaic/thermal collectors coupled with an anaerobic digestion process: Dynamic simulation and energy and economic analysis. J. Clean. Prod. 2021, 311, 127363. [Google Scholar] [CrossRef]
  33. Calise, F.; Cappiello, F.L.; Cimmino, L.; d’Accadia, M.D.; Vicidomini, M. A Novel Layout for Combined Heat and Power Production for a Hospital Based on a Solid Oxide Fuel Cell. Energies 2024, 17, 979. [Google Scholar] [CrossRef]
  34. Di Meglio, A.; Massarotti, N.; Nithiarasu, P. A physics-driven and machine learning-based digital twinning approach to transient thermal systems. Int. J. Numer. Methods Heat Fluid Flow 2024. [Google Scholar] [CrossRef]
  35. Calise, F.; Cappiello, F.L.; Cimmino, L.; Dentice d’Accadia, M.; Vicidomini, M. Dynamic simulation and thermoeconomic analysis of a power to gas system. Renew. Sustain. Energy Rev. 2023, 187, 113759. [Google Scholar] [CrossRef]
  36. Calise, F.; Cappiello, F.L.; Cimmino, L.; Dentice d’Accadia, M.; Vicidomini, M. Novel paradigm for renewable energy communities: A techno-economic analysis of a renewable energy community in Italy. In Proceedings of the 18th Conference on Sustainable Development of Energy, Water and Environment Systems–SDEWES 2023, Dubrovnik, Croatia, 24–29 September 2023. [Google Scholar]
  37. Calise, F.; Cappiello, F.L.; Dentice d’Accadia, M.; Vicidomini, M. Energy efficiency in small districts: Dynamic simulation and technoeconomic analysis. Energy Convers. Manag. 2020, 220, 113022. [Google Scholar] [CrossRef]
  38. GSE. Biomethane Decree. Discount in Capital Costs for New Installation Anaerobic Digesters. 2022. Available online: https://www.gse.it/servizi-per-te/attuazione-misure-pnrr/produzione-di-biometano/accesso-agli-incentivi (accessed on 1 March 2024).
  39. ISPRAmbiente. Regional Costs for Waste Disposal. Available online: https://www.catasto-rifiuti.isprambiente.it/index.php?pg=costiregione&width=1536&height=864&advice=si (accessed on 1 March 2024).
  40. Calise, F.; Cappiello, F.L.; Cimmino, L.; Dentice d’Accadia, M.; Vicidomini, M. A comparative thermoeconomic analysis of fourth generation and fifth generation district heating and cooling networks. Energy 2023, 284, 128561. [Google Scholar] [CrossRef]
  41. Calise, F.; Cappiello, F.L.; d’Accadia, M.D.; Vicidomini, M. A novel smart energy network paradigm integrating combined heat and power, photovoltaic and electric vehicles. Energy Convers. Manag. 2022, 260, 115599. [Google Scholar] [CrossRef]
  42. Calise, F.; Cappiello, F.L.; d’Accadia, M.D.; Petrakopoulou, F.; Vicidomini, M. A solar-driven 5th generation district heating and cooling network with ground-source heat pumps: A thermo-economic analysis. Sustain. Cities Soc. 2022, 76, 103438. [Google Scholar] [CrossRef]
  43. Calise, F.; Cappiello, F.L.; Cimmino, L.; Vicidomini, M. Dynamic simulation modelling of reversible solid oxide fuel cells for energy storage purpose. Energy 2022, 260, 124893. [Google Scholar] [CrossRef]
  44. The American Society of Heating, Refrigerating and Air-Conditioning Engineers. 1993 ASHRAE Handbook: Fundamentals; ASHRAE: Atlanta, GA, USA, 1993. [Google Scholar]
  45. ENEA. Agenzia Nazionale per le Nuove Tecnologie, L’energia e lo Sviluppo Economico Sostenibile. 2019. Available online: http://www.enea.it/it (accessed on 1 March 2024).
  46. Available online: https://global.aermec.com/it/ (accessed on 1 March 2024).
  47. Zhang, M.; Yu, S.; Li, H. Inter-Zone Optimal Scheduling of Rural Wind–Biomass-Hydrogen Integrated Energy System. Energies 2023, 16, 6202. [Google Scholar] [CrossRef]
  48. Thiruselvi, D.; Kumar, P.S.; Kumar, M.A.; Lay, C.-H.; Aathika, S.; Mani, Y.; Jagadiswary, D.; Dhanasekaran, A.; Shanmugam, P.; Sivanesan, S.; et al. A critical review on global trends in biogas scenario with its up-gradation techniques for fuel cell and future perspectives. Int. J. Hydrogen Energy 2021, 46, 16734–16750. [Google Scholar] [CrossRef]
  49. Mittal, S.; Ahlgren, E.O.; Shukla, P.R. Barriers to biogas dissemination in India: A review. Energy Policy 2018, 112, 361–370. [Google Scholar] [CrossRef]
  50. Medina, M.S.G.; Aguilar, J.; Rodríguez-Moreno, M.D. A Bioinspired Emergent Control for Smart Grids. IEEE Access 2023, 11, 7503–7520. [Google Scholar] [CrossRef]
  51. Cowley, T.; Hutty, T.; Hammond, J.; Brown, S. Achieving emission reduction through the utilisation of local low-grade heat sources in district heating networks. Appl. Therm. Eng. 2024, 242, 122381. [Google Scholar] [CrossRef]
  52. Solarte-Toro, J.C.; Chacón-Pérez, Y.; Cardona-Alzate, C.A. Evaluation of biogas and syngas as energy vectors for heat and power generation using lignocellulosic biomass as raw material. Electron. J. Biotechnol. 2018, 33, 52–62. [Google Scholar] [CrossRef]
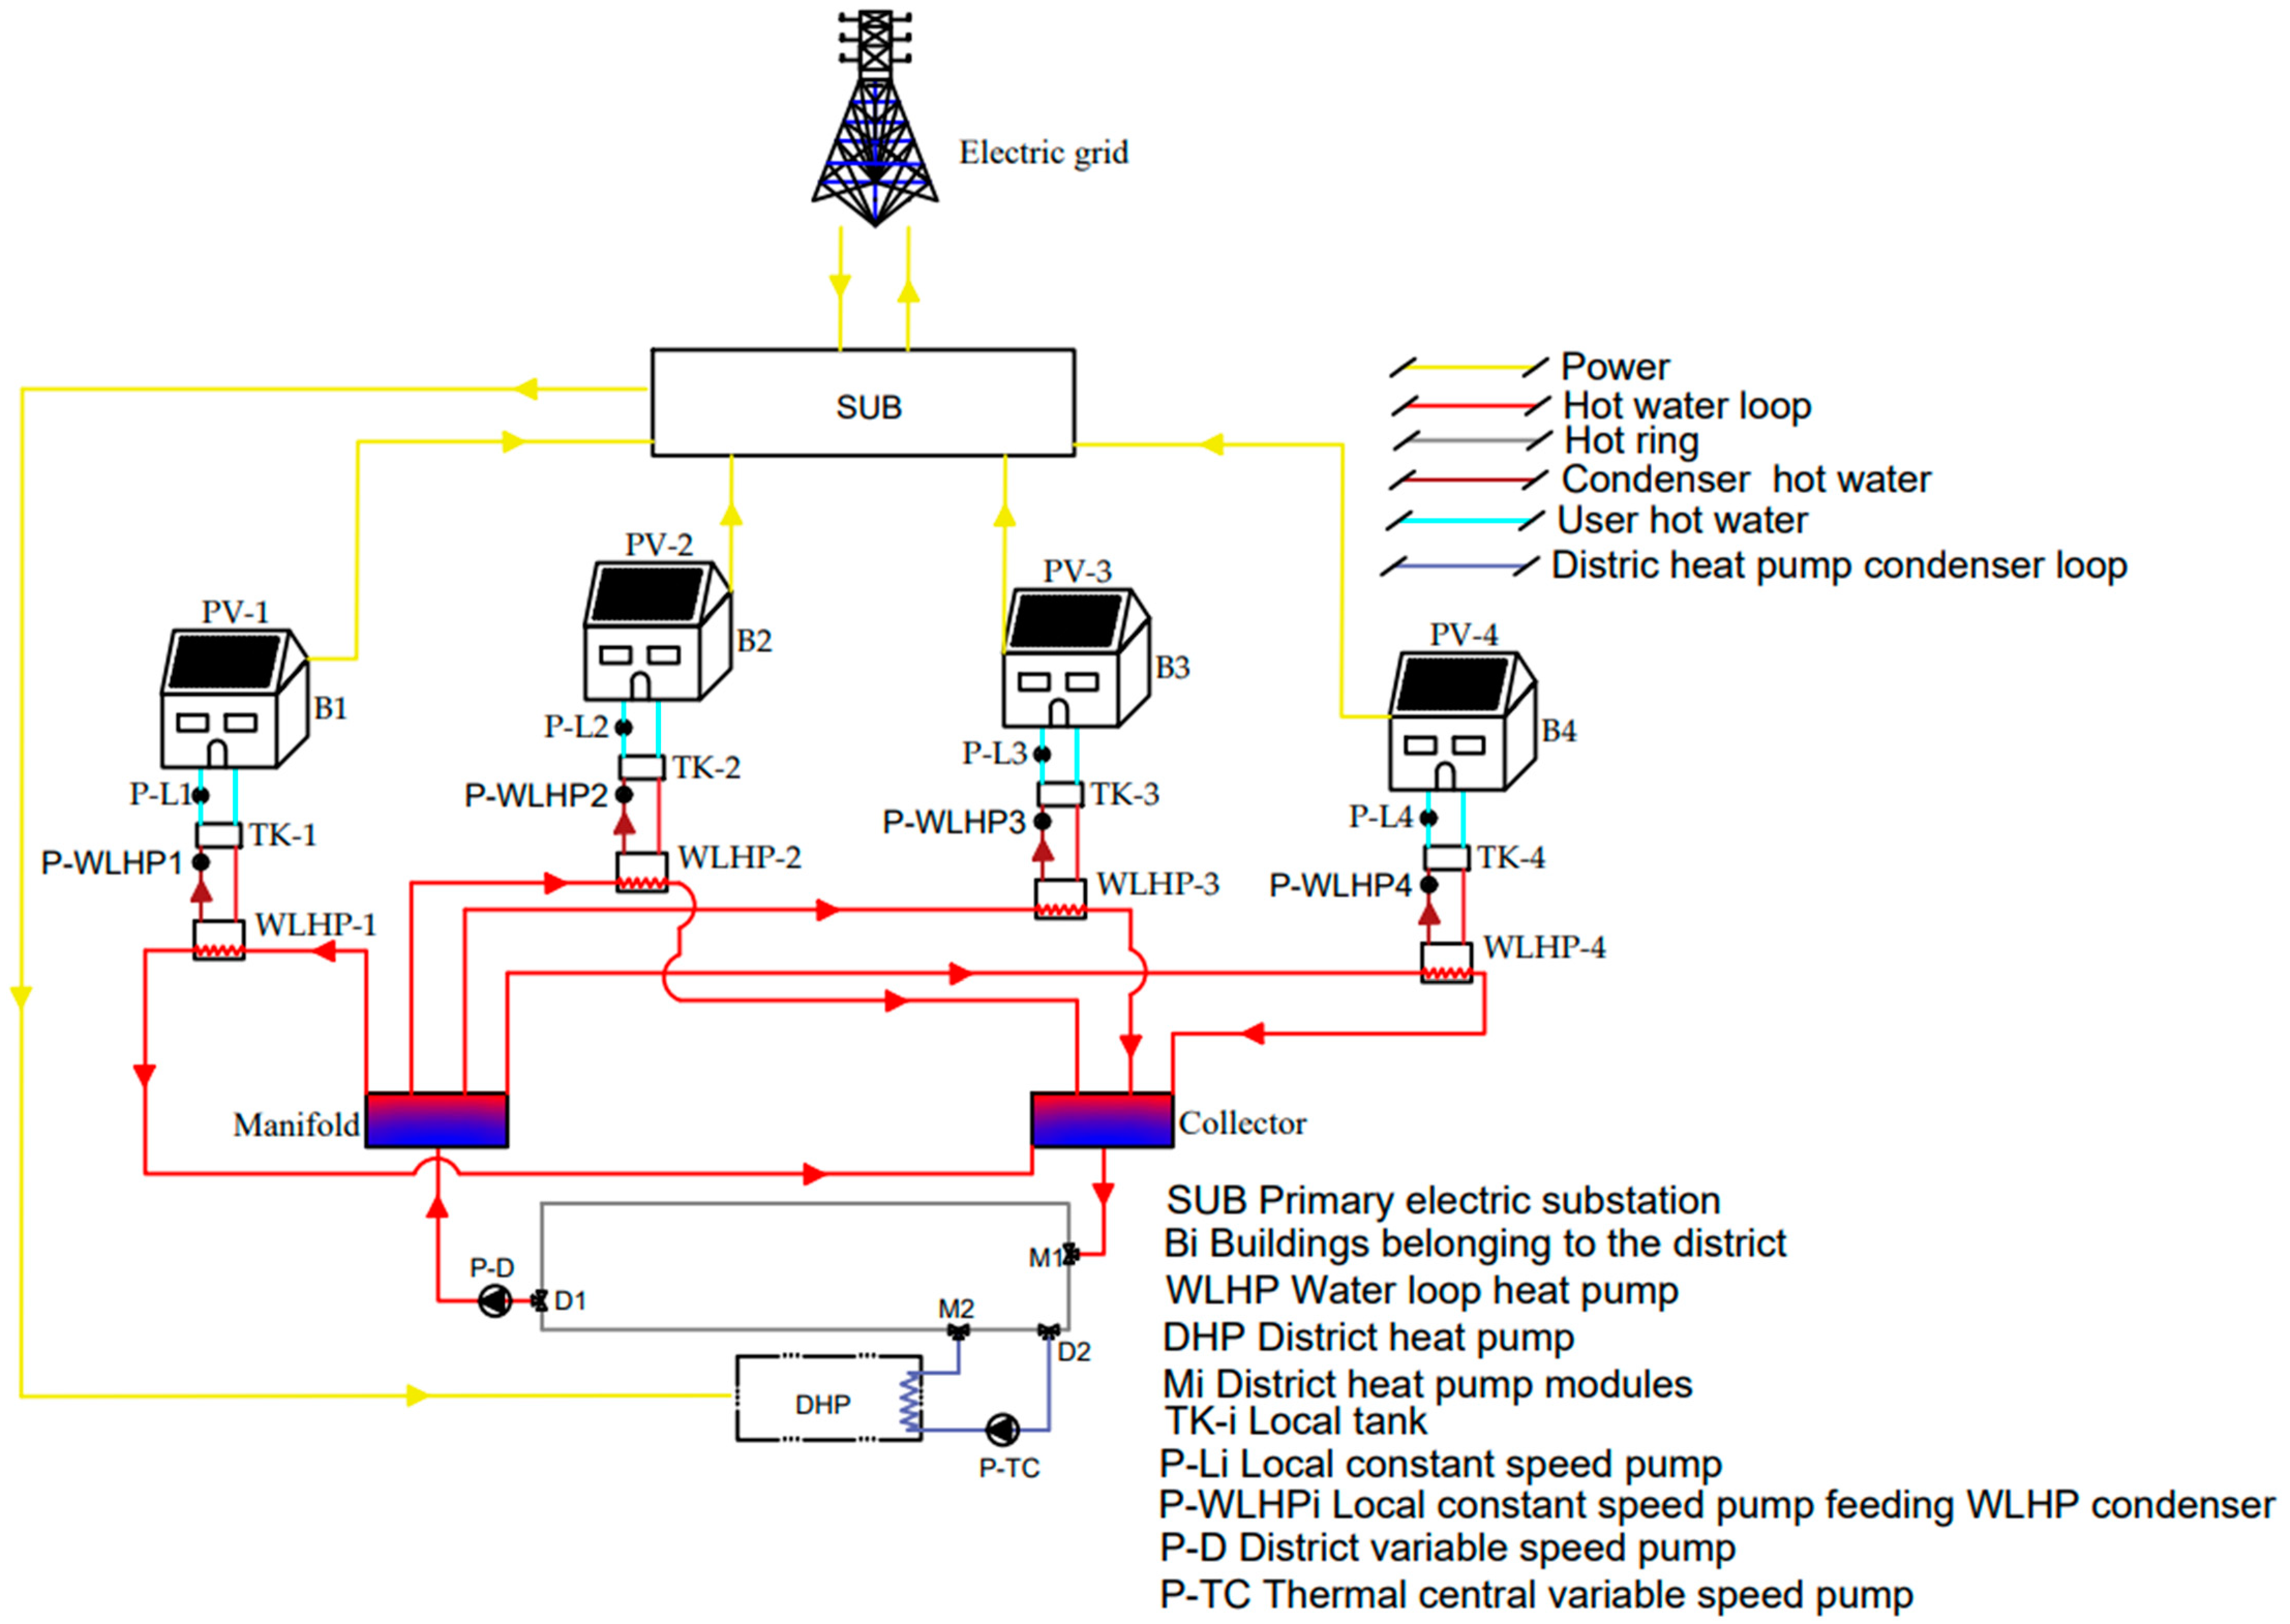
Figure 1. The layout of the REC including a district heating network and water loop heat pumps.
Energies 17 03160 g001
Figure 2. The layout of the REC combined with a district heating network integrated with a solid oxide fuel cell fed with biomethane.
Energies 17 03160 g002
Figure 3. The flowchart of the control strategy when the district is in power deficit.
Energies 17 03160 g003
Figure 4. The flowchart of the control strategy for the renewable energy community in case of power excess.
Energies 17 03160 g004
Figure 5. Dynamic results: power flows for a typical winter day.
Energies 17 03160 g005
Figure 6. Dynamic results: power flow for a typical summer day.
Energies 17 03160 g006
Figure 7. Monthly results: main electric energy flows.
Energies 17 03160 g007
Figure 8. Monthly results: main electric and thermal energy ratios and efficiency.
Energies 17 03160 g008
Figure 9. Sensitivity analysis: primary energy saving and simple payback period as a function of the photovoltaic capacity installed.
Energies 17 03160 g009
Figure 10. Sensitivity analysis: simple payback period as a function of the natural gas cost.
Energies 17 03160 g010
Table 2. Plant main components data.
ComponentParameterValueUnit
PV FieldModule efficiency0.18-
PV field-rated power per building36.40kW
PV field area3033.3m2
PV field overall power2.18MW
ADCapacity800m3
Input biomass flow rate626.4kg/h
Output-rated biogas flow rate87Sm3/h
Operating temperature37°C
Upgrading rated power120kWel
SOFCRated electric power288kWel
Rated thermal power523kWth
Electric efficiency0.502-
Flow rate of exhaust gases2005Kg/h
Temperature of exhaust gases822°C
Operating pressure of cell1bar
WLHP (WWB-0700 [46])Battery charging efficiency90%
Maximum allowed discharging/charging power1.25MW
Rated coefficient of performance (COP)4.14-
Rated water flow rate (load side)19,977kg/h
Rated water flow rate (source side)14,835kg/h
Rated load temperature 80°C
Source side temperature25–45°C
DHP (NRB-HA-2200 [46])Rated heat transfer rate620kW
Rated power demand193.5kW
Rated coefficient of performance (COP)3.20-
Rated water flow rate (load side)107,669kg/h
Rated air flow rate (source side)180,000m3/h
Rated load temperature35°C
Table 3. Yearly results.
ParameterDescriptionValueUnit
REC
(PS1)
Bio-REC (PS2)
Eel,toGRIDElectricity supplied to the grid10.6810.94GWh/year
Eel,fromGRIDElectricity withdrawn from the grid86.4485.22GWh/year
Eel,LOADElectricity load of the district129.1128.4GWh/year
Eel,PVElectricity produced by the PV fields53.3353.33GWh/year
Eel,P2HElectricity supplied to the DH system1.651.63GWh/year
Eel,SELFElectricity self-consumed42.6643.31GWh/year
Eth,DHWThermal energy demand for DHW37.0537.05GWh/year
Eth,demandHThermal energy demand for space heating71.4971.49GWh/year
Eel,SELF/Eel,LOADSelf-consumption to load ratio0.330.35-
Eel,SELF/Eel,PVSelf-consumption to PV production ratio0.800.82-
PEtotTotal primary energy consumption214.11210.88GWh/year
ΔPEDifference in primary energy consumption58.9162.14GWh/year
PESPrimary energy saving2223%
ΔCOperating costs difference14.8615.18M€/year
CCapital cost of investment69.971.2M€
SPBSimple payback4.74.7years
PIProfit index1.211.22-
NPVNet present value84.786.7M€
ΔCincOperating costs difference with incentives14.8615.46M€/year
CincCapital cost of investment with incentives69.970.9M€
SPBincSimple payback with incentives4.74.5years
PIincProfit index with incentives1.211.26-
NPVincNet present value with incentives84.789.8M€
Disclaimer/Publisher’s Note: The statements, opinions and data contained in all publications are solely those of the individual author(s) and contributor(s) and not of MDPI and/or the editor(s). MDPI and/or the editor(s) disclaim responsibility for any injury to people or property resulting from any ideas, methods, instructions or products referred to in the content.