1. Introduction
With the goal of dual carbon, integrated energy systems (IES) have become one of the most important areas for reducing emissions, which is important in terms of reducing carbon emissions and economic costs [
1,
2,
3].
IES optimization has been widely studied in recent years; Ref. [
4] constructed an electricity–hydrogen–gas integrated energy system, using carbon capture and storage (CCUS) technology to refine the source of carbon dioxide in the electricity-to-gas conversion, so that the system reduces carbon emissions. Ref. [
5] proposed an integrated energy system strategy with electricity–gas–heat coupling and established a master–slave game optimization scheduling model for the park integrated energy system (PIES) to maximize its benefits. Ref. [
6] established a co-ordinated scheduling model for an electric–heat–hydrogen hybrid power system, considering the dynamic energy storage potential of the district heating system (DHS) and the hydrogen transmission system (HTS), thus reducing the operating costs. Ref. [
7] constructed an electricity–heat–hydrogen integrated energy system, proposed a robust interval optimization scheduling model, and verified the effectiveness of hydrogen energy storage in promoting wind power consumption and improving the comprehensive utilization rate of system energy. The key technology of a hydrogen energy storage system mainly contains three aspects: hydrogen production, hydrogen storage and transportation, and fuel cell technology. Hydrogen production by water electrolysis is mainly divided into alkaline water electrolysis, solid oxide electrolytic cell (SOEC), and PEM pure water electrolysis technology. Hydrogen storage and transportation mainly adopts high-pressure gaseous hydrogen storage technology, which has lower costs and the most applications. The solid oxide fuel cell (SOFC) has also become a hot spot of IES research due to its advantages such as high energy efficiency. Ref. [
8] investigated the synergistic regulation of the flexibility resources of the integrated energy system of electricity–heat–hydrogen to reduce carbon emissions based on the topology of the electricity–heat–hydrogen energy flow interaction. Ref. [
9] utilized the heat recovery characteristics of a hydrogen energy system to promote the co-ordinated operation of energy sources and improve the economy of the system. Ref. [
10] proposed an integrated energy system operation optimization method based on the co-operative gaming of a hydrogen-containing energy storage system, which reduces the system operation cost and carbon emissions. Ref. [
11] indicated that shared energy storage offers the potential to reduce cost inefficiencies and maximize the utilization factor of energy storage resources by decoupling the ownership and use of energy storage equipment compared to individual energy storage approaches. Ref. [
12] showed that the energy system with hydrogen and WST improved economics compared to the original energy supply system, and the comprehensive energy cost of the park was reduced by 0.1351 CNY/kW. Currently, carbon emissions trading mechanisms are mainly categorized into traditional carbon trading mechanisms and laddered carbon trading mechanisms, but ladder-type carbon trading is more capable of limiting system carbon emissions than traditional carbon trading [
13,
14,
15,
16,
17,
18]. Most of the references only consider the partial coupling between electricity–heat–hydrogen–gas energy when constructing an IES; for example, Ref. [
4] constructed an IES with electricity–heat–gas energy coupling but ignored the advantage of a hydrogen storage system, which has the advantage of improving the ability of wind power consumption. Ref. [
7] constructed an IES with electricity–heat–hydrogen energy coupling but ignored the output constraints of natural gas for cogeneration pf CHP. Therefore, this study combines the advantages of the IESs constructed in the above references to construct an IES with electricity–heat–hydrogen–gas multi-energy coupling and introduces ladder-type carbon trading to make the system more economical and low-carbon.
The joint operation of energy conversion equipment can also greatly reduce the carbon emissions of the system [
18,
19], and many results have been investigated by various scholars in the optimal scheduling of an IES involving power-to-gas (P2G). Ref. [
20] refined the P2G operation process, including two stages of electrolytic hydrogen production and hydrogen methanation. The refined operation of P2G in two stages can not only make full use of hydrogen but can also make full use of methane and reaction heat generated from methanization. Ref. [
21] pointed out that P2G can promote the consumption of wind power and reduce the energy loss of the gradient at the same time. Ref. [
22] established a two-stage reaction model of P2G and proposed an energy utilization path of mixed hydrogen and oxygen-enriched deep peaking. P2G can directly produce natural gas through hydrogen methanation, and the natural gas input into CHP with two-stage P2G operation can further improve the low-carbon and economic performance of an IES. Various scholars have also achieved certain results for the optimized operation of CHP. Ref. [
23] pointed out that the CHP of CHP units with fast regulation of electrical output can effectively improve the low-carbon operation of the system, which is also conducive to the safe and stable operation of the unit. Ref. [
24] utilized a concentrated solar power and combined heat and power (CSP-CHP) hybrid energy technology to enable the system to accommodate more wind power and further reduce CO
2 emissions. Ref. [
25] proposed a source-load-side joint optimization peaking method considering thermal storage-containing cogeneration units combined with thermal power deep regulation to optimize the system peaking effect. However, when the CHP operates in the “heat-to-electricity” operation mode, the electricity and heat loads output from the unit cannot meet the system requirements. Therefore, an adjustable thermoelectric ratio can enable the CHP system to adjust the ratio of heat and electricity output according to the current demand and conditions to minimize the operating costs.
Table 1 summarizes the types of IES in the above studies and their technical applications for low carbon optimization (where 🗶 indicates that the paper did not study this aspect and 🗸 indicates that this aspect is studied). However, most of the references are considered incomplete in studying the joint P2G-CHP operation. For example, Ref. [
18] did not consider the adjustable thermoelectric ratio in studying CHP. Few references consider the joint operation of two-stage P2G with adjustable thermoelectric ratio CHP. Therefore, this study of two-stage P2G and with an adjustable thermoelectric ratio CHP joint operation process has positive significance for realizing multi-energy coupling and complementarity and reducing the system operation costs.
Based on the above studies, this study proposes a low-carbon optimization strategy for multi-energy coupled IES with hydrogen storage and two-stage P2G-adjustable thermoelectric ratio CHP joint operation. This study uses MATLAB R2021b to construct the low-carbon economic operation goal to improve the wind power consumption capacity and minimize the energy purchase costs, carbon trading costs, and wind abandonment costs. Therefore, the work of this study is as follows:
A low-carbon optimal scheduling model of IES with multi-energy coupling of electricity–heat–hydrogen–gas is constructed, and a hydrogen storage system is added to improve the system’s ability to consume wind power by using the synergistic regulation of SOEC and SOFC.
The two-stage P2G is utilized instead of the traditional P2G operation, and the characteristics of HFC can be used to directly convert hydrogen energy into electricity and heat and combined with the adjustable thermoelectric ratio CHP to further improve the low-carbon and economic performance of IES.
The constructed IES with hydrogen storage and two-stage P2G-adjustable thermoelectric ratio CHP combined operation is compared with other energy systems, which verifies the effectiveness of the system in reducing the total operation cost and carbon emissions.
The rest of this paper is structured as follows.
Section 2 introduces the operational framework of the electricity–heat–hydrogen–gas IES and its modeling and establishes the objective function and constraints of the power of the electricity–heat–hydrogen–gas.
Section 3 compares the scenarios and concludes.
Section 4 concludes the paper.
2. Materials and Methods
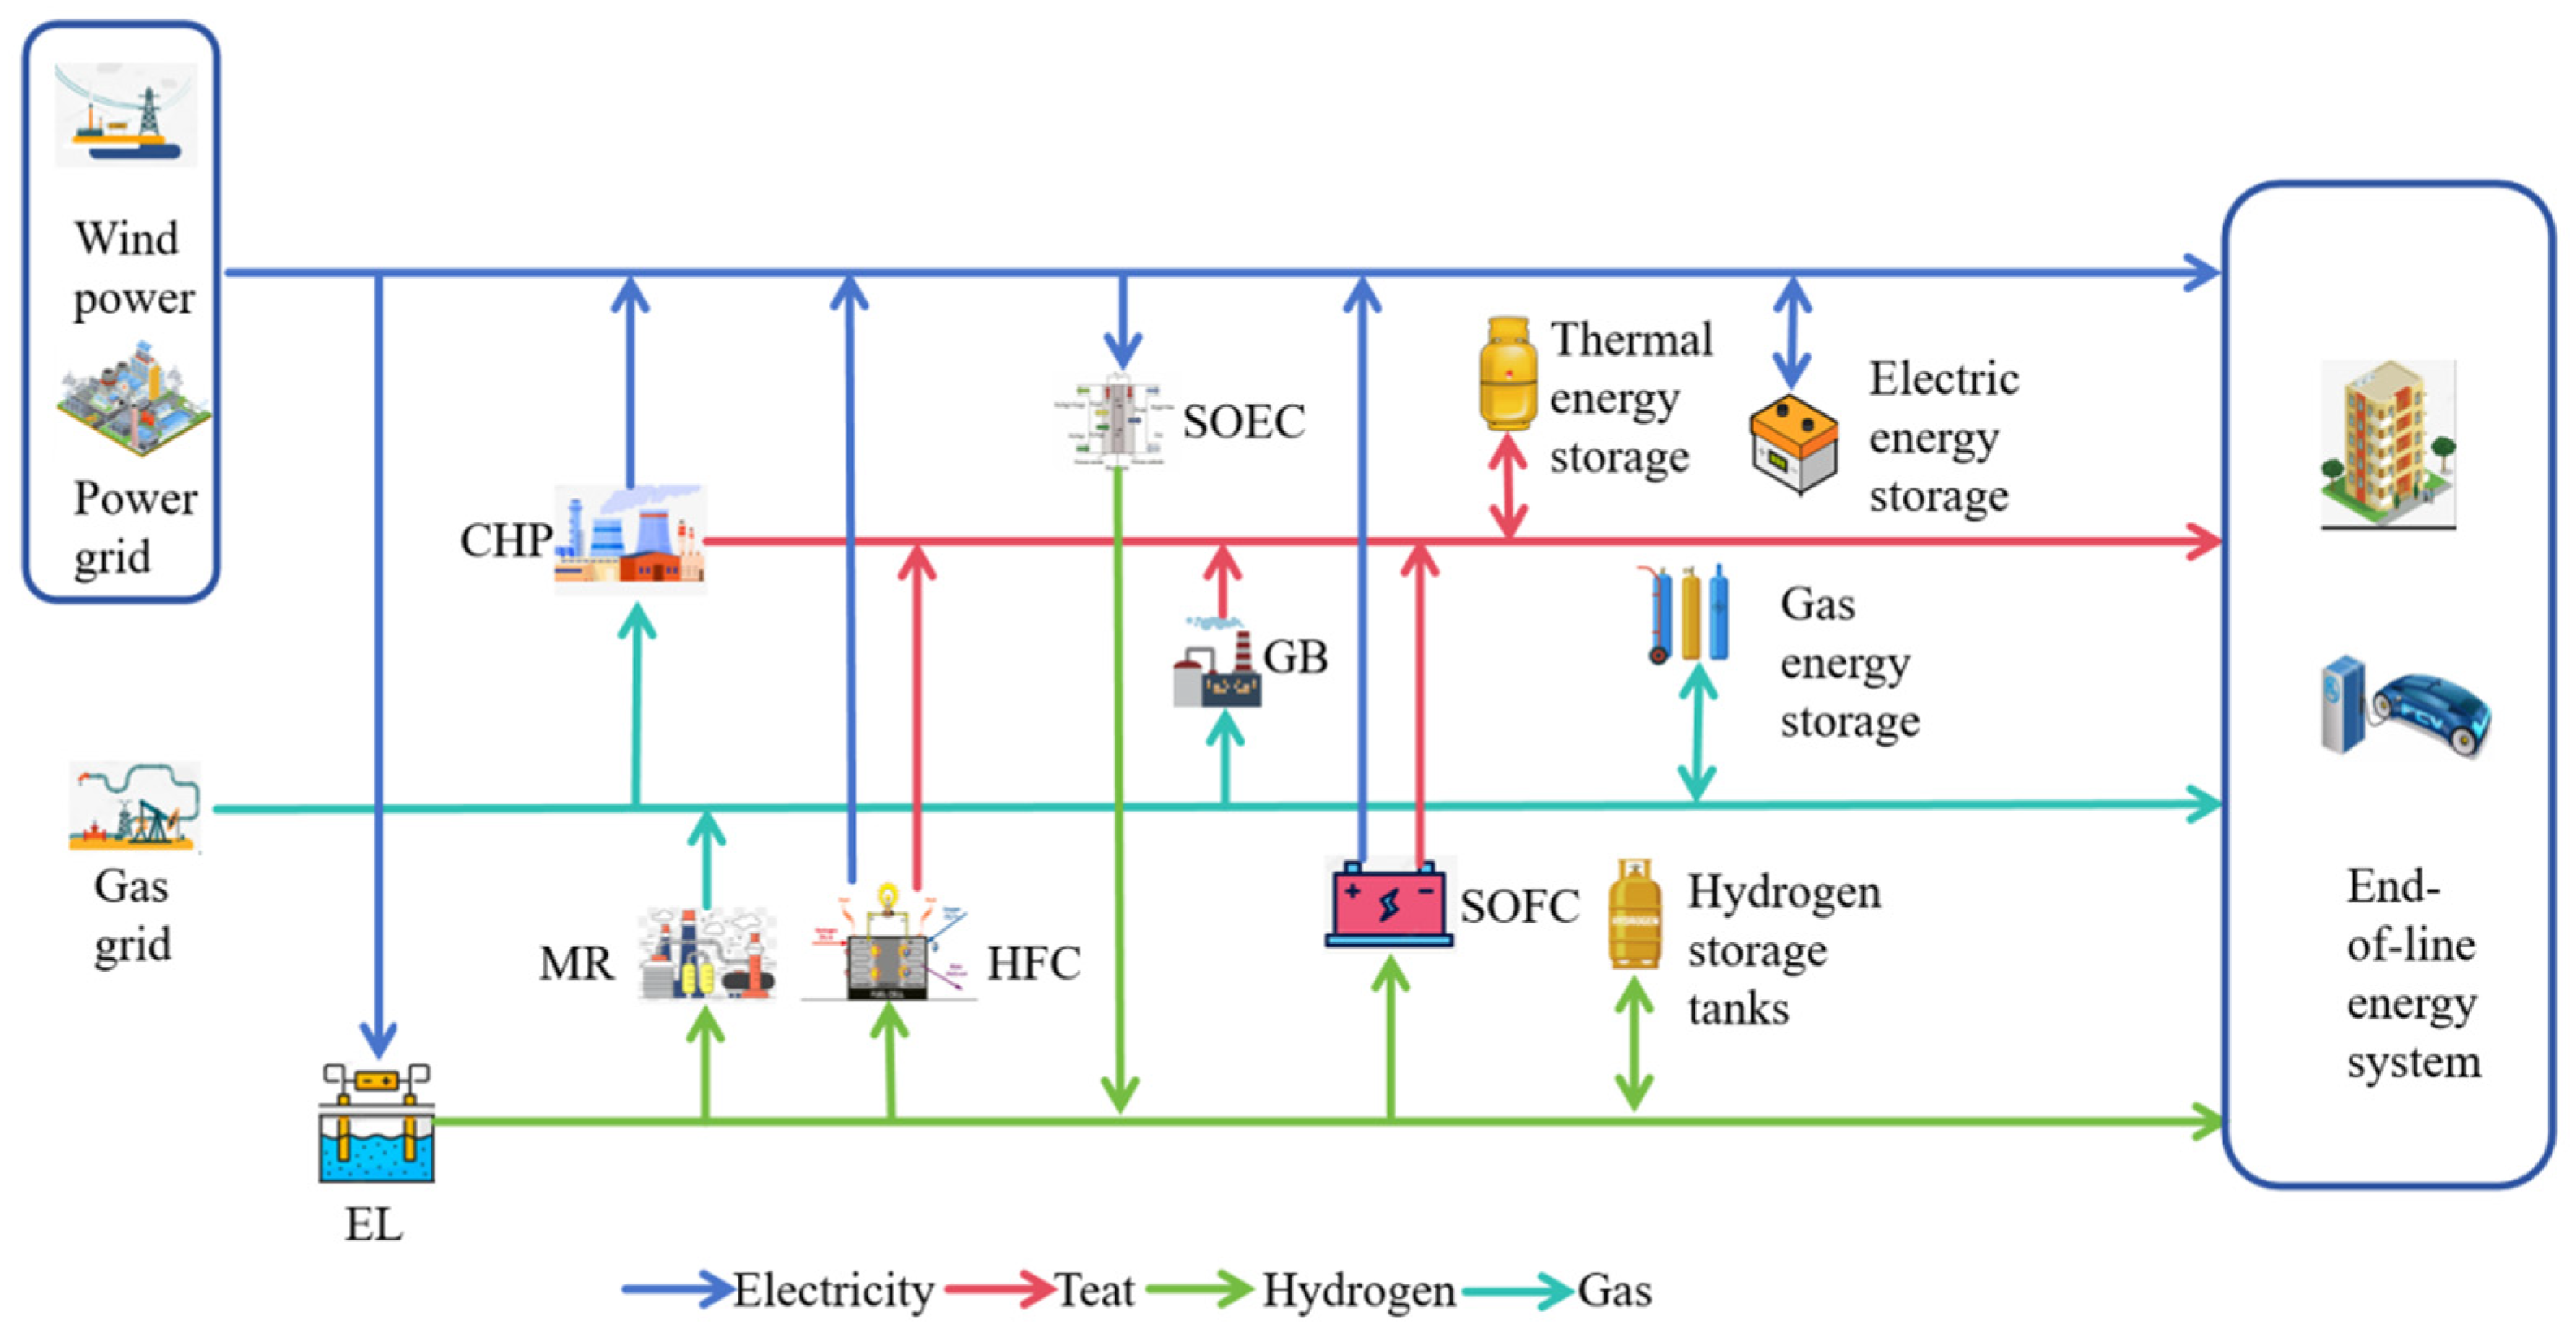
An IES is a system that integrates different types of energy sources and energy technologies to achieve more efficient, sustainable, and economical energy production, conversion, storage, and utilization. The framework for constructing the electricity–heat–hydrogen–gas IES operation is shown in
Figure 1.
The IES low-carbon operation framework diagram established in this study consists of five systems, including four energy flows: electricity, heat, hydrogen, and gas. The energy supply system consists of wind power, power grid, and gas grid; the energy conversion system consists of CHP, an electrolyzer (EL), a hydrogen fuel cell (HFC), a methane reactor (MR), and a gas boiler (GB); the hydrogen storage system consists of SOEC, a hydrogen storage tank, and SOFC; the energy storage system consists of gas storage, electricity storage, and heat storage; and the end-of-line energy system mainly consumes four types of energy: electricity, heat, hydrogen, and gas. The CO2 involved in the operation process of each equipment is eventually traded through the carbon trading market.
2.1. Ladder-Type Carbon Trading
The ladder-type carbon trading model based on Ref. [
19]:
- (1)
Carbon emissions allowance modeling.
where
is the total carbon emissions of IES;
,
, and
are the carbon emissions from purchasing electricity from the superior grid, CHP, and GB, respectively.
and
are the carbon emissions from consuming unit electricity and gas energy, respectively.
and
are the electricity and heat energy output from CHP at time t, respectively.
and
are the power purchased from the superior grid at time t, respectively, and the heat energy output from GB, respectively.
is the scheduling cycle.
- (2)
Actual carbon emissions modeling.
The MR equipment in the two-stage P2G model also absorbs a portion of CO
2 during operation; therefore, the actual carbon emissions modeling needs to take into account the CO
2 absorbed by MR.
where
is the actual carbon emissions of IES.
is the actual carbon emissions of superior power purchase.
and
are the actual carbon emissions of CHP and GB, respectively.
is the actual amount of CO
2 absorbed by MR equipment in the two-stage P2G model.
,
, and
are the actual calculation parameter of carbon emissions from combustion units CHP and GB, respectively.
is the calculated parameter of CO
2 absorbed by MR in the two-stage P2G model.
is the output gas power from MR in the moment t.
In summary, the actual participation in the carbon trading market is the amount of carbon surrender rights traded:
- (3)
Ladder-type carbon trading model.
where
is the stepped carbon trading cost.
is the price growth rate.
is the length of the carbon emissions interval.
is the carbon trading base price.
2.2. Electricity–Hydrogen and Gas–Heat Coupling Model
SOEC is an all-solid-state chemical electrolysis device capable of efficient and environmentally friendly direct conversion of thermal and electrical energy into chemical energy in fuels at medium and high temperatures and is one of the main technological routes for hydrogen production by electrolysis of water, which has the advantages of high energy conversion efficiency and does not require the use of precious metal catalysts. Ref. [
26] realized the application of SOEC in wind farms by using SOEC electrolysis of water to produce hydrogen for smoothing the output power fluctuation of wind farms.
SOFC is a highly efficient device that directly converts fuels such as hydrogen into electricity and heat by electrochemical reaction without combustion process. Ref. [
8] utilized the hydrogen–electricity and hydrogen–heat conversion of SOFCs to enhance the scenery utilization and reduce carbon emissions while taking into account the electricity and heat requirements of the system.
In this study, the thermoelectric ratio model of SOFC is also set to be adjustable in order to maximize the optimization of the system’s energy use efficiency.
where
is the energy conversion rate of the SOEC.
and
are the electricity power input to the SOEC and the hydrogen power output at time t, respectively.
and
are the upper and lower limits of the electric power constraints of the input SOEC, respectively.
and
are the upper and lower limits of the electric power change of the SOEC, respectively.
where
and
are the conversion efficiency of SOFC to electrical and thermal energy, respectively.
and
are the upper and lower limits of the thermoelectric ratio of SOFC, respectively.
,
, and
are the hydrogen power input to SOFC and the electricity and heat power output at moment t, respectively.
and
are the upper and lower limits of the hydrogen power constraints on the input SOFC, respectively.
and
are the upper and lower limits of the hydrogen power change of SOFC, respectively.
- (3)
GB model:
GB is the intermediate station of gas–heat conversion; GB burns natural gas to provide heat energy; the heat efficiency can be as high as about 95%, which can meet the demand of heat load.
where
is the energy conversion rate of GB.
and
are the gas power input to GB and the thermal power output at moment t, respectively.
and
are the upper and lower limits of the gas power constraints of the input GB, respectively.
and
are the upper and lower limits of the gas power change of GB, respectively.
2.3. Adjustable Thermoelectric Ratio CHP
CHP is an extremely efficient way of utilizing energy, with the core objective of maximizing the energy of the fuel in a single process to produce both electrical and thermal energy. Ref. [
27] states that constant thermoelectric ratio CHP units make the system less adjustable when operating. Therefore, adjustable thermoelectric ratio CHP can automatically regulate the thermoelectric output according to the system demand.
where
and
are the electricity and heat energy conversion efficiency of the CHP, respectively.
and
are the upper and lower limits of the thermoelectric ratio of the CHP, respectively.
is the gas power input to the CHP at time t.
are the upper and lower limits of the gas power constraints on the input to the CHP, respectively.
are the upper and lower limits of the change in the gas power of the CHP, respectively.
2.4. Two-Stage P2G Model
Based on the two-stage P2G constructed in Ref. [
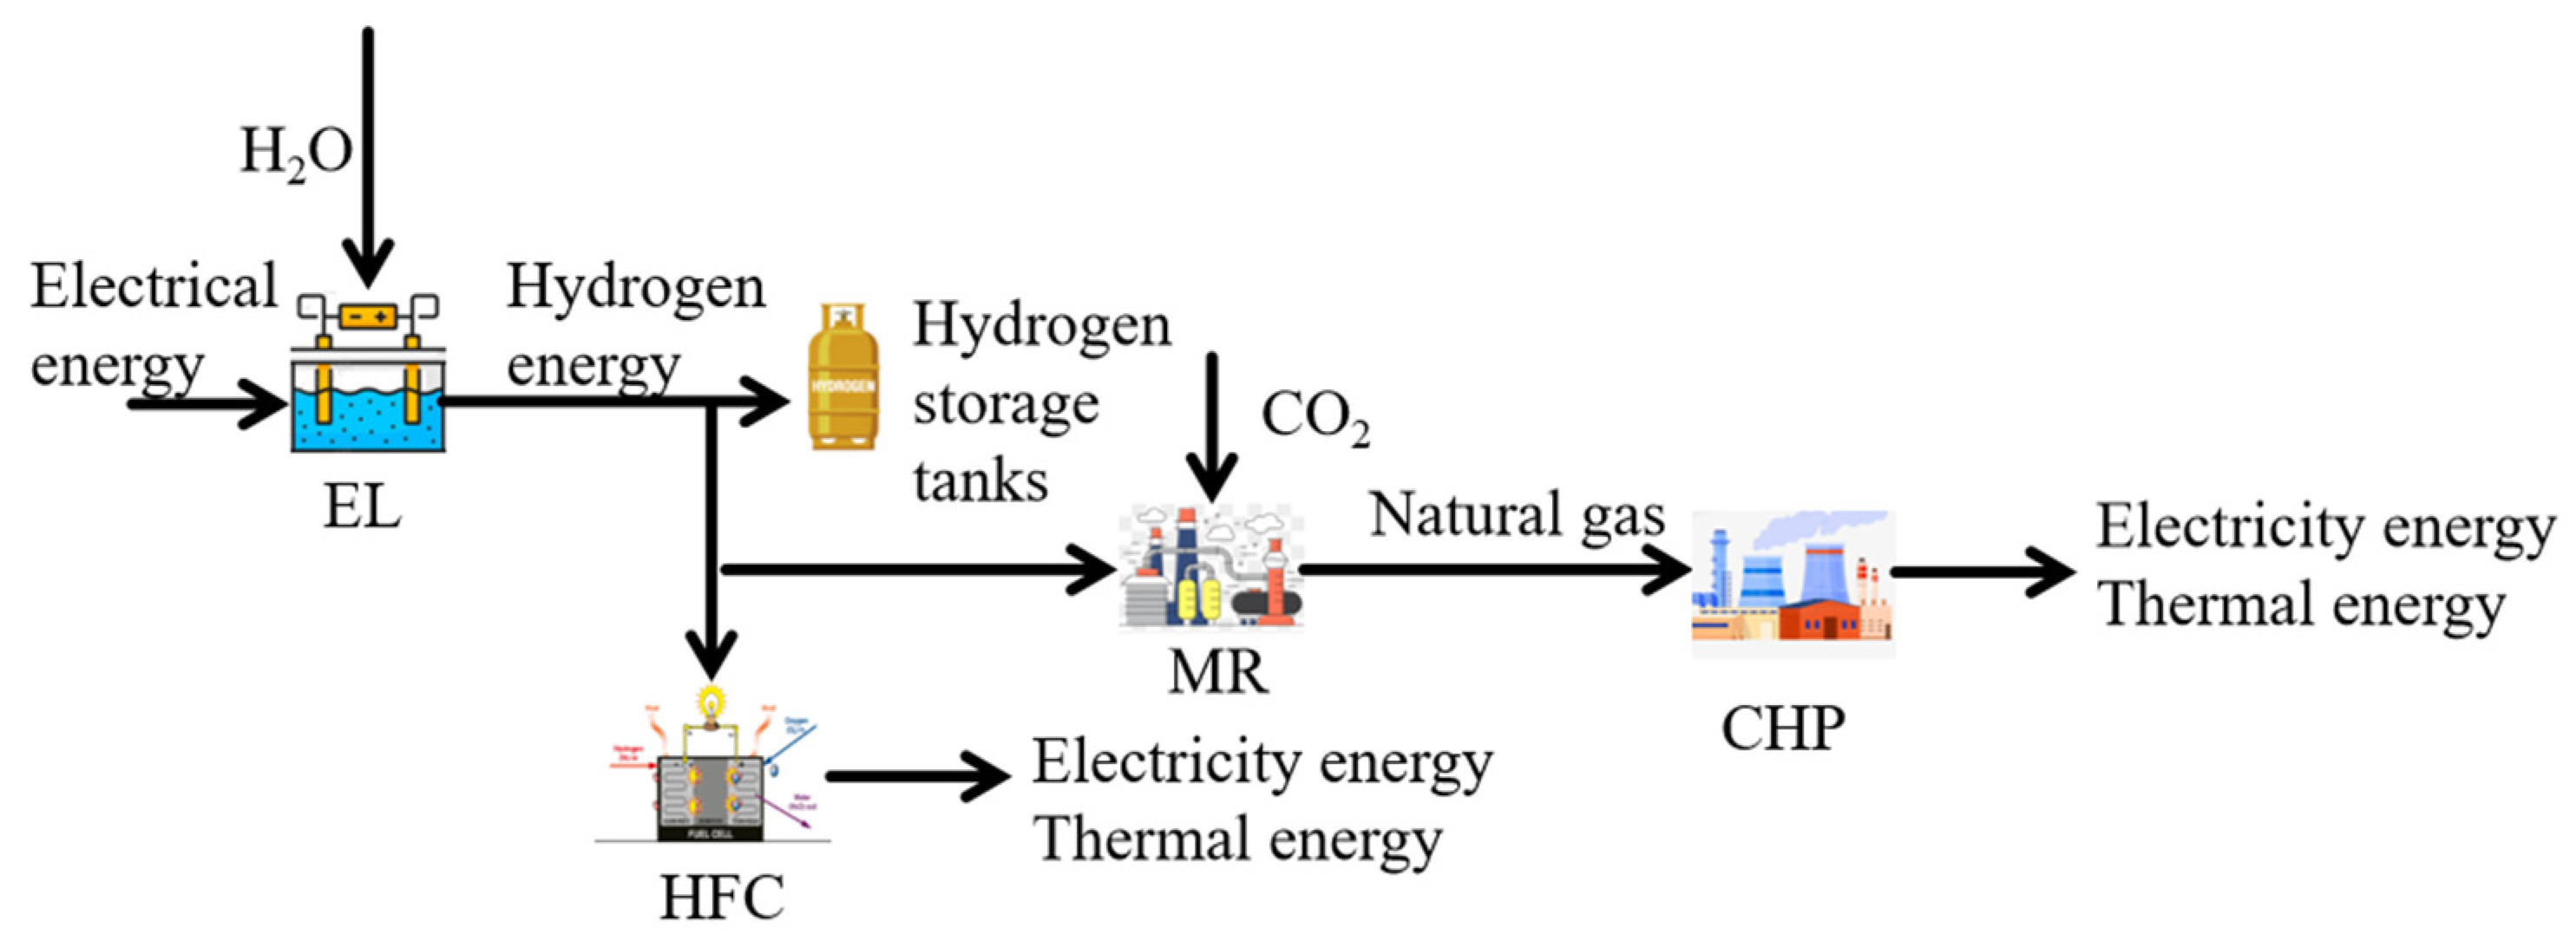
20], it is known that the two-stage P2G operation consists of two stages: electrolytic hydrogen production and hydrogen methanation. The operation process can be seen in
Figure 2. EL converts electricity into hydrogen energy, MR absorbs CO
2 to convert hydrogen energy into gas energy, and the gas energy is then transported to CHP to generate electricity and heat energy. The two-stage P2G mainly adds HFC equipment, which can directly convert the hydrogen energy generated by EL into electricity and heat, reducing the output of CHP and eliminating an energy conversion link.
where
is the energy conversion rate of the EL.
and
are the electricity power input to the EL and the hydrogen power output at time t, respectively.
and
are the upper and lower limits of the electricity power constraints of the input EL, respectively.
and
are the upper and lower limits of the electricity power change of the EL, respectively.
where
is the energy conversion rate of the MR.
is the hydrogen power input to the MR at time t.
and
are the upper and lower limits of the hydrogen power constraint of the input MR, respectively.
and
are the upper and lower limits of the hydrogen power change of the MR, respectively.
where
and
are the electricity and thermal energy conversion efficiencies of HFC, respectively.
and
are the upper and lower limits of the thermoelectric ratio of HFC, respectively.
, and
are the hydrogen power input to HFC and the electricity and thermal power output at moment t, respectively.
and
are the upper and lower limits of the hydrogen power constraints on the input to HFC, respectively.
and
are the upper and lower limits of the hydrogen power change of HFC, respectively.
2.5. Models of Energy Storage Equipment
The energy storage models constructed based on Ref. [
21] are all roughly the same.
where
is the final output power of the nth type of energy storage device at the moment t.
is the rated capacity of the nth type of energy storage device.
is the total amount of the nth type of energy storage device at the moment t.
is the single charging and discharging maximum power of the nth type of energy storage device.
and
are the upper and lower limit of the capacity of the nth type of energy storage device, respectively.
and
are the charging and discharging power of the nth type of energy storage device at the moment t, respectively.
and
are the charging and discharging energy state flag, 0–1 variable, respectively.
and
are the charging and discharging efficiencies of the nth type of energy storage device at the moment t, respectively.
2.6. Objective Function
- (1)
Wind power consumption capacity [
8]:
Wind power consumption capacity refers to the ability of the system to effectively accept and utilize wind power generation, and wind power utilization rate indicators are constructed to evaluate the consumption capacity.
where
is the amount of abandoned wind.
is the equivalent electricity load of the system at moment t when the operation of the equipment is considered.
is the electricity load of the system at moment t.
is the wind power output at moment t.
- (2)
The cost of energy purchases :
The cost of energy purchases includes the cost of purchasing electricity and the cost of purchasing gas.
where
is the price of electricity at moment t.
is the price of gas at moment t.
is the amount of gas purchased at moment t.
- (3)
Carbon transaction costs are shown in Equation (4).
- (4)
Wind abandonment costs :
Wind abandonment costs are the costs of wind power that is abandoned due to wind power generation exceeding system demand.
where
is the abandoned wind power at moment t.
is the unit abandoned wind cost.
2.7. Restrictive Constraints
- (1)
Wind power constraints:
where
is the upper limit of wind power output.
- (2)
Energy conversion equipment constraints:
Operational restrictions for SOEC, SOFC, GB, CHP, EL, MR, and HFC can be found in Equations (5)–(11).
- (3)
Energy storage device constraints:
Due to the similarity of the energy storage models for electricity, heat, gas, and hydrogen, they are modeled in a unified way, as seen in Equation (12).
- (4)
Heat power balance constraints:
where
is the power input to heat energy storage at moment t.
is the heat load of the system at moment t.
- (5)
Gas power balance constraints:
where
is the power of input gas storage at moment t.
is the gas load of the system at moment t.
is the gas purchase limit at each moment.
- (6)
Hydrogen power balance constraints:
where
is the power input to the hydrogen storage at moment t.
- (7)
Electrical power balance constraints:
where
is the power of the input electricity storage at moment t.
is the power purchase limit at each moment.
3. Results and Discussion
The operating environment for this study is windows11 (The manufacturer is Microsoft in Redmond, WA, USA), the CPU is 11th Gen intel (R) Core (TM) i5-11400H@2.70 GHz (The manufacturer is Intel in Santa Clara, CA, USA), and the GPU is NVIDIA Ge Force RTX 3050 Laptop GPU (The manufacturer is NVIDIA in Santa Clara, CA, USA).
The parameters of the energy conversion equipment can be found in
Table 2, the values of the model parameters can be found in
Table 3, and the parameters of each energy storage equipment, the time-sharing tariffs and gas prices, the wind power output within the system, and the forecasts of the electricity, heat, and gas loads can be found in the appendix of Ref. [
21].
To verify the validity of the model in this study, five scenarios are set up:
Scenario 1: Under the ladder-type carbon trading mechanism, the hydrogen energy storage system with two-stage P2G-adjustable thermoelectric ratio CHP joint operation mode is considered.
Scenario 2: Under the traditional carbon trading mechanism, the hydrogen energy storage system is considered to operate in conjunction with the two-stage P2G-adjustable thermoelectric ratio CHP.
Scenario 3: Under the ladder-type carbon trading mechanism, the two-stage P2G-adjustable thermoelectric ratio CHP combined operation mode is considered without considering a hydrogen storage system.
Scenario 4: Under the ladder-type carbon trading mechanism, the hydrogen storage system is considered to operate in combination with a two-stage P2G-fixed CHP with a CHP ratio of 1.2.
Scenario 5: Under the ladder-type carbon trading mechanism, a hydrogen storage system operating in conjunction with a conventional P2G (EL and MR equipment only)-adjustable thermoelectric ratio CHP is considered.
3.1. Analysis of the Effects of Ladder-Type Carbon Trading
Under the ladder-type carbon trading mechanism, let
= 500 kg,
= 25%, and
= 0.035 USD/kg. The dispatch results for Scenario 1 and Scenario 2 are shown in
Table 4. This study uses the carbon emissions in Scenario 1 (4274.9 kg) as a specific reference.
Scenario 1 has a stepped increase in the purchase price of carbon credits under the ladder-type carbon trading mechanism, which reduces carbon emissions by 94.4 kg or 2.16%, compared with Scenario 2. To a certain extent, the carbon emissions of the system are further limited. However, since Scenario 2 is a traditional constant price mechanism, the carbon trading cost of Scenario 2 is lower by 10.03% compared with the stepped pricing of Scenario 1.
The choice of carbon trading base price also has significant impacts on the carbon emissions of the system, and
Table 5 illustrates the relationship between carbon trading base price, carbon emissions, and total costs.
As the base price of carbon trading increases, the overall carbon emissions decrease and the total costs gradually increase. When the base price of carbon trading is lower than 0.056 USD/kg, the trend of carbon emissions decrease is higher than the base price over 0.056 USD/kg. The main reason is that, with the increase in base price, the target cost of carbon emissions becomes more and more important, which makes the role of carbon trading cost more and more significant. Therefore, the system can only reduce the total costs by quickly reducing carbon emissions. However, when the base price reaches a certain value, the operation of the equipment within the system tends to stabilize and the weight of the carbon emissions target cost decreases. The system then slows down the rate of reducing carbon emissions and the system’s carbon emissions reaches a stable value.
3.2. Analysis of the Effects of Hydrogen Energy Storage Systems
In order to reflect the improvement of the hydrogen energy storage system on the system’s wind power consumption capacity and the reduction in carbon emissions and costs, Scenario 1 and Scenario 3 are set up. The scheduling results under the two scenarios are shown in
Table 6. As shown in
Table 6, Scenario 1 lowers carbon emissions by 159 kg, or 3.5%, compared with Scenario 3, the total costs decrease by 3.4%, and the system’s wind power consumption capacity improves by 4.6%.
Equally dividing the day into 24 time periods,
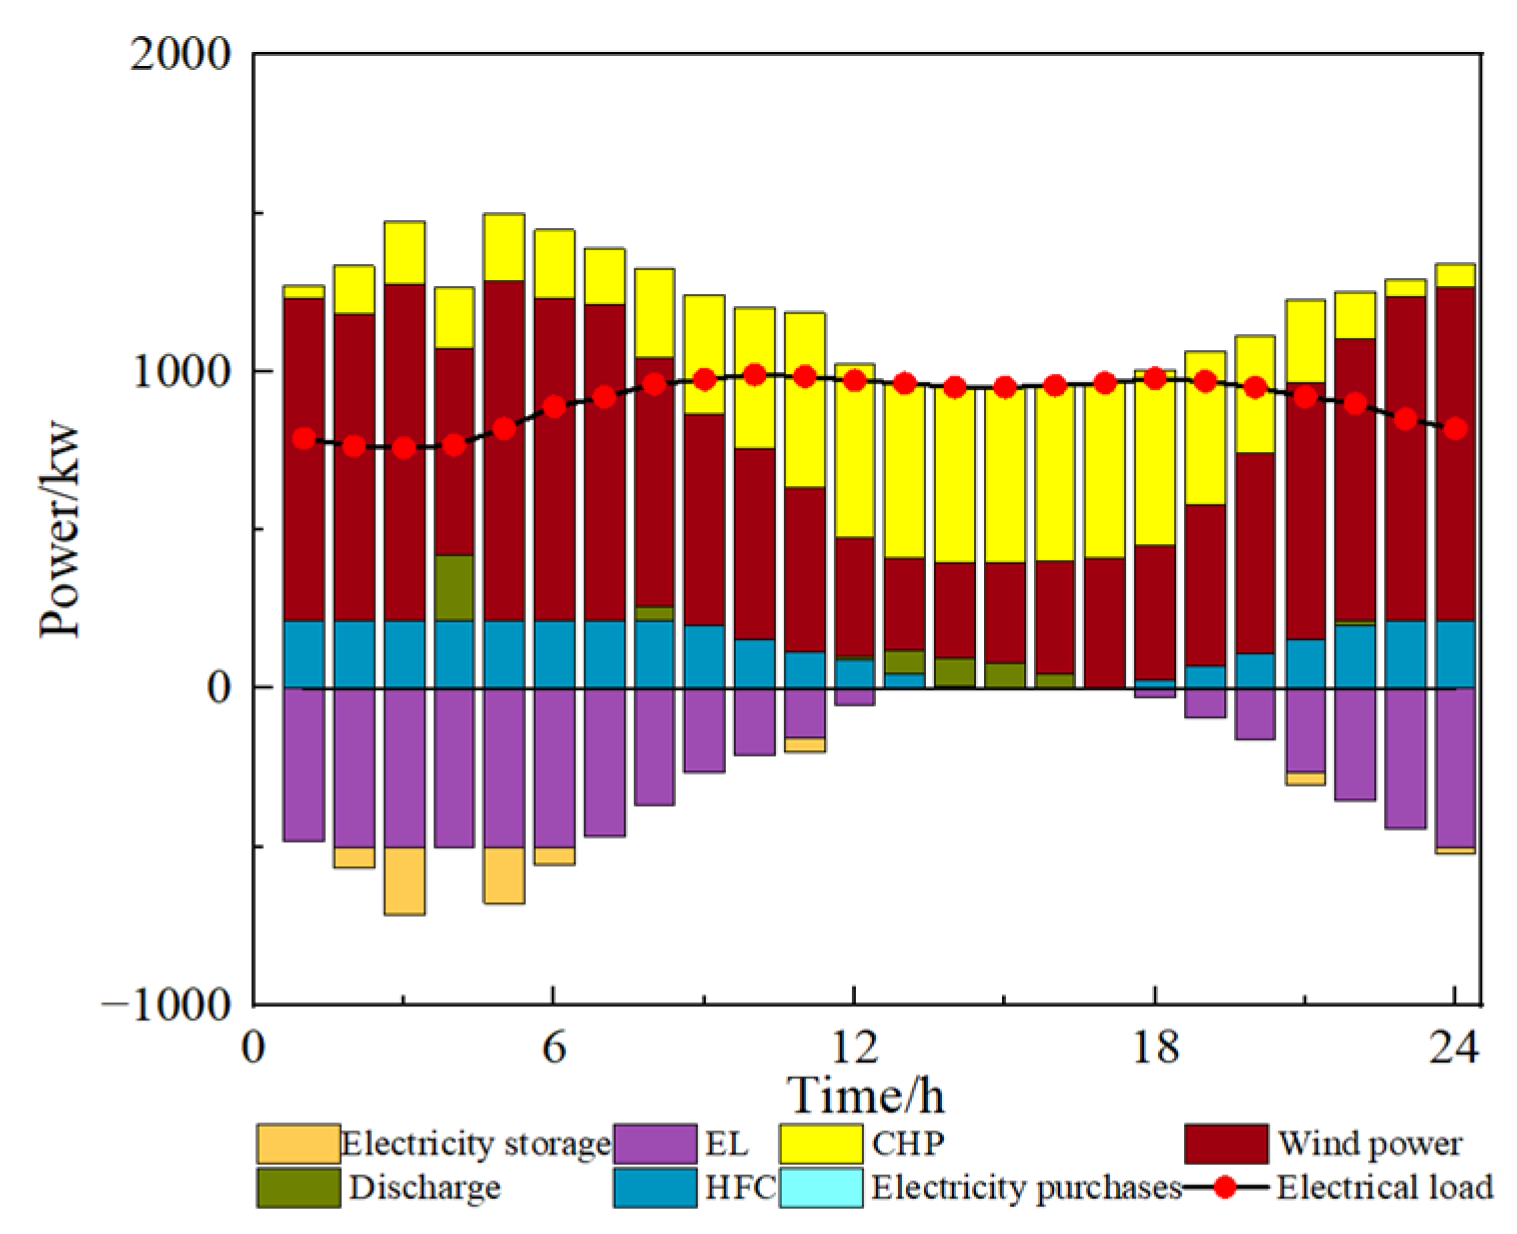
Figure 3 and
Figure 4 illustrate the internal electricity power balance of the system for both scenarios,
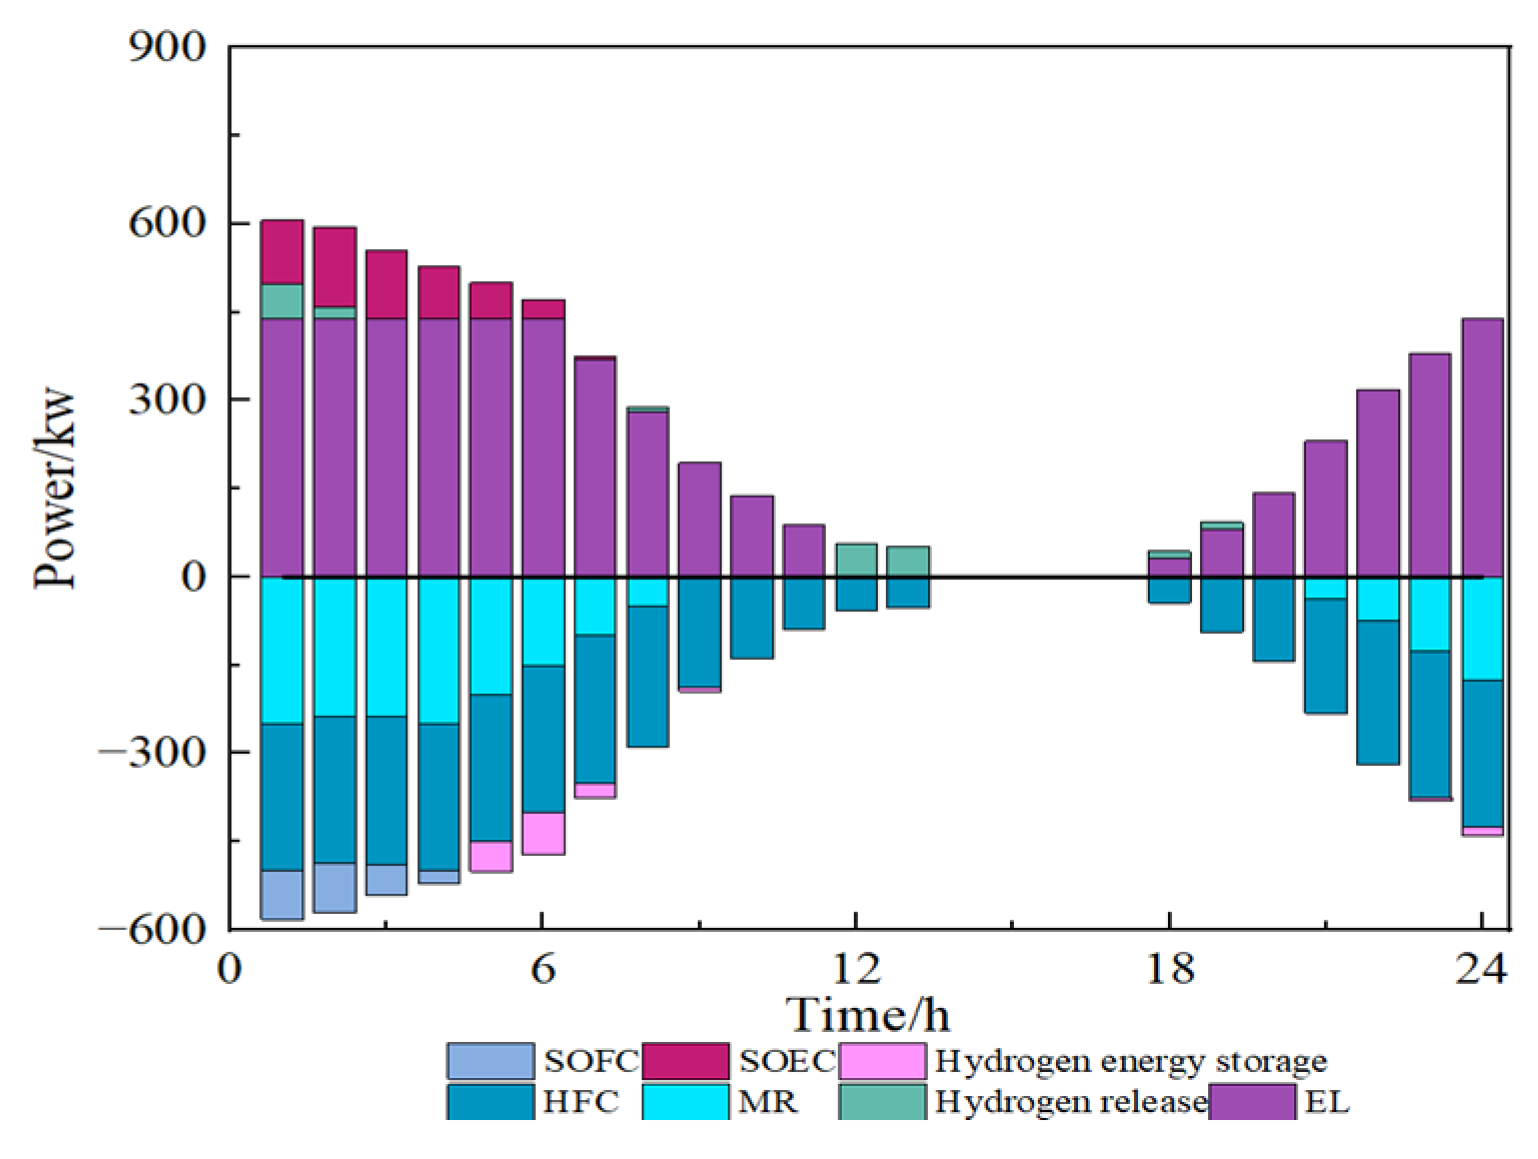
Figure 5 shows the internal hydrogen power balance of the system for Scenario 1, and
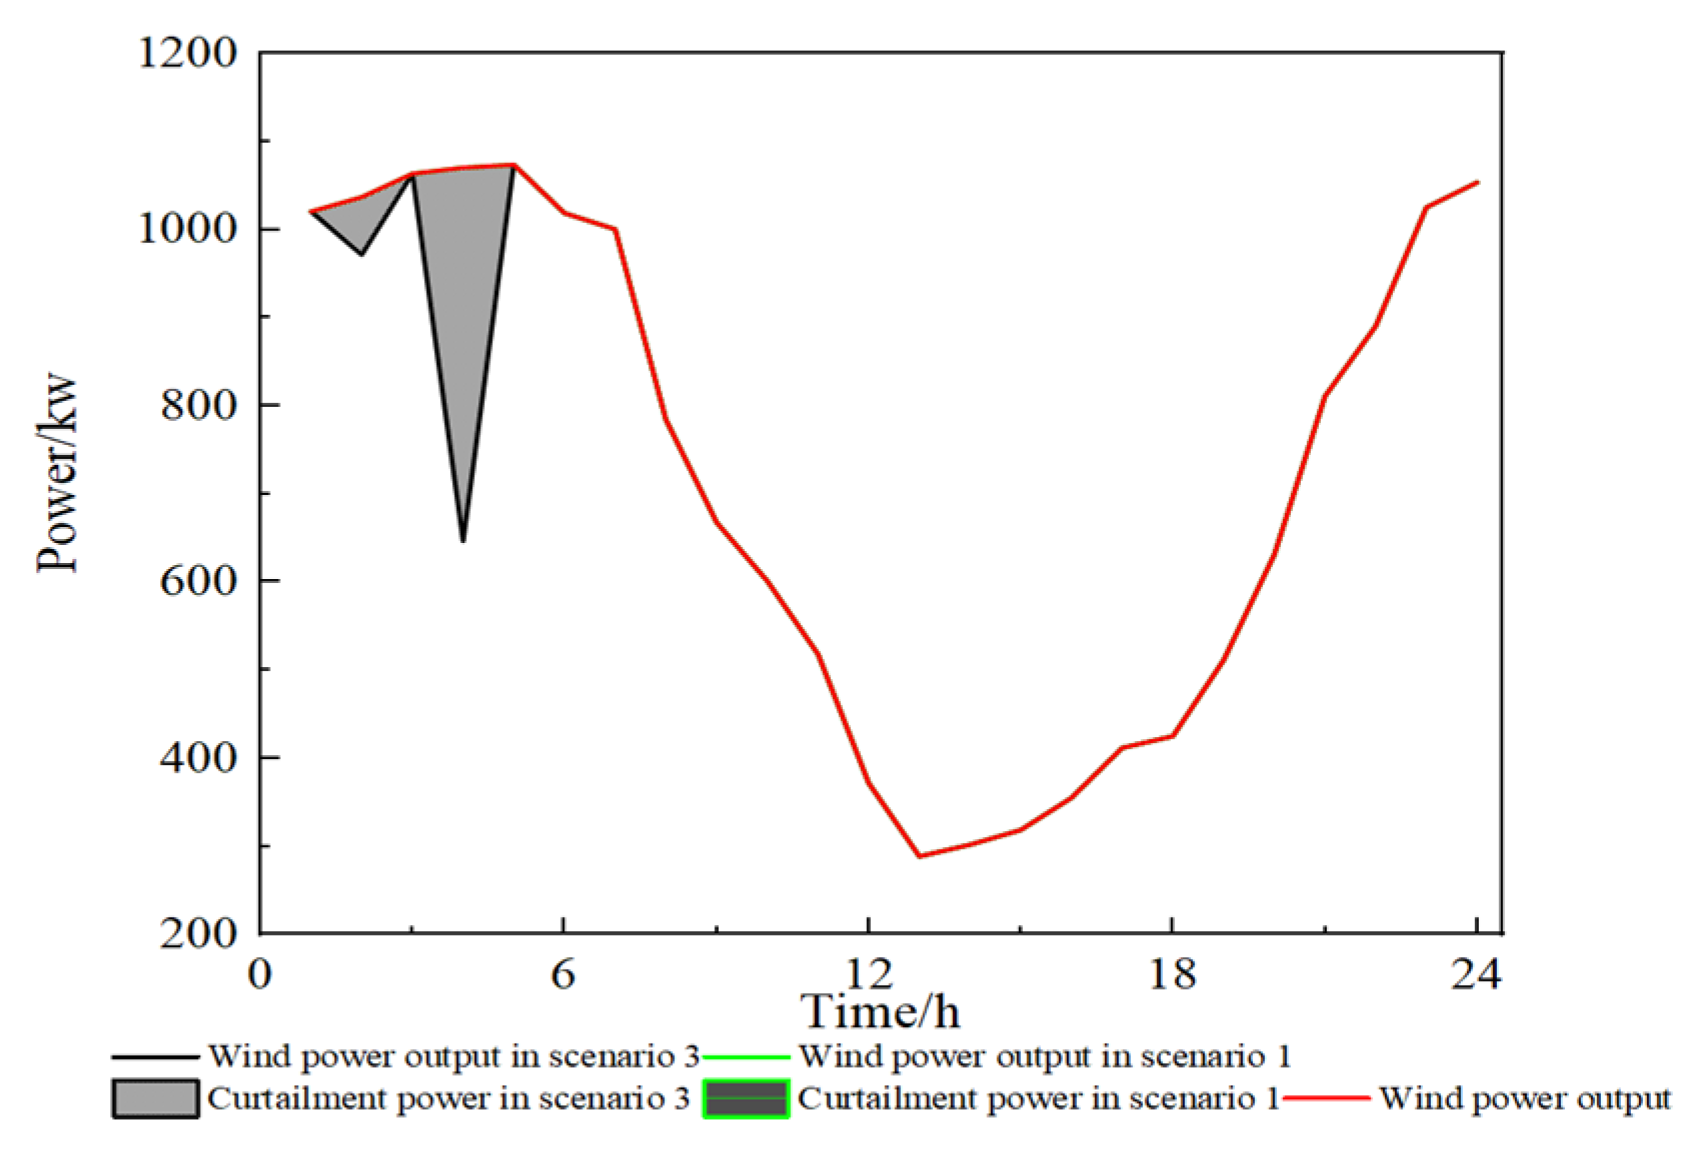
Figure 6 illustrates the abandoned wind power for both scenarios.
Scenario 3 does not include a hydrogen storage system and, as can be seen in
Figure 4, wind power is at its peak during the nighttime hours and at its trough during the daytime hours. The electric load of the system is in the trough period during the nighttime. Most of the wind power is directly consumed by the system, and some of it is stored by the electricity storage and released in the afternoon peak hour. As can be seen in
Figure 6, Scenario 3 still produces abandoned wind power at night.
Scenario 1 adds a hydrogen storage system and, as can be seen in
Figure 3 and
Figure 5, the SOEC will absorb the remaining energy from the wind power during the nighttime hours and then convert it into hydrogen, which will be provided to the hydrogen storage tanks or supplied to the SOFC, and the hydrogen supplied to the SOFC will generate electricity through the electricity–hydrogen coupling to make up for the shortfall in the system. As can be seen in
Figure 6, there is no wind abandonment in Scenario 1.
The reason for the reduction in carbon emissions in Scenario 1 compared to Scenario 3 is that the SOEC converts the excess electricity into hydrogen during the wind power output surplus time, and then the SOFC generates electricity and heat to lower the CHP output, so the carbon emissions are reduced. It can be seen that Scenario 1 is able to achieve the benefit of improving the system’s wind power consumption capacity while promoting low carbon emissions reduction and reducing the total costs.
3.3. Analysis of the Effect of Adjustable Thermoelectric Ratio
The scheduling results for Scenario 1 and Scenario 4 are shown in
Table 7. As shown in
Table 7, Scenario 1 lowers the emissions by 271.2 kg, or 5.97%, compared to Scenario 4, and the total cost decreases by 7.5%.
Figure 7 and
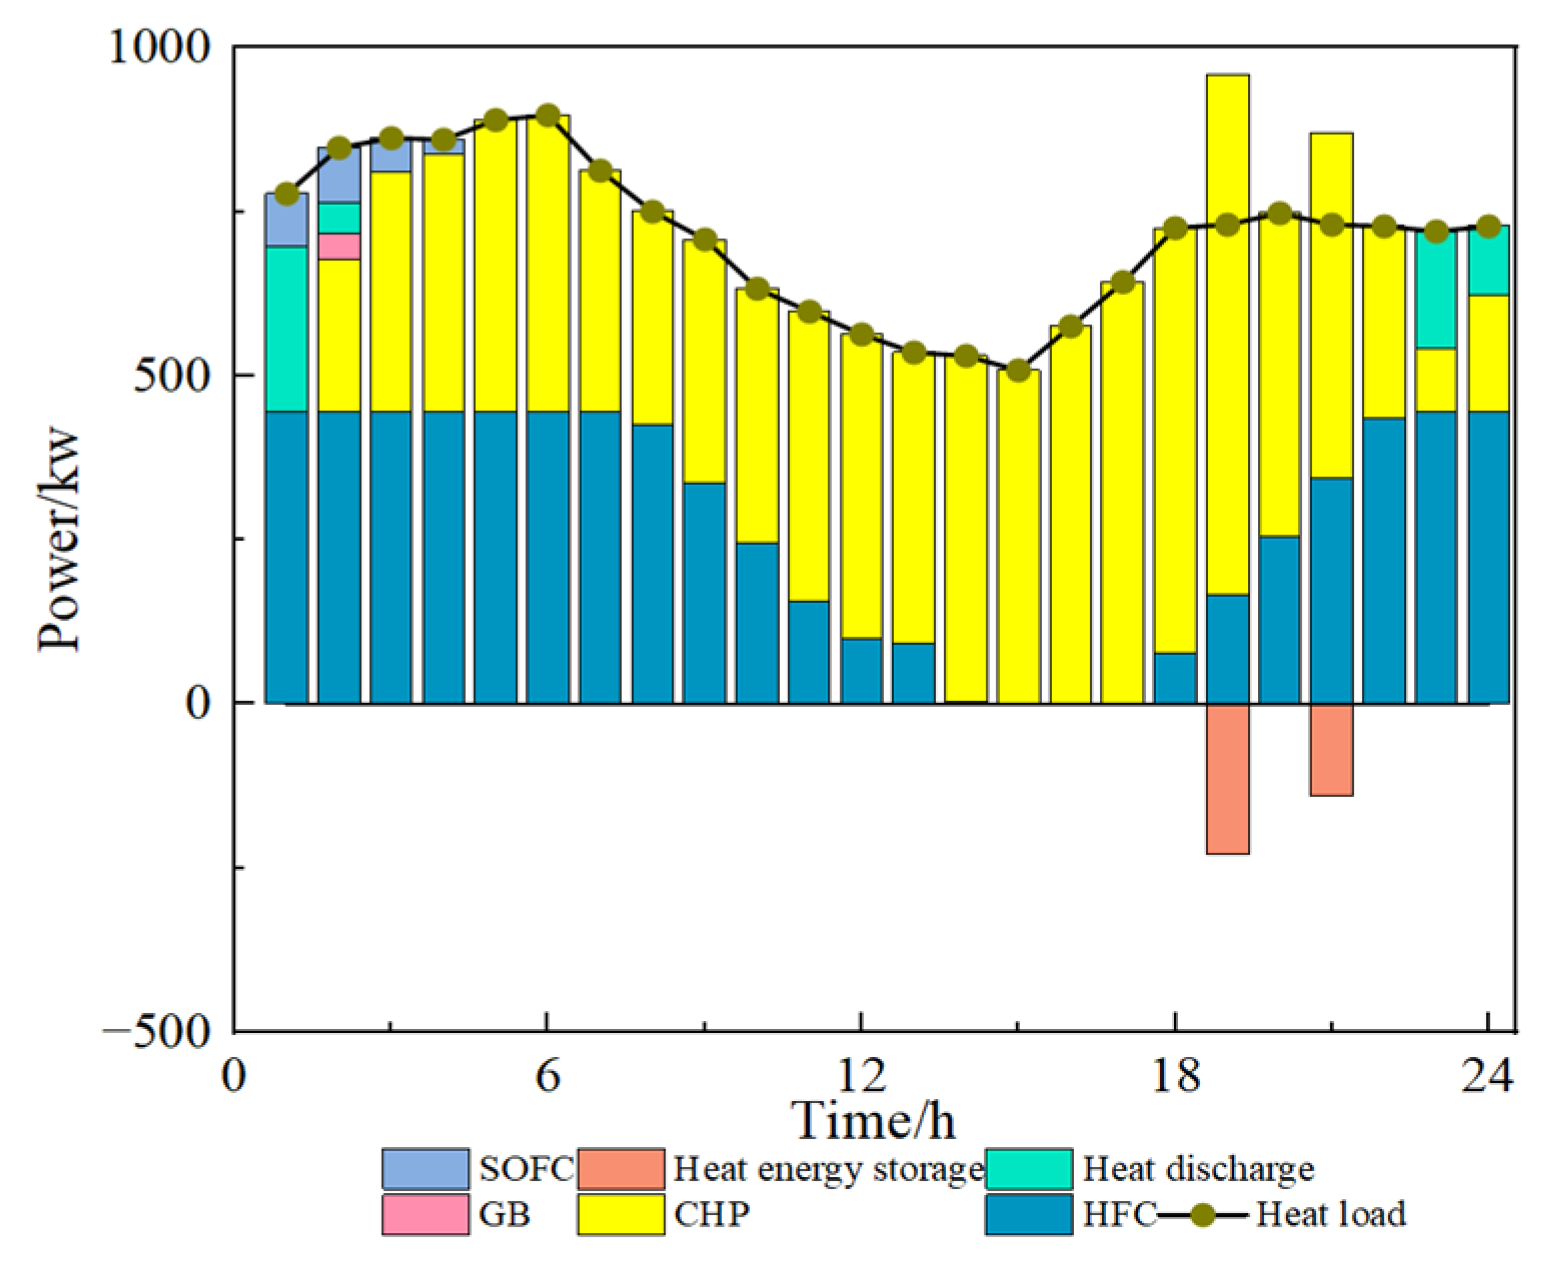
Figure 8 illustrate the internal heat power balance of the system for the two scenarios,
Figure 9 illustrates the internal electricity power balance of the system for Scenario 4, and
Figure 10 illustrates the thermoelectric ratio of the CHP for each time period.
From
Figure 7 and
Figure 10, it can be seen that the heat load is at peak at nighttime, and most of the heat load is supplied by CHP, and the shortfall is supplied by GB, SOFC, and heat discharge. The thermoelectric ratio of CHP reaches the maximum at nighttime because the wind power output is at peak at nighttime, while the system load is in the trough period, and the system can satisfy most of the electricity demand by consuming the wind power in this period, so the CHP is in the state of generating more heat to make up for the shortage of the system heat load in this period. During the daytime, the heat load is in the trough, the electricity load is in the peak, and the price of electricity is higher at this time, so CHP is in the state of generating more electricity in this period, and the thermoelectric ratio reaches the minimum.
The CHP in Scenario 4 has a constant thermoelectric ratio, so the ratio of its thermoelectric output is a certain value at any time period. During the early hours of the night, the heat power output from the CHP with a constant thermoelectric ratio is not sufficient to meet the system load demand, so the heat power output from the GB in Scenario 4 is greater than that in Scenario 1, in order to meet the system heat load but the carbon emissions is also increased as a result. During the daytime hours, the electricity output from CHP is also insufficient to meet the system load demand and, from
Figure 9, it can be seen that the system also needs to purchase electricity from the higher level to meet the electricity load and, therefore, the cost of purchasing energy will also be increased.
3.4. Analysis of the Effects of Two-Stage P2G
The scheduling results for Scenario 1 and Scenario 5 are shown in
Table 8. As shown in
Table 8, Scenario 1 lowers the carbon emissions by 1282 kg, or 23.07%, compared to Scenario 5, and the total costs decrease by 14.5%.
Table 9 and
Table 10 illustrate the internal hydrogen power and heat power for Scenario 5.
The EL and SOEC in Scenario 1 consume all the wind power for hydrogen production. According to
Figure 5, it can be seen that part of the hydrogen energy is stored, most of it is consumed by HFC and MR with high conversion efficiency to generate CHP, and a small portion of it is used by SOFC to make up the system deficit. Compared to Scenario 1, Scenario 5 lacks the HFC equipment, and the conversion efficiency of SOFC is lower than that of CHP, so most of the hydrogen energy is fed to MR, which then absorbs CO
2 and converts it to natural gas, which is fed to CHP and GB to finally generate heat and electricity. Although MR absorbs CO
2 in this process, it can be seen from
Table 10 that CHP is in a high carbon emissions state at this time and the CO
2 released is still higher than that absorbed by MR. Therefore, Scenario 1 has better emissions reduction than Scenario 5. In Scenario 1, hydrogen energy will be directly passed through the zero-emission HFC for heat and electricity production, which reduces the output of GB and CHP, so the carbon emissions are also reduced significantly.
3.5. Limitations of the Study
This study ignores the uncertainty of wind power energy, which is set to a certain value and the efficiency of the energy conversion equipment will not reach the expected efficiency in actual operation and may be slightly lower than the assumed value.
This method ignores the maintenance and installation costs of each energy conversion equipment, especially the relatively high cost of storing hydrogen, which increases the investment and operating costs of the system when compressed or liquefied hydrogen is used for storage.
3.6. Implications of the Study
This model can influence decision making in the energy sector in a number of ways, including the following:
Energy transition strategy: The adoption of the model will drive the energy sector towards a more sustainable and cleaner direction. By converting renewable energy sources into hydrogen storage, an effective coupling of electricity and hydrogen is realized. This is in line with the energy transition strategies of several countries and regions, such as reducing carbon emissions and increasing the share of renewable energy.
Energy storage and peaking: This is important to address the high volatility and intermittency of renewable energy sources and to support decision making in the energy sector with regard to energy storage and peaking.
Technological innovation and industrial development: The application of the model will promote technological innovation and industrial development in a number of areas, including P2G technology, CHP technology, and hydrogen storage technology. The energy sector can promote the development of this field by supporting relevant technology and industrial policies.
4. Conclusions
A multi-energy coupled IES low-carbon optimization strategy with hydrogen-containing energy storage and two-stage P2G-adjustable thermoelectric ratio CHP joint operation is proposed, and the following conclusions are drawn from the analyses of the arithmetic examples:
- (1)
The ladder-type carbon trading mechanism limits the carbon emissions of the system to a certain extent and slows down the carbon reduction of the system when the carbon trading base price is greater than 0.056 USD/kg.
- (2)
The addition of a hydrogen energy storage system can make up for the shortage of system electricity through electricity–hydrogen coupling during the wind power output surplus time, which improves the system’s wind power consumption capacity by 4.6%, and the SOEC converts the excess electricity into hydrogen during the wind power output surplus time, and then the SOFC generates electricity and heat to lower the CHP output, so the carbon emissions are reduced.
- (3)
In the joint operation of two-stage P2G with adjustable thermoelectric ratio CHP, the two-stage P2G adds HFC equipment, which directly converts hydrogen energy generated by EL into electricity and heat, reducing CHP output, and the CHP with adjustable thermoelectric ratio adjusts the ratio of heat and electricity output according to the current demand and conditions to minimize the operating cost. In this study, it is possible to reduce the operating costs by 14.5% and 7.5%, respectively.
This paper identifies wind power as a certain value, and subsequent studies can consider the uncertainty of wind power on the basis of this study. In addition, for the hydrogen storage aspect of the technology, future research could focus on the development of new materials and technologies to improve hydrogen storage efficiency, reduce costs, and improve storage safety. We can also further investigate how to integrate the coupled electro-thermal hydrogen model with other energy systems, such as co-ordination with smart grids, energy storage systems, and electric vehicle charging facilities. Such integration could help uncover system interactions and optimize overall system performance.
